prepared for the eco advisers meeting february 2, 2011 national data on child outcomes: are we there...
Post on 19-Dec-2015
215 views
TRANSCRIPT

Prepared for the ECO Advisers MeetingFebruary 2, 2011
National Data on Child Outcomes:Are We There Yet?

Computing national numbers
2Early Childhood Outcomes Center
• Department of Education needs national numbers for GPRA for Part C and Part B preschool
• Ideally, we would add up the numbers from each of the states and get the national numbers but….

• States are in various stages with regard to building their child outcomes measurement systems
• Some phrased in• Some changed approaches
3Early Childhood Outcomes Center
Child Outcomes: What we know
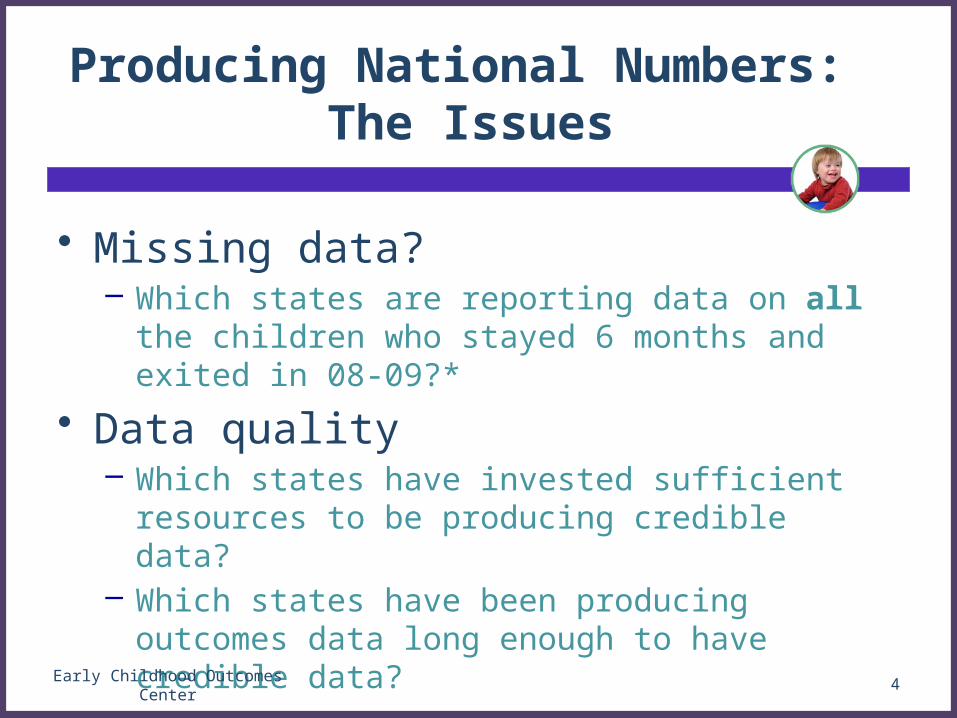
Producing National Numbers: The Issues
• Missing data?– Which states are reporting data on all the children
who stayed 6 months and exited in 08-09?*
• Data quality– Which states have invested sufficient resources to be
producing credible data? – Which states have been producing outcomes data
long enough to have credible data?
*A very few states are sampling.
4Early Childhood Outcomes Center

Missing/Incomplete Data: Part C
5Early Childhood Outcomes Center
St. N for Outcomes Data Exiters
N for outcomes/
Exiters
A 473 14962 3.2%B 797 4160 19.2%C 389 1225 31.8%D 3014 5529 54.5%E 1765 2457 71.8%
Aver=35.7%; 31 Sts. > 33%

Missing/Incomplete Data: Part B Preschool
6Early Childhood Outcomes Center
St. N for Outcomes Data Child Count
N for outcomes/child count
A 1230 33796 3.6%B 693 5944 11.7%C 9967 36997 26.9%D 953 3083 30.9%E 2348 6170 38.1%
Aver= 21.1%; 22 Sts. > 25%

Data Quality: Outliers
7Early Childhood Outcomes Center
• Some data quality issues are obvious• States whose data look VERY different
from other states or from what would be expected.

What would we expect?
8Early Childhood Outcomes Center
1 2 3 4 5 6 7 8 9 10111213141516171819202122232425262728293031323334353637383940414243444546474849500
10
20
30
40
50
60
70
Part C: Variation in Category a, Outcome 1
%
What would we expect?
9Early Childhood Outcomes Center
1 2 3 4 5 6 7 8 9 1011121314151617181920212223242526272829303132333435363738394041424344454647480
2
4
6
8
10
12
14
16
18
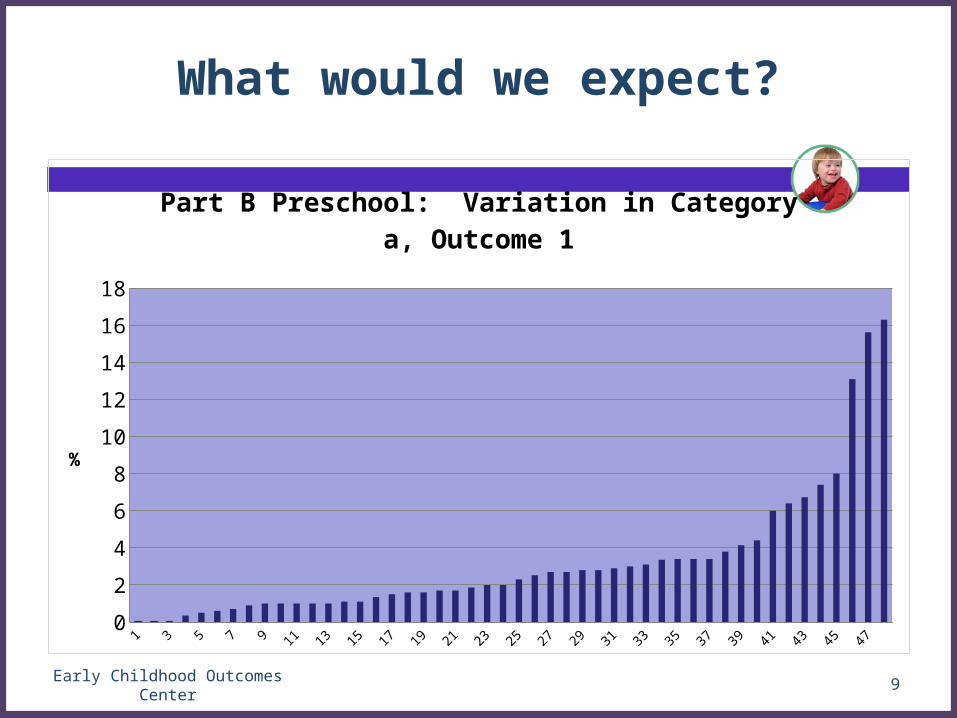
Part B Preschool: Variation in Category a, Outcome 1
%

What would we expect?
10Early Childhood Outcomes Center
1 2 3 4 5 6 7 8 9 10111213141516171819202122232425262728293031323334353637383940414243444546474849500
10
20
30
40
50
60
70
80
90
Part C: Variation in Category e, Outcome 3
%

What would we expect?
11Early Childhood Outcomes Center
1 2 3 4 5 6 7 8 9 101112131415161718192021222324252627282930313233343536373839404142434445464748490
10
20
30
40
50
60
70
80
Part B, Preschool: Variation in Category e, Outcome 3
%

Producing National Estimates
1. Divide the states into those with large, medium, and small child counts.
2. Identify the states that appear to have the best data.
3. Weight by child count and calculate the overall OSEP percentages using the “best data” states in each category.
4. Use the OSEP percents and total child count for each category to get the national estimates.
12Early Childhood Outcomes Center

1. Divide the states into those with large, medium, and small child counts.
Size of Child Count States
Large CA, NY, PA…..
Medium TN, CO, AZ…
Small MT, ND, DE…..
13Early Childhood Outcomes Center

How Weighting Works
STATES w/USEABLE DATA
a %
b % c % d % e % Child Count New # for e
A 30 2000 600
B 25 2400 600
C 20 1500 300
D 30 3000 1000
E 33 2400 800
Total 11,300 3,300
Re-calculated a-e for this set of states 29.2%
14Early Childhood Outcomes Center

And now the results….
15Early Childhood Outcomes Center

Early Childhood Outcomes Center 16
Social relationships Knowledge and skills Action to meet needs
a 0.0143730136009826 0.0124474054770759 0.0131761646579198
b 0.183678825752627 0.185944487663541 0.173193571944076
c 0.188311648421339 0.262592638474375 0.209481409971409
d 0.27852739026984 0.373137636903974 0.381377168316407
e 0.333754551954409 0.165551629845276 0.223665200836212
2%
7%
13%
18%
22%
28%
33%
38%
Estimated National Data for Part C, 2008-09
a b c d eNote: Analysis based on data from 19 states. Data were weighted by child count to represent the
nation.

Early Childhood Outcomes Center 17
Social relationships Knowledge and skills Action to meet needs
SS1 0.70212880655543 0.762154872957191 0.760212368706077
SS2 0.612281942224249 0.53868926674925 0.605042369152619
10%
30%
50%
70%
90%
Estimated National Summary Statement Percentages for Part C, 2008-09
SS1 SS2
Note: Analysis based on data from 19 states. Data were weighted by child count to represent the nation.

18Early Childhood Outcomes Center
Social relationships Knowledge and skills Action to meet needs
a 0.0210844051914582 0.0200865576307823 0.0182428548310239
b 0.110216538025396 0.125197632751051 0.108086858254496
c 0.281600989617383 0.343536515079644 0.20192740190408
d 0.344638218649213 0.348854372349416 0.359965753500246
e 0.24232755457146 0.163049961024247 0.311662298418317
-3%
2%
7%
12%
17%
22%
27%
32%
38%
Estimated National Data for Part B Preschool, 2008-09
a b c d e
Note: Analysis based on data from 15 states. Data were weighted by child count to represent the nation.
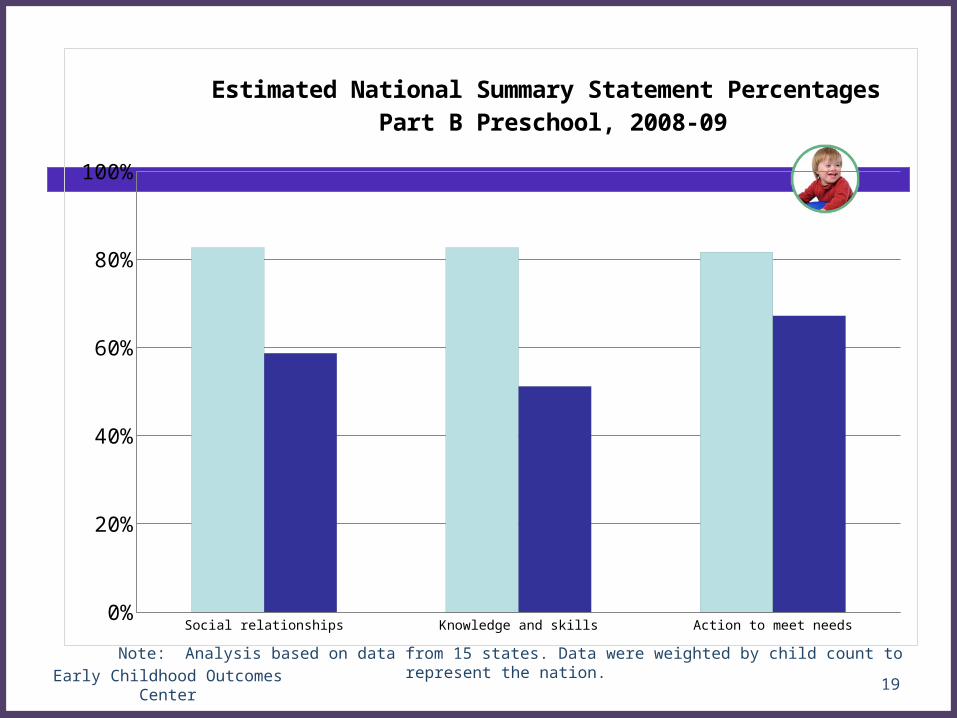
19Early Childhood Outcomes Center
Social relationships Knowledge and skills Action to meet needs
SS1 0.826674608653106 0.826562596607856 0.816440692587384
SS2 0.586965773220674 0.511904333373663 0.671628051918563
10%
30%
50%
70%
90%
Estimated National Summary Statement Percentages Part B Preschool, 2008-09
Note: Analysis based on data from 15 states. Data were weighted by child count to represent the nation.
How trustworthy are these numbers?
• One possible test: What do we get when we compare this method with other methods for calculating the national numbers?
20Early Childhood Outcomes Center

3 Approaches to National Numbers
1. Use data from states with the best data (least missing, not an outlier on “a” or “e”). Weight their data to represent states of similar size.*
2. Use data from all states. Average across the percentages. Each state weighted as one.
3. Use data from all the states. Weight each state according to their child count.
*We did this twice with a smaller set of states and a slightly larger set.
21Early Childhood Outcomes Center

Comparing the three methods
• See handout
22Early Childhood Outcomes Center

Our Questions for You
• What do these data say to you about the outcomes of Part C and Part B Preschool?
• What method makes the most sense for generating the calculations?
• What would you use as indicators that the national data are valid and meaningful?
• When would you trust the data?– When all (most?) states can demonstrate valid data?– When the alternate methods converge more closely?
23Early Childhood Outcomes Center