prepared by maida fetahagić - undp
TRANSCRIPT
1
ANNEX 1: Human Development Indicators for Bosnia & Herzegovina
Prepared by Maida Fetahagić
Sarajevo, April 2013

2
TABLE OF CONTENTS
1 Introduction ................................................................................................................................. 2
2 Improving the measurement of Human Development ............................................................... 3
2.1 The Human Development Index: HDI.................................................................................... 3
2.2 The Inequality-adjusted Human Development Index: IHDI .................................................. 4
2.3 The Gender Inequality Index: GII .......................................................................................... 4
2.4 The Multidimensional Poverty Index: MPI ............................................................................ 4
3 Position of B&H in relation to HDI ............................................................................................... 6
3.1 Position of B&H in relation to HDI at global level ................................................................. 6
3.2 Position of B&H in relation to HDI in Central and Eastern Europe Countries ....................... 7
4 Position of B&H by the Inequality-adjusted Human Development Index (IHDI) ......................... 9
4.1 Position of B&H by IHDI at the global level ........................................................................... 9
4.2 Position of B&H by IHDI in the Central and Eastern Europe Countries .............................. 10
5 Position of B&H by Gender Inequality Index (GII) globally and in the CEE ................................ 13
6 Human Development trends globally and in CEE countries ...................................................... 14
7 Position of B&H by Multidimensional Poverty Index (MPI) in the CEE ..................................... 15
8 Conclusions ................................................................................................................................ 18
References.......................................................................................................................................... 20
1 Introduction In the HDR 2013 Bosnia and Herzegovina holds the 81st position, with the achieved HDI of 0.735, and belongs to the group of countries with high human development. But, what does this mean? What position does B&H take in the world? What position does B&H take in relation to the surrounding countries in terms of human development indicators? What kind of human development trends have been present in relation to the Central and East Europe countries?
The context of the CEE countries considered in this annex involves the following countries:
- EU member states: Slovenia, Slovakia, Bulgaria, Romania, Czech Republic, Hungary, Poland
- Candidates for the EU: Croatia, FYR Macedonia, Montenegro and Serbia
- Potential candidates: Albania and Bosnia and Herzegovina.
The position of Bosnia and Herzegovina in the context of human development will be determined by an analysis of B&H's position in terms of human development indicators: Human Development Index, Inequality-adjusted Human Development Index, Gender Inequality Index and Multidimensional Poverty Index for 2012.
The latest HDR 2013 covers 186 countries, classification of which was carried out according to human development index (HDI) achieved, using new methodology and new indices.

3
2 Improving the measurement of Human Development The Human Development Report 20101 marks 20 years of human development concept and promotes new indicators, which introduce new aspects of inequality adjustments, gender inequality and multidimensional measurement of poverty.
2.1 The Human Development Index: HDI Human Development Index is a result of the search for a common measure for economic and social development. This is a contribution to quantification of the entire socio-economic aspect of progress, referring to achievements of a country in fundamental human development dimensions.
Human Development Index includes three fundamental human development dimensions, which refer to the capabilities that people expect to achieve. Those are the following:
- Life expectancy is achieved by the capability to live a long and healthy life,
- The achieved education is realized by the capability to acquire knowledge.
- The achieved living standard is realized by the capability to provide decent income for life.
Changes introduced in HDR 2010 refer to the choice of dimension indicators, transformation in the calculation of dimension index, as well as aggregation method; GNI/pc is used instead of GDP/pc.
Table 1. Summary review of human development reforms
Dimension
Until 2010 From 2010
Indicator Maximum Minimum
Indicator
Observed maximum
Minimum
Transformation Transformation
Long and healthy life
Life expectancy
85 25 Life expectancy 83.4
(Japan, 2011) 20
Knowledge
Adult literacy rate
100 0 Expected years
of schooling 18.0
(capped at) 0
Combined gross
enrolment ratio
100 0 Mean years of
schooling
13.1 (Czech Republic,
2005) 0
A decent standard of
living
GDP/pc (PPP US$)
40.000 100 GNP/pc
(PPP US$) 107.721
(Qatar, 2011)
100
Aggregation methods
Arithmetic mean Geometric mean
Source: adapted from HDR 2010; observed maximum and minimum from HDR 2011.p. 168.
HDR uses the data of the world’s leading institutions and a special study was conducted for evaluation of average years of education.2 Indicators were calculated using new methodology for 1 UNDP (2010): Human Development Report 2010, The Real Wealth of Nations: Pathways to Human Development, Palgrive
Macmillan, New York 2 Sources of data: Life expectancy at birth: UNDESA (2009d); Average years of schooling: special study by Barro and
Lee (2010) available on: http://www.nber.org/papers/w15902; Expected years of schooling: UNESCO Institute for
Statistics (2010a); GNP/pc: World Bank (2010g) and IMF (2010a).

4
2010, as well as the one from 1980. This ensured the comparison of data between countries, as well as the observation of trends. HDI calculation for B&H was carried out for the period 2005 – 2012.
2.2 The Inequality-adjusted Human Development Index: IHDI The Inequality-adjusted Human Development Index - IHDI is a new composite index promoted in HDR 2010. IHDI actually takes into account the inequalities in all three HDI dimensions, thus reducing the value of human development index by the “loss”, i.e. the value of inequality. It can be concluded that HDI refers to potential level of human development, while IHDI refers to real level of human development. HDI refers to capabilities, choices, whereas IHDI refers to functionalities used in distribution of choices and capabilities within the population. Ideal situation is for these two indices to be equal; however, taking into account the losses in distribution of HDI components (income, education, health), IHDI is lower than HDI. The difference, i.e. the loss in human development due to inequality between HDI and IHDI is expressed in percentage.
2.3 The Gender Inequality Index: GII Human development has been dealing with inequalities in the capabilities of women and men since the very beginning. Today, there is a need for a broader study of gender inequalities in economic, political and social situation in the contemporary world.
HDR 20103 introduces a new index, Gender Inequality Index – GII. It was calculated for 138 countries (not for B&H). It reflects the position of women in terms of reproductive health, empowerment and economic activity and refers to a “loss” in human development, due to gender inequality in all three dimensions. Indicators used for calculation of GII are presented in the Table below.
Table 2: Indicators for calculation of GII
Dimension Indicators
Health maternal mortality rate, adolescent fertility rate (age of 15 - 19)
Empowerment female and male inhabitants with high-school education at least, participation of women and men in allocation of seats at the parliament
Labour market rate of men and women participating in labour force
Source: adapted, HDR 2010, p. 215.
2.4 The Multidimensional Poverty Index: MPI In the context of human development, poverty is more than deprivation; poverty implies deprivation from the capabilities and choices of human development, i.e. having a long, healthy, creative life, certain standard of living, freedom, dignity, self-respect and respect towards others, etc. Poverty is much more than what is needed for material well-being.
3 HDR 1995 introduced Gender Related Development Index – GDI, as a measure of gender inequality; Gender
Empowerment Index was introduced at a later stage for the evaluation of the progress of women in economic and
political life.

5
HDR 2010 promotes a new composite index - the Multidimensional Poverty Index – MPI, which replaces the previous HPI indices. MPI identifies multiple deprivations of households in all three dimensions of human development – in the field of education, health and living standard. All data necessary for calculation of MPI are taken from the same study. Ten indicators are used for the calculation of MPI, and deprivation is calculated for given dimensions. Each dimension is equally weighted; each indicator within a dimension is also equally weighted.4
Table 3: Indicators for calculation of MPI
Dimension Indicators
Education years of schooling, enrolment of children to school
Health nutrition, mortality of children
Standard of living electricity, sanitary conditions, drinking water, residence, cooking means, property
Source: adapted, HDR 2010, p. 215.
The MPI reflects both the incidence and headcount ratio (H) of poverty – the proportion of the population that is multidimensional poor – and the average intensity (A) of their poverty – the average proportion of indicators in which poor people are deprived. The MPI is calculated by multiplying the incidence of poverty by the average intensity across the poor (H*A). A person is identified as poor if he or she is deprived in at least one third of the weighted indicators.
HDR 2013 calculated MPI for 104 countries in development, with the population of about 5.4 billion people, which is 78% the world’s population. More than 30% of the population or 1.6 billion people live in multidimensional poverty, according to MPI. Over a half of the population (51%) lives in South Asia and the highest poverty rates were registered in Sub-Saharan Africa with 29% of the population.5 At the same time, about 22.5% (1.21 billion) of the combined populations of the 104 countries analysed, lives with less than 1.25 $ a day, while the overall number of inhabitants living with less than 2$ a day is about 2.4 billion or 44%.6
4 About methodology MPI, see more details in:
Alkire, S. and Santos, M.E. (2010), Acute Multidimensional Poverty: A New Index for Developing Countries, UNDP
HDR Human Development Research Paper 2010/11 and
Alikire, S., J.M. Roche, M.E. Santos, and S.Seth (2011), Multidimensional Poverty Index: New Results, Time
Comparisons and Group Disparities, UNDP HDR Human Development Research Paper
5 Alkire, S., J.M. Roche, M.E. Santos, and S. Seth., March 2013.“Multidimensional Poverty Index 2013,” University of
Oxford, Oxford Poverty and Human Development Initiative, Oxford, UK, available at
www.ophi.org.uk/multidimensional-poverty-index/mpi-2013/ 6 Estimated by Maida Fetahagić based on the Alkire, S., J.M. Roche, M.E. Santos, and S. Seth., March
2013.“Multidimensional Poverty Index 2013 - Table 1.4 MPI results and other estimates of inequality, poverty and
wellbeing”, University of Oxford, Oxford Poverty and Human Development Initiative, Oxford, UK, available at
www.ophi.org.uk/multidimensional-poverty-index/mpi-data-bank/mpi-data/

6
3 Position of B&H in relation to HDI
3.1 Position of B&H in relation to HDI at global level
According to the achieved HDI in the value of 0.735, Bosnia and Herzegovina holds the 81st
position in the world and belongs to a group of countries with high human development. At the
same time, it is above the average HDI in the world by 5, 9%.
Table 4: Position of Bosnia and Herzegovina Globally in terms of Human Development, 2012
Countries grouping, country HDI
value
Life expectancy
at birth (years)
Mean years of
schooling (years)
Expected years of
schooling (years)
GNI/pc (Constant PPP 2005
$) Nonincome HDI value
Very high human development
0.905 80.1 11.5 16.3 33,391 0.927
High human development 0.758 73.4 8.8 13.9 11,501 0.781
Medium human development 0.640 69.9 6.3 11.4 5,428 0.661
Low human development 0.466 59.1 4.2 8.5 1,633 0.487
Norway 0.955 81.3 12.6 17.5 48,688 0.977
Niger 0.304 55.1 1.4 4.9 701 0.313
World – average 0.694 70.1 7.5 11.6 10,184 0.690
Bosnia and Herzegovina 0.735 75.8 8.3 13.4 7,713 0.787
Relative level of Bosnia and Herzegovina, B&H = 1.00
Very high human development 1.231 1.057 1.384 1.212 4.329 1.178
High human development 1.031 0.968 1.063 1.034 1.491 0.993
Medium human development 0.870 0.922 0.758 0.850 0.704 0.840
Low human development 0.635 0.779 0.510 0.632 0.212 0.619
Norway 1.299 1.072 1.517 1.300 6.313 1.241
Niger 0.414 0.726 0.173 0.366 0.091 0.398
World – average 0.944 0.924 0.900 0.862 1.320 0.877
Source: HDR 2013, p. 144.
Norway, with the highest achieved HDI, is above B&H by 30%, and the group of countries with very high human development is above B&H by 23%. The average achieved HDI in the world is lower than that of B&H by 6%. The most undeveloped, Niger, is below the development of B&H by 59%.

7
Life expectancy, average years of education and expected of years of education in B&H are
expectedly higher than the average achieved in the world.
3.2 Position of B&H in relation to HDI in Central and Eastern Europe Countries
According to the achieved HDI, six countries (Slovenia, Slovakia, Czech Republic, Hungary, Poland and Croatia) are the countries with very high development; Slovenia holds the 21st position and Croatia the 47th, in relation to HDI rank. Other CEE countries belong to the countries with high development in the context of human development.
Table 5. Position of B&H in Central and East Europe Countries according to HDI, 2012
HD
I ran
k
Country HDI value
Life expectancy
at birth Mean years of schooling
Expected years of
schooling
GNI/pc (PPP 2008
$) Nonincome HDI value
70 Albania 0.749 77.1 10.4 11.4 7,822 0.807
81 B&H 0.735 75.8 8.3 13.4 7,713 0.787
57 Bulgaria 0.782 73.6 10.6 14.0 11,474 0.826
28 Czech Republic 0.873 77.8 12.3 15.3 22,067 0.913
47 Croatia 0.805 76.8 9.8 14.1 15,419 0.837
77 FYR Macedonia 0.740 75.0 8.2 13.4 9,377 0.777
37 Hungary 0.831 74.6 11.7 15.3 16,088 0.874
52 Montenegro 0.791 74.8 10.5 15.0 10,471 0.850
39 Poland 0.821 76.3 10.0 15.2 17,776 0.851
56 Romania 0.786 74.2 10.4 14.5 11,011 0.836
64 Serbia 0.769 74.7 10.2 13.6 9,533 0.823
35 Slovakia 0.840 75.6 11.6 14.7 19,696 0.872
21 Slovenia 0.892 79.5 11.7 16.9 23,999 0.936
Relative level of Bosnia and Herzegovina. B&H = 1.00
70 Albania 1.02 1.02 1.25 0.85 1.01 1.03
81 Bulgaria 1.06 0.97 1.27 1.04 1.49 1.05
57 Czech Republic 1.19 1.03 1.48 1.14 2.86 1.16
28 Croatia 1.09 1.01 1.18 1.05 2.00 1.06
47 FYR Macedonia 1.01 0.99 0.98 1.00 1.22 0.99
77 Hungary 1.13 0.98 1.40 1.14 2.09 1.11
However, the average
GNI/pc in the world is
higher by 32%, and more
than six times higher in
Norway than the average
GNP/pc in B&H. Countries
with high human
development, which
includes B&H, have
achieved GNI/pc higher than
the one achieved in B&H by
49%.

8
37 Montenegro 1.08 0.99 1.27 1.12 1.36 1.08
52 Poland 1.12 1.01 1.20 1.13 2.30 1.08
39 Romania 1.07 0.98 1.25 1.08 1.43 1.06
56 Serbia 1.05 0.98 1.23 1.01 1.24 1.05
64 Slovakia 1.14 1.00 1.39 1.09 2.55 1.11
35 Slovenia 1.21 1.05 1.41 1.25 3.11 1.19
Source: HDR 2013, p.144.
Among the CEE countries, Slovenia is the most developed in the context of human development, while Bosnia and Herzegovina achieved the lowest HDI of 0.735 and it holds the 81st position in the world, in relation to the HDI rank.
Expected years of education in B&H is higher than in Albania. Slovenia has the highest values of this indicator.
According to average years of education, B&H is at the bottom of the list, only Macedonia is lower.
According to the foreseen life expectancy at birth, B&H is located somewhere in the middle of the list and it seems that, according to this indicator, the population of the Balkans does not differ much mutually. Slovenia can be selected with the highest life expectancy of their inhabitants.
HDI structure indicates a critical point of B&H.
All CEE countries have achieved GNI/pc higher than the one achieved in B&H (Slovenia more than 3 times).
All CEE countries exceed the development of B&H in the context of human development (Slovenia by 21%, Czech Republic by 19%, Slovakia by 14%, Hungary by 13%, Poland by 12%, Croatia by 9%, Montenegro by 8%, Romania by 7%, Bulgaria by 6%, Serbia by 5%, Albania by2% and FYR Macedonia by1%).

9
4 Position of B&H by the Inequality-adjusted Human Development Index (IHDI)
4.1 Position of B&H by IHDI at the global level B&H loses 11.5% of the development, due to inequalities in distribution of the basic dimensions of human development. That is only 0.7% more than in relation to losses registered in the countries with very high development. Countries with high, medium and low development have higher losses in human development than B&H (those with medium development registered 24.2% and low development 33.5% of losses in the development process).
According to the structure of IHDI, the largest losses are present in the distribution of incomes (19.2%), as indicated by relatively high Gini coefficient (36.2).
Inequality-adjusted life expectancy at birth index shows that B&H has almost twice as higher losses as the countries with very high development.
Losses in education in B&H are lower as the ones registered in the countries with very high development.

10
Table 6. Position of B&H Globally according to the Inequality-adjusted Human Development Index (IHDI), 2012
Countries grouping, country
HDI IHDI Inequality-adjusted life expectancy at
birth index Inequality-adjusted
education index Inequality-adjusted
income index Gini
coefficient
Value Value Overall loss
(%) Value Loss (%) Value Loss (%) Value Loss (%)
2000-2011
Very high human development 0.905 0.807 10.8 0.897 5.2 0.851 6.8 0.688 19.8 ..
High human development 0.758 0.602 20.6 0.736 12.4 0.592 19.9 0.500 28.6 ..
Medium human development 0.640 0.485 24.2 0.633 19.3 0.395 30.2 0.456 22.7 ..
Low human development 0.466 0.310 33.5 0.395 35.7 0.246 38.7 0.307 25.6 ..
Norway 0.955 0.894 6.4 0.928 3.7 0.968 2.2 0.797 12.8 25.8
Niger 0.304 0.200 34.2 0.317 42.6 0.107 39.5 0.236 17.9 34.6
World – average 0.694 0.532 23.3 0.638 19.0 0.453 27.0 0.522 23.5 ..
Bosnia and Herzegovina 0.735 0.650 11.5 0.794 9.6 0.668 5.2 0.518 19.2 36.2
Relative level of Bosnia and Herzegovina, B&H = 1.00
Very high human development 1.23 1.24 0.94 1.13 0.54 1.27 1.30 1.33 1.03 ..
High human development 1.03 0.93 1.78 0.93 1.29 0.89 3.80 0.97 1.49 ..
Medium human development 0.87 0.75 2.10 0.80 2.01 0.59 5.76 0.88 1.18 ..
Low human development 0.63 0.48 2.91 0.50 3.72 0.37 7.38 0.59 1.33 ..
Norway 1.30 1.38 0.55 1.17 0.39 1.45 0.43 1.54 0.67 0.71
Niger 0.41 0.31 2.96 0.40 4.44 0.16 7.53 0.46 0.93 0.95
World – average 0.94 0.82 2.01 0.80 1.98 0.66 5.01 1.01 1.22 ..
Source: HDR 2013, p.152.
4.2 Position of B&H by IHDI in the Central and Eastern Europe Countries Among CEE countries, FYR Macedonia, Croatia, Albania, Romania and B&H have the largest losses in development, due to inequality of distribution of the basic dimensions of human development. The other countries have lower losses in development than B&H. The highest IHDI was registered in Slovenia, which also indicates the minimum multidimensional losses (5.8%).

11
Table 7. Position of B&H in CEE according to the Inequality-adjusted Human Development Index (IHDI), 2012
ran
k H
DI
Country
HDI IHDI Inequality-adjusted life
expectancy at birth index Inequality-adjusted
education index Inequality-adjusted
income index Gini
coefficient
Value Value Overall loss (%)
Value Loss (%) Value Loss (%) Value Loss (%) 2000-2011
70 Albania 0.749 0.645 13.9 0.797 11.2 0.640 11.9 0.526 18.3 34.5
81 B&H 0.735 0.650 11.5 0.794 9.6 0.668 5.2 0.518 19.2 36.2
57 Bulgaria 0.782 0.704 9.9 0.776 7.8 0.760 6.1 0.592 15.4 28.2
28 Czech Republic 0.873 0.826 5.4 0.874 3.9 0.904 1.3 0.712 10.7 ..
47 Croatia 0.805 0.683 15.1 0.845 5.5 0.703 10.4 0.537 27.8 33.7
77 FYR Macedonia 0.740 0.631 14.7 0.784 9.4 0.612 12.3 0.524 21.8 43.2
37 Hungary 0.831 0.769 7.4 0.810 5.7 0.854 4.1 0.658 12.2 31.2
52 Montenegro 0.791 0.733 7.4 0.803 6.8 0.817 2.5 0.600 12.6 30.0
39 Poland 0.821 0.740 9.9 0.834 5.8 0.767 6.3 0.634 17.1 34.1
56 Romania 0.786 0.687 12.6 0.770 9.6 0.779 5.0 0.540 22.2 30.0
64 Serbia 0.769 0.696 9.5 0.788 8.3 0.709 9.9 0.603 10.3 27.8
35 Slovakia 0.840 0.788 6.3 0.825 5.7 0.856 1.5 0.692 11.3 26.0
21 Slovenia 0.892 0.840 5.8 0.898 4.1 0.905 3.3 0.729 9.9 31.2
Relative level of Bosnia and Herzegovina, B&H = 1.00
70 Albania 1.02 0.99 1.20 1.00 1.17 0.96 2.27 1.01 0.95 0.95
81 Bulgaria 1.06 1.08 0.86 0.98 0.82 1.14 1.17 1.14 0.80 0.78
57 Czech Republic 1.19 1.27 0.47 1.10 0.41 1.35 0.25 1.37 0.56 ..
28 Croatia 1.09 1.05 1.31 1.06 0.57 1.05 1.98 1.04 1.45 0.93
47 FYR Macedonia 1.01 0.97 1.27 0.99 0.98 0.92 2.35 1.01 1.14 1.19
77 Hungary 1.13 1.18 0.64 1.02 0.60 1.28 0.78 1.27 0.64 0.86
37 Montenegro 1.08 1.13 0.64 1.01 0.71 1.22 0.48 1.16 0.65 0.83
52 Poland 1.12 1.14 0.86 1.05 0.60 1.15 1.21 1.22 0.89 0.94
39 Romania 1.07 1.06 1.09 0.97 1.00 1.17 0.96 1.04 1.16 0.83
56 Serbia 1.05 1.07 0.83 0.99 0.87 1.06 1.89 1.16 0.54 0.77
64 Slovakia 1.14 1.21 0.54 1.04 0.60 1.28 0.29 1.33 0.59 0.72
35 Slovenia 1.21 1.29 0.50 1.13 0.43 1.36 0.63 1.41 0.52 0.86

12
Source: HDR 2013, p.152.
13
The highest losses in the distribution of income were registered in Croatia, Romania, FYR Macedonia and B&H. All other counties have registered lower losses than B&H due to inequality of distribution of incomes.
FYR Macedonia, as well as Albania, has the highest losses, due to inequalities in education.
According to the inequality-adjusted life expectancy at birth index, losses in the health dimension vary from the lowest 4.1% in Slovenia to 11.2% in Albania. According to this dimension, only Albania has registered higher losses than B&H.
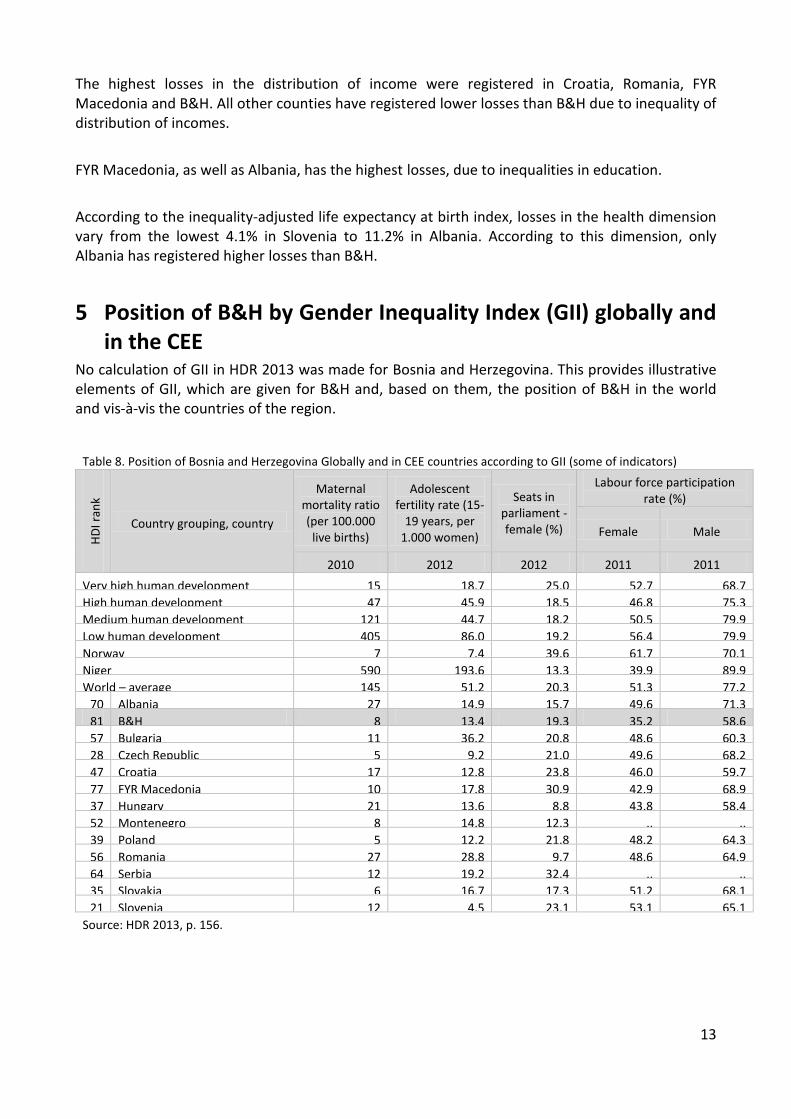
5 Position of B&H by Gender Inequality Index (GII) globally and in the CEE
No calculation of GII in HDR 2013 was made for Bosnia and Herzegovina. This provides illustrative elements of GII, which are given for B&H and, based on them, the position of B&H in the world and vis-à-vis the countries of the region.
Table 8. Position of Bosnia and Herzegovina Globally and in CEE countries according to GII (some of indicators)
HD
I ran
k
Country grouping, country
Maternal mortality ratio (per 100.000 live births)
Adolescent fertility rate (15-
19 years, per 1.000 women)
Seats in parliament - female (%)
Labour force participation rate (%)
Female Male
2010 2012 2012 2011 2011
Very high human development 15 18.7 25.0 52.7 68.7
High human development 47 45.9 18.5 46.8 75.3
Medium human development 121 44.7 18.2 50.5 79.9
Low human development 405 86.0 19.2 56.4 79.9
Norway 7 7.4 39.6 61.7 70.1
Niger 590 193.6 13.3 39.9 89.9
World – average 145 51.2 20.3 51.3 77.2
70 Albania 27 14.9 15.7 49.6 71.3
81 B&H 8 13.4 19.3 35.2 58.6
57 Bulgaria 11 36.2 20.8 48.6 60.3
28 Czech Republic 5 9.2 21.0 49.6 68.2
47 Croatia 17 12.8 23.8 46.0 59.7
77 FYR Macedonia 10 17.8 30.9 42.9 68.9
37 Hungary 21 13.6 8.8 43.8 58.4
52 Montenegro 8 14.8 12.3 .. ..
39 Poland 5 12.2 21.8 48.2 64.3
56 Romania 27 28.8 9.7 48.6 64.9
64 Serbia 12 19.2 32.4 .. ..
35 Slovakia 6 16.7 17.3 51.2 68.1
21 Slovenia 12 4.5 23.1 53.1 65.1
Source: HDR 2013, p. 156.
14
6 Human Development trends globally and in CEE countries Between 2005 and 2012, the HDI value in B&H increased from 0.724 to 0.735, which is an increase of 2%, just like it was the case of the HDI value in Croatia, Serbia and Slovenia. But, it is still less than increasing HDI in the world (4%), in low human development countries (10%), medium human development (9%) and in the high human development countries (5%).
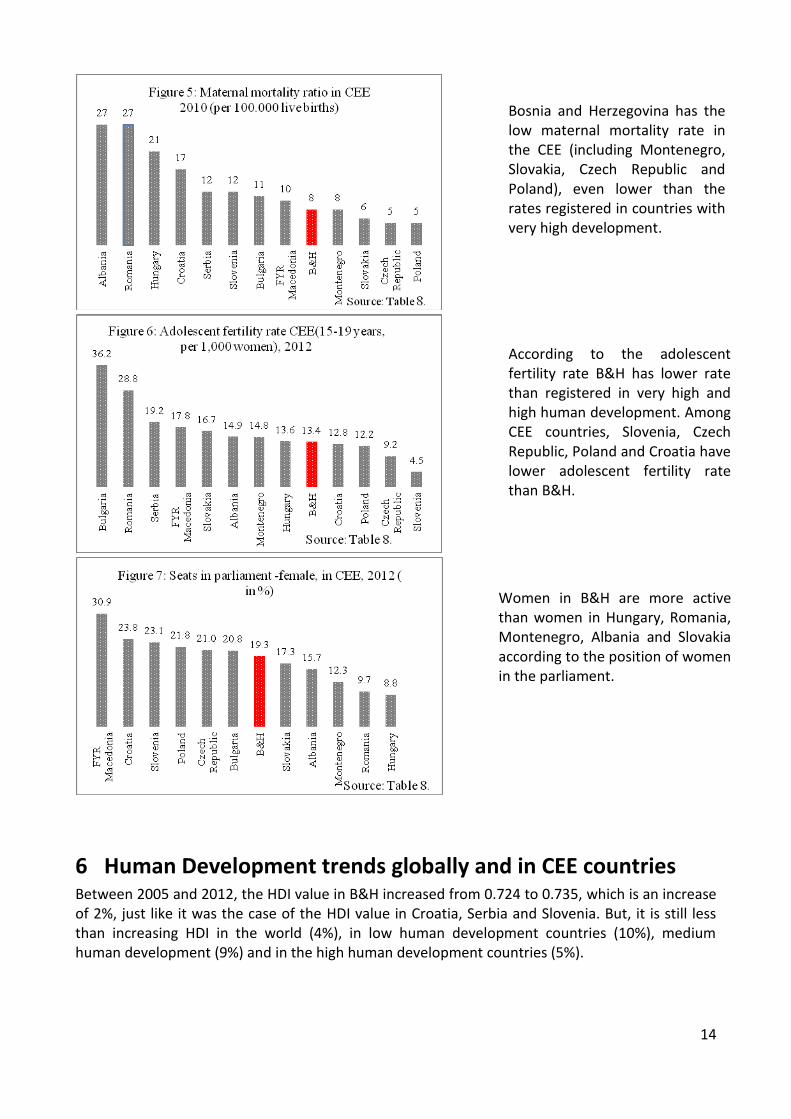
Bosnia and Herzegovina has the low maternal mortality rate in the CEE (including Montenegro, Slovakia, Czech Republic and Poland), even lower than the rates registered in countries with very high development.
According to the adolescent fertility rate B&H has lower rate than registered in very high and high human development. Among CEE countries, Slovenia, Czech Republic, Poland and Croatia have lower adolescent fertility rate than B&H.
Women in B&H are more active than women in Hungary, Romania, Montenegro, Albania and Slovakia according to the position of women in the parliament.

15
Table 9. HDI trends H
DI r
ank Countries
grouping, country 2005 2007 20010 2011 2012
2012/2005
Very high human HD 0.889 0.896 0.902 0.904 0.905 1.02
High human development 0.725 0.738 0.753 0.755 0.758 1.05
Medium HD 0.589 0.609 0.631 0.636 0.640 1.09
Low human development 0.424 0.442 0.461 0.464 0.466 1.10
World – average 0.666 0.678 0.690 0.692 0.694 1.04
70 Albania 0.729 0.737 0.746 0.748 0.749 1.03
81 B&H 0.724 0.729 0.733 0.734 0.735 1.02
57 Bulgaria 0.756 0.766 0.778 0.780 0.782 1.03
28 Czech Republic 0.862 0.869 0.871 0.872 0.873 1.01
47 Croatia 0.787 0.798 0.804 0.804 0.805 1.02
77 FYR Macedonia 0.711 0.719 0.736 0.738 0.740 1.04
37 Hungary 0.820 0.826 0.829 0.830 0.831 1.01
52 Montenegro 0.756 0.775 0.787 0.791 0.791 1.05
39 Poland 0.798 0.806 0.817 0.819 0.821 1.03
56 Romania 0.756 0.772 0.783 0.784 0.786 1.04
64 Serbia 0.751 0.760 0.767 0.769 0.769 1.02
35 Slovakia 0.814 0.830 0.836 0.838 0.840 1.03
21 Slovenia 0.876 0.888 0.892 0.892 0.892 1.02
Source: HDR 2013, p. 148.
7 Position of B&H by Multidimensional Poverty Index (MPI) in the CEE
According to multidimensional poverty index, amounting to 0.003, B&H belongs to the group of countries with low MPI (Figure 8.), along with Croatia, Hungary, Czech Republic, Macedonia, Montenegro and Albania have higher indices of MPI.

16
Table 10. Position of B&H in CEE countries according to the Multidimensional Poverty Index (MPI)
Ran
k H
DI
Ran
k M
PI
Country
MPI Population in multidimensional
poverty Population
vulnerable to poverty
(%)
Population in
severe poverty
(%)
Contribution of Deprivations to overall poverty in
Population below income poverty line
(2000-2009)
Year Value
MPI=H*A
Headcount Intensity of deprivation
(%) (A) (%) (H)
(000) Educatio
n (%) Health
(%)
Living standard
(%)
PPP $ 1, 25 a day
(%)
National poverty line
(%)
70 11 Albania 2008/2009 (D) 0.005 1.4 45 37.7 7.4 0.1 32.0 44.9 23.0 0.6 12.4
81 8 B&H 2006 (M) 0.003 0.8 30 37.2 7.0 0.1 29.2 51.8 19.0 0.0 14.0
57 Bulgaria .. .. .. .. .. .. .. .. .. .. 1.0 12.8
28 23 Czech Republic 2002/2003 (W) 0.010 3.1 316 33.4 0.0 0.0 0.0 99.9 0.1 .. ..
47 29 Croatia 2003 (W) 0.016 4.4 196 36.3 0.1 0.3 45.0 46.7 8.3 0.1 11.1
77 19 FYR Macedonia
2005 (M) 0.008 1.9 39 40.9 6.7 0.3 59.9 12.8 27.3 0.0 19.0
37 29 Hungary 2003 (W) 0.016 4.6 466 34.3 0.0 0.0 1.8 95.6 2.7 0.2 ..
52 16 Montenegro
2005/2006 (M) 0.006 1.5 9 41.6 1.9 0.3 37.5 47.6 14.9 0.1 6.6
39 Poland .. .. .. .. .. .. .. .. .. .. 0.0 16.6
56 Romania .. .. .. .. .. .. .. .. .. .. 0.5 13.8
64 9 Serbia 2005/2006 (M) 0.003 0.8 79 40.0 3.6 0.1 30.5 40.1 29.4 0.3 9.2
35 1 Slovakia 2003 (W) 0.000 0.0 0 0.0 0.0 0.0 0.0 0.0 0.0 0.1 ..
21 2 Slovenia 2003 (W) 0.000 0.0 0 0.0 0.4 0.0 0.0 0.0 0.0 0.1 ..
Source: HDR 2013, p. 160.;Column: Rank MPI – estimated according to the: Alkire, S., J.M. Roche, M.E. Santos, and S. Seth., March 2013.“Multidimensional Poverty Index 2013 - Table 1.4 MPI results and other estimates of inequality, poverty and wellbeing”, University of Oxford, Oxford Poverty and Human Development Initiative, Oxford, UK, available at www.ophi.org.uk/multidimensional-poverty-index/mpi-data-bank/mpi-data/
In Column MPI Year: D indicates data from Demographic and Health Surveys; M indicates data from Multiple Indicator Cluster Surveys and W indicates data from World Health Surveys
17
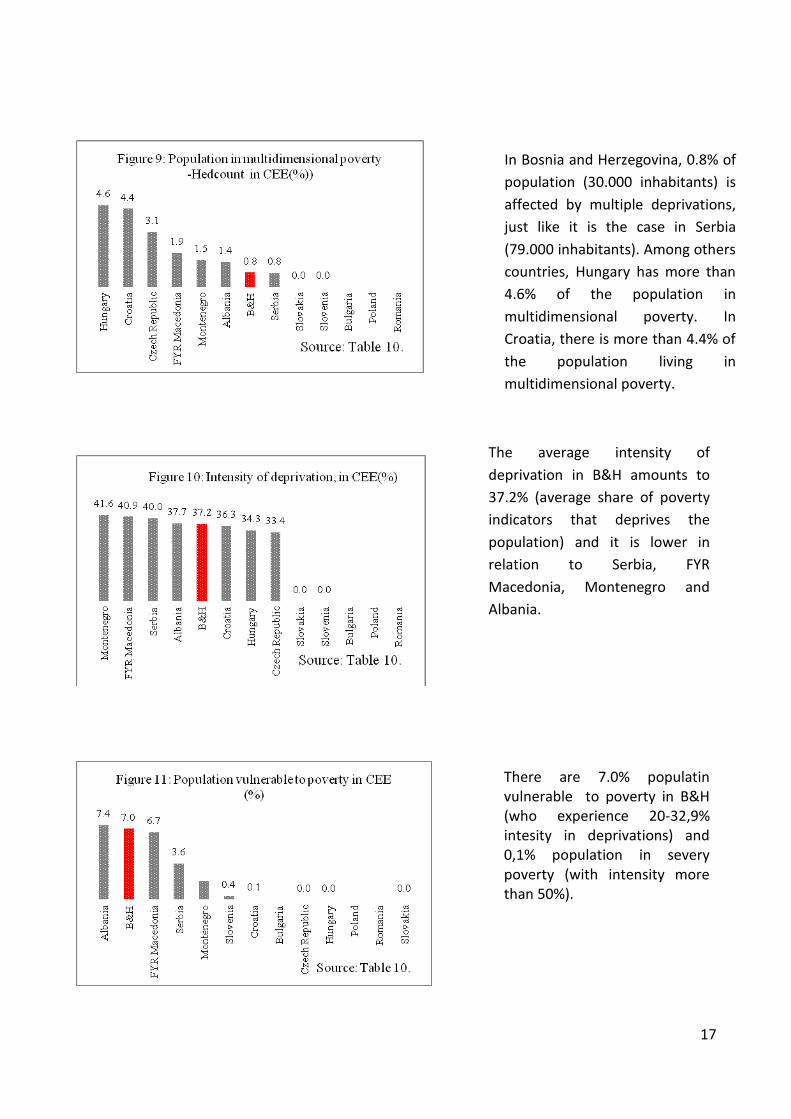
In Bosnia and Herzegovina, 0.8% of
population (30.000 inhabitants) is
affected by multiple deprivations,
just like it is the case in Serbia
(79.000 inhabitants). Among others
countries, Hungary has more than
4.6% of the population in
multidimensional poverty. In
Croatia, there is more than 4.4% of
the population living in
multidimensional poverty.
The average intensity of
deprivation in B&H amounts to
37.2% (average share of poverty
indicators that deprives the
population) and it is lower in
relation to Serbia, FYR
Macedonia, Montenegro and
Albania.
There are 7.0% populatin vulnerable to poverty in B&H (who experience 20-32,9% intesity in deprivations) and 0,1% population in severy poverty (with intensity more than 50%).

18
The MPI can be broken down to see directly how much each indicator contributes to multidimensional poverty. Besides that, MPI can be decomposed by different regions or groups.
Source: Country Briefing: Bosnia and Herzegovina, Multidimensional Poverty Index At a Glance, WWW.ophi.org.uk
In MPI of B&H the weighted contribution of the health indicators are 51.8% to overall poverty, but in the rural areas 45.6%.
Indicators of living standards are more significant in the rural areas, they contribute by 25.6% to overall poverty.
8 Conclusions The context of human development is becoming a developing paradigm that characterizes the 21st century. According to HDR 2013, among 186 countries, B&H is ranked at the 81st place and belongs to the countries with high human development. However, can B&H be satisfied with this position? Analysis of human development indicators of B&H in relation to the CEE countries suggests the following:
In relation to the EU member states (Slovenia, Slovakia, Bulgaria, Romania, Czech Republic, Hungary, Poland), B&H is below the development in these countries, by all indicators. According to economic indicators and indicators of education, these countries are significantly above the development of B&H. (especially Slovenia). Bulgaria, Hungary and Romania differ in the health dimension; with life expectancy shorter than in B&H. Losses in the development due to unequal distribution in these countries are significantly lower than those registered in B&H, except Romania.
All EU candidate countries (FYR Macedonia, Montenegro and Serbia) and Croatia, as a new EU member country, are above the average development of B&H (by 1% and 9%). All

19
candidate countries, according to the achieved GNI/pc, are above the average achieved GNI/pc in B&H; Croatia by 100%, Montenegro by 36%, Serbia by 24% and FYR Macedonia by 22%). According to indicators of education and health, Croatia is above B&H by all elements, but B&H is above the development of FYR Macedonia, according to these elements of human development. Croatia and FYR Macedonia have registered higher losses in development than B&H, due to distribution inequality.
Albania, as a potential candidate country for accession to the EU, is above the development of B&H; by 0.1% according to the GNI/pc, as well as according to the mean years of schooling and to health indicators. Due to inequalities in distribution of basic human development dimensions, Albania registered more losses than B&H by more than 20%.
Indicators of multidimensional poverty classify B&H among the countries with lower coverage of population affected by multidimensional deprivation. However, one should take into account that these data refer to 2006 and that many changes have occurred in the world and B&H.
Therefore, human development indicators are used to shed light on the position of B&H in relation to the CEE countries. In the EU accession process, the analysis of human development indicators can be used in analysis of socio-economic situation, creators of policy and development strategy focusing on development priorities. Our general conclusion is that Bosnia and Herzegovina needs a rapid economic growth aimed at strong support of education.
The complexity of economic, social and the overall situation in BiH requires the application of concept of human development in a much stronger and more consistent way than it was done so far, as well as the application of human development indicators in analyses of the socio-economic situation.
Taking into account the concept of human development, as approach to development that has marked the 21st century and extraordinary possibilities of human development indicators, the following recommendations can be applied to B&H circumstances:
B&H needs to have the necessary statistical basis and monitoring of all human development indicators, which can be achieve through introduction of special studies, taking into account the special experiences in organization and results of statistic surveys in B&H. It is especially important to monitor indicators in accordance with the HDI, IHDI, GII and MPI structure, as well as to continuously follow new findings in contemporary methodology and human development indicators. In B&H conditions, this once again refers to the need for census of population, significant expansion of monitoring of the indicators that are specific for human development, as well as unified expression of all indicators at the level of municipalities, cantons, entities, Brčko District and the state. Such a database serves as the basis for monitoring the MDGs, which is of crucial importance for global consideration of realization of MDGs.
Governmental institutions should establish a department for human development, which would represent the institutional link between the national and regional human development bureaus in the South East Europe; it would also analyse and monitor human development and human development indicators at the state level
20
and give an input into the existing and long-term developmental policies. The department would analyse the causal relations between the policies, programs and their influences on the level of human wellbeing and would thus provide assistance in terms of informing, setting objectives and priorities and the optimum allocation of funds. Given the wide possibilities of use and disaggregation of human development indicators, this department would also monitor relations between entities, cantons, as well as development gaps, gender aspects, national aspects, specific issues related to rural development, etc.
In order to promote, inform and educate people on the notion and concept of human development and human development indicators, university curricula should include human development as a special curricular subject.
The process of European integration also imposes a need to suggest to the UNDP office in B&H to create a human development report in B&H focused to spatial planning and development, wherein the space of B&H is observed as one single territory. This would initiate practical, public, political and expert debates relating the function of spatial planning at the national level, which is one of the objectives of national human development reports.
References Alkire, S. (2009), Conceptual Overview of Human Development: Definitions, Critiques and Related
Concepts, Background paper for the 2010 HDR, Oxford Poverty and Human Development Initiative, University of Oxford
Alkire, S. and Santos, M.E. (2010), Acute Multidimensional Poverty : A New Index for Developing Countries, UNDP HDR Human Development Research Paper 2010/11 available at http://hdr.undp.org/en/reports/global/hdr2010/papers/
Alkire, S., J.M. Roche, M.E. Santos, and S.Seth (2011), Multidimensional Poverty Index: New Results, Time Comparisons and Group Disparities, UNDP HDR Human Development Research Paper
Alkire, S. and Foster, J. (2010), Designing the Inequality-Adjusted Human Development Index (IHDI) , UNDP HDR Human Development Research Paper 2010/28
Alkire, S., J.M. Roche, M.E. Santos, and S. Seth., March 2013.“Multidimensional Poverty Index 2013, ” University of Oxford, Oxford Poverty and Human Development Initiative, Oxford, UK, available at www.ophi.org.uk/multidimensional-poverty-index/mpi-2013/
Country Briefing: Bosnia and Herzegovina, Multidimensional Poverty Index At a Glance, WWW.ophi.org.uk
Deneulin, S. and Shahani, L. (2009), An Introduction to The Human Development and Capability Approach, Freedom and Agency, Earthscan, London, UK
Fetahagić, M. (2011), Indikatori humanog razvoja – korak ka cjelovitom mjerenju socioekonomskog razvoja Bosne i Hercegovine, in Ekonomska i socijalna budućnost BiH - kako ubrzati razvoj Forum Bosnae 52/11, 198-245.
UNDP (2010): Human Development Report 2010, The Real Wealth of Nations: Pathways to Human Development, Palgrave Macmillan, New York
UNDP (2011): Human Development Report 2011, Sustainability and Equity: A Better Future for All, Palgrave Macmillan, New York
UNDP (2013): Human Development Report 2013, The Rise of the South: Human Progress in a Diverse World, UNDP, New York