preliminary study to develop standard acceptance tests for ... · office of research & library...
TRANSCRIPT

Office of Research & Library ServicesWSDOT Research Report
Preliminary Study to Develop Standard Acceptance Tests for Pervious Concrete
Somayeh Nassiri Milena Rangelov Zhao Chen
WA-RD 868.1 May 2017
17-07-0295

Research Report Agreement No. T1462, Task 11
WA-RD 868.1
PRELIMINARY STUDY TO DEVELOP STANDARD
ACCEPTANCE TESTS FOR PERVIOUS CONCRETE
Somayeh Nassiri, PhD, PEng Assistant Professor
by
Milena Rangelov Zhao Chen PhD Candidate PhD Student
Washington State Transportation Center (TRAC) Department of Civil and Environmental Engineering
Washington State University PO Box 645825
Pullman, Washington
Washington State Department of Transportation Technical Monitor
Mark Russell, Pavement Engineer
Prepared for
The State of Washington Department of Transportation
Roger Millar, Secretary
May 2017
Preliminary Study to Develop Guidance
Tests for Pervious Concrete A.1 May 2017

TECHNICAL REPORT DOCUMENTATION PAGE 1. REPORT NO.
WA-RD 868.1 2. GOVERNMENT ACCESSION NO. 3. RECIPIENT'S CATALOG NO.
4. TITLE AND SUBTITLE
Preliminary Study to Develop Standard Acceptance Tests for Pervious Concrete
5. REPORT DATE
May 2017 6. PERFORMING ORGANIZATION CODE
7. AUTHOR(S)
Milena Rangelov, Somayeh Nassiri and Zhao Chen 8. PERFORMING ORGANIZATION REPORT NO.
9. PERFORMING ORGANIZATION NAME AND ADDRESS
Department of Civil and Environmental Engineering Washington State University, PO Box 642910 Pullman, Washington 99164-2910
10. WORK UNIT NO.
11. CONTRACT OR GRANT NO.
Agreement T1462, Task 11
12. SPONSORING AGENCY NAME AND ADDRESS
Research Office Washington State Department of Transportation Transportation Building, MS 47372 Olympia, Washington 98504-7372 Project Manager: Lu Saechao, 360-705-7260
13. TYPE OF REPORT AND PERIOD COVERED
Final Research Report
14. SPONSORING AGENCY CODE
15. SUPPLEMENTARY NOTES
This study was conducted in cooperation with the U.S. Department of Transportation, Federal Highway Administration.
16. ABSTRACT: Pervious concrete pavements are permeable pavement systems that are desired for their role in stormwater management and runoff control. Increased popularity in pervious concrete pavement applications has raised the need for the development of quality control and quality-evaluation test procedures that are suitable for pervious concrete compared to traditional concrete. This brief study took a few preliminary steps in this direction by investigating the effect of specimen size on physical properties of pervious concrete such as hardened porosity and density as well as compressive strength (f’c). Moreover, the effect of four different curing regimens with combined air and moist curing over the four-week curing period on the 28-day f’c for both specimen sizes was investigated. Pervious concrete for this project was sampled from a Washington State Department of Transportation (WSDOT) paving project located on Vashon Island Ferry Terminal. Forty-eight four-inch and 40 six-inch diameter cylinders were cast and tested as part of the study. The results suggested that the four and six-inch diameter cylinders tested in the project demonstrated comparable values of hardened porosity and density, implying that either size specimen is suitable for quality control of such physical properties. Hardened density obtained in the laboratory for cast cylinders was within two percent or less of the fresh density obtained for the mixture in the field, which shows the suitability of the implemented specimen casting and compacting methods. Compressive strength of small cylinders was higher than that of large cylinders by 8-19%, depending on the curing method. The combination of two weeks of air curing and two weeks of moist curing resulted in the highest 28-day f’c for both specimen sizes. On the other hand, four weeks of air curing yielded the lowest f’c among the tested specimens. This trend was confirmed by thermogravimetric analysis conducted on cement paste samples from the four curing categories, which showed that moisture curing resulted in leaching of C-S-H and Ca(OH)2 from the paste. The findings of the study need to be expanded in the future to include more mixtures and testing.
17. KEY WORDS
Pervious concrete, porosity, infiltration, compressive strength, curing
18. DISTRIBUTION STATEMENT
No restrictions. This document is available to the public through the National Technical Information Service, Springfield, VA 22616
19. SECURITY CLASSIF. (of this report)
None 20. SECURITY CLASSIF. (of this page)
None 21. NO. OF PAGES 22. PRICE

iv
A.iv Preliminary Study to Develop Standard Acceptance
Tests for Pervious Concrete
May, 2017
Disclaimer
The contents of this report reflect the views of the authors, who are responsible for the facts and
the accuracy of the data presented herein. The contents do not necessarily reflect the official
views or policies of the Washington State Department of Transportation or Federal Highway
Administration. This report does not constitute a standard, specification, or regulation.

v
A.v Preliminary Study to Develop Standard Acceptance
Tests for Pervious Concrete
May, 2017
CONTENTS
EXECUTIVE SUMMARY ............................................................................................................. viii
Objectives .................................................................................................................................... viii
Background .................................................................................................................................. viii
Research Activities ...................................................................................................................... viii Conclusions ................................................................................................................................... ix
INTRODUCTION ............................................................................................................................ 10
REVIEW OF CURRENT TESTS OF PERVIOUS CONCRETE ................................................... 14
Fresh density and hardened density .............................................................................................. 14
Infiltration rate .............................................................................................................................. 15
Compressive strength (f'c) ............................................................................................................ 17
PROJECT OVERVIEW ................................................................................................................... 19
Field work ..................................................................................................................................... 19
Pervious concrete placement ........................................................................................................ 21
Materials and mixture design ....................................................................................................... 23
Fresh PC testing and sampling ..................................................................................................... 23
Curing and testing ......................................................................................................................... 25
TEST RESULTS & DISCUSSIONS ............................................................................................... 28
Hardened porosity & density ........................................................................................................ 28
Infiltration rate .............................................................................................................................. 34
Compressive strength- effect of specimen size ............................................................................ 36
Compressive strength- effect of curing method ........................................................................... 37
Failure types ................................................................................................................................. 46
Load-displacement behavior ........................................................................................................ 57
CONCLUSIONS .............................................................................................................................. 58
FUTURE RESEARCH ..................................................................................................................... 60
ACKNOWLEDGEMENTS ............................................................................................................. 61
REFERENCES ................................................................................................................................. 62
APPENDIX ...................................................................................................................................... 65

vi
A.vi Preliminary Study to Develop Standard Acceptance
Tests for Pervious Concrete
May, 2017
TABLES
Table 1- List of available guidelines and standardized test procedures for PC evaluation. ............. 13 Table 2- PC mixture design and proportioning. ............................................................................... 23 Table 3- Four curing methodologies for PC with the corresponding sample sizes. ......................... 26 Table 4- Average porosity (ϕ), hardened density (ρ) and the results of Pearson t-test for comparison of ϕ and ρ 4-in vs. 6-in cylinders ..................................................................................................... 29 Table 5- Significance of effect of cylinder size on 28-day f’c based on Pearson t-test .................... 37 Table 6- Results of Pearson t-test comparing f’c for different curing categories ............................. 38 Table 7- Regression coefficients A and B from the Eq. 3, with the corresponding R2. ................... 43 Table 8- LOI based on different temperature ranges for four curing categories based on TGA ..... 46 Table 9- Observed failure types after f'c test. ................................................................................... 47
FIGURES
Figure 1- Typical cross section of a pervious concrete pavement. ................................................... 10 Figure 2- Infiltration test setup. ........................................................................................................ 16 Figure 3- Project location with respect to Seattle, 47°31’33.66’’ N and 122°26’35.03’’W. Google Earth. June 3, 2016 (available from: https://www.google.com/maps/). ........................................... 19 Figure 4- Vashon Ferry Terminal Construction Lanes (WSDOT, 2016). ........................................ 20 Figure 5- Northbound lanes under construction on June 1 2016. ..................................................... 20 Figure 6- Southbound lane under construction on June 17 2016. .................................................... 21 Figure 7- (a) Finishing PC flat using a vibratory roller. (b) Roller compacting PC. (c) Joints cutting. (d) Freshly placed PCP covered with plastic sheets for curing. (e) Hardened PCP in the outer lane after the curing period. ..................................................................................................................... 22 Figure 8- ASTM 1688 fresh density test: (left) compaction of PC by the standard Proctor Hammer, (right) finishing the fresh PC flat with a strike-off bar. .................................................................... 24 Figure 9- Compacting PC into cylindrical specimens: (left) by the Proctor Hammer, (right) additional strikes of the mallet to avoid undesired pockets of air. .................................................................... 25 Figure 10- Compressive strength test experimental setup. ............................................................... 27 Figure 11- Porosity (ϕ) and hardened density (ρ) for both cylinder sizes. ...................................... 28 Figure 12- Linear φ-ρ relationship for 4- and 6-in cylinders. ........................................................... 30 Figure 13- Comparison of fresh (D) and hardened density (ρ), based on casting day 1 or 2 (D1 or D2) and PC sampling batch (B1~B4) for (a) 4-in and (b) 6-in cylinders. ........................................ 34 Figure 14- Average infiltration for 4- and 6-in cylinders. ................................................................ 35 Figure 15- Infiltration versus porosity for 4- and 6-in cylinders. ..................................................... 35 Figure 16- Average 28-day f'c for 4- and 6-in PC cylinders for four curing categories. .................. 36 Figure 17- f’c- ϕ relationship for (a) 4- and (b) 6-inch cylinders. .................................................... 42 Figure 18- Specimen from curing 1A3M at 28-day age, with white stains of leached materials. ... 43 Figure 19- TGA results: (a) weight loss and weight loss derivative for curing category 1A3M (b) weight loss for samples from four curing categories. ....................................................................... 45 Figure 20- Occurrence of different failure types on f'c test (a) 4- and (b) 6-in cylinders. ............... 51

vii
A.vii Preliminary Study to Develop Standard Acceptance
Tests for Pervious Concrete
May, 2017
Figure 21- Compressive strength (f’c) of PC versus the recorded failure type (all curing categories included) for (a) 4- and (b) 6-in cylinders. ....................................................................................... 55 Figure 22- Compressive strength vs. failure type for 4-in cylinders tested as a part of the earlier study (Rangelov et al., 2016). The total of 28 tested specimens included. ................................................ 57 Figure 23- Load-displacement chart for the 6-in specimens and three observed failure types: side fracture on one side, side fracture on both sides shear failure. ......................................................... 58
viii
A.viii Preliminary Study to Develop Standard Acceptance
Tests for Pervious Concrete
May, 2017
EXECUTIVE SUMMARY
Objectives
Long-term trajectory of this research is to develop laboratory and in-field tests for quality control
and quality evaluation of pervious concrete. The objective of this brief study was to take the
preparatory steps towards this long-term goal by identifying suitable specimen size for testing,
proper method of casting and compacting specimens at the job site, compatibility of fresh and
hardened physical properties, and finally proper curing method for compressive strength testing.
Background
Pervious concrete pavements are permeable pavements that provide runoff control while serving
as the wearing course for low-traffic volume roads, parking lots, walk/bike pathways and other
applications. Recent increases in pervious concrete usage due to its benefits in stormwater
management demands a rapid development of standardized acceptance tests suitable for pervious
concrete. Currently, only a handful of standardized test procedures is available for pervious
concrete, which leads to differences in casting and testing between laboratories and unreliable
test results in one laboratory. Therefore, there is a need for considering the intrinsic physical and
mechanical properties of pervious concrete and develop test methods that are suitable for
pervious concrete compared to traditional concrete.
Research Activities
The pervious concrete used in the study was obtained during a Washington State Department of
Transportation (WSDOT) paving project on Vashon Island Ferry terminal. The fresh pervious
concrete was sampled on two paving days. Specimens were cast in the field using pre-
determined fresh material weight based on fresh density test of the mixture. A laboratory
experiment was then designed to evaluate the effect of specimen size (4-inch versus 6-inch
diameter cylinders) on physical properties of hardened porosity and density, and hydraulic
properties in terms of infiltration rate. Further, the specimens were subjected to four curing
regimes, featuring different combinations of air and moist curing over the four-week period.
Hence, the impact of specimen size and curing method on the 28-day compressive strength (f’c)
was examined. Finally, the specimens’ failure modes during f’c testing and the respective load-
displacement curves were analyzed.

ix
A.ix Preliminary Study to Develop Standard Acceptance
Tests for Pervious Concrete
May, 2017
Conclusions
The experimental results reveal that both cylinder sizes demonstrate comparable values of
porosity (~16 percent) and hardened density (~131.5 lb/ft3), as well as a strong linear porosity-
density correlation (R2 range: 0.60-0.90). Hardened density established in the laboratory was
within two percent of the fresh density established in the field, which indicates that the
implemented casting and compaction procedure was suitable for the given mixture design. Four-
inch diameter cylinders had higher 28-day f’c compared to six-inch cylinders by around 8-19
percent, depending on the curing method. Curing regime of two-week air curing and two-week
moist curing resulted in the highest 28-day f’c for both specimen sizes, while four-week air
curing had the lowest strength. The results of thermogravimetric analysis (TGA) indicated that
moist curing might result in loss of C-S-H and Ca(OH)2 from the cement paste. During f’c
testing, shear failure was the most frequently observed failure type for four-inch cylinders (48
percent of the tested specimens), while 80 percent of the tested six-inch cylinders showed side-
fracture failure type. Load-displacement curves of six-inch cylinders indicated that the specimens
with side-fracture failure demonstrate higher post-peak strength compared to other failure types.

10
A.10 Preliminary Study to Develop Standard Acceptance
Tests for Pervious Concrete
May, 2017
INTRODUCTION
Pervious concrete pavement (PCP) is a permeable pavement structure that is used for stormwater
management, while serving as the wearing course for sidewalks, parking lots, driveways, and
light-traffic roadways. The pavement structure includes a pervious concrete (PC) layer at the top
that contains a high amount of purposefully entrapped macroscopic air voids, ranging from 15 to
25 percent of the total volume (Eisenberg et al. 2015). The high air void content allows free drain
of water through the layer with infiltration rates ranging 300-2,000 inch/hour (ACI- 522R-10).
Currently, a structural layer thickness design procedure is not available for PCP; therefore, the
PC layer thickness is selected based on experience, ranging between six and 12 inches in
different applications (Figure 1) (ACI- 522R-10). According to Washington Aggregate &
Concrete Association (WACA), PC layer thickness ranges 4-5 in for sidewalks/pathways, 5-6 in
for residential driveways and light duty parking lots, and 8-10 in for areas with heavier truck
traffic (WACA, 2016).
As mentioned earlier, PC’s prominent characteristic is the high content of hardened air void
achieved by limiting the coarse aggregate grade to a small size ranging ⅜-¾ in with a minimum
of 10 percent passing sieve #4 ( CRMCA, 2009). Higher nominal maximum sizes of coarse
aggregate may yield in higher porosity, however at the detriment of workability and mechanical
properties ( CRMCA, 2009). Fine aggregate is either completely removed from the mixture or is
Figure 1- Typical cross section of a pervious concrete pavement.

11
A.11 Preliminary Study to Develop Standard Acceptance
Tests for Pervious Concrete
May, 2017
included in a limited amount of 6 ± 2 percent for additional strength and freeze-thaw durability
(Kevern et al., 2008; CRMCA, 2009). The end result is a matrix of coarse aggregate (that is)
interconnected by bridging layers of paste as opposed to conventional portland cement concrete
(PCC), where the aggregate is fully embedded in the paste. Naturally, such voided structure
results in lower mechanical properties also associated with high variability, depending on the
method of placement/casting and compaction.
The PC layer is placed on a permeable, open-graded, and clean stone base layer commonly
ASTM No. 2, 3, or 57 river rock or crushed stone, depending on local availability (CRMCA,
2009). The thickness of the base layer depends on the traffic volume and loads, local
environmental parameters such as precipitation, evaporation, subgrade soil’s infiltration rates,
intended stormwater functionality (detention or the recharge), and hydrological design. The
minimum recommended thickness for the base layer that serves as a stormwater storage is six
inches (CRMCA, 2009). Most likely, this thickness needs to be increased in cold regions with
freeze-thaw cycling. In the absence of a structural pavement design procedure for PCP layers,
ACI 330R-13 “Guide for the Design and Construction of Concrete Parking Lots” is suggested to
be consulted (ACI. 522R-13).
With regular maintenance to avoid clogging, PCP allows for drain down of runoff and reduces
pooling and ponding of rain and snowmelt water, which is especially desired in areas with high
rain volume. Other environmental benefits may include reduction of the heat-island effect in
urban areas and noise mitigation (Haselbach et al., 2011; Kevern et al., 2012). These advantages
have made PCP appealing for such applications as parking lots, sidewalks, driveways, bike lanes,
walking paths and light-traffic roadways and has made PCP a stormwater management tool for
low-impact development (LID) projects across Washington state (WACA, 2016).
Despite the challenges and the lack of standardized test procedures, PCP’s advantages in
stormwater management have led to increased usage. As a result, there is a demand for the fast
development of acceptance specifications for PC. Currently, only a handful of standardized test
procedures are available for testing PC’s fresh and hardened properties. Table 1 presents the
standardized procedures available today to determine PC’s different properties. Furthermore,
Table 1 also encompasses the procedures for PC testing that are under development. As shown in
the table, the American Concrete Institute (ACI- 522R-10)’s 522 Committee’s document:

12
A.12 Preliminary Study to Develop Standard Acceptance
Tests for Pervious Concrete
May, 2017
“Specification for Pervious Concrete Pavement ACI 522.1-13” (ACI. 522R-13) is currently the
only comprehensive document on properties of PC, which includes recommendations for
materials, preparation, and placement of PC. However, this publication was last visited by the
committee in 2013, and due to the fast growth and development of PCP is outdated and requires
updating (this document is being currently updated by the committee). The standardized test
methods from the American Society for Testing and Materials (ASTM) represents the most
extensive framework in PC testing. Available ASTM test methods are the determination of fresh
density, hardened density and porosity, and infiltration rate: ASTM C1688, ASTM C1754, and
ASTM C1701, respectively. Standardized procedure ISO 177851: 2016. Testing Methods for
Pervious Concrete-Part 1: Infiltration Rate also outlines the procedure for the characterization of
PC infiltration rate (ISO 177851-1:2016).
13
A.13 Preliminary Study to Develop Standard Acceptance
Tests for Pervious Concrete
May, 2017
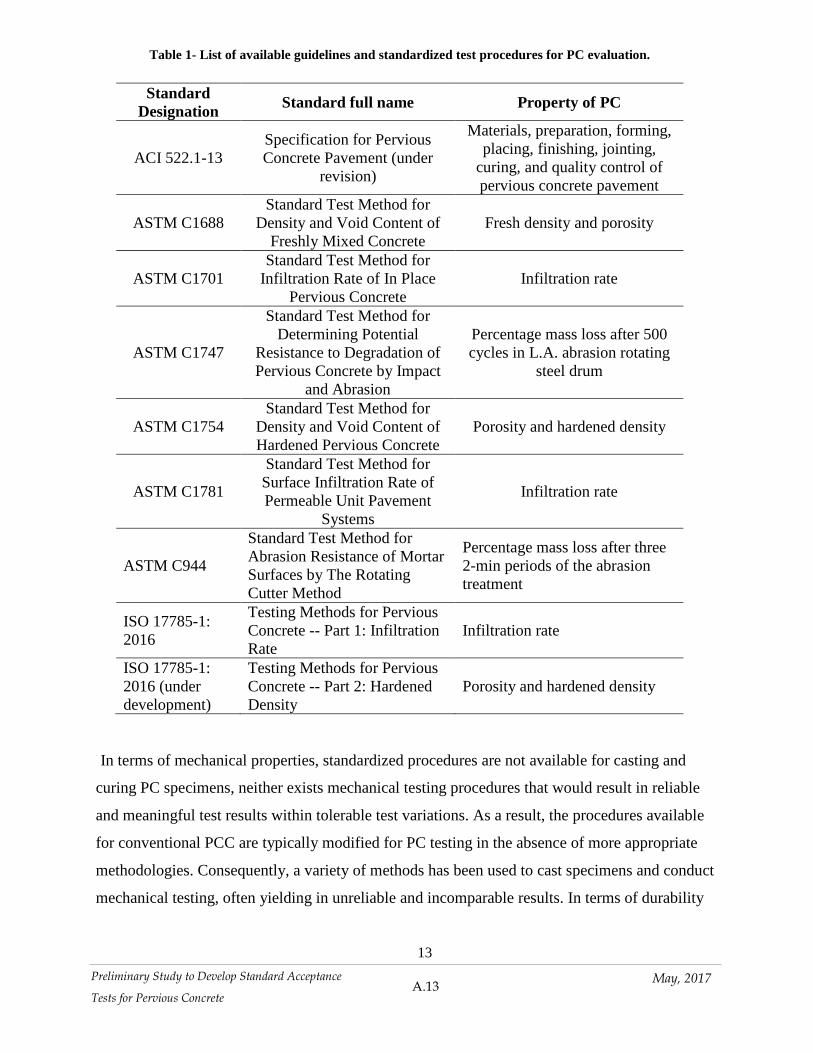
Table 1- List of available guidelines and standardized test procedures for PC evaluation.
Standard Designation Standard full name Property of PC
ACI 522.1-13 Specification for Pervious Concrete Pavement (under
revision)
Materials, preparation, forming, placing, finishing, jointing,
curing, and quality control of pervious concrete pavement
ASTM C1688 Standard Test Method for
Density and Void Content of Freshly Mixed Concrete
Fresh density and porosity
ASTM C1701 Standard Test Method for
Infiltration Rate of In Place Pervious Concrete
Infiltration rate
ASTM C1747
Standard Test Method for Determining Potential
Resistance to Degradation of Pervious Concrete by Impact
and Abrasion
Percentage mass loss after 500 cycles in L.A. abrasion rotating
steel drum
ASTM C1754 Standard Test Method for
Density and Void Content of Hardened Pervious Concrete
Porosity and hardened density
ASTM C1781
Standard Test Method for Surface Infiltration Rate of Permeable Unit Pavement
Systems
Infiltration rate
ASTM C944
Standard Test Method for Abrasion Resistance of Mortar Surfaces by The Rotating Cutter Method
Percentage mass loss after three 2-min periods of the abrasion treatment
ISO 17785-1: 2016
Testing Methods for Pervious Concrete -- Part 1: Infiltration Rate
Infiltration rate
ISO 17785-1: 2016 (under development)
Testing Methods for Pervious Concrete -- Part 2: Hardened Density
Porosity and hardened density
In terms of mechanical properties, standardized procedures are not available for casting and
curing PC specimens, neither exists mechanical testing procedures that would result in reliable
and meaningful test results within tolerable test variations. As a result, the procedures available
for conventional PCC are typically modified for PC testing in the absence of more appropriate
methodologies. Consequently, a variety of methods has been used to cast specimens and conduct
mechanical testing, often yielding in unreliable and incomparable results. In terms of durability

14
A.14 Preliminary Study to Develop Standard Acceptance
Tests for Pervious Concrete
May, 2017
tests, the procedure specified in ASTM 1747 provides an estimate of PC potential resistance to
degradation by impact and abrasion. Further, the rotating cutter method was used to evaluate the
abrasion resistance of PC as per ASTM C944 & (Dong et al., 2012).
The overall objective of this research was to conduct a series of tests to identify those that can
be used for acceptance of PC mixtures and PCP placements in the field and in the laboratory.
The specific focus of this study was to evaluate the reliability of the results of 28-day
compressive strength (f’c) as well as fresh and hardened density, porosity, and infiltration rate.
As part of the investigation, the effect of cylindrical specimen size on f’c, and hardened density
was also evaluated. Furthermore, the effect of air- versus moist curing method, as well as curing
duration on 28-day f’c was investigated.
REVIEW OF CURRENT TESTS OF PERVIOUS CONCRETE
Fresh density and hardened density
Fresh density and hardened porosity are the most common acceptance tests for quality
evaluation of PC. The fresh density of PC is determined based on ASTM 1688. In this procedure,
fresh PC mixture is placed in the standard container with known weight and volume in two
approximately equal lifts. Each lift is then compacted with 20 blows of the standard 5.5-lb
Proctor Hammer with a 12-in drop. After the second lift is compacted, the top is finished flat
using a strike-off plate and the weight of the container with fresh PC is recorded. The fresh
density of PC is calculated as the ratio of the mass of fresh PC by the volume of the container.
Hardened density is determined following ASTM C1754 that is typically performed on seven-
day-old specimens. In this procedure, hardened density is calculated by dividing the dry mass by
the volume of the specimen. The dry weight of the specimens is first recorded (Md) and then the
dimensions of the specimens (height and diameter) are recorded to obtain the volume (V). To do
so, two caliper measurements are taken at mid-depth to obtain the diameter, followed by two
height measurements. Hardened density is calculated as the ratio of the dry mass to the volume
of the specimen (Md/V). To characterize porosity, each specimen is submerged in water for at
least 30 minutes, after which the submerged mass of each specimen is recorded (MW). The
volume of the solids is obtained by dividing the difference between the dry and submerged

15
A.15 Preliminary Study to Develop Standard Acceptance
Tests for Pervious Concrete
May, 2017
weights by the density of water (ρw). Subsequently, porosity (ϕ) is calculated using Eq. 2:
ϕρ
=( - ) 1-
*d w
w
M MV (2)
The size of the specimen may affect the hardened density and the ease of achieving the target
density. Pervious concrete- similar to conventional PCC- is placed and compacted in two and
three lifts, when casting 4-in and 6-in diameter cylinders, respectively. To achieve the target
density as per the mixture design, and a uniform density throughout the specimen’s height, each
lift needs to be pre-weighed and placed in the mold to fit the required volume. Depending on
workability, the mixture is placed to fit the mold, either through compaction by certain drops of
the Proctor hammer or by strikes of a rubber mallet or a combination of both methods. With the
varying number of lifts between the two cylinder sizes, it is critical to make sure that both
specimen sizes yield reliable results in terms of density for acceptance evaluation. An empirical
relationship can be developed to correlate the hardened density of the two size cylinders.
Infiltration rate
As described earlier, PC’s matrix contains an interconnected system of air voids that allows the
drain down of runoff. This characteristic of PC is desirable for stormwater management;
therefore, it is important to test and establish the rate of infiltration for PC. Fortunately, an
ASTM procedure exists for infiltration rate evaluation. The procedure for the determination of
the infiltration rate of in-place PC is available in ASTM C1701. A watertight infiltration ring
with a 12-in diameter is fixed on the surface of the PCP using plumber’s putty. The time that
takes for the known mass of water to infiltrate through the ring is measured. The test is repeated
at multiple locations on the PCP surface. Infiltration test at each location is preceded by pre-
wetting of the PCP with eight pounds of water. Each test should be performed within two
minutes after the completion of the pre-wetting. The number of test locations is determined
based on the area of the pavement. Three test locations are recommended for the pavement areas
up to 25,000 ft2, while an additional test location should be added for every extra 10,000 ft2. A
minimum three feet of clear distance between the test locations should be allowed. Tests should
not be performed within 24 hours of the last precipitation event. Infiltration rate of in-place PCP
in in/h is calculated based on Eq. 3:

16
A.16 Preliminary Study to Develop Standard Acceptance
Tests for Pervious Concrete
May, 2017
2KMID t
= (3)
where, M is the mass of infiltrated water in lbs, D is the inside diameter of the infiltration ring in
inches, t is the time required for the designated mass of water to infiltrate through PC in seconds,
and K is the correction factor equal to 126,870 inches.
This type of infiltration test is suitable for the in-field PCP. Infiltration rate of cylindrical PC
specimens is determined in the laboratory based on a modified version of ASTM C1701. After
the hardened porosity and density tests are completed on the specimens, specimens are wrapped
on the sides with shrink-wrap, which enables the vertical flow of water without any loss from the
sides, as shown in Figure 2. Similar to ASTM C1701 procedure, the test is based on the
measurement of the time required for the known volume of water to flow through the specimen.
Infiltration rate is calculated based on the Eq. 4:
24VI
D tπ=
(4)
where, V is the volume of the infiltrated water, D is the diameter of the specimen, and t is the
time required for the designated volume of water to infiltrate through PC. Infiltration test is
conducted with one and two liters of water for 4- and 6-in cylinders, respectively. Each
infiltration tests is preceded with pre-wetting of the specimen with the same amount of water
used in the test. The infiltration is reported as the average of the two consecutive measurements.
Figure 2- Infiltration test setup.

17
A.17 Preliminary Study to Develop Standard Acceptance
Tests for Pervious Concrete
May, 2017
Compressive strength (f'c)
The most common quality assurance test for traditional PCC is the 28-day f’c test, which is
conducted on cylindrical specimens that are cast at the job site and cured for later testing of
hardened properties. In the lack of a mechanical test procedure appropriate for PC, ASTM C39,
“Standard Test Method for Compressive Strength of Cylindrical Concrete Specimens,” is
followed for PC testing. Load rate of 35 ± 5 psi defined for traditional PCC needs to be adjusted
to compensate for the lower f’c of PC to provide for a reasonable test duration per specimen and
a steady no shock loading during the test. Furthermore, the details regarding specimen
preparation, curing, capping, as well as the failure types specified in ASTM C39 do not
correspond to PC and require modification.
One of the aims of this study was to evaluate the reliability of using 28-day f’c as a QA/QC test
for PC. In doing so, specimens need to be cast at the job site or in the laboratory in the proper
size. ASTM C39 requires f’c test to be conducted on 6 in diameter by 12 in height cylinders.
However, 4 by 8 in cylindrical specimens are more desirable for several reasons. They are cast
faster as they require a smaller number of lifts and compactions, they weigh less (approximately
7.5 lb for a typical 4-in, as opposed to 25 lb for a 6-in cylinder for a typical PC density of 130
lbs/ft3), and consequently are easier to transport, store and cure. Therefore, there is merit in
investigating whether 4-in cylinders can be used for QA testing of PC instead of 6-in cylinders.
Research studies conducted on conventional PCC show that generally a linear relationship exists
between f’c of 4-in cylinders (fc-4) and that of 6-in cylinders (fc-6):
fc-4 = ks× fc-6 (1)
Experimentally determined values of ks from the literature range from 0.68 to 1.19, with ks
being greater than unity for PCC strengths below 6,000 psi (Vandegrift and Schindler, 2006),
which is the case for pervious concrete mixtures. This relation needs to be investigated to
establish a proper value for ks for pervious concrete.
While not as commonly used, 28-day f’c test may still be conducted as an acceptance test for
pervious concrete and to provide insight into mechanical properties of the mixture. However, f’c
results conducted on the two size cylinders inherently vary, and therefore it is important to
ensure that 4-in cylinders still provide reliable test results for acceptance evaluation.
In addition to cylinder size, another factor that can substantially affect f’c results is the curing

18
A.18 Preliminary Study to Develop Standard Acceptance
Tests for Pervious Concrete
May, 2017
methodology and curing duration. As opposed to conventional PCC, pervious concrete requires a
longer wait before demolding to avoid dislodging of aggregate and breakage of the matrix during
demolding, handling and transporting. Commonly, a seven-day period is allowed before
demolding the specimens. The same period is typically used before PCPs are opened to traffic.
During the in-mold seven-day curing, the specimens for acceptance testing are cured either in the
field or in the laboratory’s ambient conditions or in a combination of both. No standardized
procedure exists for curing the specimens upon demolding. As such, normally specimens are
continued to air cure until the designated testing day. The effect and significance of moist curing
in the development of strength in conventional PCC are well known (Aitcin et al., 1994).
However, our past exploratory experiment revealed that placing PC specimens in lime-saturated
water bath upon demolding might result in the dissolving of the paste matrix, and a reduction in
28-day f’c of between five to 27 percent when compared to air-cured specimens. Therefore, this
topic deserves further investigation before standard procedures can be developed for 28-day f’c
acceptance testing of PC.
19
A.19 Preliminary Study to Develop Standard Acceptance
Tests for Pervious Concrete
May, 2017
PROJECT OVERVIEW
Field work
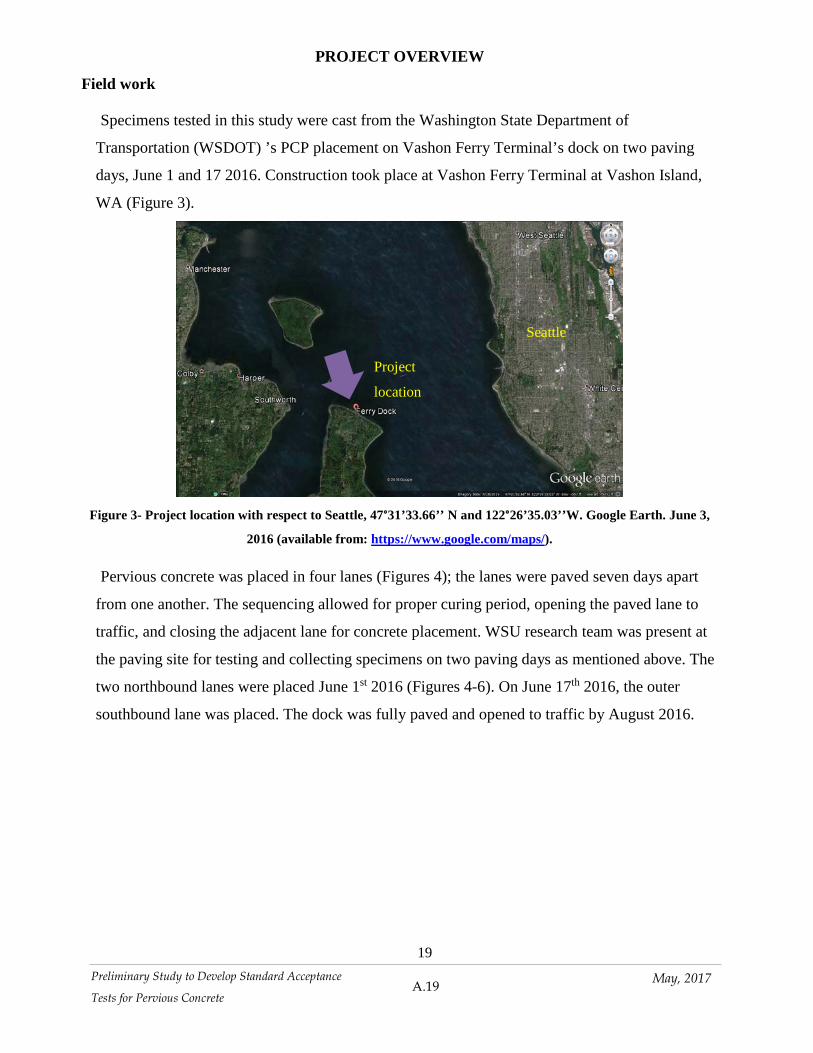
Specimens tested in this study were cast from the Washington State Department of
Transportation (WSDOT) ’s PCP placement on Vashon Ferry Terminal’s dock on two paving
days, June 1 and 17 2016. Construction took place at Vashon Ferry Terminal at Vashon Island,
WA (Figure 3).
Figure 3- Project location with respect to Seattle, 47°31’33.66’’ N and 122°26’35.03’’W. Google Earth. June 3,
2016 (available from: https://www.google.com/maps/).
Pervious concrete was placed in four lanes (Figures 4); the lanes were paved seven days apart
from one another. The sequencing allowed for proper curing period, opening the paved lane to
traffic, and closing the adjacent lane for concrete placement. WSU research team was present at
the paving site for testing and collecting specimens on two paving days as mentioned above. The
two northbound lanes were placed June 1st 2016 (Figures 4-6). On June 17th 2016, the outer
southbound lane was placed. The dock was fully paved and opened to traffic by August 2016.
Seattle
Project
location

20
A.20 Preliminary Study to Develop Standard Acceptance
Tests for Pervious Concrete
May, 2017
Figure 4- Vashon Ferry Terminal Construction Lanes (WSDOT, 2016).
Figure 5- Northbound lanes under construction on June 1 2016.

21
A.21 Preliminary Study to Develop Standard Acceptance
Tests for Pervious Concrete
May, 2017
Figure 6- Southbound lane under construction on June 17 2016.
Pervious concrete placement
In preparation for the placement of the six-inch deep PC layer, two by six-inch timber was used
as molds, placed along the lane boundaries in advance of paving. A geotextile membrane was
spread on the dock to separate the PC from the dock, for easy removal, if needed.
A total of seven and eight concrete trucks delivered and placed the fresh PC on site on June 1
and 17, respectively. Pervious concrete was deposited from the mixer truck’s chute within the
formwork and was spread to position manually using floats. A vibratory roller screed, weighted
by water fill, was supported at two sides by the formwork and was rolled on the surface of the
PC to provide a flat finish (shown in Figure 7-a). A hand-held steel roller was then passed on the
finished surface to compact the concrete slab (Figure 7-b); a similar roller with a cutting plate at
middle was used to cut the joints (Figure 7-c).
Transverse joints were immediately cut in plastic pervious concrete at 15-feet spacing, up to the
bend at the northern end, where the joint spacing was decreased to 11.5 ft. After placement,
finishing and compacting, polyethylene sheets were placed atop the freshly placed slabs to cover

22
A.22 Preliminary Study to Develop Standard Acceptance
Tests for Pervious Concrete
May, 2017
the slabs and allow curing for seven days (Figure 7-d). Figure 7-e is a photo of the hardened PC
pavement in the outer lane after the curing period.
Figure 7- (a) Finishing PC flat using a vibratory roller. (b) Roller compacting PC. (c) Joints cutting. (d) Freshly
placed PCP covered with plastic sheets for curing. (e) Hardened PCP in the outer lane after the curing period.

23
A.23 Preliminary Study to Develop Standard Acceptance
Tests for Pervious Concrete
May, 2017
Materials and mixture design
Mixture design and proportioning of the PC constituents are provided in Table 2. The coarse
aggregate nominal maximum size was 3/8 in, with a specific gravity of 2.733. Maximum allowed
mixture water was defined as 140 lb/yd3 in the mixture design, the actual mixture water varied
between 46 and 72 lb/yd3, based on the batch slips collected on the paving days from the
concrete trucks. The mixture’s density was 130.99 lb/yd3 according to the mixture design,
resulting in a target porosity at 20.4 percent. Hydration stabilizer admixture, Recover, and
rheology-modifying admixture, V-Mar 3, from W.R. Grace & Co. were added to the mixture in
dosages specified in Table 2. The purpose of admixtures is to delay the PC setting and provide
prolonged workable time, per the manufacturer’s datasheet ( Grace Concrete Products, 2013). Table 2- PC mixture design and proportioning.
Material Amount per yd3 of PC
Coarse Aggregate [lb] 2,893
Fine Aggregate [lb] 0.0
Type I/II Cement [lb] 505
Water [lb] 46.4~71.4
Admixtures Recover from Grace [oz] 33
V-Mar from Grace [oz] 34
Fresh PC testing and sampling
Nine wheelbarrow-full of the fresh PC were sampled from multiple trucks on the two paving
days. Fresh density was determined for each batch based on ASTM 1688. Fresh PC mixture was
placed into the standard bucket in two equal lifts, both of which were compacted with 20 blows
of the standard 5.5-lb Proctor Hammer with a 12-in drop, as shown in Figure 8-left. When the
second layer was compacted, the top was finished by the strike-off bar, as illustrated in Figure 8-
right, and the weight of the fresh PC was recorded. The fresh density of PC was determined as
the ratio of fresh PC mass to the known the volume of the bucket.

24
A.24 Preliminary Study to Develop Standard Acceptance
Tests for Pervious Concrete
May, 2017
Figure 8- ASTM 1688 fresh density test: (left) compaction of PC by the standard Proctor Hammer, (right)
finishing the fresh PC flat with a strike-off bar.
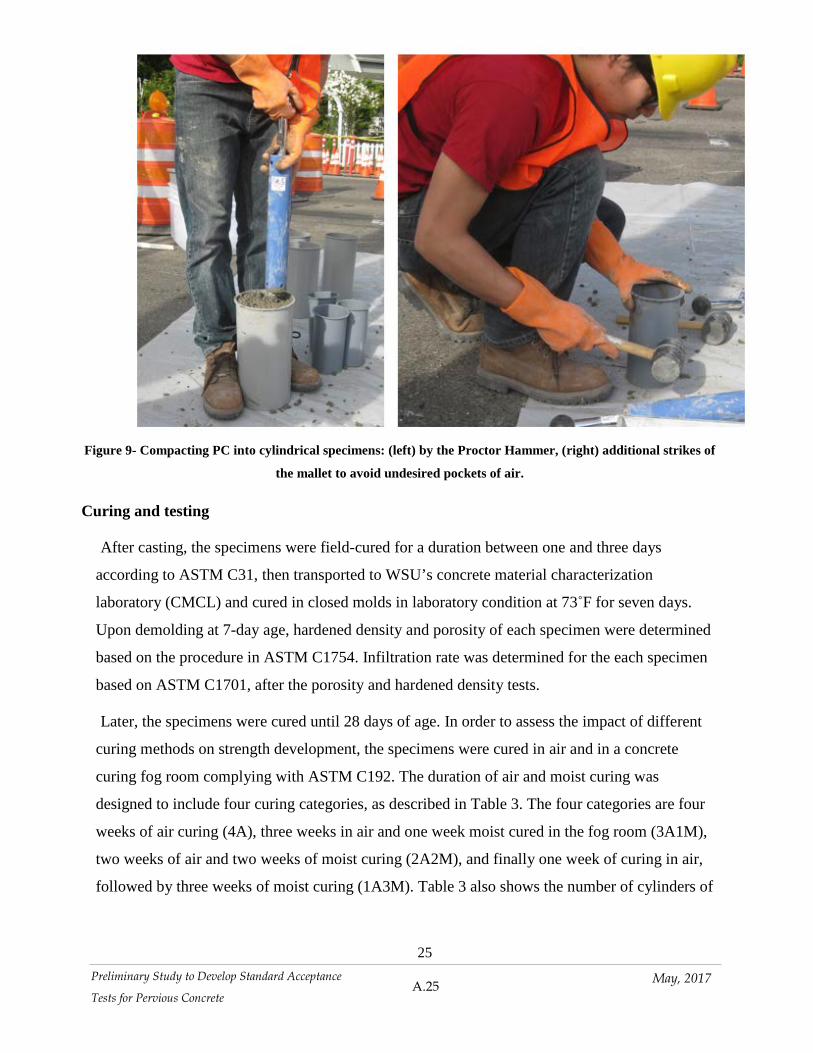
The remaining mixture was used to cast 4- and 6-in cylinders. The required mass of fresh
material placed in every mold was defined based on the experimentally determined fresh density
on the same batch, as described above. The material was divided in two and three equal lifts for
4- and 6-in cylinders, respectively. Fresh PC was compacted using a standard Proctor Hammer,
as presented in Figure 9-left. The number of hammer drops was adjusted so that the
predetermined mass of the fresh PC fit in the molds. Additionally, strikes of the rubber mallet
were applied as needed to facilitate casting and avoid segregation (Figure 9- right). A total of 48,
4-in and 40 6-in cylinders were cast on the two paving days.
25
A.25 Preliminary Study to Develop Standard Acceptance
Tests for Pervious Concrete
May, 2017
Figure 9- Compacting PC into cylindrical specimens: (left) by the Proctor Hammer, (right) additional strikes of
the mallet to avoid undesired pockets of air.
Curing and testing
After casting, the specimens were field-cured for a duration between one and three days
according to ASTM C31, then transported to WSU’s concrete material characterization
laboratory (CMCL) and cured in closed molds in laboratory condition at 73˚F for seven days.
Upon demolding at 7-day age, hardened density and porosity of each specimen were determined
based on the procedure in ASTM C1754. Infiltration rate was determined for the each specimen
based on ASTM C1701, after the porosity and hardened density tests.
Later, the specimens were cured until 28 days of age. In order to assess the impact of different
curing methods on strength development, the specimens were cured in air and in a concrete
curing fog room complying with ASTM C192. The duration of air and moist curing was
designed to include four curing categories, as described in Table 3. The four categories are four
weeks of air curing (4A), three weeks in air and one week moist cured in the fog room (3A1M),
two weeks of air and two weeks of moist curing (2A2M), and finally one week of curing in air,
followed by three weeks of moist curing (1A3M). Table 3 also shows the number of cylinders of

26
A.26 Preliminary Study to Develop Standard Acceptance
Tests for Pervious Concrete
May, 2017
both sizes designated to each curing category. Note that the unequal number of specimens in
each curing category is the result of a different number of cylinders cast on the two paving days.
Regardless, a sufficient number of specimens are included in each category to allow for
meaningful statistical comparisons. After 28 days (four weeks) of curing, specimens were tested
for the compressive strength. Table 3- Four curing methodologies for PC with the corresponding sample sizes.
Label Description of Curing
Method
#Cylinders
4-in Dia. 6-in Dia.
4A 4 weeks cured in air 16 11
3A1M 3 week cured in air, 1
weeks moist cured 12 11
2A2M 2 weeks cured in air, 2
weeks moist cured 10 10
1A3M 1 weeks cured in air, 3
weeks moist cured 10 8
Compressive strength tests were conducted based on the procedure in ASTM C39, with a
modification in loading rate. The specified loading rate of 35 ± 7 psi/s, recommended for
conventional PCC results in failure of the specimens in less than two minutes. Therefore, the
loading rate was reduced to 15 ± 3 psi/s to allow for the test on each specimen to last for about
four to five minutes. Specimens were capped with the unbounded metal caps with neoprene pads
to ensure the uniform loading over the cross-sectional area. During the compressive strength
testing, the failure mode of the each tested specimen was recorded and categorized based on the
recommendations outlined in ASTM C39. Moreover, load-displacement charts were recorded for
12 of the tested 6-in cylinders. Figure 10 presents the f’c test experimental setup.

27
A.27 Preliminary Study to Develop Standard Acceptance
Tests for Pervious Concrete
May, 2017
Figure 10- Compressive strength test experimental setup.

28
A.28 Preliminary Study to Develop Standard Acceptance
Tests for Pervious Concrete
May, 2017
TEST RESULTS & DISCUSSIONS
Hardened porosity & density
As mentioned earlier, porosity (ϕ) and hardened density (ρ) tests were performed on PC
specimens upon demolding on 7-day age. The average ϕ and ρ, with the corresponding standard
deviations, represented by whisker bars, are provided in Figure 11. It is noteworthy that one 6-in
specimen was removed from the data due to a high porosity of 25 percent, which is outside the
range targeted in this study. As seen in Figure 11, the two cylinder sizes present comparable
values of average ϕ, at approximately 16 percent. Porosity ranged 10.2-21.0 percent for 4-in and
10.0-21.6 percent for 6-in cylinders. Standard deviations show that the 6-in cylinders had slightly
lower variations in both ϕ and ρ, comparing to 4-in cylinders. In terms of ρ, both cylinders
demonstrate relatively consistent and comparable values of approximately 131.5 lb/ft3, which
corresponds well with the design density at 130.99 lb/ft3.
Figure 11- Porosity (ϕ) and hardened density (ρ) for both cylinder sizes.
The linear relationship between ρ of 4- and 6-in cylinders, analogous to the one presented in Eq.
1 is formulated in Eq. 4:
ρ4 = 0.993× 𝜌𝜌R6 (4)
where, ρ4 and ρ6 stand for hardened densities of 4- and 6-in cylinders, respectively. As seen in
Eq. 3, the correlation coefficient is close to unity. Therefore, for practical purposes, for the
100
105
110
115
120
125
130
135
140
8.00
10.00
12.00
14.00
16.00
18.00
20.00
4-inch cylinders 6-inch cylinders
Dens
ity [l
b/ft
3]
Poro
sity
[%]
Porosity Density
29
A.29 Preliminary Study to Develop Standard Acceptance
Tests for Pervious Concrete
May, 2017
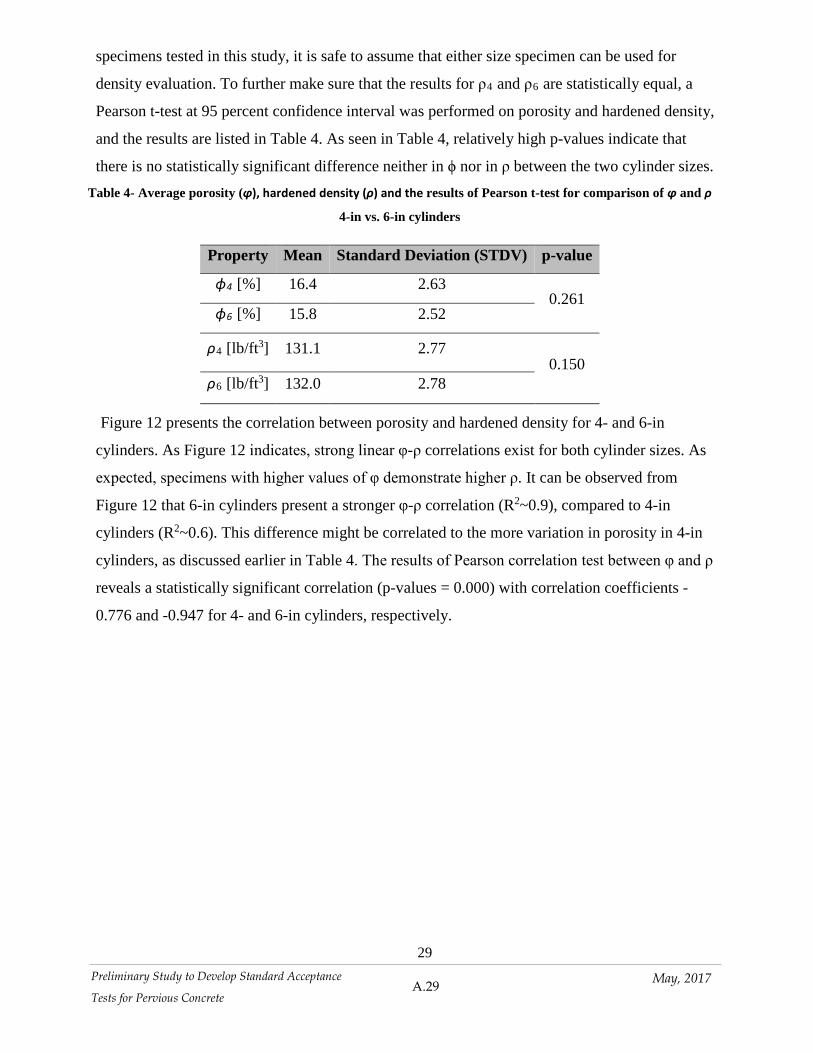
specimens tested in this study, it is safe to assume that either size specimen can be used for
density evaluation. To further make sure that the results for ρ4 and ρ6 are statistically equal, a
Pearson t-test at 95 percent confidence interval was performed on porosity and hardened density,
and the results are listed in Table 4. As seen in Table 4, relatively high p-values indicate that
there is no statistically significant difference neither in ϕ nor in ρ between the two cylinder sizes. Table 4- Average porosity (ϕ), hardened density (ρ) and the results of Pearson t-test for comparison of ϕ and ρ
4-in vs. 6-in cylinders
Property Mean Standard Deviation (STDV) p-value
ϕ4 [%] 16.4 2.63 0.261
ϕ6 [%] 15.8 2.52
ρ4 [lb/ft3] 131.1 2.77 0.150
ρ6 [lb/ft3] 132.0 2.78
Figure 12 presents the correlation between porosity and hardened density for 4- and 6-in
cylinders. As Figure 12 indicates, strong linear φ-ρ correlations exist for both cylinder sizes. As
expected, specimens with higher values of φ demonstrate higher ρ. It can be observed from
Figure 12 that 6-in cylinders present a stronger φ-ρ correlation (R2~0.9), compared to 4-in
cylinders (R2~0.6). This difference might be correlated to the more variation in porosity in 4-in
cylinders, as discussed earlier in Table 4. The results of Pearson correlation test between φ and ρ
reveals a statistically significant correlation (p-values = 0.000) with correlation coefficients -
0.776 and -0.947 for 4- and 6-in cylinders, respectively.

30
A.30 Preliminary Study to Develop Standard Acceptance
Tests for Pervious Concrete
May, 2017
Figure 12- Linear φ-ρ relationship for 4- and 6-in cylinders.
The fresh density of PC (D), determined in the field based on ASTM C1688, is commonly used
as a quality control tool (NRMCA, 2016). Density from the tests conducted in the field is
compared to hardened density (ρ) determined in the laboratory, to evaluate the casting and
compaction procedure (

31
A.31 Preliminary Study to Develop Standard Acceptance
Tests for Pervious Concrete
May, 2017
Figure 13). As seen in

32
A.32 Preliminary Study to Develop Standard Acceptance
Tests for Pervious Concrete
May, 2017
Figure 13, ρ agrees closely with the D determined in the field, for both cylinder sizes. Percent
difference between D and ρ ranges from 0.05 to 1.5 percent for 4-in and from 0.1 to 1.9 percent
for 6-in cylinders. The close agreement between the D and ρ indicates that the method of casting
specimens based on the predetermined weight and implemented compaction methodology
provided a suitable framework for casting PC cylinders in the field. Furthermore, the results
presented in

33
A.33 Preliminary Study to Develop Standard Acceptance
Tests for Pervious Concrete
May, 2017
Figure 13 demonstrate that for the specimens tested in this study, both cylinder sizes can be used
for quality control of the PC used in the field.

34
A.34 Preliminary Study to Develop Standard Acceptance
Tests for Pervious Concrete
May, 2017
Figure 13- Comparison of fresh (D) and hardened density (ρ), based on casting day 1 or 2 (D1 or D2) and PC
sampling batch (B1~B4) for (a) 4-in and (b) 6-in cylinders.
Infiltration rate
Porosity and hardened density tests were followed by infiltration tests performed on all cast
cylinders. The average infiltration rates, with the corresponding values of standard deviations,
are presented in Figure 14. The average infiltration rates are 804 and 689 in/h, for 4- and 6-in
cylinders respectively. Six-inch cylinders are characterized with lower and more uniform
infiltration rates (lower standard deviation) comparing to 4-in cylinders, as Figure 14 indicates.
More consistent infiltration rates of 6-in cylinders correspond to more consistent values of
porosity and hardened density. It is worth mentioning that the infiltrations of both specimen sizes
are within the typical range for PC, which is from 300 to 2,000 in/h (ACI- 522R-10).

35
A.35 Preliminary Study to Develop Standard Acceptance
Tests for Pervious Concrete
May, 2017
Figure 14- Average infiltration for 4- and 6-in cylinders.
Figure 15 presents the infiltration rates of all tested cylinders versus their corresponding
porosities. As seen in Figure 15, the specimens characterized with higher porosity generally
present higher infiltration, as expected. However, for 4-in cylinders, the values of infiltration are
more scattered comparing to 6-in cylinders.
Figure 15- Infiltration versus porosity for 4- and 6-in cylinders.

36
A.36 Preliminary Study to Develop Standard Acceptance
Tests for Pervious Concrete
May, 2017
Compressive strength- effect of specimen size
Compressive strength tests were performed on PC specimens at the 28-day age on all specimens
in the four curing categories. Average f’c with corresponding standard deviations, for the two
specimen sizes and four curing categories, are provided in Figure 16. The average 28-day f’c for
4- and 6-in cylinders from all curing categories are 2548 and 2899 psi, respectively. Both values
of f’c are within the typical range for previous concrete, 500~4000 psi (Tennis et al., 2004). As
seen in Figure 16, 4-in cylinders generally present higher values of f’c, by 7.7 to 19 percent, and
lower standard deviations, comparing to 6-in cylinders, across all curing categories.
Figure 16- Average 28-day f'c for 4- and 6-in PC cylinders for four curing categories.
Pearson statistical t-test was conducted, aiming to determine whether the impact of cylinder size
on f’c is statistically significant. P-values, provided in Table 5, indicate that f’c-4 and f’c-6 differ
significantly for curing categories 4A and 1A3M. The difference between f’c for cylinders from
3A1M and 2A2M is not statistically significant, based on the results listed in Table 5. When f’c
all cylinders, regardless of the curing category, were compared, the p-value was 0.002, indicating
a significant difference between f’c for the two cylinders.

37
A.37 Preliminary Study to Develop Standard Acceptance
Tests for Pervious Concrete
May, 2017
Table 5- Significance of effect of cylinder size on 28-day f’c based on Pearson t-test
Curing
category
Specimen
size Mean (psi) STDV (psi) p- values
4A 4-in 2,789 400
0.019 6-in 2,344 382
1A3M 4-in 2,925 521
0.024 6-in 2,611 527
2A2M 4-in 2,994 465
0.361 6-in 2,779 522
3A1M 4-in 2,890 477
0.167 6-in 2,459 213
All
categories
4-in 2,887 477 0.002
6-in 2,554 469
Following Eq. 1 and based on the obtained results, linear relationship between f’c -4 and f’c -6
can be established as follows, Eq. 5:
f'c-4 = 1.13× f’c-6 (5)
Eq. 4 is based on all tested specimens. The correlation coefficient at 1.13 corresponds well with
the values found from literature (Vandegrift and Schindler, 2006). Similar relations can be
developed for each of the curing categories, based on the average f’c values presented in Table 5.
Compressive strength- effect of curing method
It is observed in Figure 16 that the specimens from Category 2A2M demonstrate the highest f’c
for both cylinder sizes, while Category 4A presents the lowest f’c for both cylinders. It was
expected that longer moist curing will result in the development of more hydration products and
thereby higher f’c, however, the results present a different pattern. Cylinders from Category
1A3M, with the longest moist curing, demonstrate the lowest f’c among the moist cured
cylinders; the second lowest f’c was achieved for one week of moist curing, while two weeks of
moist curing resulted in the highest f’c. Based on f’c results, it can be observed that moist curing
improves f’c, however only when moist curing is limited to two weeks. According to the results,
two weeks of air and two weeks of moist curing represent the most beneficial curing type,

38
A.38 Preliminary Study to Develop Standard Acceptance
Tests for Pervious Concrete
May, 2017
resulting in the highest f’c.
In order to assess statistically the impact of different curing categories on f’c, t-tests were
performed on the f’c from all curing categories, and p-values are listed in Table 6. As seen in
Table 6, differences in f’c caused by different curing methodologies are not statistically
significant at 95 percent confidence level. Six-in cylinders show lower p-values comparing to 4-
in cylinders, indicating the more significant impact of curing on f’c. The comparison of curing
methods 4A and 2A2M for 6-in cylinders resulted in a p-value of 0.061, which indicates a
statistical significance at 90 percent confidence. Table 6- Results of Pearson t-test comparing f’c for different curing categories
Curing
category
p-values for 4-in cylinders p-values for 4-in cylinders
4A 1A3M 2A2A 3A1M 4A 1A3M 2A2A 3A1M
4A
Not
applicable
(NA)
0.486 0.293 0.603 NA 0.206 0.061 0.449
1A3M 0.486 NA 0.873 0.630 0.206 NA 0.403 0.118
2A2M 0.293 0.873 NA 0.747 0.061 0.403 NA 0.484
3A1M 0.603 0.630 0.747 NA 0.499 0.118 0.484 NA
Porosity is an essential property of PC, which affects its mechanical properties. To illustrate the
effects of porosity on f’c,

39
A.39 Preliminary Study to Develop Standard Acceptance
Tests for Pervious Concrete
May, 2017
Figure 17 presents the results of f’c versus porosity for each tested specimen. As seen in

40
A.40 Preliminary Study to Develop Standard Acceptance
Tests for Pervious Concrete
May, 2017
Figure 17, specimens with higher porosity generally present lower values of f’c, as expected. The
relationship between the porosity and f’c can be described as linear. A simple linear model can
be established for all of the curing categories, in the form of Eq. 6:
' *cf A p B= + (6)
where f’c represents compressive strength in psi, p porosity in percent, and A and B regression
coefficients. Table 7 features the regression coefficients for both specimen types and all curing

41
A.41 Preliminary Study to Develop Standard Acceptance
Tests for Pervious Concrete
May, 2017
categories, with the corresponding R2 values, which describe the goodness of the fit for the linear
relationships between porosity and f’c. These models can be utilized for the estimation of 28-day
f’c, based on the implemented curing methodology.

42
A.42 Preliminary Study to Develop Standard Acceptance
Tests for Pervious Concrete
May, 2017
Figure 17- f’c- ϕ relationship for (a) 4- and (b) 6-inch cylinders.

43
A.43 Preliminary Study to Develop Standard Acceptance
Tests for Pervious Concrete
May, 2017
Table 7- Regression coefficients A and B from the Eq. 3, with the corresponding R2.
Cylinder size Curing
category
Regression
coefficient A
Regression
coefficient B R2 value
4-in
1 -182.94 5923.0 0.711
2 -188.58 6121.9 0.598
3 -123.01 4933.8 0.623
4 -137.66 5040.2 0.676
6-in
1 -191.99 5340.2 0.379
2 -100.69 4051.9 0.358
3 -125.41 4721.7 0.571
4 -148.76 5017.5 0.898
During the curing period, it was observed that the specimens subjected to moist curing in the fog
room started to present white stains on the surface, as presented in Figure 19, which were
assumed to be correlated to Ca(OH)2 leaching. To further investigate the changes in the cement
paste content and explain the reason for the decline in strength with prolonged moist curing,
cement paste was sampled from one of the specimens from each curing category.
Figure 18- Specimen from curing 1A3M at 28-day age, with white stains of leached materials.
Approximately 3~5x10⁻⁴ oz of paste was scraped from each specimen, pulverized, and used in
the thermogravimetric analysis (TGA). The paste samples were heated from room temperature to
1800˚F, at the temperature rate 68˚F/min. The samples from curing categories 1A3M, 2A2M and
3A1M (categories that feature moist curing) were oven-dried at 212˚F for two hours, to eliminate
free moisture. Figure 19 (a) displays the results of TGA test, represented by the weight loss and

44
A.44 Preliminary Study to Develop Standard Acceptance
Tests for Pervious Concrete
May, 2017
weight loss derivative, for the paste sample from curing category 1A3M as an example. The
characteristic peaks in the weight loss derivative indicate the temperatures associated with
significant mass losses. As seen in Figure 19 (a), three peaks occur at approximately: 180˚F,
850˚F, and 1370˚F. The first peak is typically correlated with the dehydration of C-S-H gel,
while the second and third peaks are associated with the decomposition of Ca(OH)2 and CaCO3,
respectively. Figure 19 (b) shows the results of TGA test, represented by the weight loss for the
paste samples from four curing categories.
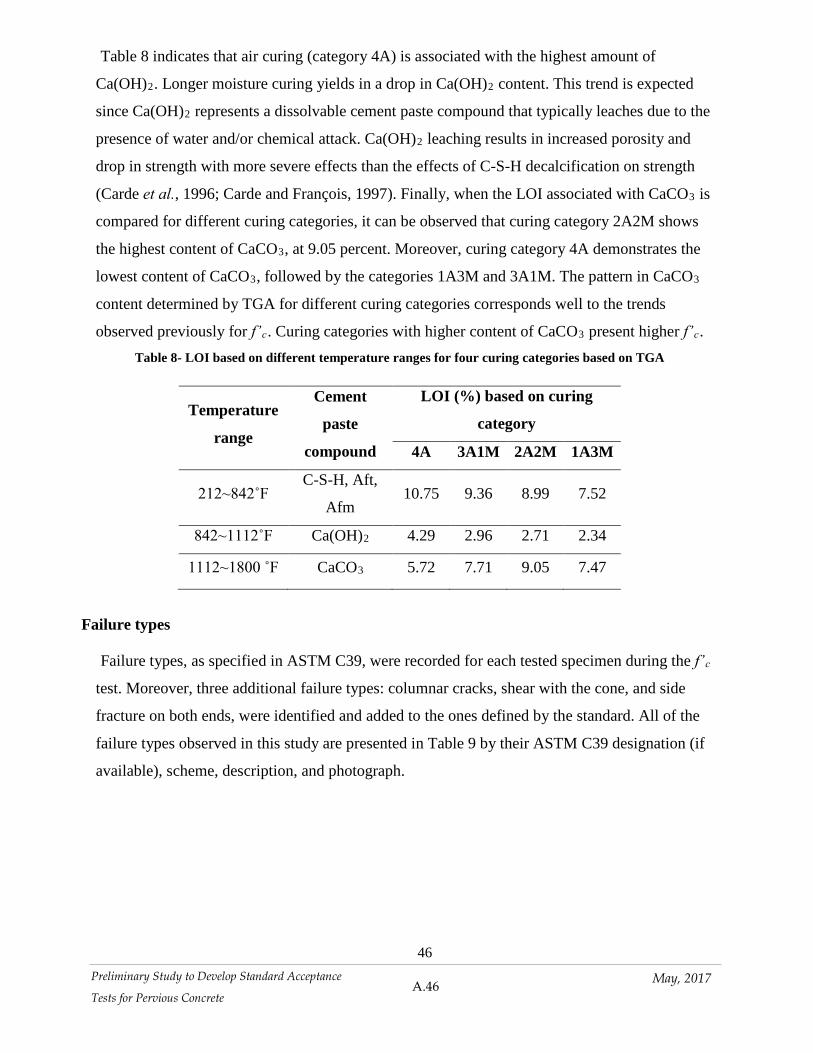
In order to quantify different phases of cement paste, loss on ignition (LOI) for the following
temperature ranges was calculated, based on the literature (Bajza and Rouseková, 1983):
212~842˚F for the C-S-H, ettringite (Aft) and mono sulphate (Afm), 842~1112˚F for Ca(OH)2,
and 1112~1800 ˚F for CaCO3. The results are presented in Table 8. As seen in Table 8, curing
category 4A presents the highest content of C-S-H, Aft and Afm. For other three curing
categories the amount of C-S-H, Aft and Afm decreases with the extension of the moist curing,
which indicates that prolonged moist curing may lead to decalcification of C-S-H gel.

45
A.45 Preliminary Study to Develop Standard Acceptance
Tests for Pervious Concrete
May, 2017
Figure 19- TGA results: (a) weight loss and weight loss derivative for curing category 1A3M (b) weight loss for
samples from four curing categories.
46
A.46 Preliminary Study to Develop Standard Acceptance
Tests for Pervious Concrete
May, 2017
Table 8 indicates that air curing (category 4A) is associated with the highest amount of
Ca(OH)2. Longer moisture curing yields in a drop in Ca(OH)2 content. This trend is expected
since Ca(OH)2 represents a dissolvable cement paste compound that typically leaches due to the
presence of water and/or chemical attack. Ca(OH)2 leaching results in increased porosity and
drop in strength with more severe effects than the effects of C-S-H decalcification on strength
(Carde et al., 1996; Carde and François, 1997). Finally, when the LOI associated with CaCO3 is
compared for different curing categories, it can be observed that curing category 2A2M shows
the highest content of CaCO3, at 9.05 percent. Moreover, curing category 4A demonstrates the
lowest content of CaCO3, followed by the categories 1A3M and 3A1M. The pattern in CaCO3
content determined by TGA for different curing categories corresponds well to the trends
observed previously for f’c. Curing categories with higher content of CaCO3 present higher f’c. Table 8- LOI based on different temperature ranges for four curing categories based on TGA
Temperature
range
Cement
paste
compound
LOI (%) based on curing
category
4A 3A1M 2A2M 1A3M
212~842˚F C-S-H, Aft,
Afm 10.75 9.36 8.99 7.52
842~1112˚F Ca(OH)2 4.29 2.96 2.71 2.34
1112~1800 ˚F CaCO3 5.72 7.71 9.05 7.47
Failure types
Failure types, as specified in ASTM C39, were recorded for each tested specimen during the f’c
test. Moreover, three additional failure types: columnar cracks, shear with the cone, and side
fracture on both ends, were identified and added to the ones defined by the standard. All of the
failure types observed in this study are presented in Table 9 by their ASTM C39 designation (if
available), scheme, description, and photograph.

47
A.47 Preliminary Study to Develop
Guidance Tests for Pervious Concrete
May, 2017
Table 9- Observed failure types after f'c test.
Failure type
name
Columnar cracks Cone and shear Cone
Failure type
from ASTM
C39
Not available
(NA)
NA Type 1
Description
Columnar cracks
propagate vertically
and evenly around the
specimen.
Well-formed cone at
one end, prominent
diagonal (shear)
cracks on another.
Well-formed cones on
both ends, top and
bottom intact.
Photograph
Failure type
name Shear Side fractures
Side fractures on both
ends
Failure type
from ASTM
C39
Type 4 Type 5
(NA)
Description
Diagonal fracture
throughout the
specimen, without
cracking of top/bottom.
Side fractures at
top/bottom; resembles
shear failure, with
cracked top or bottom.
Side fractures at both
top and the bottom
simultaneously.
Photograph

48
A.48 Preliminary Study to Develop
Guidance Tests for Pervious Concrete
May, 2017
Figure 20 presents the percentage occurrence of different failure types for 4-in (a) and 6-in
cylinders (b), based on the curing category. As seen in

49
A.49 Preliminary Study to Develop
Guidance Tests for Pervious Concrete
May, 2017
Figure 20 (a), shear failure was the dominant failure type for 4-in cylinders across all curing
methods. Approximately 48 percent of the tested 4-in cylinders in total failed in shear. The next
most prevalent failure type was cone and shear, followed by the side fracturing, with
approximately 33 and 10 percent, respectively, for all tested 4-in cylinders. Finally, 8.3 percent
of all 4-in cylinders expressed cone type of failure. In the case of 6-in cylinders (

50
A.50 Preliminary Study to Develop
Guidance Tests for Pervious Concrete
May, 2017
Figure 20, b), approximately 80 percent of tested specimens failed in a side fracture, which was
the dominant failure type. Second most common failure type was shear, with 12.5 percent
occurrence. Side fracture on both ends was recorded for 5 percent of the tested 6-in cylinders.
Finally, one 6-in cylinder exhibited failure in columnar cracks.

51
A.51 Preliminary Study to Develop
Guidance Tests for Pervious Concrete
May, 2017
Figure 20- Occurrence of different failure types on f'c test (a) 4- and (b) 6-in cylinders.

52
A.52 Preliminary Study to Develop
Guidance Tests for Pervious Concrete
May, 2017
Figure 21 shows the strength of tested specimens from all curing categories, based on the
observed failure type. Based on

53
A.53 Preliminary Study to Develop
Guidance Tests for Pervious Concrete
May, 2017
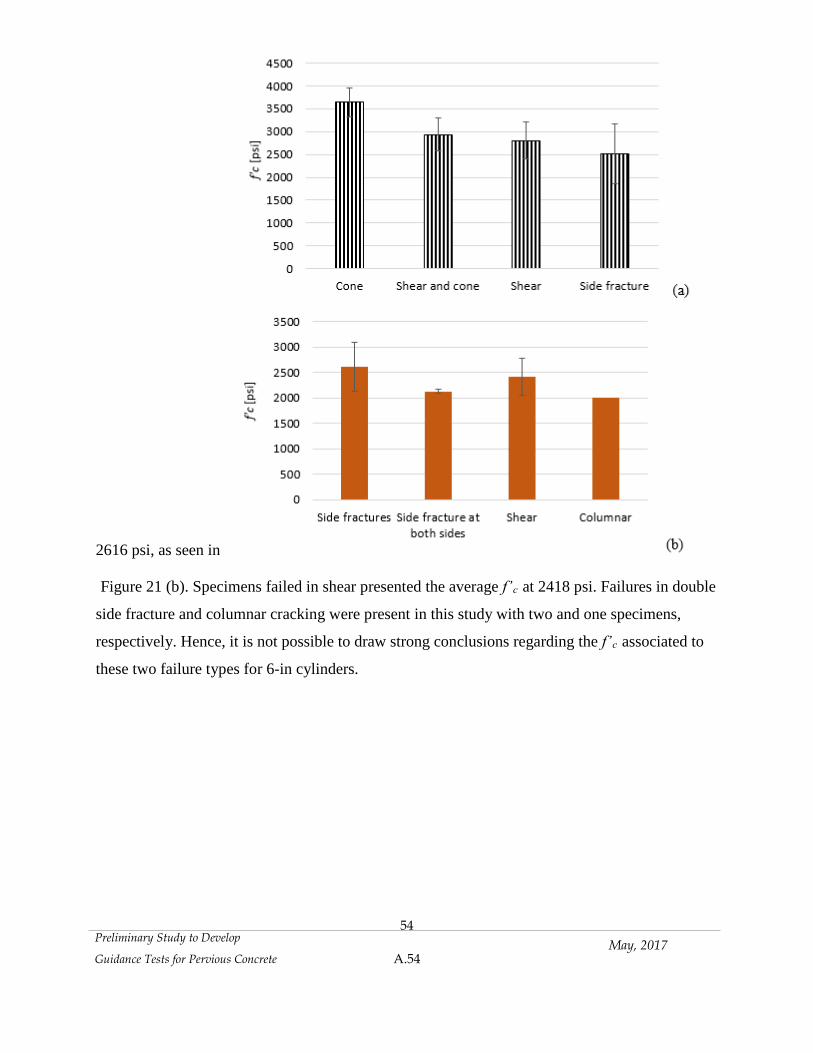
Figure 21-a, 4-in cylinders that showed cone failure have the highest f’c, at 3,643 psi on
average. Next are the 4-in cylinders in shear and cone failure demonstrated an average f’c of
2,934 psi. The specimens failed in shear, the most frequent failure type, exhibited average f’c of
2,802 psi. The side fracture failures showed the lowest values of f’c at 2,518 psi. For 6-in
cylinders, the dominant failure type, side fracture, was coupled with the highest value of f’c, at
54
A.54 Preliminary Study to Develop
Guidance Tests for Pervious Concrete
May, 2017
2616 psi, as seen in
Figure 21 (b). Specimens failed in shear presented the average f’c at 2418 psi. Failures in double
side fracture and columnar cracking were present in this study with two and one specimens,
respectively. Hence, it is not possible to draw strong conclusions regarding the f’c associated to
these two failure types for 6-in cylinders.

55
A.55 Preliminary Study to Develop
Guidance Tests for Pervious Concrete
May, 2017
Figure 21- Compressive strength (f’c) of PC versus the recorded failure type (all curing categories included) for
(a) 4- and (b) 6-in cylinders.
Failure types and corresponding f’c were tested as a part of an earlier study by the authors on PC
reinforced with Cured Carbon Fiber Composite Material (CCFCM) (Rangelov et al., 2016).
Tests were performed on four 28-day old 4-in cylinders on each of the seven tested mixture
design (one control PC mixture and six reinforced PC mixtures with different dosages and sizes
of CCFCM particles). Figure 22 presents the summarized results from the earlier study in terms
of f’c as a function of failure types on a total of 28 4-in cylinders. When the results from Figure
22 are compared with the results presented in

56
A.56 Preliminary Study to Develop
Guidance Tests for Pervious Concrete
May, 2017
Figure 21-a, it can be concluded that the values of f’c based on failure types from both studies
agree closely (the differences range from 5 for shear failure, to 16 percent for side fracture).
Authors will continue to build the PC failure type database to form a comprehensive failure
database for various level of PC strength.

57
A.57 Preliminary Study to Develop
Guidance Tests for Pervious Concrete
May, 2017
Figure 22- Compressive strength vs. failure type for 4-in cylinders tested as a part of the earlier study (Rangelov
et al., 2016). The total of 28 tested specimens included.
Load-displacement behavior
The load-displacement curve was recorded for twelve 6-in cylinders from the curing categories:
4A, 2A2W, and 3A1W.
Figure 23 presents an example load-displacement curve for different three failure types: side
fracture, shear failure and side fracture on both sides. The remaining recorded load-displacement
0
500
1000
1500
2000
2500
3000
3500
4000
Cone Shear and cone Shear Side fracture
Com
pres
sive
stre
ngth
[psi]

58
A.58 Preliminary Study to Develop
Guidance Tests for Pervious Concrete
May, 2017
curves are provided in Appendix A.
Specimens that showed shear failure and side fracture on both sides exhibit substantially lower
peak-load and residual strength comparing to the specimen with side fracture failure. The shear
failure type is associated with a brittle behavior, in which a sudden drop in load is evident. After
the peak load no residual load can be applied to the specimen. A similar behavior can be seen
with the specimen with side fractures on both sides.
However, the specimen with side fracture failure demonstrates a considerably higher peak load
and residual strength to carry further loading post the peak load, with several cycles of
hardening. It is noteworthy that side fracture was the most common failure type observed in this
study, therefore more specimens with alternate failure types are needed to confirm the trends
observed in the load-displacement curves.
Figure 23- Load-displacement chart for the 6-in specimens and three observed failure types: side fracture on
one side, side fracture on both sides shear failure.
CONCLUSIONS
An experimental study was conducted to evaluate different test methods for quality evaluation
of pervious concrete in the field and in the laboratory. Special focus was placed on the evaluation
of the suitability of simple tests such as fresh density, hardened porosity and infiltration rate, as

59
A.59 Preliminary Study to Develop
Guidance Tests for Pervious Concrete
May, 2017
well as compressive strength testing. The required specimens were cast during PC placement on
the Vashon Island Ferry Terminal on two paving days in summer 2016. In evaluating the tests
mentioned above, the suitability of the method of casting specimens in the field and the effects of
cylinder size and curing conditions on 28-day compressive strength of PC was investigated. Four
curing categories of four weeks of air curing (4A), three weeks of air and one week of moist
curing (3A1M), two weeks of air and two weeks of moist curing (2A2M), and one week of air
and two weeks of moist curing (1A3M) were evaluated in the study. The main findings from the
study are:
The two cylinder sizes cast from the tested mixture demonstrated close values in porosity
(around 16 percent on average) and hardened density (around 131.5 lb/ft3 on average.) This
finding for the cylinders tested in this study implies that either cylinder size may be cast for
evaluation of hardened density and porosity. More testing in future projects can further confirm
this finding.
The hardened density of both cylinder sizes agreed with the fresh density determined in the field
during placement (maximum difference of two percent.) This observation confirms that the
implemented casting and compaction method was suitable in casting specimens that represented
the target density in the field. The method described in this report is recommended to cast and
compact specimens for strength testing.
The average infiltration rates were 804 and 689 in/h for 4- and 6-in cylinders respectively,
which is within the accepted range for PC. The 6-in cylinders demonstrated lower and more
uniform infiltration rates on average comparing to the 4-in cylinders because they were cast and
compacted in three lifts versus two lifts for 4-in cylinders.
Four-in cylinders showed higher values of 28-day f’c, compared to 6-in cylinders by 7.7-19
percent. Based on the tested specimens in this study, the 28-day f’c of 6-in cylinders can be
obtained by multiplying the test results of 4-in cylinders by a correlation factor of 1.13. More
testing is required to further populate the developed database and suggest a reliable correlation
coefficient between the strength of the two cylinder sizes.
Curing category 2A2M resulted in the highest value of 28-day f’c, while the specimens from
curing category 4A had the lowest strengths. Overall, air curing resulted in a relatively low
standard deviation in f’c, and minimal C-S-H and Ca(OH)2 loss according to TGA testing.
60
A.60 Preliminary Study to Develop
Guidance Tests for Pervious Concrete
May, 2017
However, two weeks of air and two weeks of moist curing yielded the highest f’c, and a
comparatively low standard deviation. Further, TGA testing showed that longer moist curing
leads to more loss of C-S-H and Ca(OH)2. Therefore, two weeks of air and two weeks of moist
curing appear to provide the highest and most reliable test results for strength testing of PC,
based on the specimens tested in this study. More testing is required to confirm this
recommendation as the proper curing method for PC strength testing.
During compressive strength testing, the 4- and 6-in cylinders most commonly failed in shear
and side fracture, respectively. The two cylinder sizes generally showed different modes of
failure, which was most likely caused by the difference in the compaction method of two lifts for
4- versus three lifts for 6-in cylinders.
This preliminary study showed that fresh density, hardened density/porosity and hardened
infiltration rate are simple tests that can provide insightful information regarding quality of the
PC mixture. Compressive strength testing on properly cast and cured specimens, tested at a
modified loading rate can provide reliable evaluation information. In order to confirm the
recommendations in this study for sampling, curing and testing of PC future research should
include testing of a variety of PC mixtures using a sufficient number of specimens. Based on the
results of this study, future assessment of weight loss in PC paste caused by the prolonged
exposure to water is recommended, especially considering the extended exposure of PC
pavements to stormwater runoff.
FUTURE RESEARCH
This study was a preliminary step towards identifying suitable tests for quality acceptance of
pervious concrete. The study’s duration was limited to one summer and one paving project and
two paving dates. Therefore, the study was limited to testing one pervious concrete mixture and
therefore a restricted number of tested specimens. Future research needs to include additional
mixture designs to add to the database of test results in this study to develop robust inter-
relations between the tested properties and finally develop standardized testing protocols. Other
strength properties such as flexural strength and modulus of elasticity that are required in the
pavement design should also be established for a variety of mixture designs.

61
A.61 Preliminary Study to Develop
Guidance Tests for Pervious Concrete
May, 2017
ACKNOWLEDGEMENTS
Authors express their gratitude to Washington State Department of Transportation (WSDOT)
for the funding provided for this study and their close cooperation in the field. Mr. Olivier
Richer, Jim Weston, Mark Russell and Jeff Uhlmeyer are acknowledged for their assistance and
support.
62
A.62 Preliminary Study to Develop
Guidance Tests for Pervious Concrete
May, 2017
REFERENCES
ACI. 522R-10. 2010. Report on Pervious Concrete. ACI Committee, 522.
ACI. 522R-13. 2013. Report on Pervious Concrete. ACI Committee.522.
Aitcin, P. C., Miao, B., Cook, W. D., & Mitchell, D. (1994). Effects of size and curing on
cylinder compressive strength of normal and high-strength concrete. Materials Journal, 91(4),
349-355.
ASTM. C39/C39M-05, 2005, Standard Test Method for Compressive Strength of Cylindrical
Concrete Specimens, ASTM International, West Conshohocken, PA, 2005, DOI: 10.1520/
C0039_C0039M-05E01.
ASTM C192/C192M-15. Standard Practice for Making and Curing Concrete Test Specimens in
the Laboratory, ASTM International, West Conshohocken, PA, 2015, DOI: 2 10.1520/
C0192_C0192M-15.
ASTM C944/C944M-12, Abrasion Resistance of Concrete or Mortar Rotating-Cutter Method,
ASTM International, West Conshohocken, PA, 2012, DOI: 2 10.1520/C0944_C0944M-12.
ASTM C1701/C1701M-09, Standard Test Method for Infiltration Rate of In Place 1 Pervious
Concrete, ASTM International, West Conshohocken, PA, 2009, DOI: 2
10.1520/C1701_C1701M-09.
ASTM C1754/C1754M-12, Standard Test Method for Density and Air Void Content of Pervious
Concrete, ASTM International, West Conshohocken, PA, 2012, DOI: 10.1520/C1754_C1754M-
12.
ASTM. C31/C31-M, 2012, Standard Practice for Making and Curing Concrete Test Specimens
in the Field, ASTM International, West Conshohocken, PA, 2015, DOI: 10.1520/C0031-12.
ASTM. C1688/C1688-M, 2014, Standard Test Method for Density and Void Content of Freshly
Mixed Pervious Concrete, ASTM International, West Conshohocken, PA, 2014, DOI:
10.1520/C1688-14.
Bajza, A., & Rouseková, I. (1983). Effect of heat treatment conditions on the pore structure of
cement mortars. Cement and Concrete Research, 13(5), 747-750.

63
A.63 Preliminary Study to Develop
Guidance Tests for Pervious Concrete
May, 2017
Carde, C., & François, R. (1997). Effect of the leaching of calcium hydroxide from cement paste
on mechanical and physical properties. Cement and Concrete Research, 27(4), 539-550.
Carde, C., François, R., & Torrenti, J. M. (1996). Leaching of both calcium hydroxide and CSH
from cement paste: Modeling the mechanical behavior. Cement and concrete research, 26(8),
1257-1268.
CRMCA–Colorado Ready Mixed Concrete Association. (2009). Specifier’s Guide for Pervious
Concrete Pavement Design–Version 1.2. 24p.
Dong, Q., Wu, H., Huang, B., Shu, X., & Wang, K. (2012). Investigation into laboratory
abrasion test methods for pervious concrete. Journal of Materials in Civil Engineering, 25(7),
886-892.
Eisenberg, B., Lindow, K. C., & Smith, D. R. (Eds.). (2015). Permeable Pavements. American
Society of Civil Engineers.
Haselbach, L., Boyer, M., Kevern, J., & Schaefer, V. (2011). Cyclic heat island impacts on
traditional versus pervious concrete pavement systems. Transportation Research Record: Journal
of the Transportation Research Board, (2240), 107-115.
ISO 177851-1:2016. Testing Methods for Pervious Concrete--Part 1: Infiltration Rate. ISO:
Geneva, Switzerland.
Kevern, J. T., Haselbach, L., & Schaefer, V. R. (2012). Hot weather comparative heat balances
in pervious concrete and impervious concrete pavement systems. Journal of Heat Island Institute
International Vol, 7(2).
Kevern, J. T., Schaefer, V. R., Wang, K., & Suleiman, M. T. (2008). Pervious concrete mixture
proportions for improved freeze-thaw durability. Journal of ASTM International, 5(2), 1-12.
NRMCA. Pervious in Practice: Methods, Materials and Mixtures, National Ready Mixed
Concrete Association (NRMCA), Silver Spring, MD, www.nrmca.org, 2016.
Grace Concrete Products, G. C. V- MAR VSC500, Rheology Modifying Admixture for Pervious
Concrete, 2010. Available from https://grace.com/construction/en-us/concrete-technology/V-
MAR-VSC500.
Grace Concrete Products, Recover, Hydration Stabilizer, 2013.

64
A.64 Preliminary Study to Develop
Guidance Tests for Pervious Concrete
May, 2017
Available from https://gcpat.com/construction/en-us/Documents/Recover-5J_Recover.pdf.
Rangelov, M., Nassiri, S., Haselbach, L., & Englund, K. (2016). Using carbon fiber composites
for reinforcing pervious concrete. Construction and Building Materials, 126, 875-885.
Tennis, P. D., Leming, M. L., & Akers, D. J. (2004). Pervious concrete pavements (No. PCA
Serial No. 2828). Skokie, IL: Portland Cement Association.
Vandegrift, D., & Schindler, A. (2006). The effect of test cylinder size on the compressive
strength of sulfur capped concrete specimens. Highway Research Center and Department of
Civil Engineering at Auburn University, 83.
Washington Aggregate and Concrete Association: Pervious Concrete. Retrieved
from: http://www.washingtonconcrete.org/pervious-concrete, October 2016.
WSDOT: Vashon Ferry Terminal Construction Lanes Layout. Available from
http://www.wsdot.wa.gov/NR/rdonlyres/E29345CD-175B-4F41-939F-
22153AED457E/0/VashonPhase3_FINAL_041916.pdf

Preliminary Study to Develop
Guidance Tests for Pervious Concrete
May, 2017 A.24
APPENDIX This chapter contains the load-displacement curves of the 6-in cylinders from three curing categories.
Curing category 4A
Curing category 2A2W

Preliminary Study to Develop
Guidance Tests for Pervious Concrete
May, 2017 A.24
Curing category 3A1W
Americans with Disabilities Act (ADA) Information: This material can be made available in an alternate format by emailing the Office of Equal Opportunity at [email protected] or by calling toll free, 855-362-4ADA(4232). Persons who are deaf or hard of hearing may make a request by calling the Washington State Relay at 711.
Title VI Statement to Public: It is the Washington State Department of Transportation’s (WSDOT) policy to assure that no person shall, on the grounds of race, color, national origin or sex, as provided by Title VI of the Civil Rights Act of 1964, be excluded from participation in, be denied the benefits of, or be otherwise discriminated against under any of its federally funded programs and activities. Any person who believes his/her Title VI protection has been violated, may file a complaint with WSDOT’s Office of Equal Opportunity (OEO). For additional information regarding Title VI complaint procedures and/or information regarding our non-discrimination obligations, please contact OEO’s Title VI Coordinator at (360) 705-7082.