preferential trade agreements and antidumping protection · are preferential trade agreements...
TRANSCRIPT
Preferential Trade Agreements andAntidumping Protection�
Chrysostomos TabakisKDI School of Public Policy and Management
Maurizio ZanardiLancaster University Management School
November 2017
Abstract
Are preferential trade agreements (PTAs) stumbling blocks or building blocks towardsmultilateral trade liberalization? We address this question by investigating the e¤ectsof the negotiation and implementation of PTAs on the use of antidumping (AD) (i.e.,the most common form of contingent trade protection) by member countries againstnon-members, as there has been a concurrent surge in global AD activity and region-alism since the 1990s. Theoretically derived empirical predictions are supported by theempirical analysis based on the 15 most intense users of AD. The results demonstratethat both the negotiation and the implementation of PTAs lead to fewer AD measuresagainst non-member countries, except for members of active customs-union agreementsfacing large import surges. Thus, our results highlight a building-block e¤ect of PTAson multilateral trade cooperation when it comes to AD protection.
Keywords: Preferential trade agreements; antidumping; multilateral cooperation.JEL classi�cation: F13; F14; F15.
�The authors would like to thank Haftom Teferi, Araya Mebrahtu Teka, and Luis Carlos Vargas for ex-cellent research assistance. The authors would also like to thank Xianwen Chen, Mark Melatos, PascalisRaimondos, John Romalis, Keuk-Je Sung, and participants at FIW-Workshop (Vienna), at a workshop of theAsia Global Institute (Hong Kong), at the Conference on the Economic of Global Interactions (Bari), at theEuropean Trade Study Group Conference (Florence), and at seminars at KDI School of Public Policy andManagement, at Kyung Hee University Institute of International Studies, at the University of Sydney and atthe Queensland University of Technology for very helpful comments and suggestions. Chrysostomos Tabakisgratefully acknowledges �nancial support from the KDI School of Public Policy and Management.Corresponding author: Chrysostomos Tabakis: KDI School of Public Policy and Management, 263 Namsejong-ro, Sejong City 30149, South Korea. Telephone: +82�44�550�1024. E-mail: [email protected]
1 Introduction
The world has witnessed an astounding proliferation of preferential trade agreements (PTAs)
since the early 1990s. According to the World Trade Organization (WTO), as of May 2017,
the number of noti�ed active PTAs stands at 274, with all WTO members being members of
at least one PTA in force.1 This �gure is in fact likely to increase in the near future as many
WTO members are currently involved in negotiations for new PTAs. A second major trend
that has dominated international commercial policy over the same period is the dramatic
increase in antidumping (AD) activity. Although the stated objective of AD is to eliminate
the injurious e¤ect of dumping (i.e., exporting a product at less than fair value), its application
in practice has nothing to do with maintaining a �fair�trading environment. AD �is simply a
modern form of protection�(Blonigen and Prusa, 2003), which is nowadays used on a regular
basis by a large number of developed and developing countries.2
In this paper, we examine empirically the implications of PTAs for the AD activity of
PTA members against non-member countries. This is an important endeavor for two reasons.
First, there is ongoing concern that PTAs might be �stumbling blocks�rather than �building
blocks�towards multilateral trade liberalization. In this regard, given the worldwide decrease
in applied tari¤ rates and the prominent role that AD plays in modern commercial policy, it is
of particular importance to understand the rami�cations of PTAs for their member countries�
�external�AD activity (i.e., the AD activity of PTA members against non-members). Second,
given the concurrent surge in global AD activity and regionalism, it might be tempting to
interpret a simple correlation as evidence of a causal link.
To guide our empirical strategy, we rely on the theoretical work by Tabakis (2010, 2015) in
order to derive testable predictions. These papers explore the implications of the (symmetric)
formation of, respectively, customs unions (CUs) and free-trade areas (FTAs) for contingent
protection. Both papers employ a dynamic game of trade-policy setting, in which countries
are limited to cooperative multilateral agreements that are self-enforcing and the economic
environment is characterized by exogenous trade-volume volatility. Restricting our attention
1See https://www.wto.org/english/tratop_e/region_e/region_e.htm.2Economists would agree that AD is justi�ed in the case of predatory dumping whose objective is to drive
out domestic producers for exporters to acquire a dominant position resulting in price increases. However,predatory motives are mostly absent and they are not necessary to introduce AD measures.
1
to AD measures, which is the focus of our paper, three main testable predictions emerge from
Tabakis (2010, 2015): (i) the number of AD measures of members against non-members of
an FTA agreement should decrease both during its negotiation and after its implementation;
(ii) the number of AD measures of members against non-members of a CU agreement should
decrease during its negotiation; and (iii) the number of AD measures of members against non-
members of a CU agreement should increase following its implementation for �high�import
volumes, whereas the reverse is true for �low�volumes of imports.
To empirically test these predictions, we carry out an extensive data collection process as
we gather data on six events for a large number of PTAs. In particular, we collect the dates
of the following events for each PTA in our sample: (i) initiation of process; (ii) formal launch
of negotiations; (iii) conclusion of negotiations; (iv) signature of agreement; (v) rati�cation
of agreement; and (vi) entry into force of agreement. Using then AD data over the period
1980�2015 and di¤erent econometric strategies, our results do provide clear support to the
aforementioned theoretical predictions. Both the negotiation and implementation of PTAs
have a signi�cant e¤ect on the extent of AD use of PTA members vis-à-vis non-member
countries. What is more important, PTAs generally have a dampening e¤ect on their members�
AD activity against the rest of the world, except when members of an implemented CU
agreement face substantial import growth, which is in line with the theoretical predictions of
Tabakis (2010). In brief, our results suggest that with one notable exception (i.e., CUs in force
facing a substantial growth of imports), PTAs seem to be building blocks towards multilateral
trade cooperation as far as AD protection is concerned.
Only three papers look (to the best of our knowledge) at the empirical e¤ects of PTAs on
AD. Ahn and Shin (2011) look at the e¤ects of FTAs on the intra-FTA AD �lings of major
AD users over 1995�2009, and �nd that FTAs inversely a¤ect AD investigations within the
boundary of FTA membership. In comparison, Silberberger and Stender (2016) explore the
impact of PTAs on the use of bilateral AD measures over the period 1991�2014, while explic-
itly considering the degree of intra-bloc tari¤ liberalization. They �nd that PTAs generally
reduce the likelihood of AD activity among PTA members, but an improvement in the relative
tari¤ treatment among fellow integration partners leads to a higher likelihood of bilateral AD
activity than an equal improvement among non-integration trading partners. Finally, Prusa
2
and Teh (2010), which is the paper closest in spirit to ours, investigate the rami�cations of
PTAs for both intra-PTA AD �lings and AD �lings against non-member countries. They
�nd that AD provisions in PTAs decrease the incidence of intra-PTA AD cases, but increase
the number of �lings against non-PTA members. We di¤er from these papers in two major
respects. First, we distinguish between the negotiation and the implementation phases of
PTAs. Second, we distinguish between FTAs and CUs. As the theoretical models by Tabakis
(2010, 2015) suggest and our empirical analysis veri�es, both distinctions are critical in order
to get deeper insights into the rami�cations of PTAs for AD protection.
Our paper is also naturally related to the (empirical) literature on whether PTAs are
building blocks or stumbling blocks towards multilateral tari¤ liberalization. Some studies
provide evidence in support of a building-block e¤ect of PTAs (e.g., Estevadeordal et al.,
2008), whereas others o¤er evidence showing that PTAs are stumbling blocks towards tari¤
liberalization at the multilateral level (e.g., Limão, 2006; Karacaovali and Limão, 2008). Our
work clearly complements these papers. Moreover, it demonstrates that in order to get a
more thorough picture regarding the implications of regionalism for the multilateral trading
system, other policy instruments besides most-favored-nation tari¤s should be taken into
consideration.
The remainder of the paper is organized as follows. Section 2 provides a non-technical
presentation of the theoretical framework that can be used to model the issues under inves-
tigation. The empirical predictions that follow from this framework and how they can be
econometrically tested are discussed in Section 3. Section 4 is dedicated to the description
of the data, with an emphasis on the extensive data collection undertaken to systematically
record the various phases (i.e., initiation of process, launch of negotiations, conclusion of ne-
gotiations, signature, rati�cation, and entry into force) of a PTA. The empirical results are
discussed in Section 5, together with a quanti�cation of their implications on the use of AD
and several robustness checks. Section 6 concludes.
3
2 Theoretical Framework
As we discussed in the introduction, our main goal in this paper is to empirically examine
the impact of PTAs on their members��external�AD activity (i.e., the AD activity of PTA
members against non-member countries). To this end, we rely on the theoretical work by
Tabakis (2010, 2015) to derive testable predictions. Tabakis (2010) looks at the rami�cations
of symmetric CU formation for multilateral trade cooperation, while the companion paper,
Tabakis (2015), focuses on FTAs. The analysis in both papers rests on two main assump-
tions, which are common in the literature on trade agreements. First, countries are limited to
self-enforcing multilateral agreements, i.e., agreements that balance for each country its short-
term terms-of-trade gains from defection from the agreed-upon policies against the long-term
welfare losses due to its trading partners� retaliation.3 Second, the economic environment
is characterized by exogenous trade-volume volatility. As a result, �special� protection (or
contingent protection� the two terms will be used interchangeably below) becomes an indis-
pensable on-equilibrium-path safety valve, allowing countries to maintain multilateral cooper-
ation amid volatile trade swings. More speci�cally, a trade agreement should allow countries
to temporarily raise their cooperative level of protection� via using special protection� when
facing signi�cant import-volume surges so that their incentive to defect is kept in check and
multilateral cooperation does not break down.4
Tabakis (2010) demonstrates, in the context of a competing-importers model, that the
parallel initiation of di¤erent CU negotiations leads to an easing of multilateral trade ten-
sions, especially with respect to the employment of special protection. Intuitively, this stems
from the market-power e¤ect of CU establishment due to the harmonization of the member
countries�external trade policies. In particular, a CU, relative to any of its member states
taken individually, enjoys more substantial market power (i.e., a greater ability to a¤ect world
prices) and can, therefore, credibly threaten to punish more harshly any deviation from the
cooperative course.5 As a result, as countries enter (symmetrically) into CU talks and the
3See Bagwell and Staiger (2002) for an in-depth analysis of enforcement issues within the context ofGATT/WTO.
4See the seminal work by Bagwell and Staiger (1990) for further elaboration on this result. Bown andCrowley (2013) provide empirical evidence in support of this theoretical prediction.
5For empirical evidence that terms-of-trade or market-power considerations do play a signi�cant role intrade policy formulation, see Broda et al. (2008) and Bagwell and Staiger (2011).
4
establishment of di¤erent CUs becomes (more) likely, the expected discounted value of future
multilateral cooperation increases. At the same time, countries�static incentive to defect from
the cooperative agreement remains una¤ected as it is only a function of current trade pat-
terns, upon which the mere initiation of CU talks has no e¤ect. Thus, in comparison with the
pre-CU-negotiations period, a more liberal multilateral trading environment is now feasible
as countries are less inclined to violate multilateral cooperation and revert to protectionist
stances.
This bene�cial e¤ect of CU formation on multilateral cooperation is, however, temporary.6
Once the negotiations are over and the CU agreements come into force, countries�static in-
centive to deviate from the cooperative path also intensi�es, and thereby, a more protectionist
trading environment resurfaces. The reason is that the CUs can more e¤ectively manipulate
the terms of trade to their advantage than can any of their member countries when viewed in
isolation. An important �nding that emerges from the analysis of Tabakis (2010) is that in
comparison with the pre-CU world (i.e., a world where there are no CU negotiations in the
near horizon), the employment of contingent protection in the post-CU world is more severe
for �high�import volumes, but is less frequent overall in the sense that a higher import-volume
surge is required to warrant its use (on the equilibrium path).
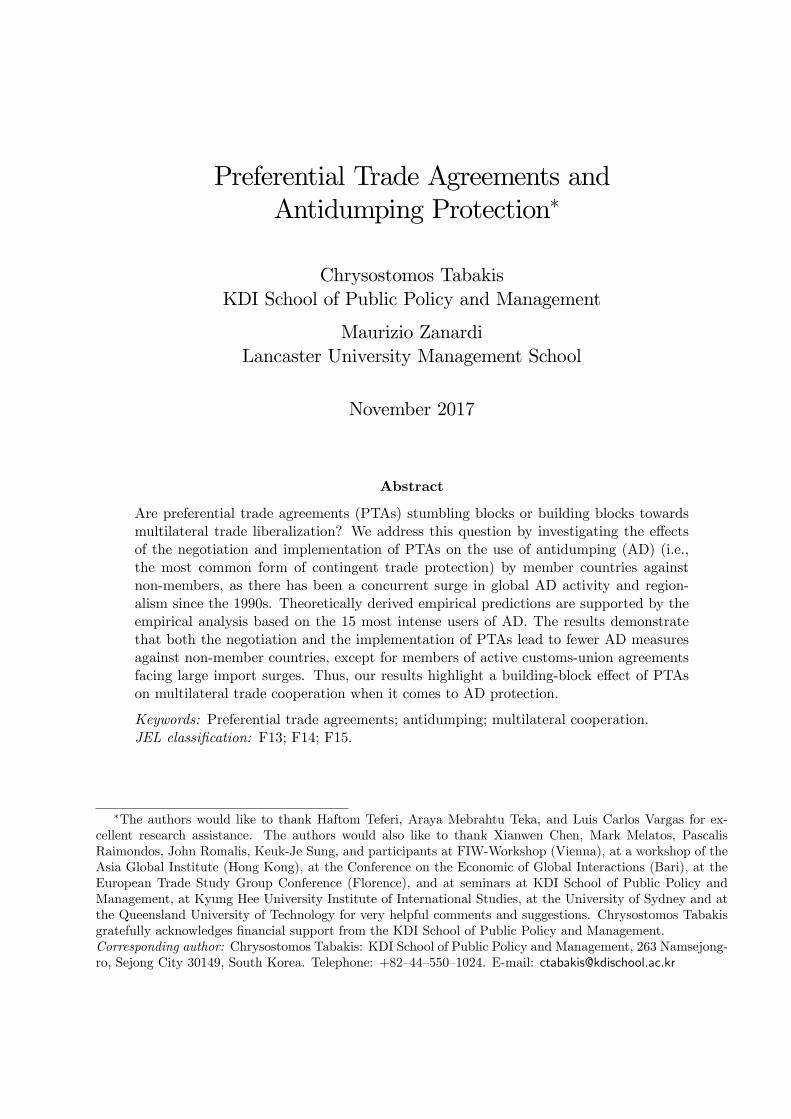
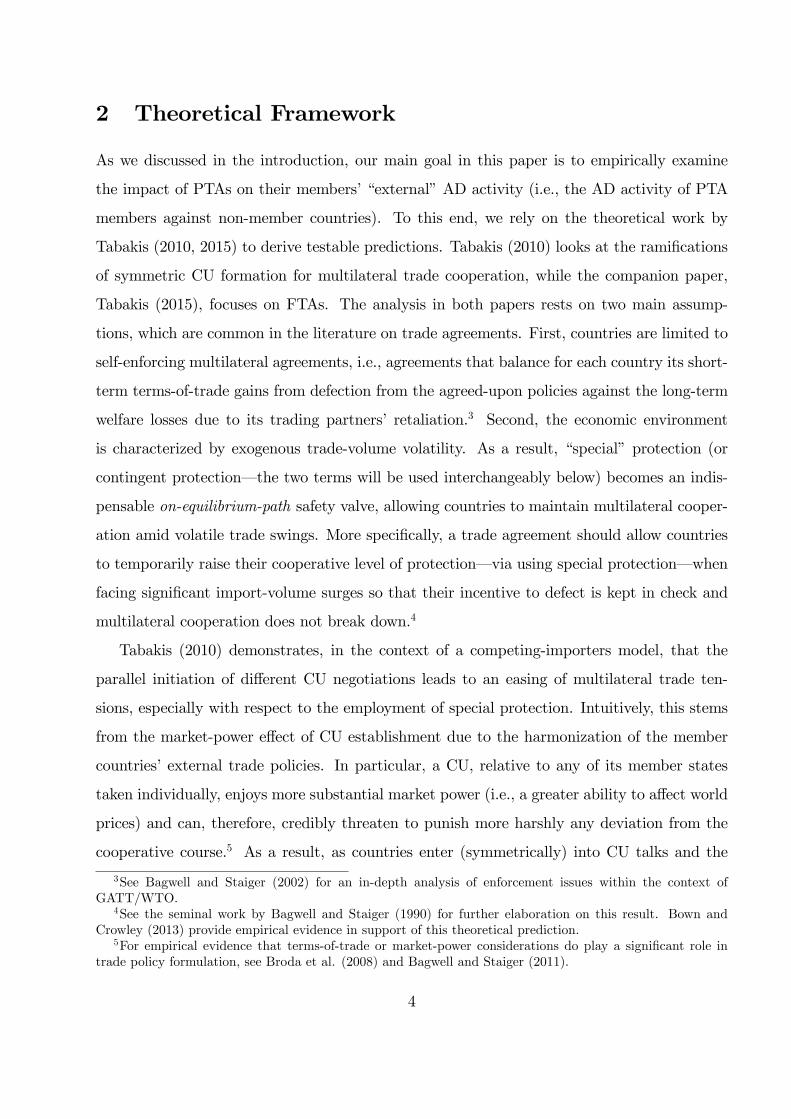
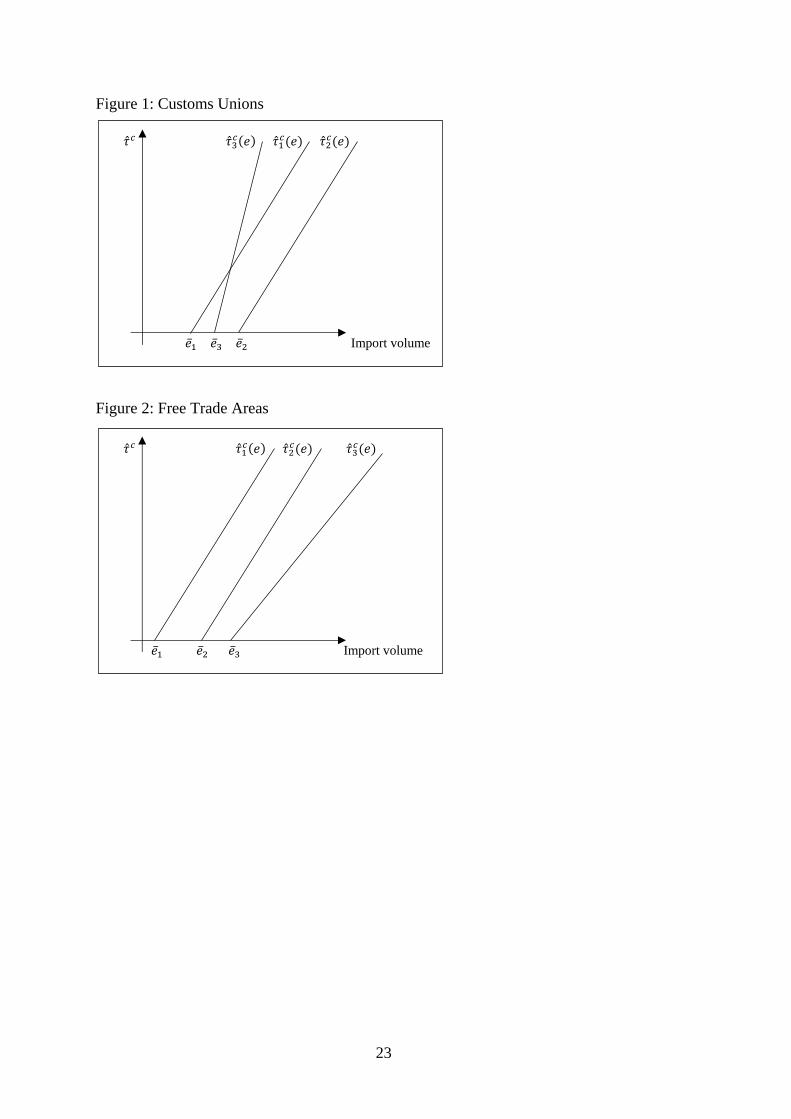
These theoretical results are illustrated in Figure 1, which depicts the most cooperative
level of protection (b� c) than can be sustained multilaterally (i.e., between countries not partof the same CU) as a function of the import volume. Notice that e refers to the common
trade shock encountered by all countries in a given period, while e refers to the critical trade-
shock threshold (or, equivalently, import-volume threshold) above which the employment
of contingent protection becomes necessary so that multilateral cooperation does not break
down. Considering the various phases the countries�trading relationship passes through, b� c1represents the (most cooperative) equilibrium trade-protection function in the pre-CU world,
while b� c2 refers to the corresponding one during the CU-negotiations phase. As b� c2 is to the rightof and parallel to the original curve, this implies that above the threshold e1, the same level
of imports will induce lower protectionist pressures (i.e., fewer AD measures) once countries
6It is in fact maximized as the successful conclusion of the CU talks and the ensuing implementation ofthe CU agreements draw near.
5
enter into CU talks. However, once the di¤erent CUs are implemented, the b� c curve shiftsto the left and becomes steeper (see b� c3). Therefore, as compared with the pre-CU world,
less (more) protectionist trade policies will be implemented at the multilateral level in the
post-CU world for low (high) import volumes.
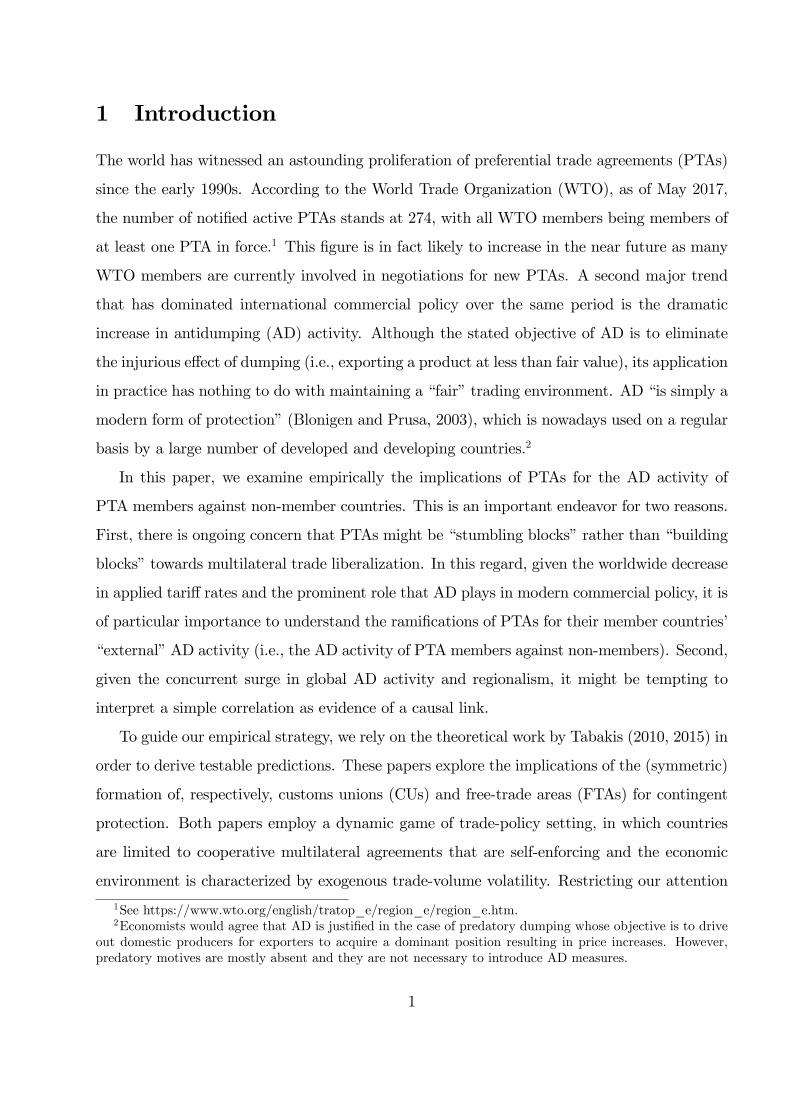
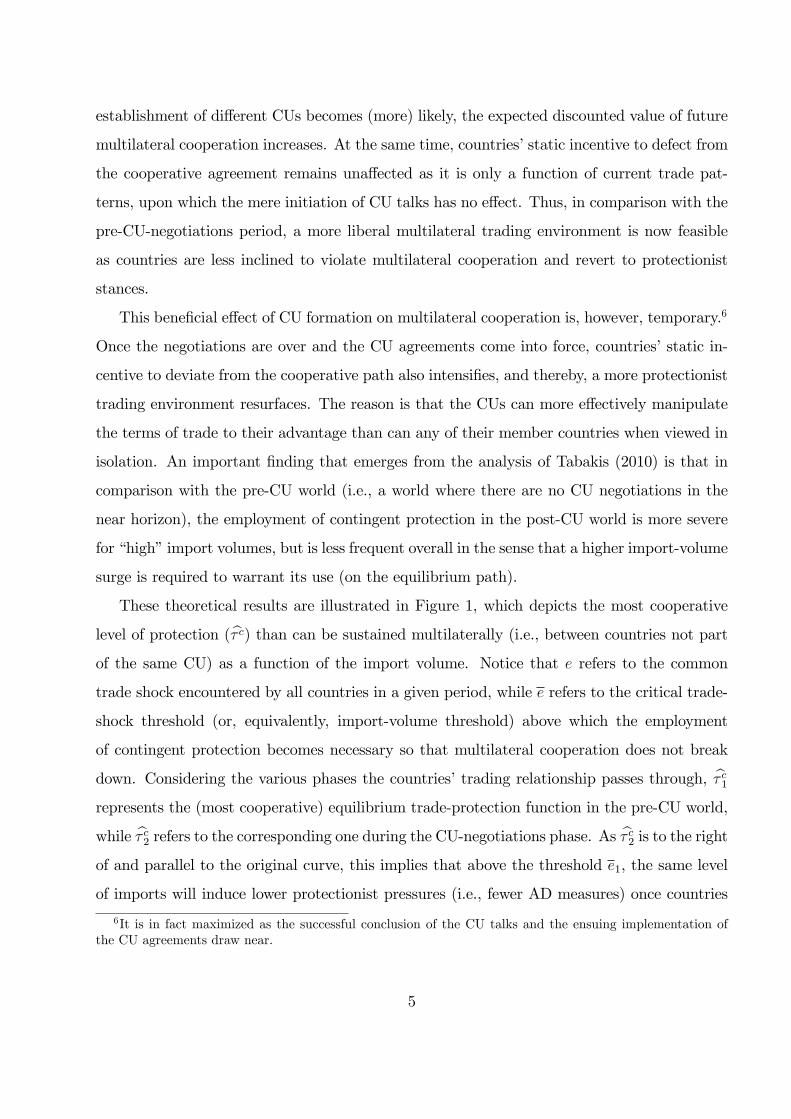
In his follow-up paper, Tabakis (2015) explores the implications of FTA agreements for
special protection in the context of a model similar to the aforementioned one. He shows
that the parallel formation of di¤erent FTAs leads to a gradual but permanent easing of trade
tensions at the multilateral level, especially regarding the use of special-protection instruments.
The intuition underlying this �nding is straightforward. The FTA agreements induce trade
diversion, lowering the volume of trade between FTA partners and non-partner countries.
This has a dampening e¤ect on countries� static incentive to defect from the cooperative
course, allowing for a less protectionist international trading environment to come forth. In
fact, a relatively liberal environment can be maintained also during the FTA negotiations, as
the prospective emergence of di¤erent FTAs with the accompanying reduction in multilateral
trade barriers raises the expected discounted value of future cooperation, while leaving the
short-term terms-of-trade gains from increased protection una¤ected.
Again, these theoretical results can be illustrated in a way similar to the CU case. Figure
2 shows such a representation where the b� c curves can be read in the same way as in Figure1. As in the CU scenario, b� c2 lies to the right of b� c1, but b� c3 is now farther to the right and�atter than both b� c1 and b� c2. Thus, there is a gradual but continuous easing of protectionistpressures as countries negotiate and then implement di¤erent FTA agreements. Actually, once
the FTAs are established, the decrease in protectionism multilaterally will be even larger as
compared with the corresponding e¤ect of the launch of FTA negotiations.
3 Empirical Predictions and Methodology
The theoretical framework described in the previous section leads to a number of testable
predictions regarding the interaction between the negotiation and implementation of PTAs
and the use of contingent trade instruments. Among those that qualify as such, AD measures
are the ones that are being used the most extensively around the world thanks to their
6
�exibility: they are relatively easy to administer, and a case for their introduction is not
that di¢ cult to meet the necessary legal conditions. Countervailing duties and safeguards
also fall in this category, but they are not used as extensively because of the more stringent
conditions that must be ful�lled. For example, Bown and Crowley (2016, Table 5) report
several statistics related to the share of a country�s imports covered by di¤erent contingent
measures over the period 1995�2013. Their statistics demonstrate that AD is the favoured
instrument and when countervailing duties and safeguards are used, they often cover the same
products also targeted by AD. It is only for China, the EU, Turkey, and the United States
that other instruments have had a meaningful impact on trade, but even in these cases, only
in some short time periods (see Table 5 and Figure 10 in Bown and Crowley, 2016).
Thinking of AD measures as the instrument, the theoretical models by Tabakis (2010,
2015) lead to the following testable predictions:
1. The number of AD measures of members against non-members of an FTA agreement
should decrease both during its negotiation and after its implementation;
2. The number of ADmeasures of members against non-members of a CU agreement should
decrease during its negotiation;
3. The number of ADmeasures of members against non-members of a CU agreement should
decrease (increase) following its implementation for low (high) import volumes.
In order to assess these predictions, we proceed in two steps. First, we evaluate whether
the negotiation and implementation of PTAs a¤ect the introduction of AD measures by PTA
members against non-member countries, without distinguishing between FTAs and CUs. This
serves as a preliminary stage to understand whether there is any prima facie evidence in the
data of the e¤ects that should manifest as a result of the establishment of PTAs. Notice that
a lack of evidence on the e¤ect of PTA implementation on AD may be due to the somewhat
opposite e¤ects that FTAs and CUs may display (as a function of the import volume), while
there should be a clear e¤ect of PTA negotiation on AD employment since the negotiation of
both FTAs and CUs should lead to fewer AD measures against non-negotiating countries. In
the second step, the three predictions are individually tested by considering the di¤erential
7
e¤ects when FTAs and CUs are implemented, also allowing for an interaction e¤ect between
the two types of PTAs and the change in the volume of imports.
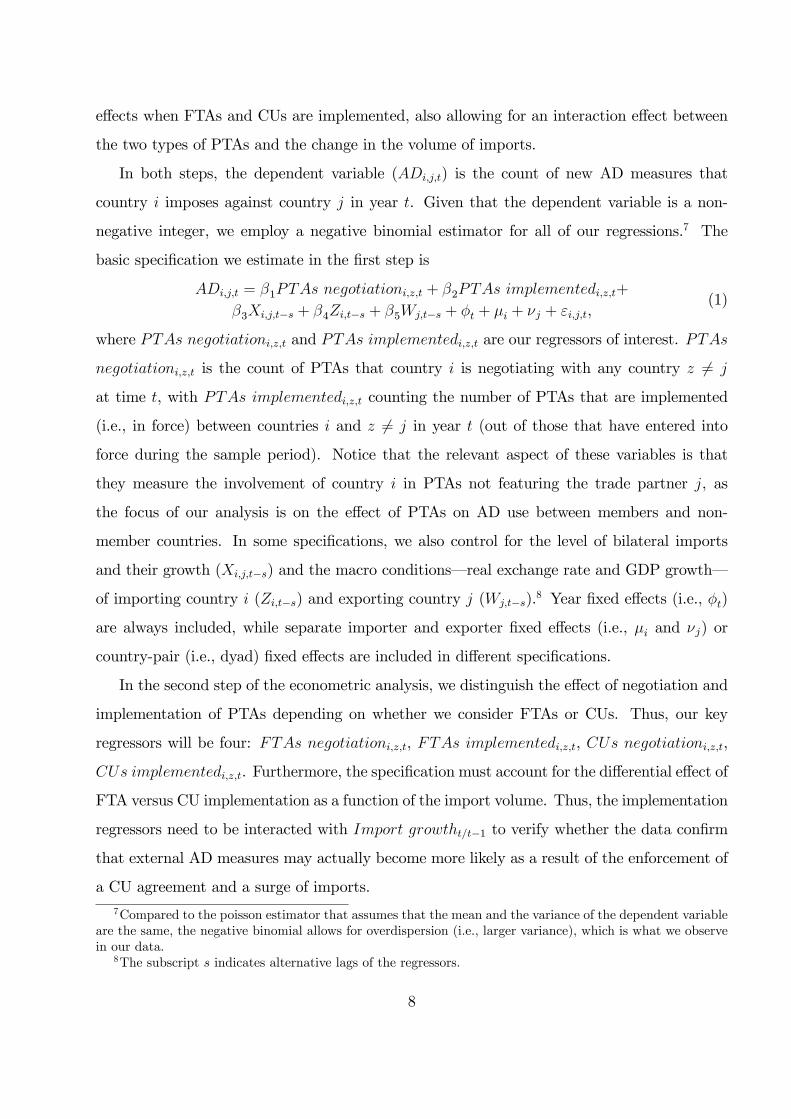
In both steps, the dependent variable (ADi;j;t) is the count of new AD measures that
country i imposes against country j in year t. Given that the dependent variable is a non-
negative integer, we employ a negative binomial estimator for all of our regressions.7 The
basic speci�cation we estimate in the �rst step is
ADi;j;t = �1PTAs negotiationi;z;t + �2PTAs implementedi;z;t+
�3Xi;j;t�s + �4Zi;t�s + �5Wj;t�s + �t + �i + �j + "i;j;t,(1)
where PTAs negotiationi;z;t and PTAs implementedi;z;t are our regressors of interest. PTAs
negotiationi;z;t is the count of PTAs that country i is negotiating with any country z 6= j
at time t, with PTAs implementedi;z;t counting the number of PTAs that are implemented
(i.e., in force) between countries i and z 6= j in year t (out of those that have entered into
force during the sample period). Notice that the relevant aspect of these variables is that
they measure the involvement of country i in PTAs not featuring the trade partner j, as
the focus of our analysis is on the e¤ect of PTAs on AD use between members and non-
member countries. In some speci�cations, we also control for the level of bilateral imports
and their growth (Xi;j;t�s) and the macro conditions� real exchange rate and GDP growth�
of importing country i (Zi;t�s) and exporting country j (Wj;t�s).8 Year �xed e¤ects (i.e., �t)
are always included, while separate importer and exporter �xed e¤ects (i.e., �i and �j) or
country-pair (i.e., dyad) �xed e¤ects are included in di¤erent speci�cations.
In the second step of the econometric analysis, we distinguish the e¤ect of negotiation and
implementation of PTAs depending on whether we consider FTAs or CUs. Thus, our key
regressors will be four: FTAs negotiationi;z;t, FTAs implementedi;z;t, CUs negotiationi;z;t,
CUs implementedi;z;t. Furthermore, the speci�cation must account for the di¤erential e¤ect of
FTA versus CU implementation as a function of the import volume. Thus, the implementation
regressors need to be interacted with Import growtht=t�1 to verify whether the data con�rm
that external AD measures may actually become more likely as a result of the enforcement of
a CU agreement and a surge of imports.7Compared to the poisson estimator that assumes that the mean and the variance of the dependent variable
are the same, the negative binomial allows for overdispersion (i.e., larger variance), which is what we observein our data.
8The subscript s indicates alternative lags of the regressors.
8
The possible e¤ects of PTA negotiation and implementation on their members�external AD
activity are identi�ed through di¤erent variation in the data, depending on whether importer
and exporter or dyad �xed e¤ects are used. The use of country-pair �xed e¤ects makes for the
most demanding speci�cation, as any time-invariant country-pair heterogeneity is absorbed
by the �xed e¤ect and any signi�cance of the coe¢ cients of interest (i.e., �1 and �2) is derived
by variation within the country pair due to di¤erent PTAs in which the importing country
is involved over time (in terms of negotiations and implementations). If this is the cleanest
form of identi�cation in that it account for any unobservable (non time-varying) country-pair
determinant, the non-linear nature of the estimator forces us to drop any country pair in
which no single AD measure has ever been introduced by the importing country against the
trade partner in question during the sample period. Some of these country pairs should be
dropped from the estimation because they are such that AD measures are highly unlikely (e.g.,
very small exporting country or high inter-industry trade �ows). However, country pairs may
be excluded when a zero for AD measures is a �true� zero: it happens to be zero but AD
measures could have occurred. The use of separate importer and export �xed e¤ects provides
an alternative identi�cation strategy, which does not exclude these observations. In this case,
only importing countries that have used AD at some point during the sample (against any
trade partner) are included but this is not a limitation since we do want to restrict the analysis
to active and intense users of AD.
When including dyad �xed e¤ects, these e¤ects are estimated instead of relying on a
conditional �xed-e¤ects estimator. In the latter case, a conditional likelihood function is
used so that the e¤ects are �conditioned out� of the likelihood function and do not need
to be estimated. Thus, this estimator is not equivalent to what is usually thought of as a
�xed-e¤ects estimator (i.e., there are no di¤erent intercepts). In fact, the coe¢ cients of time-
invariant variables could still be included and identi�ed in conditional �xed-e¤ects estimations.
The inclusion and estimation of dyad �xed e¤ects may give rise to inconsistent estimates due
to the incidental parameter problem in samples with short panels. However, Allison and
Waterman (2002) demonstrate that no such bias emerges.
Before moving to discussing the data and the results, a few observations are in order.
First of all, our key regressors (i.e., PTAs negotiationi;z;t and PTAs implementedi;z;t) only
9

take into consideration PTAs that a¤ect a minimum level of imports in the year before entry
into force, or if not yet in force, in the year before initiation of the negotiations. In fact, we
can reasonably expect that the mechanisms discussed in Section 2 are at play only if a PTA
a¤ects a signi�cant amount of trade, else the trade-diversion and market-power e¤ects would
not manifest themselves. Theory is silent on what �signi�cant�actually means in practice. In
the benchmark regressions, we assume this threshold to be 10%, but we discuss the sensitivity
of our results to lower thresholds in the robustness section.9
In terms of the sample, we do not include country pairs that are involved in the negotiation
or the enforcement of PTAs. In fact, our focus is on verifying whether PTAs have an e¤ect
on the use of contingent (i.e., AD) measures between member and non-member countries
depending on how the status of PTAs varies over time. Our empirical predictions focus on a
comparison of AD patterns before and after the negotiations and implementations of PTAs, not
a comparison of AD patterns within the PTAs vis-à-vis the AD patterns between member and
non-member countries (although we revisit this choice in the section on robustness checks).10
4 Data
In order to implement the econometric strategy discussed in the previous section, three sets
of data are needed. Comprehensive details on the various phases of PTAs is the �rst building
block and the one that proves the most di¢ cult to collect. Data on the use of AD is the
second building block, while trade and macro variables constitute the �nal set of data. In the
following, we discuss each of these datasets in turn.
Regarding PTAs, our full sample includes all trade agreements noti�ed to the GATT/WTO
that satisfy all of the following three conditions: (i) they have entered into force from 1980
onwards and are still active, or they are not yet in force but their negotiation has been
announced �early� to the WTO; (ii) they involve at least one of the 15 most intense users
of AD (to be de�ned below); and (iii) for their member countries identi�ed by condition (ii),
the intra-PTA import share is at least 0:2%. For these PTAs, we then carry out an extensive
9As expected, the e¤ects become less precisely estimated when using lower thresholds.10We exclude all PTAs as recorded by De Sousa (2012). In the case of negotiating country pairs, we exclude
those for which the import share a¤ected by the trade agreement is at least 1%.
10
data collection process as we gather for each of them the dates of the following events: (i)
initiation of process (e.g., the launching of a joint feasibility study or the expression of intention
to explore the possibility of a PTA); (ii) formal launch of negotiations; (iii) conclusion of
negotiations; (iv) signature of agreement; (v) rati�cation of agreement; and (vi) entry into
force of agreement. The information comes from a wide range of online sources, including (but
not limited to) the WTO, the European Commission, the European Parliament, the O¢ ce
of the United States Trade Representative, the Foreign Trade Information System (SICE)
of the Organization of American States, the Asia Regional Integration Center of the Asian
Development Bank, partner countries�o¢ cial sources (e.g., the Ministry of Foreign A¤airs
of South Korea or the Ministry of Commerce of China), or national legislative bodies (for
rati�cation dates). As a last resort, we use historical data from newspapers.
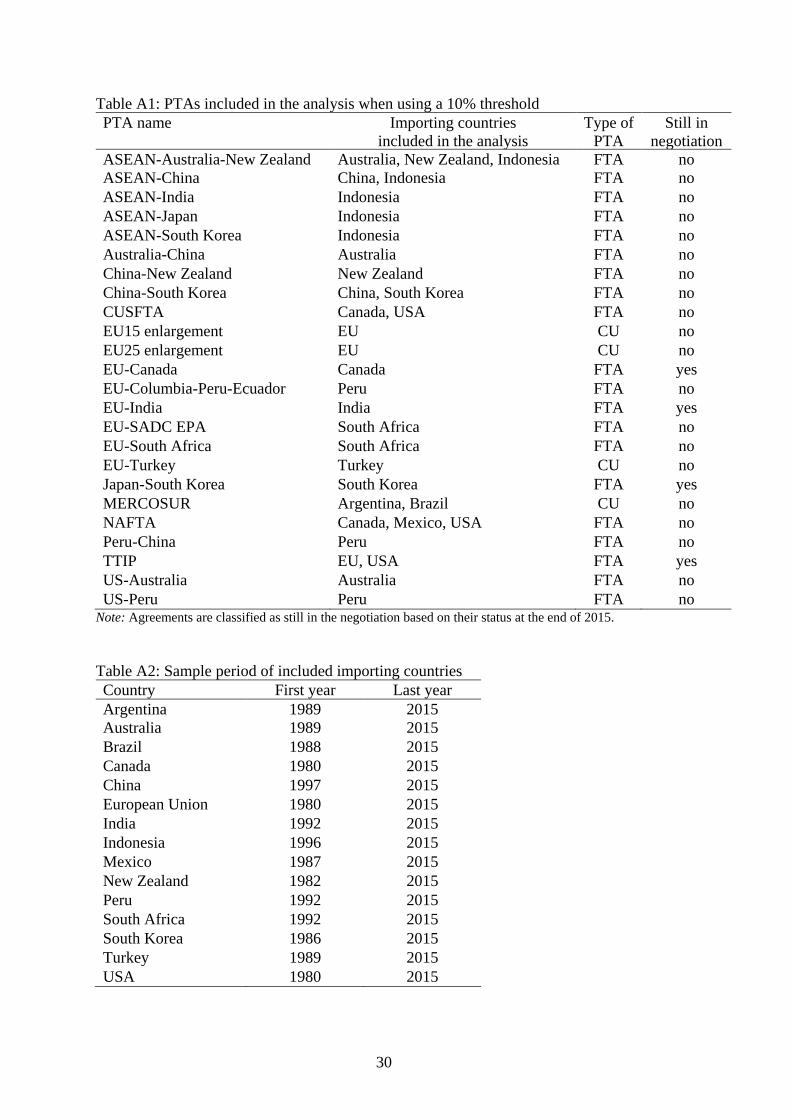
Using 10% as the minimum share of imports a¤ected by a PTA to choose which agreements
to include for the empirical analysis, we end up using 24 PTAs for the construction of PTAs
negotiationi;z;t and PTAs implementedi;z;t (see Table A1 in the Appendix for the full list).
Out of these 24 PTAs, 4 are still in the negotiation phase at the end of the sample (i.e., end
of 2015) and only 4 are CUs. As we know, most PTAs take the form of FTAs, which may
make it more di¢ cult to identify the e¤ects that theory suggests CUs should have. However,
it is also important to notice that one given PTA may be counted for more than one of the
importing countries included in the analysis. For example, NAFTA is counted for all three
member countries while the CU between the EU and Turkey is counted only for Turkey, as
EU imports from Turkey in 1995 (i.e., the year before entry into force) represent less that 10%
of the EU�s total imports.
Data on the worldwide usage of AD (since 1980) comes mainly from the Global Antidump-
ing Database (Bown, 2015) and are complemented by the data fromMoore and Zanardi (2009)
for some countries and years.11 In particular, these sources allow us to construct the depen-
dent variable, ADi;j;t, as the count of the AD measures that an importer i has introduced
against an exporter j in a year t. Since we would expect an e¤ect of PTAs on the use of
AD to occur only for those countries that do make systematic use of this form of contingent
11For the sample used in the econometric analysis, only the data for Canada before 1995, the EU before1987 and New Zealand before 1995 are taken from Moore and Zanardi (2009).
11
protection, we limit the sample of importing countries to intense users of the AD system.
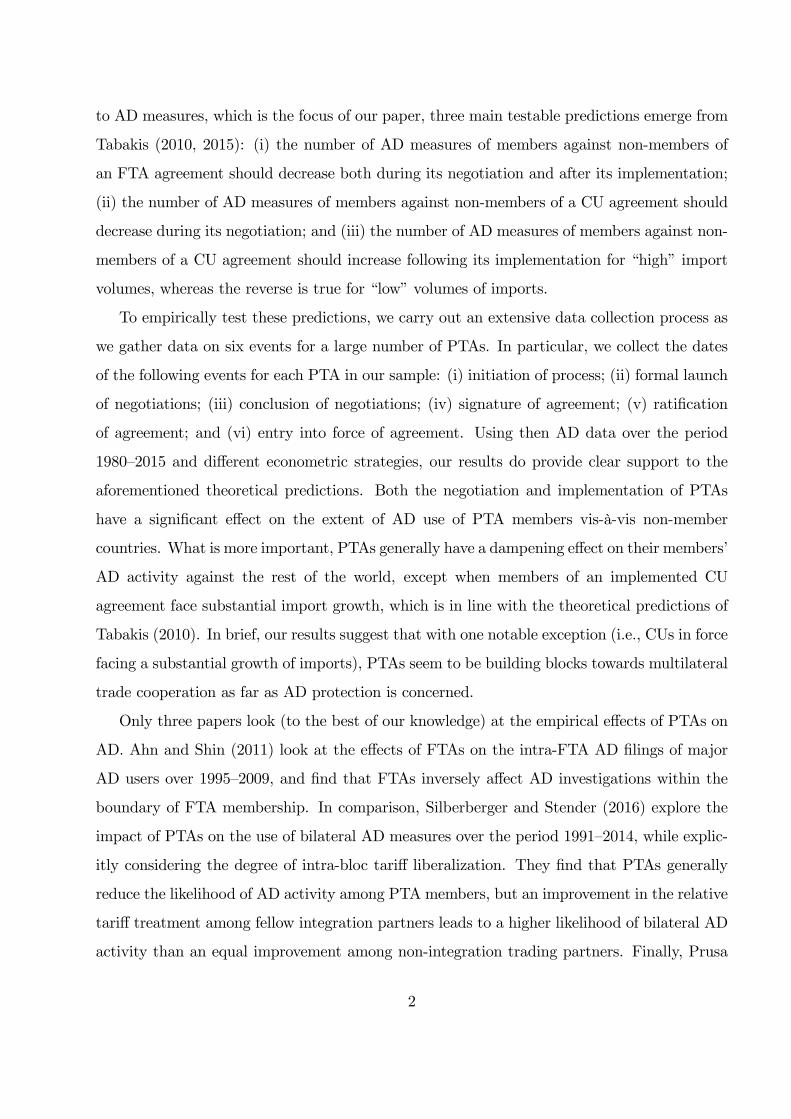
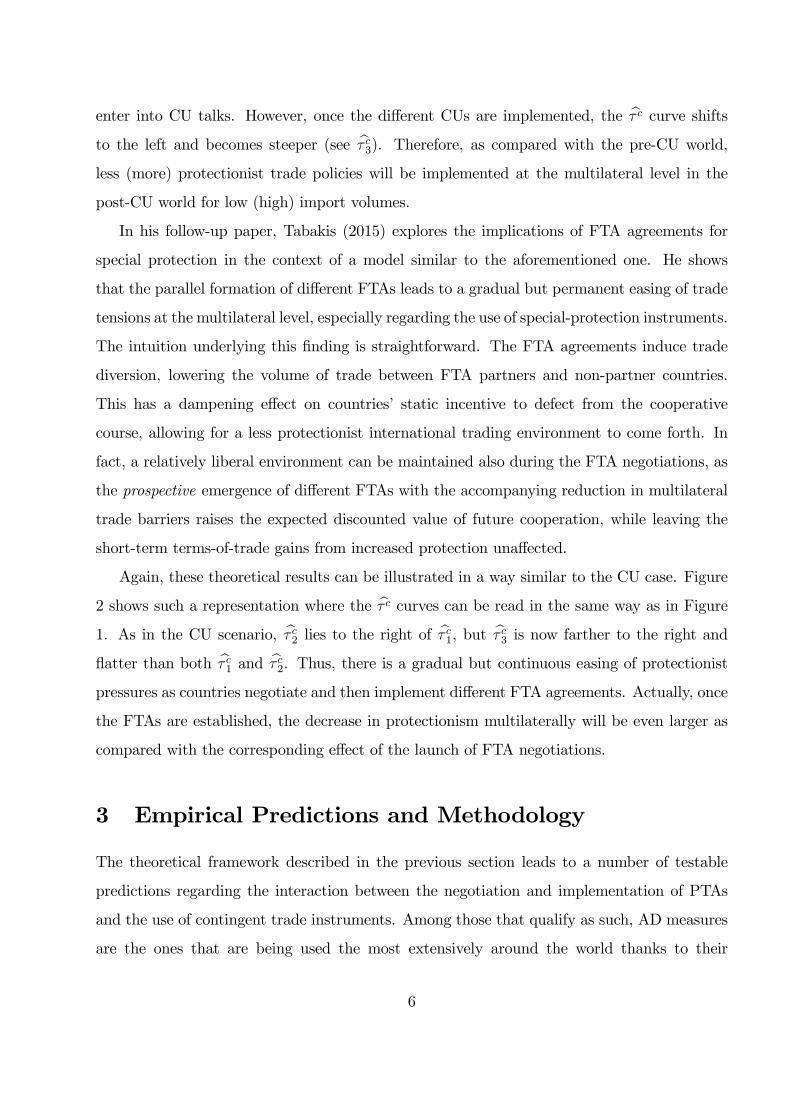
Table 1 provides summary statistics on the worldwide usage (i.e., initiations and measures)
of AD over our sample period, which runs from 1980 until 2015 with a later starting year if
an importing country has implemented an AD law more recently or AD data are not avail-
able (see Table A2 in the Appendix for details of included years by country). In order to
select the countries to include in our analysis, we consider the cumulative number and annual
average of their AD investigations and applied measures (e.g., duties, price undertakings).12
The summary statistics reported in Table 1 con�rm previous �nding of the literature in terms
of the countries that are most intense users of this instrument. Thus, we include the usual
�ve traditional users (i.e., Australia, Canada, the EU, New Zealand, and the United States)
and the ten most active new users: Argentina, Brazil, China, India, Indonesia, Mexico, Peru,
South Africa, South Korea, and Turkey. We include New Zealand because it was an active
user in the 1980s (which are included in our analysis) although its number of initiations and
measures per year are not very large, and in a robustness check, we exclude New Zealand.13
As for the import data (at country level), they are taken from the IMF Direction of Trade
Statistics (DOTS) and they serve two purposes. First, we need to control for the size of imports
and their growth as they are known determinants of AD measures. Not less importantly, one
of the empirical predictions stemming from Tabakis (2010) is that the e¤ect of CUs on the
AD usage of their members against third countries depends on the volume of imports. Hence,
import growth (between t and t� 1) becomes another key regressor when distinguishing the
e¤ects of FTAs and CUs on AD usage.
Finally, macro controls as (the log of) bilateral real exchange rate and importer and ex-
porter GDP growth rates (between t and t�3) are included as they have been shown to a¤ect
the introduction of AD measures (e.g., see the seminal work by Knetter and Prusa, 2003).
These variables are taken from the World Development Indicators (WDI).
Merging these three sets of data, the sample consists of 15 importing countries and all of
their trade partners over the sample period 1980�2015. Notice though that starting from the
12Initiations and measures per year are based on the number of years for which a country has had an ADlaw during the sample period 1980�2015.13We do not include Taiwan in our sample even if it has initiated several investigations because of its very
low success rate for the introduction of measures (i.e., 23:4% versus 56:1% for the entire set of AD users and57:1% for the chosen 15 importers), which we use as dependent variable.
12
consideration of all potential trade partners of the 15 importing countries identi�ed above,
import and macro data are missing for many observations, and therefore, their inclusion forces
us to drop many observations.
5 Empirical Results
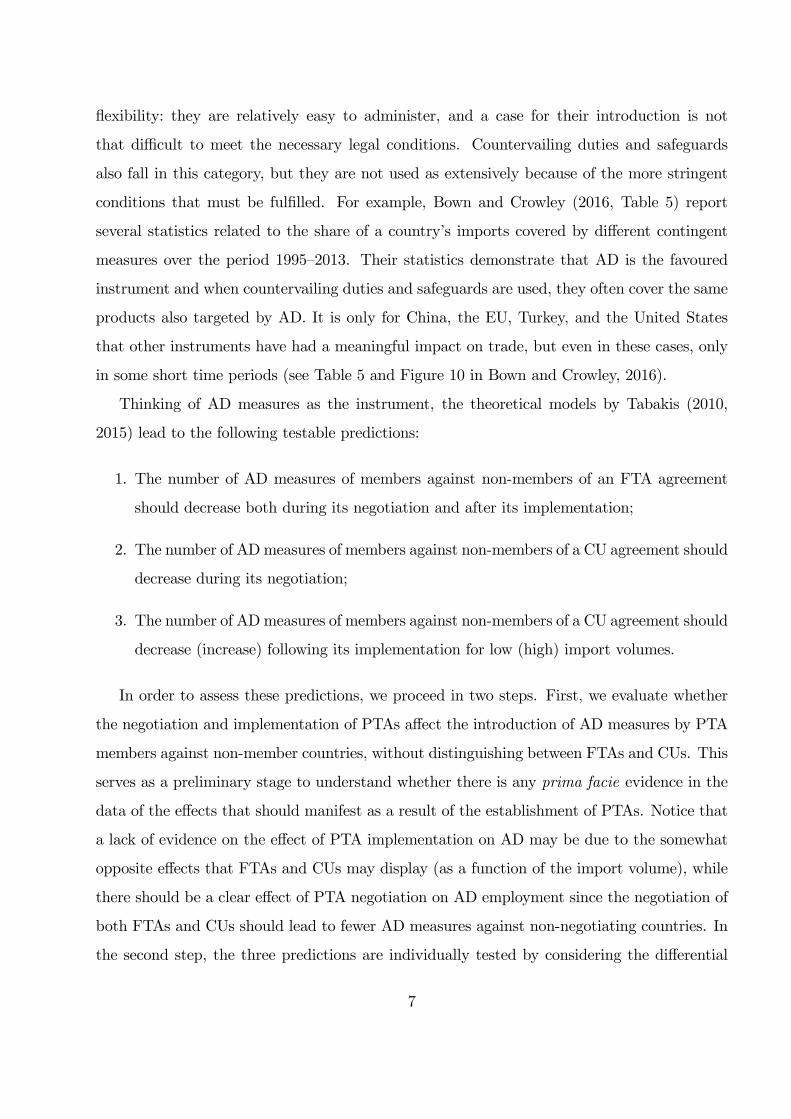
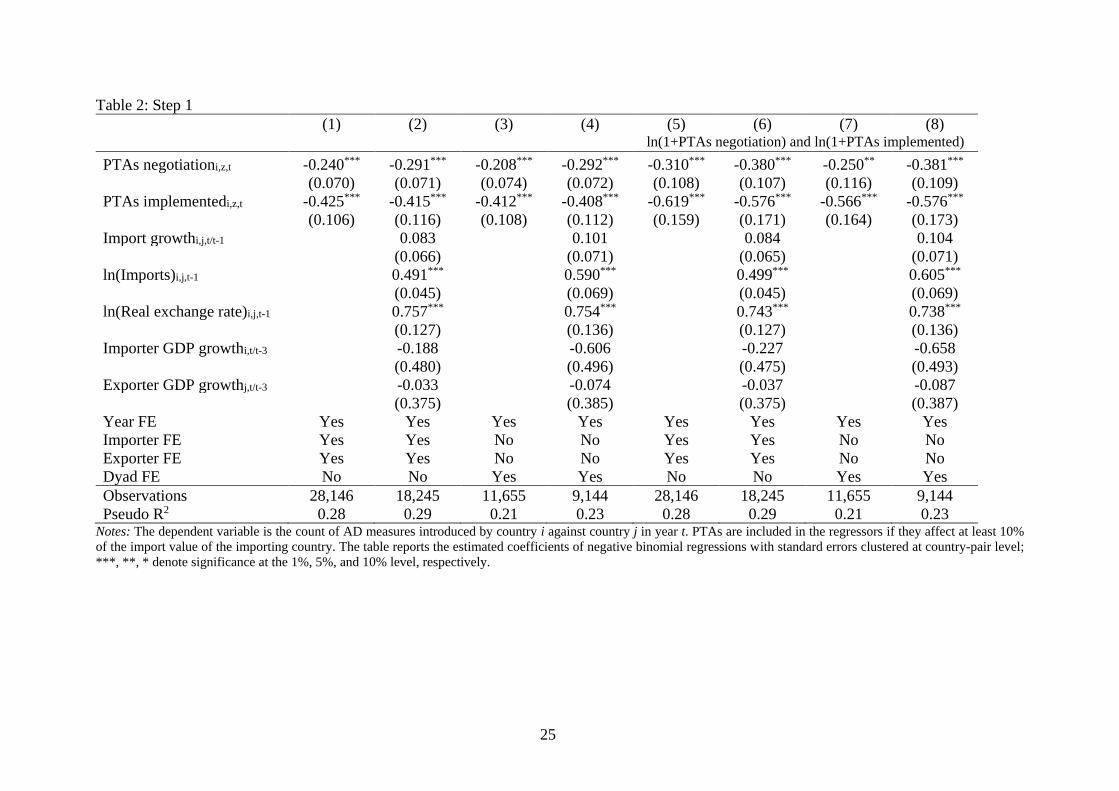
The results of the �rst step of our estimation strategy are presented in Table 2. In this case,
we do not distinguish between FTAs and CUs in their e¤ects on the use of AD against third
countries. Still, it should be the case that higher values of PTAs negotiationi;z;t lead to fewer
external AD measures (i.e., the e¤ects of FTAs and CUs during their negotiation is the same).
The estimated coe¢ cient for PTAs implementedi;z;t should be negative, except if the e¤ect
from members of CUs facing high import growth dominates.
Table 2 includes eight speci�cations that di¤er because of �xed e¤ects, of whether control
variables are included or not, and depending on the functional form of PTAs negotiationi;z;t
and PTAs implementedi;z;t (in logs in the last four columns). Even before discussing the
di¤erences of these modeling strategies, it is obvious that the results are quite robust: the
negotiation and implementation of PTAs between an importing country i and third countries
z 6= j (in year t) reduces the number of AD measures that country i imposes against trading
partner j (in year t). All but one of the coe¢ cients are statically signi�cant at the 1%
level and they are larger (in absolute terms) for implemented PTAs than for PTAs under
negotiation. Thus, it is the case that the data provide broad support for the theoretical
predictions discussed in Section 2, . In graphical terms, the negative coe¢ cients for PTAs
negotiationi;z;t represent the downward shift in the b� c2 curves in Figures 1 and 2, as theexpected value of future cooperation increases and the static incentive to defect does not
change. Regarding the coe¢ cients for PTAs implementedi;z;t, Figures 1 and 2 highlight an
important di¤erence between FTAs and CUs that we will address in the following table.
Looking in detail at the results in Table 2, the �rst speci�cation includes only year, importer
and exporter �xed e¤ects together with the key regressors of interest. It is clearly the case
that this minimalist version should be augmented by the trade and macro controls that the
literature shows to be important determinants of AD activity. Although their inclusion in
13
column (2) forces us to drop many observations due to missing data, it is reassuring to see
that reducing the sample size has minimal e¤ects on the estimated coe¢ cients. These control
variables do display the role that we expect from previous �ndings: the estimated coe¢ cients
for import volumes and import growth are positive (although the latter e¤ect is not statistically
signi�cant), as is the case for an appreciation of the real exchange rate of the importing country
(while GDP growth rates do not display a signi�cant role). Columns (3) and (4) are analogous
but they are based on dyad �xed e¤ects. This strategy imposes a loss of observations also
for the minimalist speci�cation (i.e., any country pair without a single AD measure over
the sample is dropped), implying a smaller di¤erence of observations when the controls are
included. Still, the results are very similar to the previous ones: there are no signi�cant
di¤erences between the estimates in columns (2) and (4).
The last remaining four columns re-estimate the same speci�cations with the key regressors
of the count of PTA negotiations and implementations replaced by the log of one plus these
count variables. This alternative formulation imposes a non-linear e¤ect of PTA negotiation
and implementation and the results con�rm this to be the case. Again, the reduced samples
due to the inclusion of control variables do not change the conclusions.
The purpose of Table 2 was to establish prima facie evidence supporting the theoretical
predictions of Tabakis (2010, 2015) and dispel any concern of sample selection due to the
availability of trade and macro controls. This second aspect is crucial as we move to the
second step where the role of import growth is essential to test the empirical predictions in all
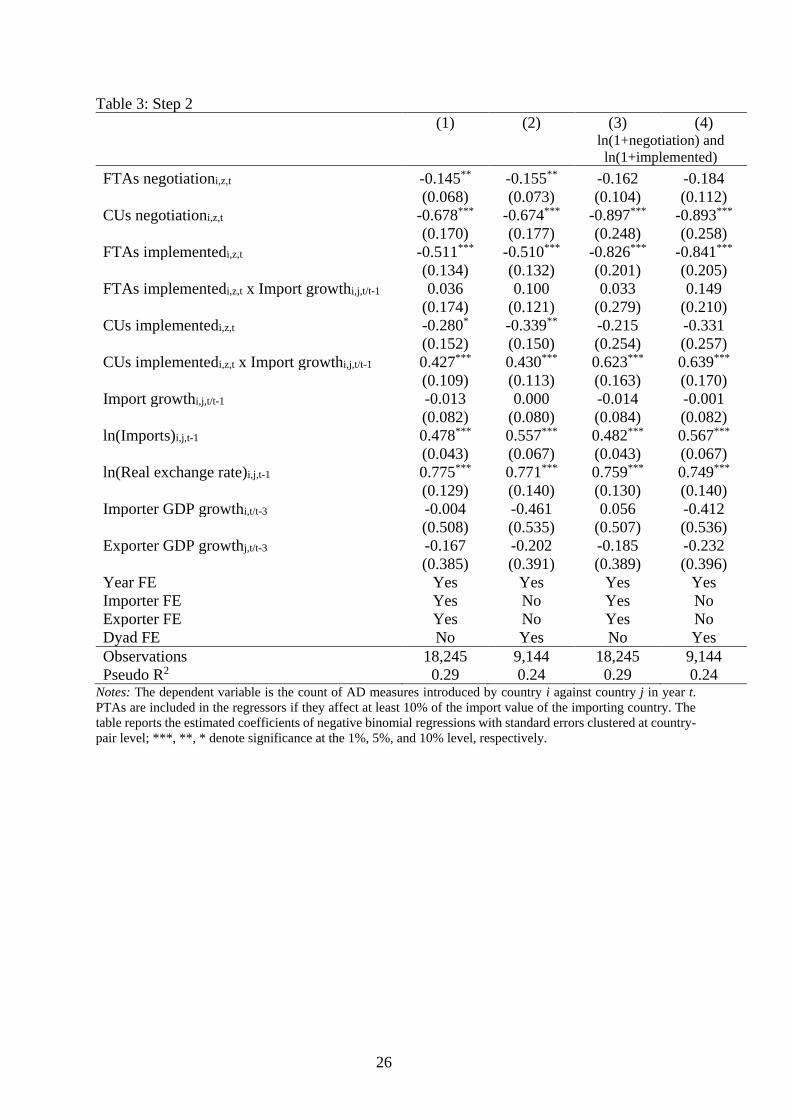
of their details. The results of the second step are reported in Table 3, which does not include
any minimalist speci�cation since import growth is more than just a control variable and
cannot be excluded. Columns (1) and (3) employ year, importer and exporter �xed e¤ects,
while columns (2) and (4) use year and dyad �xed e¤ects. As for the functional form of the
count of PTAs, in the last two columns we use their log counterparts.
In terms of negotiations, it is con�rmed that they lead to fewer external AD measures with
a stronger (in terms of signi�cance and magnitude) dampening e¤ect for CUs. Considering
the implementation of trade agreements, FTAs have a negative sign which is not a¤ected by
the size of the import surge. Implementation of CUs has an overall negative e¤ect but the
interaction terms with import growth are positive and signi�cant, indicating that for large
14
enough trade surges, the market-power e¤ect of CUs can dominate and lead to more AD
measures. This is in line with the empirical predictions derived from Tabakis (2010) and in
particular, with the positioning and the slope of the b� c3 curve in Figure 1. As for the otherregressors, their signi�cance is very much in line with the results of Table 2. Notice that
some of the results are imprecisely estimated when using the log formulations in the last two
columns. As a matter of fact, there may not be enough variation to uncover a non-linear e¤ect
of the implementation of CUs, given that most of our PTAs take the form of FTAs (see Table
A1 in the Appendix).
In conclusion, the estimates of Tables 2 and 3 provide clear support for the theoretical
predictions discussed in Section 2. The negotiation and implementation of PTAs have an
e¤ect on the extent of AD use of PTA members vis-à-vis third countries. The more interesting
part is that the mechanisms at play (i.e., market power and trade diversion) lead to fewer
AD measures, except when CU member countries face substantial import growth. Notice that
evidence of decreased AD usage as a result of PTAs does not contradict the evidence that
number of AD measures has been increasing in recent years, as these numbers are a¤ected by
many other determinants. However, the results indicate that we would have seen even more
AD measure if fewer PTAs had been negotiated and enforced.
5.1 Quanti�cation of E¤ects
Given the non-linear nature of the estimator, the estimated coe¢ cients do not allow for a
quanti�able interpretation of the role of our key regressors on AD patterns. To facilitate such
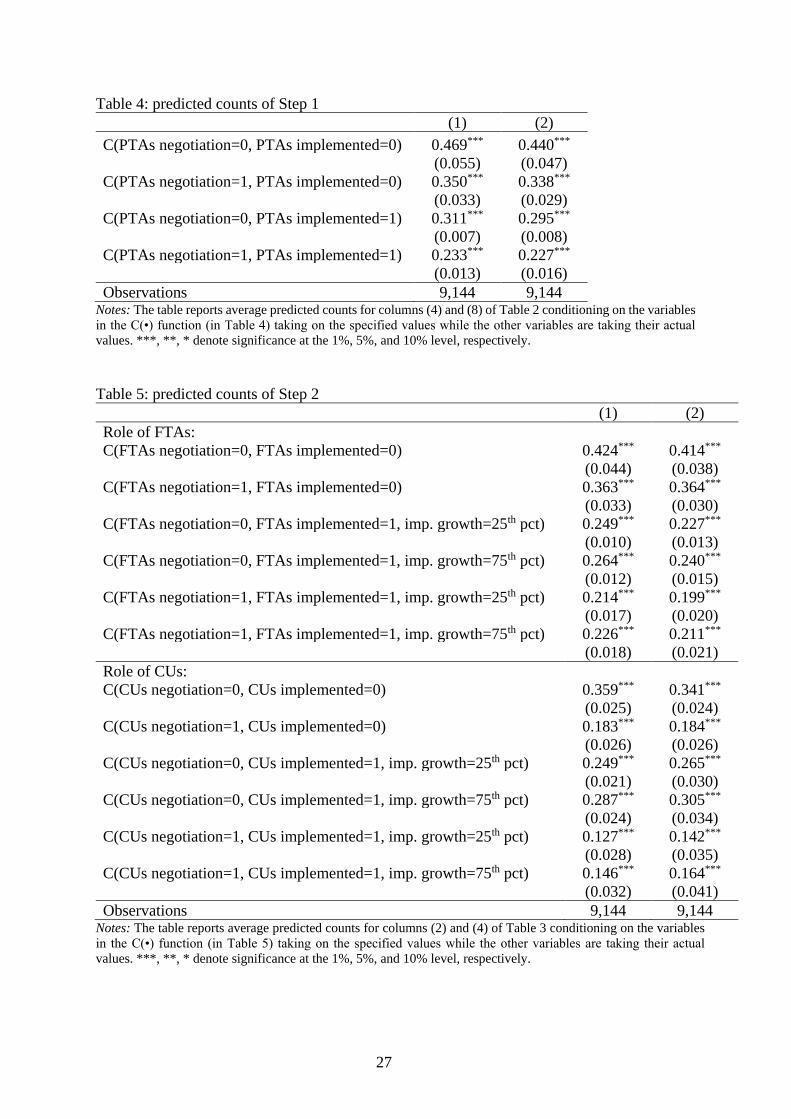
an analysis, we report in Tables 4 and 5 the predicted counts of AD measures based on our
estimations, focusing on the speci�cations including dyad �xed e¤ects, which are the most
demanding in identifying the rami�cations of PTAs for AD.
For the speci�cations in columns (4) and (8) of Table 2, Table 4 reports the predicted
counts of AD measures when there are no negotiations and implementations of PTAs or when
there is one of each (separately or jointly).14 Clearly, AD is a relatively rare phenomenon even
when restricting the sample to country pairs in which there is at least one AD measure in the
14Similar counts can be computed when more than one PTA negotiation or implementation is in place, butthey would not add much to the interpretation of the results.
15
sample period (i.e., when including dyad �xed e¤ects): the estimates predict fewer than 1 AD
measure when there is no PTA under negotiation or in force (i.e., 0:469 or 0:440, depending on
the speci�cation). The relevant comparison, though, is what happens to these country pairs
when there is negotiation and/or implementation of a PTA. In both cases, the predicted counts
drop signi�cantly: based on column (1), one PTA under negotiation (implemented) reduces
the count of AD measures by 25% (34%), with an overall reduction of 50% for importing
countries simultaneously implementing and negotiating PTAs.15 The magnitudes in column
(2), based on the speci�cation with the log version of our main regressors, are quite similar in
size (i.e., 23%, 34%, and 48%, respectively), con�rming that such speci�cations are consistent
with our benchmark results.16 These changes are quite large, but we must keep in mind
that they are based on PTAs that a¤ect at least 10% of the import volume of the importing
country.
Table 5 reports similar calculations for columns (2) and (4) of Table 3 where we distin-
guish between FTAs and CUs and we include interactions with import growth. As a result,
Table 5 is more cumbersome to read as the e¤ect of implemented FTAs or CUs must be
de�ned for di¤erent values of the import growth. Still, the picture that emerges from Ta-
ble 5 is qualitatively similar to the one from Table 4: negotiations and implementations of
FTAs and CUs have a signi�cant impact on the number of AD measures that an importing
country introduces, with the dampening e¤ect of implemented CUs being mitigated when the
importing country in question faces large import surges. Focusing without loss of generality
on column (1), all the predicted counts regarding the role of FTAs are statistically di¤erent
from each other (at least at 5% level) except the counts calculated at di¤erent percentiles of
import growth. As predicted by the theory, negotiating and FTA has a dampening e¤ect on
external AD measures but the e¤ect on AD patterns of the implementation of an FTA does
not depend on import growth (i.e., 0:249 is not statistically di¤erent from 0:264, and in the
same way 0:214 is not di¤erent from 0:226). However, import growth matters when it comes
to the role of CUs: implemented CUs have milder or null dampening e¤ects when import
15The estimated counts within each column of Table 4 are statistically di¤erent from each other except forthe second and third count of each speci�cation.16The two speci�cations would give rise to more signi�cantly di¤erent counts if we were to consider more
than one negotiation or implementation of PTAs, as in this case the non-linear log formulation would play abigger role.
16
growth is assumed to be at the 75th percentile. Furthermore, import growth can completely
o¤set the dampening e¤ect of negotiating a CU: the predicted counts with no negotiation or
implementation are not statistically di¤erent than when a CU is under negotiation and the
importing country is experience high import growth (i.e., 0:359 is not statistically di¤erent
from 0:287 but it is di¤erent from 0:249). The estimated counts in column (2) provide a very
similar picture.
5.2 Robustness Checks
Tables 2 and 3 already include various robustness checks and demonstrate that our results are
not sensitive to di¤erent modeling choices. They address the issue of sample selection due to
data availability, they rely on di¤erent econometric strategies (i.e., sets of �xed e¤ects), and
they consider di¤erent functional forms for the count variables related to PTA negotiations
and implementations. However, all the results presented so far are based on PTAs that a¤ect
at least 10% of the import volume of the importing country (in the year before enforcement
or before the start of negotiations when the agreement is not yet in force by the end of 2015).
The choice of this threshold is based on the interest to consider PTAs that can be expected
to have meaningful trade e¤ects. Still, this threshold is simply assumed and we need to verify
whether the results are sensitive to this assumption.
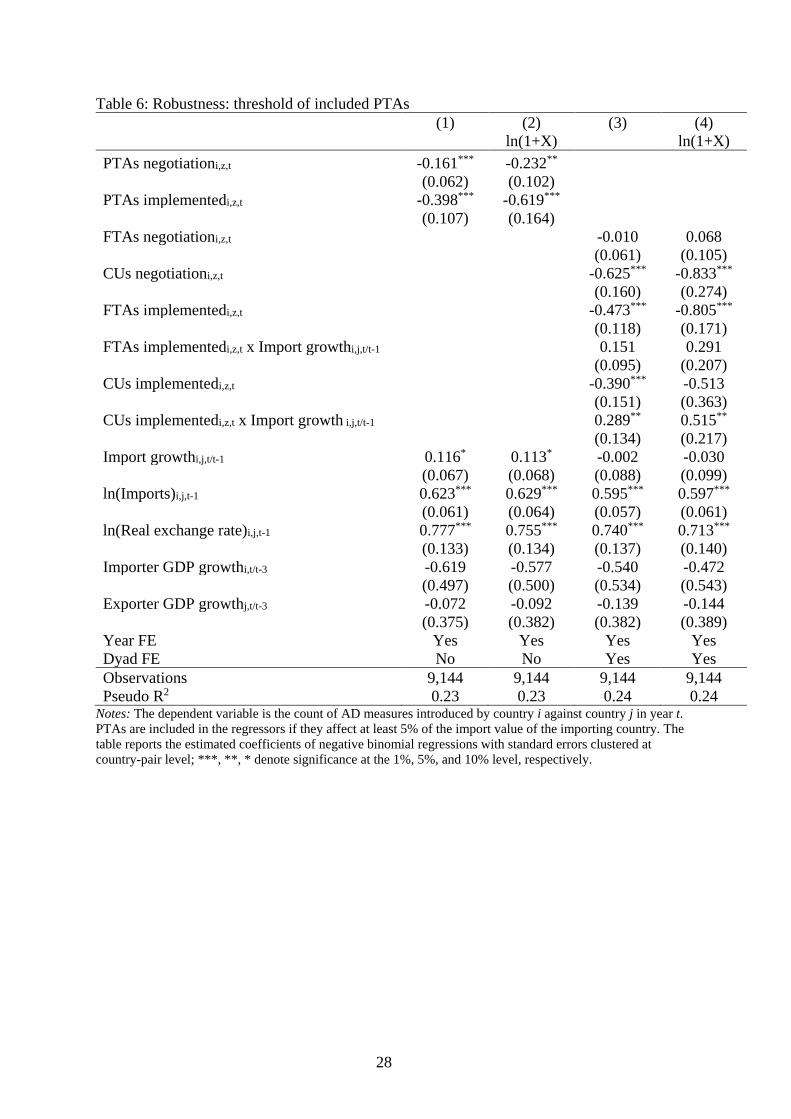
Thus, we re-estimate our speci�cations using a threshold of 5%. In such case, we would
expect the results to become weaker and probably less statistically signi�cant as �smaller�
PTAs are now included.17 Table 6 presents the results of such an exercise, only reporting
estimates based on the use of dyad �xed e¤ects, as they lead to the most demanding of the
speci�cations. The �rst two columns parallel Table 2 with the second column employing the
log version of the PTA count variables; the remaining two columns mirror Table 3, again with
the linear and non-linear formulation of the key regressors. Overall, the results are very much
in line with our previous conclusions although they sometimes present smaller coe¢ cients (in
absolute terms) and/or lower levels of signi�cance for our main regressors of interest (while the
coe¢ cients for the other variables do not present any signi�cant change). The only signi�cant
change is that the coe¢ cient for FTAs negotiationi;z;t is not signi�cant even in the linear
17With a 5% threshold, 12 more PTAs, of which one CU, are used to compute our main regressors of interest.
17
version.
A di¤erent way to measure the importance of PTAs is to use as regressors the share of
trade a¤ected by negotiations and implementations. In this case, we would not have to choose
a threshold. However, this exercise comes with its own complications. On a methodological
front, we may be concerned that such shares are endogenous to the use of AD. On a conceptual
front, enlargements of the EU create problems since we consider the EU as a �country�and
don�t count its internal trade, which poses problems for the calculation of trade shares once
the negotiation of an enlargement is implemented. For these reasons, such an exercise proves
problematic. Still, if we were to ignore the endogeneity problem and drop the EU from the
sample of importing countries, the results would be qualitatively in line with what we have
presented so far: the higher the share of trade involved in the negotiation and implemen-
tation of PTAs with third country and the fewer AD measures an importing country would
introduce.18
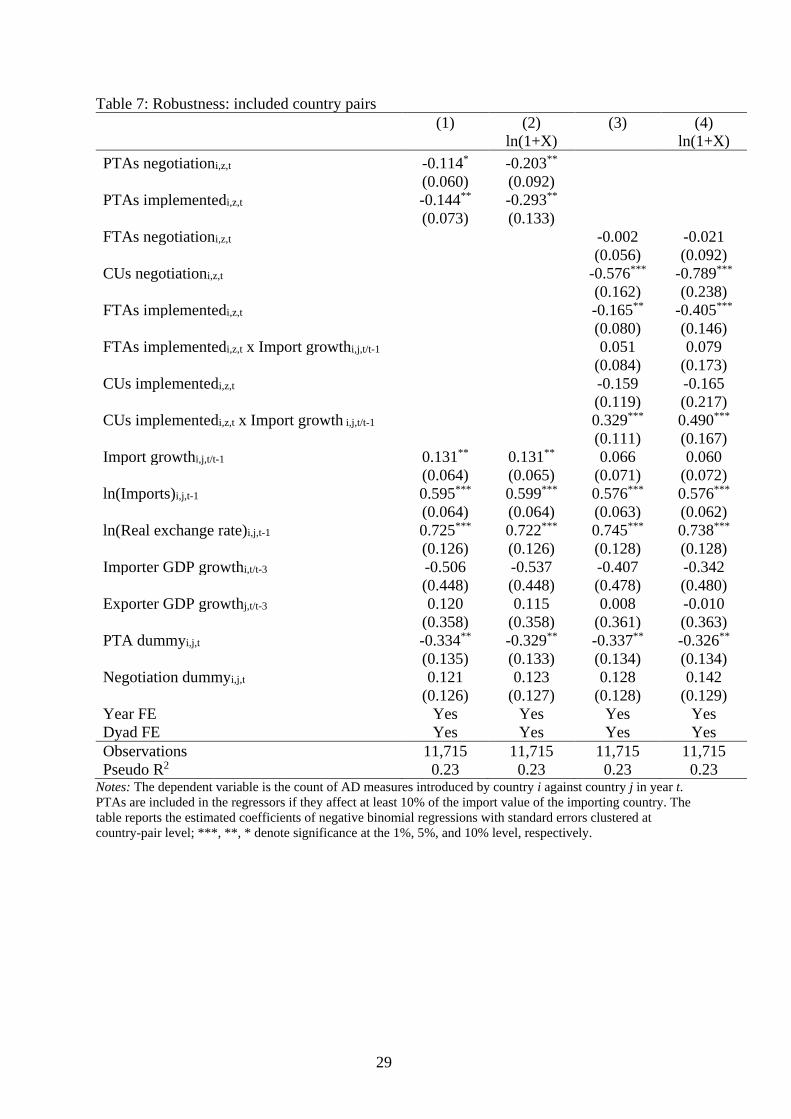
In another methodological check, we re-estimate our results without excluding the country
pairs negotiating or enforcing a PTA. At the end of Section 3, we argued that these obser-
vations should be excluded since the theoretical models by Tabakis (2010, 2015) only lead to
empirical predictions on the pattern of AD between member and non-member countries of a
PTA. Still, we can include the observations so far discarded although we are agnostic on how
negotiations and implementations of PTAs a¤ects the parties in the PTAs. Table 7 proposes
the same type of speci�cations as in Table 6 with these extra observations (almost 3; 000)
and dummy variables that control for country pairs that are PTA members (PTA dummyi;j;t)
or are negotiating a PTA (Negotiation dummyi;j;t). The results show that the conclusions
we reached earlier are overall still valid (although somewhat weaker for the negotiation of
FTAs and implementation of CUs). These estimations con�rm earlier results found in the
literature that members of a PTA introduce fewer AD measures against each other. Instead
the estimates for the Negotiation dummyi;j;t are never signi�cant.
We can also experiment by changing the set of countries included in the analysis.19 First,
we drop New Zealand as it was a heavy user of AD in the 1980s, but has ever since dramatically
18Considering the complications of this exercise, we do not report results in the text but they are availableupon request.19These robustness checks are omitted to save on space but are available upon request.
18

decreased the use of AD measures. Excluding it as an importer does not a¤ect any of our
qualitative conclusions. Considering the predominant role that India and China are playing
recently when it comes to AD, it is reassuring that the results are qualitatively unchanged
when we drop them from the list of importing countries.
In a �nal methodological check (not reported to save on space), we drop our year �xed
e¤ects and replace our importer or dyad �xed e¤ects with the interaction of such �xed e¤ects
and a trend (i.e., we allow for importer and dyad-speci�c �xed e¤ects). Such a change would
address the concern that countries have become more open to trade over time, translating in
both an increase in the negotiation and implementation of PTAs and a reduction in the use
of AD. Once again, our qualitative results are unchanged by the use of these di¤erent �xed
e¤ects.
6 Conclusions
This paper has explored the implications of PTAs for their member countries�external AD
actions (i.e., the AD measures of members against non-member countries). We have relied
on the theoretical work by Tabakis (2010, 2015) to guide our empirical strategy. Three main
testable predictions regarding PTAs and AD measures emerge from these papers: (i) the num-
ber of AD measures of members against non-members of an FTA agreement should decrease
both during its negotiation and after its implementation; (ii) the number of AD measures of
members against non-members of a CU agreement should decrease during its negotiation; and
(iii) the number of AD measures of members against non-members of a CU agreement should
increase following its implementation for �high�import volumes, whereas the reverse is true
for �low�volumes of imports. To empirically test these predictions, we have �rst constructed
a dataset containing extensive information regarding the negotiation, signature, rati�cation,
and implementation of a large number of PTAs. Using then AD data over the period 1980�
2015 and di¤erent econometric strategies, we have provided clear evidence in support of the
aforementioned predictions. PTAs have, in general, a dampening e¤ect on their member coun-
tries�AD activity against the rest of the world, except when members of an implemented CU
agreement face large import surges. These results highlight a building-block e¤ect of PTAs
19
on multilateral trade cooperation (at least as far as AD protection is concerned).
Notice that these results are not contradicted by the summary statistics showing that AD
protection has been increasing over the last decades. This is the results of, among other things,
increasing level of trade. What the results indicate is that we would have observed even more
AD actions if it was not for the many PTAs that intensive users of AD have been engaged
with (i.e. negotiating and implementing).
In conclusion, this paper o¤ers yet further evidence that strategic interactions� either
across countries or between a given country�s policies� play a pivotal role in trade policy for-
mulation (see, e.g., Bown and Crowley, 2007; Tabakis and Zanardi, 2017). In particular, we
have demonstrated that a country�s decision to engage in regionalism has important rami�-
cations for its AD activity vis-à-vis third countries. What is more signi�cant, our analysis
highlights the importance of taking into consideration other policy instruments besides most-
favored-nation tari¤s in order to get a more complete picture regarding whether PTAs are
building blocks or stumbling blocks towards multilateral trade cooperation.
20
References
[1] Ahn, Dukgeun, and Wonkyu Shin (2011). �Analysis of Anti-Dumping Use in Free Trade
Agreements.�Journal of World Trade, 45, 431�456.
[2] Allison, Paul D., and Richard P. Waterman (2002). �Fixed-E¤ects Negative Binomial
Regression Models.�Sociological Methodology, 32, 247�265.
[3] Bagwell, Kyle, and Robert W. Staiger (1990). �A Theory of Managed Trade.�American
Economic Review, 80, 779�795.
[4] Bagwell, Kyle, and Robert W. Staiger (2002). The Economics of the World Trading
System. MIT Press.
[5] Bagwell, Kyle, and Robert W. Staiger (2011). �What Do Trade Negotiators Negotiate
About? Empirical Evidence from the World Trade Organization.�American Economic
Review, 101, 1238�1273.
[6] Bown, Chad P. (2015). Global Antidumping Database. The World Bank (version Q4�
2015).
[7] Bown, Chad P., and Meredith A. Crowley (2007). �Trade De�ection and Trade Depres-
sion.�Journal of International Economics, 72, 176�201.
[8] Bown, Chad P., and Meredith A. Crowley (2013). �Self-Enforcing Trade Agreements:
Evidence from Time-Varying Trade Policy.�American Economic Review, 103, 1071�1090.
[9] Bown, Chad P., and Meredith A. Crowley (2016). �The Empirical Landscape of Trade
Policy,�in Kyle Bagwell and Robert W. Staiger (eds.), Handbook of Commercial Policy,
Vol. 1A. Elsevier, North-Holland.
[10] Broda, Christian, Nuno Limão, and David E. Weinstein (2008). �Optimal Tari¤s and
Market Power: The Evidence.�American Economic Review, 98, 2032�2065.
[11] De Sousa, José (2012): �The Currency Union E¤ect on Trade is Decreasing over Time.�
Economics Letters, 117, 917-920.
21
[12] Estevadeordal, Antoni, Caroline Freund, and Emanuel Ornelas (2008). �Does Regionalism
A¤ect Trade Liberalization toward Nonmembers?,�Quarterly Journal of Economics, 123,
1531�1575.
[13] Karacaovali, Baybars, and Nuno Limão (2008). �The Clash of Liberalizations: Preferen-
tial vs. Multilateral Trade Liberalization in the European Union.� Journal of Interna-
tional Economics, 74, 299�327.
[14] Knetter, Michael M. and Thomas J. Prusa (2003). �Macroeconomic Factors and An-
tidumping Filings: Evidence from Four Countries.�Journal of International Economics,
61, 1�17.
[15] Limão, Nuno (2006). �Preferential Trade Agreements as Stumbling Blocks for Multilateral
Trade Liberalization: Evidence for the United States.�American Economic Review, 96,
896�914.
[16] Moore, Michael O., and Maurizio Zanardi (2009). �Does Antidumping Use Contribute
to Trade Liberalization in Developing Countries?,�Canadian Journal of Economics, 42,
469�495.
[17] Prusa, Thomas J., and Robert Teh (2010). �Protection Reduction and Diversion: PTAs
and the Incidence of Antidumping Disputes.�NBER Working Paper 16276.
[18] Silberberger, Magdalene, and Frederik Stender (2016). �False Friends? Empirical Evi-
dence on Trade Policy Substitution in Regional Trade Agreements.�Available at SSRN:
https://ssrn.com/abstract=2783234.
[19] Tabakis, Chrysostomos (2010). �Customs Unions and Special Protection.�The B.E. Jour-
nal of Economic Analysis & Policy, 10 (Contributions), 1�40.
[20] Tabakis, Chrysostomos (2015). �Free-Trade Areas and Special Protection.�The Journal
of International Trade & Economic Development, 24, 1054�1076.
[21] Tabakis, Chrysostomos, and Maurizio Zanardi (2017). �Antidumping Echoing.� Eco-
nomic Inquiry, 55, 655�681.
22
23
Figure 1: Customs Unions
Figure 2: Free Trade Areas
𝑒ҧ1 𝑒ҧ3 𝑒ҧ2 Import volume
𝜏Ƹ 𝑐 𝜏Ƹ3
𝑐ሺ𝑒ሻ 𝜏Ƹ1𝑐ሺ𝑒ሻ 𝜏Ƹ2
𝑐ሺ𝑒ሻ
𝑒ҧ1 𝑒ҧ2 𝑒ҧ3 Import volume
𝜏Ƹ 𝑐 𝜏Ƹ1
𝑐ሺ𝑒ሻ 𝜏Ƹ2𝑐ሺ𝑒ሻ 𝜏Ƹ3
𝑐ሺ𝑒ሻ

24
Table 1: Summary statistics Initiations Initiations per year Measures Measures per year
USA 1,343 USA 37.31 European Union 643 India 23.25
European Union 1,056 India 31.83 USA 614 European Union 17.86
India 764 European Union 29.33 India 558 USA 17.06
Canada 577 Australia 21.30 Canada 350 Canada 9.72
Australia 575 Brazil 16.07 Argentina 252 China 9.58
Brazil 450 Canada 16.03 Brazil 247 Argentina 9.33
Argentina 380 Argentina 14.07 Turkey 214 Brazil 8.82
South Africa 306 South Africa 13.30 Australia 204 Turkey 7.93
Mexico 285 China 12.21 China 182 Australia 7.56
Turkey 285 Turkey 10.56 South Africa 171 South Africa 7.43
China 232 Mexico 9.83 Mexico 158 Mexico 5.45
South Korea 166 Pakistan 6.71 South Korea 93 Vietnam 4.00
Taiwan 141 Indonesia 6.35 Peru 63 Pakistan 3.64
Indonesia 127 South Korea 5.53 Indonesia 61 Lithuania 3.50
Peru 115 Peru 4.79 New Zealand 56 South Korea 3.10
New Zealand 109 Taiwan 4.55 Egypt 53 Indonesia 3.05
Colombia 101 Egypt 4.47 Pakistan 51 Egypt 2.79
Pakistan 94 Colombia 4.04 Thailand 47 Russia 2.73
Egypt 85 Malaysia 4.00 Colombia 44 Peru 2.63
Malaysia 84 Sweden 4.00 Malaysia 43 Thailand 2.35
Israel 68 Vietnam 4.00 Russia 41 Malaysia 2.05
Thailand 68 Russia 3.53 Taiwan 33 Singapore 2.00
Russia 53 Latvia 3.50 Ukraine 28 Ukraine 1.87
Ukraine 37 Lithuania 3.50 Israel 25 Colombia 1.76
Philippines 29 New Zealand 3.41 Venezuela 16 New Zealand 1.75
Chile 28 Thailand 3.40 Philippines 13 Venezuela 1.60
Venezuela 27 Honduras 3.00 Chile 9 Kazakhstan 1.33
Japan 14 Israel 2.72 Finland 9 Poland 1.29
Finland 13 Venezuela 2.70 Japan 9 Taiwan 1.06
Poland 12 Ukraine 2.47 Poland 9 Israel 1.00
Trinidad and
Tobago
12 Kazakhstan 2.33 Lithuania 7 Finland 0.75
Austria 11 Singapore 2.00 Morocco 7 Morocco 0.70
Costa Rica 11 Poland 1.71 Trinidad and
Tobago 7 Philippines 0.62
Morocco 9 Czech Republic 1.50 Jamaica 4 Czech Republic 0.50
Sweden 8 Nicaragua 1.50 Kazakhstan 4 Dominican Republic 0.50
Uruguay 8 Philippines 1.38 Vietnam 4 Latvia 0.50
Kazakhstan 7 Chile 1.33 Costa Rica 3 Nicaragua 0.50
Latvia 7 Finland 1.08 Austria 2 Chile 0.43
Lithuania 7 Bulgaria 1.00 Dominican Republic 2 Trinidad and
Tobago
0.37
Jamaica 6 GCC 1.00 Ecuador 2 Jamaica 0.36
Panama 6 Jordan 1.00 Paraguay 2 Japan 0.36
Ecuador 5 Norway 1.00 Singapore 2 Paraguay 0.33
Vietnam 4 Slovenia 1.00 Uruguay 2 Austria 0.15
Czech Republic 3 Morocco 0.90 Czech Republic 1 Ecuador 0.15
Dominican Republic 3 Austria 0.85 Guatemala 1 Costa Rica 0.15
Honduras 3 Dominican Republic 0.75 Latvia 1 Uruguay 0.11
Nicaragua 3 Trinidad and
Tobago 0.63 Nicaragua 1 Guatemala 0.05
Guatemala 2 Japan 0.56 Bulgaria 0 Bulgaria 0.00
Paraguay 2 Costa Rica 0.55 GCC 0 GCC 0.00
Singapore 2 Jamaica 0.55 Honduras 0 Honduras 0.00
Bulgaria 1 Panama 0.50 Jordan 0 Jordan 0.00
GCC 1 Uruguay 0.42 Norway 0 Norway 0.00
Jordan 1 Ecuador 0.38 Panama 0 Panama 0.00
Norway 1 Paraguay 0.33 Slovenia 0 Slovenia 0.00
Slovenia 1 Guatemala 0.11 Sweden 0 Sweden 0.00
7,748 4,348
Notes: Countries in bold and italics are included in the econometric analysis; GCC stands for the six Middle Eastern
countries of Gulf Cooperation Council.
25
Table 2: Step 1
(1) (2) (3) (4) (5) (6) (7) (8)
ln(1+PTAs negotiation) and ln(1+PTAs implemented)
PTAs negotiationi,z,t -0.240*** -0.291*** -0.208*** -0.292*** -0.310*** -0.380*** -0.250** -0.381***
(0.070) (0.071) (0.074) (0.072) (0.108) (0.107) (0.116) (0.109)
PTAs implementedi,z,t -0.425*** -0.415*** -0.412*** -0.408*** -0.619*** -0.576*** -0.566*** -0.576***
(0.106) (0.116) (0.108) (0.112) (0.159) (0.171) (0.164) (0.173)
Import growthi,j,t/t-1 0.083 0.101 0.084 0.104
(0.066) (0.071) (0.065) (0.071)
ln(Imports)i,j,t-1 0.491*** 0.590*** 0.499*** 0.605***
(0.045) (0.069) (0.045) (0.069)
ln(Real exchange rate)i,j,t-1 0.757*** 0.754*** 0.743*** 0.738***
(0.127) (0.136) (0.127) (0.136)
Importer GDP growthi,t/t-3 -0.188 -0.606 -0.227 -0.658
(0.480) (0.496) (0.475) (0.493)
Exporter GDP growthj,t/t-3 -0.033 -0.074 -0.037 -0.087
(0.375) (0.385) (0.375) (0.387)
Year FE Yes Yes Yes Yes Yes Yes Yes Yes
Importer FE Yes Yes No No Yes Yes No No
Exporter FE Yes Yes No No Yes Yes No No
Dyad FE No No Yes Yes No No Yes Yes
Observations 28,146 18,245 11,655 9,144 28,146 18,245 11,655 9,144
Pseudo R2 0.28 0.29 0.21 0.23 0.28 0.29 0.21 0.23 Notes: The dependent variable is the count of AD measures introduced by country i against country j in year t. PTAs are included in the regressors if they affect at least 10%
of the import value of the importing country. The table reports the estimated coefficients of negative binomial regressions with standard errors clustered at country-pair level;
***, **, * denote significance at the 1%, 5%, and 10% level, respectively.
26
Table 3: Step 2
(1) (2) (3) (4)
ln(1+negotiation) and
ln(1+implemented)
FTAs negotiationi,z,t -0.145** -0.155** -0.162 -0.184
(0.068) (0.073) (0.104) (0.112)
CUs negotiationi,z,t -0.678*** -0.674*** -0.897*** -0.893***
(0.170) (0.177) (0.248) (0.258)
FTAs implementedi,z,t -0.511*** -0.510*** -0.826*** -0.841***
(0.134) (0.132) (0.201) (0.205)
FTAs implementedi,z,t x Import growthi,j,t/t-1 0.036 0.100 0.033 0.149
(0.174) (0.121) (0.279) (0.210)
CUs implementedi,z,t -0.280* -0.339** -0.215 -0.331
(0.152) (0.150) (0.254) (0.257)
CUs implementedi,z,t x Import growthi,j,t/t-1 0.427*** 0.430*** 0.623*** 0.639***
(0.109) (0.113) (0.163) (0.170)
Import growthi,j,t/t-1 -0.013 0.000 -0.014 -0.001
(0.082) (0.080) (0.084) (0.082)
ln(Imports)i,j,t-1 0.478*** 0.557*** 0.482*** 0.567***
(0.043) (0.067) (0.043) (0.067)
ln(Real exchange rate)i,j,t-1 0.775*** 0.771*** 0.759*** 0.749***
(0.129) (0.140) (0.130) (0.140)
Importer GDP growthi,t/t-3 -0.004 -0.461 0.056 -0.412
(0.508) (0.535) (0.507) (0.536)
Exporter GDP growthj,t/t-3 -0.167 -0.202 -0.185 -0.232
(0.385) (0.391) (0.389) (0.396)
Year FE Yes Yes Yes Yes
Importer FE Yes No Yes No
Exporter FE Yes No Yes No
Dyad FE No Yes No Yes
Observations 18,245 9,144 18,245 9,144
Pseudo R2 0.29 0.24 0.29 0.24 Notes: The dependent variable is the count of AD measures introduced by country i against country j in year t.
PTAs are included in the regressors if they affect at least 10% of the import value of the importing country. The
table reports the estimated coefficients of negative binomial regressions with standard errors clustered at country-
pair level; ***, **, * denote significance at the 1%, 5%, and 10% level, respectively.
27
Table 4: predicted counts of Step 1
(1) (2)
C(PTAs negotiation=0, PTAs implemented=0) 0.469*** 0.440***
(0.055) (0.047)
C(PTAs negotiation=1, PTAs implemented=0) 0.350*** 0.338***
(0.033) (0.029)
C(PTAs negotiation=0, PTAs implemented=1) 0.311*** 0.295***
(0.007) (0.008)
C(PTAs negotiation=1, PTAs implemented=1) 0.233*** 0.227***
(0.013) (0.016)
Observations 9,144 9,144 Notes: The table reports average predicted counts for columns (4) and (8) of Table 2 conditioning on the variables
in the C(•) function (in Table 4) taking on the specified values while the other variables are taking their actual
values. ***, **, * denote significance at the 1%, 5%, and 10% level, respectively.
Table 5: predicted counts of Step 2
(1) (2)
Role of FTAs:
C(FTAs negotiation=0, FTAs implemented=0) 0.424*** 0.414***
(0.044) (0.038)
C(FTAs negotiation=1, FTAs implemented=0) 0.363*** 0.364***
(0.033) (0.030)
C(FTAs negotiation=0, FTAs implemented=1, imp. growth=25th pct) 0.249*** 0.227***
(0.010) (0.013)
C(FTAs negotiation=0, FTAs implemented=1, imp. growth=75th pct) 0.264*** 0.240***
(0.012) (0.015)
C(FTAs negotiation=1, FTAs implemented=1, imp. growth=25th pct) 0.214*** 0.199***
(0.017) (0.020)
C(FTAs negotiation=1, FTAs implemented=1, imp. growth=75th pct) 0.226*** 0.211***
(0.018) (0.021)
Role of CUs:
C(CUs negotiation=0, CUs implemented=0) 0.359*** 0.341***
(0.025) (0.024)
C(CUs negotiation=1, CUs implemented=0) 0.183*** 0.184***
(0.026) (0.026)
C(CUs negotiation=0, CUs implemented=1, imp. growth=25th pct) 0.249*** 0.265***
(0.021) (0.030)
C(CUs negotiation=0, CUs implemented=1, imp. growth=75th pct) 0.287*** 0.305***
(0.024) (0.034)
C(CUs negotiation=1, CUs implemented=1, imp. growth=25th pct) 0.127*** 0.142***
(0.028) (0.035)
C(CUs negotiation=1, CUs implemented=1, imp. growth=75th pct) 0.146*** 0.164***
(0.032) (0.041)
Observations 9,144 9,144 Notes: The table reports average predicted counts for columns (2) and (4) of Table 3 conditioning on the variables
in the C(•) function (in Table 5) taking on the specified values while the other variables are taking their actual
values. ***, **, * denote significance at the 1%, 5%, and 10% level, respectively.
28
Table 6: Robustness: threshold of included PTAs
(1) (2) (3) (4)
ln(1+X) ln(1+X)
PTAs negotiationi,z,t -0.161*** -0.232**
(0.062) (0.102)
PTAs implementedi,z,t -0.398*** -0.619***
(0.107) (0.164)
FTAs negotiationi,z,t -0.010 0.068
(0.061) (0.105)
CUs negotiationi,z,t -0.625*** -0.833***
(0.160) (0.274)
FTAs implementedi,z,t -0.473*** -0.805***
(0.118) (0.171)
FTAs implementedi,z,t x Import growthi,j,t/t-1 0.151 0.291
(0.095) (0.207)
CUs implementedi,z,t -0.390*** -0.513
(0.151) (0.363)
CUs implementedi,z,t x Import growth i,j,t/t-1 0.289** 0.515**
(0.134) (0.217)
Import growthi,j,t/t-1 0.116* 0.113* -0.002 -0.030
(0.067) (0.068) (0.088) (0.099)
ln(Imports)i,j,t-1 0.623*** 0.629*** 0.595*** 0.597***
(0.061) (0.064) (0.057) (0.061)
ln(Real exchange rate)i,j,t-1 0.777*** 0.755*** 0.740*** 0.713***
(0.133) (0.134) (0.137) (0.140)
Importer GDP growthi,t/t-3 -0.619 -0.577 -0.540 -0.472
(0.497) (0.500) (0.534) (0.543)
Exporter GDP growthj,t/t-3 -0.072 -0.092 -0.139 -0.144
(0.375) (0.382) (0.382) (0.389)
Year FE Yes Yes Yes Yes
Dyad FE No No Yes Yes
Observations 9,144 9,144 9,144 9,144
Pseudo R2 0.23 0.23 0.24 0.24 Notes: The dependent variable is the count of AD measures introduced by country i against country j in year t.
PTAs are included in the regressors if they affect at least 5% of the import value of the importing country. The
table reports the estimated coefficients of negative binomial regressions with standard errors clustered at
country-pair level; ***, **, * denote significance at the 1%, 5%, and 10% level, respectively.
29
Table 7: Robustness: included country pairs
(1) (2) (3) (4)
ln(1+X) ln(1+X)
PTAs negotiationi,z,t -0.114* -0.203**
(0.060) (0.092)
PTAs implementedi,z,t -0.144** -0.293**
(0.073) (0.133)
FTAs negotiationi,z,t -0.002 -0.021
(0.056) (0.092)
CUs negotiationi,z,t -0.576*** -0.789***
(0.162) (0.238)
FTAs implementedi,z,t -0.165** -0.405***
(0.080) (0.146)
FTAs implementedi,z,t x Import growthi,j,t/t-1 0.051 0.079
(0.084) (0.173)
CUs implementedi,z,t -0.159 -0.165
(0.119) (0.217)
CUs implementedi,z,t x Import growth i,j,t/t-1 0.329*** 0.490***
(0.111) (0.167)
Import growthi,j,t/t-1 0.131** 0.131** 0.066 0.060
(0.064) (0.065) (0.071) (0.072)
ln(Imports)i,j,t-1 0.595*** 0.599*** 0.576*** 0.576***
(0.064) (0.064) (0.063) (0.062)
ln(Real exchange rate)i,j,t-1 0.725*** 0.722*** 0.745*** 0.738***
(0.126) (0.126) (0.128) (0.128)
Importer GDP growthi,t/t-3 -0.506 -0.537 -0.407 -0.342
(0.448) (0.448) (0.478) (0.480)
Exporter GDP growthj,t/t-3 0.120 0.115 0.008 -0.010
(0.358) (0.358) (0.361) (0.363)
PTA dummyi,j,t -0.334** -0.329** -0.337** -0.326**
(0.135) (0.133) (0.134) (0.134)
Negotiation dummyi,j,t 0.121 0.123 0.128 0.142
(0.126) (0.127) (0.128) (0.129)
Year FE Yes Yes Yes Yes
Dyad FE Yes Yes Yes Yes
Observations 11,715 11,715 11,715 11,715
Pseudo R2 0.23 0.23 0.23 0.23 Notes: The dependent variable is the count of AD measures introduced by country i against country j in year t.
PTAs are included in the regressors if they affect at least 10% of the import value of the importing country. The
table reports the estimated coefficients of negative binomial regressions with standard errors clustered at
country-pair level; ***, **, * denote significance at the 1%, 5%, and 10% level, respectively.
30
Table A1: PTAs included in the analysis when using a 10% threshold
PTA name Importing countries
included in the analysis
Type of
PTA
Still in
negotiation
ASEAN-Australia-New Zealand Australia, New Zealand, Indonesia FTA no
ASEAN-China China, Indonesia FTA no
ASEAN-India Indonesia FTA no
ASEAN-Japan Indonesia FTA no
ASEAN-South Korea Indonesia FTA no
Australia-China Australia FTA no
China-New Zealand New Zealand FTA no
China-South Korea China, South Korea FTA no
CUSFTA Canada, USA FTA no
EU15 enlargement EU CU no
EU25 enlargement EU CU no
EU-Canada Canada FTA yes
EU-Columbia-Peru-Ecuador Peru FTA no
EU-India India FTA yes
EU-SADC EPA South Africa FTA no
EU-South Africa South Africa FTA no
EU-Turkey Turkey CU no
Japan-South Korea South Korea FTA yes
MERCOSUR Argentina, Brazil CU no
NAFTA Canada, Mexico, USA FTA no
Peru-China Peru FTA no
TTIP EU, USA FTA yes
US-Australia Australia FTA no
US-Peru Peru FTA no Note: Agreements are classified as still in the negotiation based on their status at the end of 2015.
Table A2: Sample period of included importing countries
Country First year Last year
Argentina 1989 2015
Australia 1989 2015
Brazil 1988 2015
Canada 1980 2015
China 1997 2015
European Union 1980 2015
India 1992 2015
Indonesia 1996 2015
Mexico 1987 2015
New Zealand 1982 2015
Peru 1992 2015
South Africa 1992 2015
South Korea 1986 2015
Turkey 1989 2015
USA 1980 2015