do preferential trade agreements affect us exports
TRANSCRIPT
Union CollegeUnion | Digital Works
Honors Theses Student Work
6-2017
Do Preferential Trade Agreements Affect USExports? Empirical Evidence from US Export PanelDataBenjamin A. FayUnion College - Schenectady, NY
Follow this and additional works at: https://digitalworks.union.edu/theses
Part of the Econometrics Commons, and the Income Distribution Commons
This Open Access is brought to you for free and open access by the Student Work at Union | Digital Works. It has been accepted for inclusion in HonorsTheses by an authorized administrator of Union | Digital Works. For more information, please contact [email protected].
Recommended CitationFay, Benjamin A., "Do Preferential Trade Agreements Affect US Exports? Empirical Evidence from US Export Panel Data" (2017).Honors Theses. 25.https://digitalworks.union.edu/theses/25
brought to you by COREView metadata, citation and similar papers at core.ac.uk
provided by Union College: Union | Digital Works
Fay 1
Do Preferential Trade Agreements Affect US Exports? Empirical Evidence from US Export
Panel Data
Benjamin Fay
Professor Fuat Şener
* * * * * * * * * * * * *
Submitted in partial fulfillment
of the requirements for
Honors in the Economics Department
UNION COLLEGE
2016/2017
Fay 2
Acknowledgements
Thank you to my advisor Professor Fuat Şener for guiding me through this important learning
experience. Special thanks to Doctor Don Merino for valuable input on this project.
Content Abstract ......................................................................................................................................................... 3
Chapter 1: Introduction ................................................................................................................................ 4
Chapter 2: Literature Review ........................................................................................................................ 9
2.1 Background ............................................................................................................................................. 9
2.2 Preferential Trade Agreements............................................................................................................. 11
2.3 IPR Reform & US Companies................................................................................................................. 13
2.4 Contribution .......................................................................................................................................... 15
Chapter 3: Data Description and Econometric Model ................................................................................ 17
3.1 Data ....................................................................................................................................................... 17
3.2 PTA Variables ........................................................................................................................................ 20
3.3 Gravity Model ....................................................................................................................................... 20
3.4 Procedure and Expected Results .......................................................................................................... 22
3.5 Event Study of Signing ........................................................................................................................... 23
Chapter 4: Results ....................................................................................................................................... 32
4.1 PTA Signing ............................................................................................................................................ 32
4.2 PTA Entry into force .............................................................................................................................. 33
4.3 Event Study ........................................................................................................................................... 34
Chapter 5: Conclusion ................................................................................................................................. 36
5.1 Further Research ................................................................................................................................... 36
Fay 3
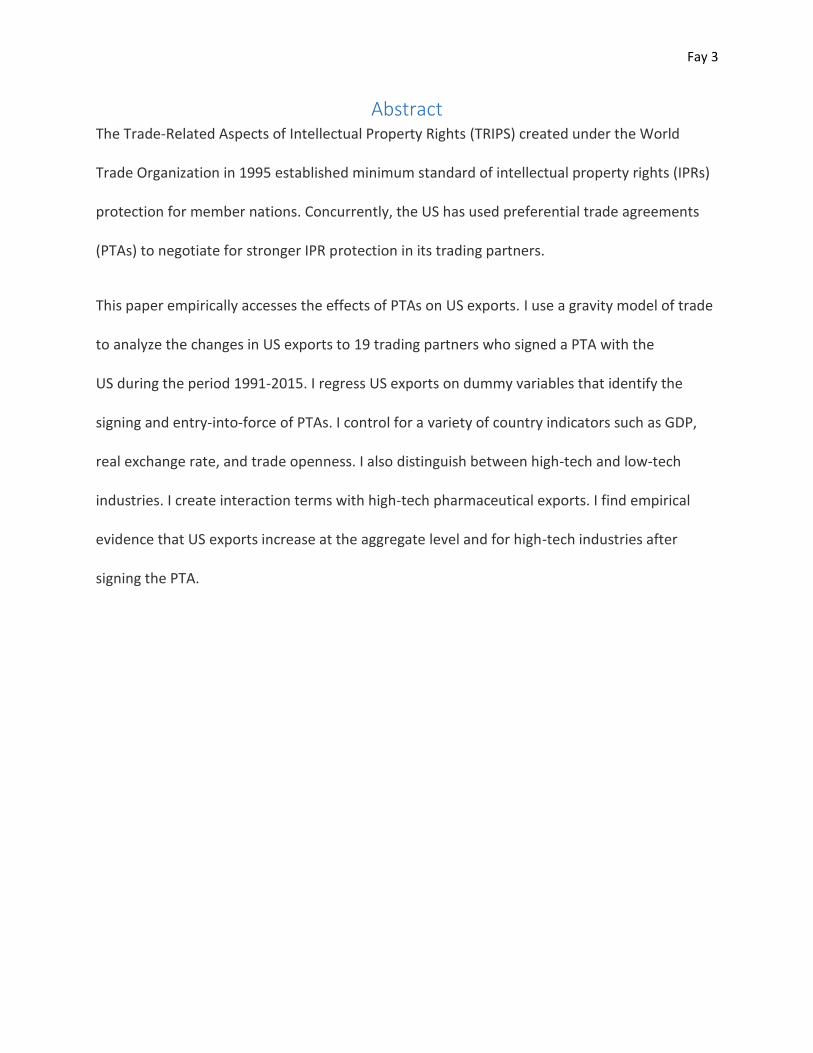
Abstract The Trade-Related Aspects of Intellectual Property Rights (TRIPS) created under the World
Trade Organization in 1995 established minimum standard of intellectual property rights (IPRs)
protection for member nations. Concurrently, the US has used preferential trade agreements
(PTAs) to negotiate for stronger IPR protection in its trading partners.
This paper empirically accesses the effects of PTAs on US exports. I use a gravity model of trade
to analyze the changes in US exports to 19 trading partners who signed a PTA with the
US during the period 1991-2015. I regress US exports on dummy variables that identify the
signing and entry-into-force of PTAs. I control for a variety of country indicators such as GDP,
real exchange rate, and trade openness. I also distinguish between high-tech and low-tech
industries. I create interaction terms with high-tech pharmaceutical exports. I find empirical
evidence that US exports increase at the aggregate level and for high-tech industries after
signing the PTA.
Fay 4
Chapter 1: Introduction
Numerous international trade agreements have been created to facilitate global trade
throughout modern history. The multilateral General Agreement on Tariffs and Trade (GATT)
was initially signed in 1947. The preamble of the GATT states it’s purpose is to “reduce tariffs
and other barriers to trade.” Since 1947, there have been nine rounds of negotiations. During
the Uruguay round in 1994, the World Trade Organization (WTO) and the Trade-Related
Aspects of Intellectual Property Rights (TRIPS) were created. TRIPS established a minimum
standard of intellectual property rights (IPRs) for the 123 members of the WTO.1 IPRs
protection is an important topic for international policy makers because uniform IPRs allow IP
sensitive industries to trade across borders seamlessly. Additionally, IPRs incentivize innovation.
IPRs encourage innovation by issuing temporary monopoly privileges. In addition to
allowing companies to generate profits free of competition, IPRs enable entities to recuperate
research and development costs. Society and consumers benefit after IPRs expire because the
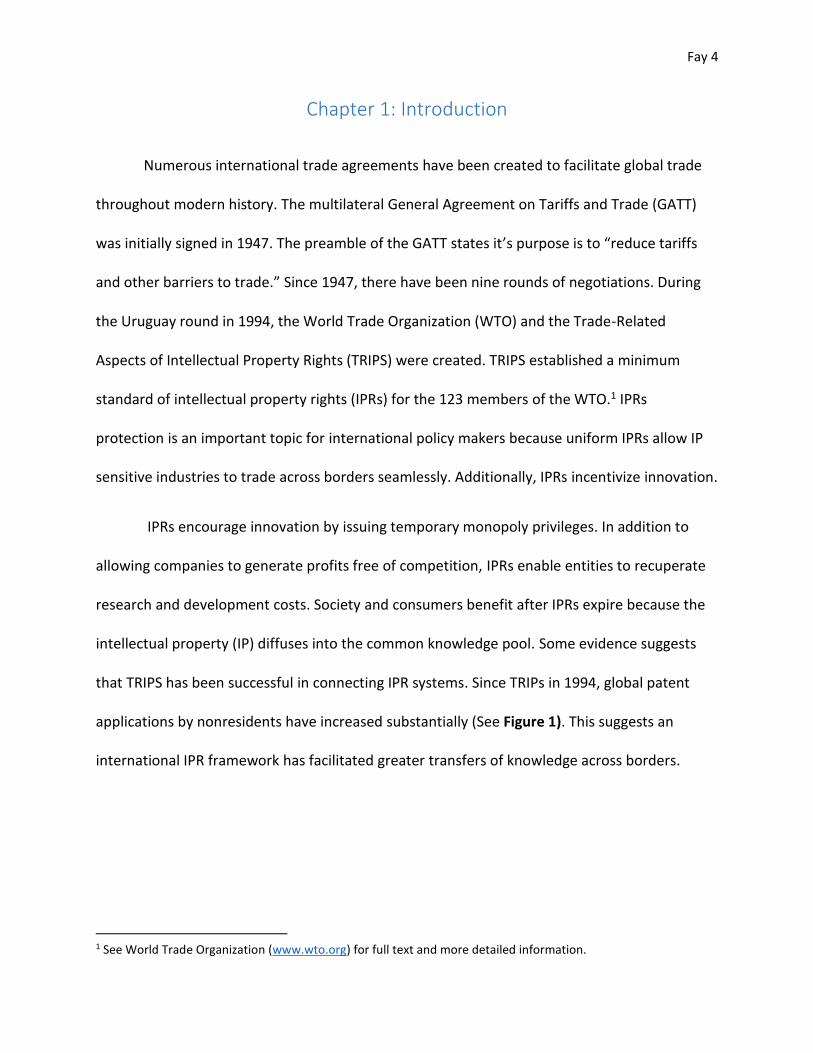
intellectual property (IP) diffuses into the common knowledge pool. Some evidence suggests
that TRIPS has been successful in connecting IPR systems. Since TRIPs in 1994, global patent
applications by nonresidents have increased substantially (See Figure 1). This suggests an
international IPR framework has facilitated greater transfers of knowledge across borders.
1 See World Trade Organization (www.wto.org) for full text and more detailed information.
Fay 5
The proliferation of preferential trade agreements (PTAs) is a more recent development
in the political economy. PTAs are bilateral agreements that reduce barriers to trade. The
number of PTAs has increased substantially in the last three decades. For example, 25 PTAs
were reported to WTO in 1990, by 2007 this figure increased to 194 (Foster and Stehrer, 2011).
Currently, the United States is a member of 20 PTAs, each with intellectual property provisions.
IPR protection is a mandatory condition of US preferential trade agreement
negotiations. In most cases, IPR provisions in these agreements expand IPRs beyond the TRIPS
minimum requirements. In recent PTAs, it has been ensured that IPR provisions provide
protections like those found in US law. The most recent PTA was signed with South Korea in
2007 and entered legal force in 2012. Chapter 18 of the US-Korean Agreement describes
intellectual property requirements and seeks to establish more “extensive protection and
Figure 1 Patent applications, nonresidents. Patent applications are worldwide patent applications filed through the Patent Cooperation Treaty procedure or with a national patent office for exclusive rights for an invention--a product or process that provides a new way of doing something or offers a new technical solution to a problem. A patent provides protection for the invention to the owner of the patent for a limited period, generally 20 years. (http://data.worldbank.org/indicator/IP.PAT.NRES)
Fay 6
enforcement.” 2The United States has recently negotiated the Trans-Pacific Partnership (TPP),
which features similar IP provisions. The TPP, negotiated under the Obama Administration,
creates new trade agreements with many countries. To put this deal in perspective, the TPP
encompasses “40 percent of the global GDP and nearly one-third of world trade among 800
million people” (Rogowsky, 2016, pg. 123). The TPP has an important IP component and
features an entire chapter on IPRs, including new protections for pharmaceutical companies.
The Trump administration has recently withdrawn from the TPP. The future of the TPP and
other American international trade agreements is yet to be seen.
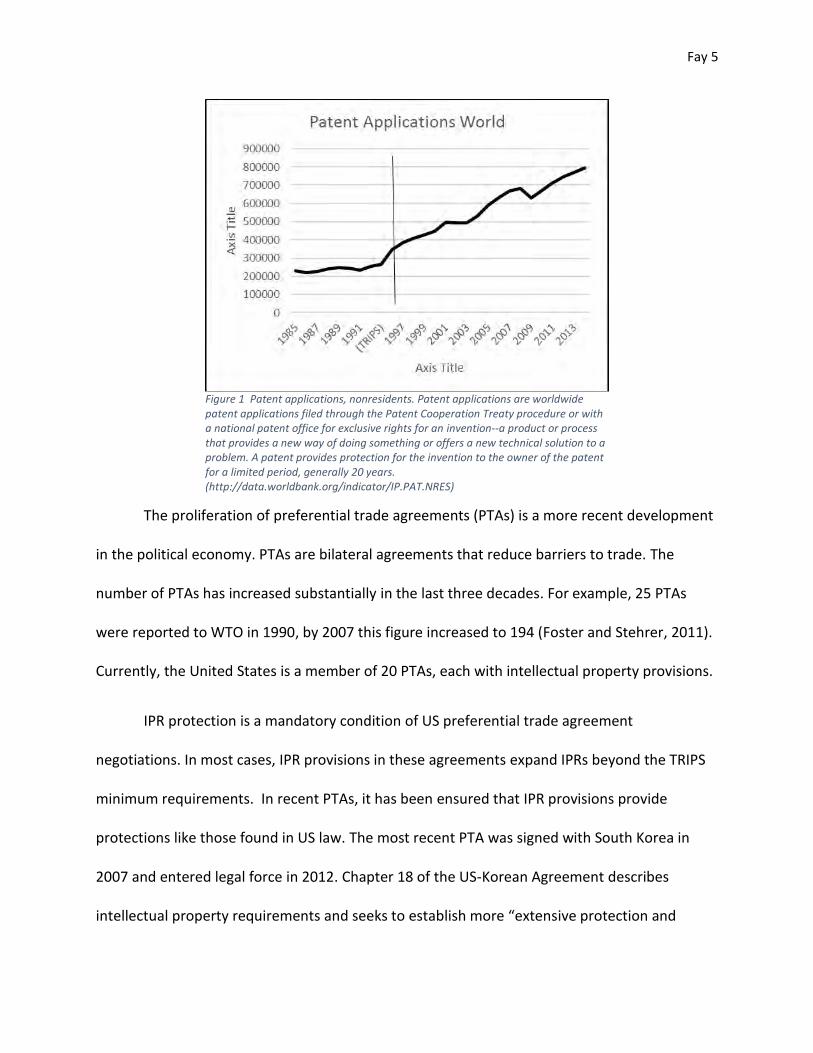
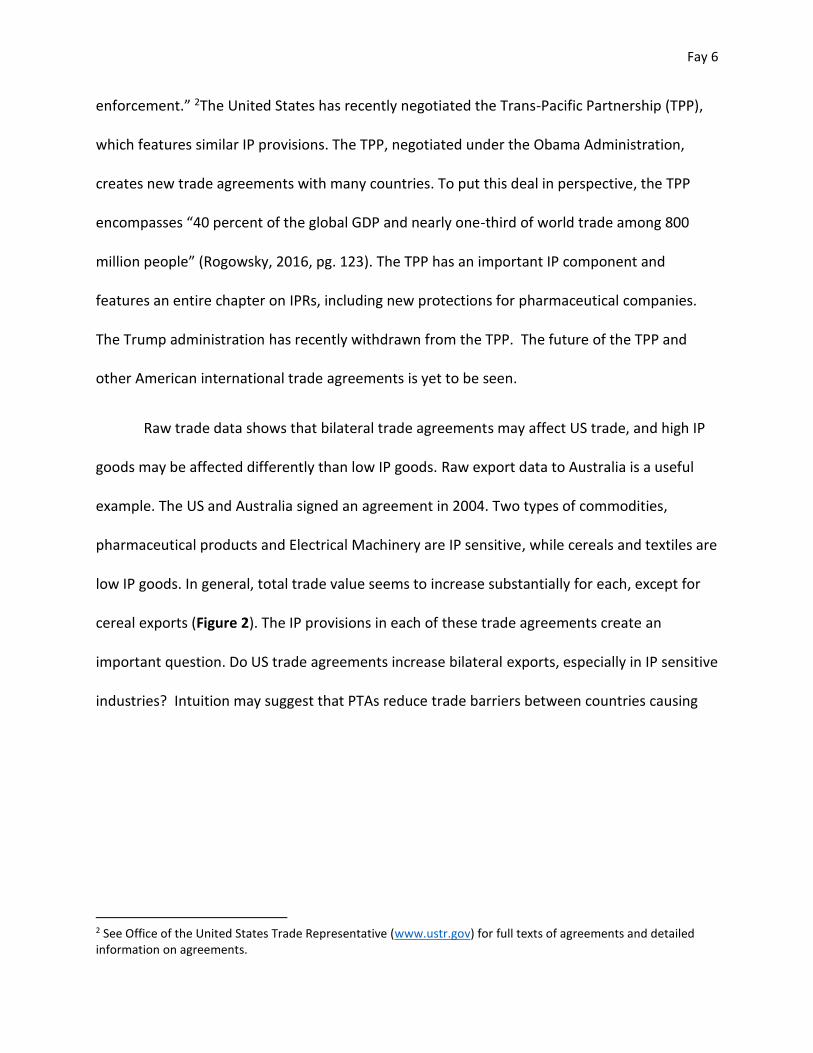
Raw trade data shows that bilateral trade agreements may affect US trade, and high IP
goods may be affected differently than low IP goods. Raw export data to Australia is a useful
example. The US and Australia signed an agreement in 2004. Two types of commodities,
pharmaceutical products and Electrical Machinery are IP sensitive, while cereals and textiles are
low IP goods. In general, total trade value seems to increase substantially for each, except for
cereal exports (Figure 2). The IP provisions in each of these trade agreements create an
important question. Do US trade agreements increase bilateral exports, especially in IP sensitive
industries? Intuition may suggest that PTAs reduce trade barriers between countries causing
2 See Office of the United States Trade Representative (www.ustr.gov) for full texts of agreements and detailed information on agreements.
Fay 7
exports to increase. Increased IP protection would suggest that high IP industries, especially
pharmaceuticals, may increase activity after the agreement is signed.
If this intuition is correct, to what extent do PTAs affect US exports? No studies have
focused exclusively on US preferential trade agreements and the responsiveness of US exports
to these bilateral trade agreements. With the TPP as a distinct possibility in the future, it is
crucial to understand how trade agreements created by the TPP would impact US trade. Thus,
this study contributes to a body of literature on the impact of PTAs on trade. The current study
will also contribute to a body of literature on the international management decisions of high-
tech US firms in response to IPR reform. Results show that total trade value of US commodities
Figure 2 US exports to Australia for 4 commodities. The preferential trade agreement with Australia was signed in 2004. Y axis is annual total trade value in nominal US. Data from UN Comtrade Database (https://comtrade.un.org/). Pharmaceutical and electrical machinery exports proxy for high IP goods, while textile and cereal exports proxy for low IP goods.
Fay 8
increased after PTAs were signed. In addition, the study finds that high-tech exports increased
with statistical significance after the PTA was signed.
In Chapter 2, I present an overview of the theoretical literature in IPRs and international
trade agreements. Next, I present empirical papers and findings pertaining to PTAs and US
responsiveness to IPR reform. I synthesize these papers, create my hypothesis, and identify an
econometric model that may be useful in identifying trade patterns related to PTAs.
In chapter 3, I specify my econometric model and explain its components and
justifications. I provide summary statistics and expected signs for the regression. Next I conduct
an event study around the signing date of PTAs. Lastly, I provide a summary of how I conducted
the experiment along with the fixed effects I utilized.
In chapter 4, I explain my results, interpret coefficients and present rationale for
significant findings. I also assess the robustness of the models I used. After, I explain the
findings of my event study of the PTAs. Finally, in Chapter 5, I conclude my analysis by
explaining the implications of my results in the context of US trade agreements and compare
my results to the literature. Lastly, I address limitations of my models, and suggest directions
for future research.
Fay 9
Chapter 2: Literature Review This section provides information on IPR and PTAs in the context of US international
trade, synthesizes empirical papers on Preferential Trade agreements, and finally presents
empirical papers on IPR reform and its impact upon the international activities of US
multinational firms.
2.1 Background Theoretical literature suggests IPRs have an impact on international trade flows. Unlike
physical property, knowledge is a non-rival good and can be used by many parties without
reducing the quantity or quality of the good. Without an intellectual property regime to protect
its use, knowledge is non-excludable. Maskus (2012) argues that we live in a Global Knowledge
economy in which innovation and ability to commercialize knowledge determines a nation’s
economic success. Although monopolies are usually seen as a detriment to economic
performance, IPR protection offsets the short-term costs of market inefficiencies with future
competition resulting in superior aggregate outcomes for all involved.3
Developed nations have expanded intellectual property rights using international trade
agreements throughout modern history. The GATT, which later became the WTO, created
Trade-Related Aspects of Intellectual Property Rights (TRIPS) in 1994. TRIPS was an important
international policy development for global intellectual property rights. TRIPS created the most
comprehensive international IP agreement in history by implementing superior dispute
resolution. Concurrently, the United States has aimed to expand IPRs further using bilateral
3 See Maskus (2012) for a comprehensive overview of the economic theory of IPRs and information on US preferential trade agreements.
Fay 10
trade agreements. The United States has made intellectual property a demand in its trade
negotiation process. The US has been able to expand IPRs beyond the TRIPS in its’ PTAs. This
has been coined the TRIPS-Plus negotiation strategy. The main components of the TRIPS Plus
provisions are “greater enforcement, exportation of US laws, upgraded standards abroad, and
technological protection of digital content” (Maskus,2012, pg. 122).
The TPP makes extensive IPR requirement for participating nations. Rogowsky (2016)
explains Intellectual Property rights in the Trans-Pacific Partnership. The TPP is more
demanding of IPRs enforcement, including more criminal liability for infringement. IPRs in the
TPP are especially extensive for pharmaceutical companies. Branstetter(2016) discusses the
additional pharmaceutical IPR created by the TPP. Intellectual property is an especially
important topic in the context of the US pharmaceutical industry because additional protection
provides pharmaceutical developers with the necessary incentives to engage in costly research
and development. The TPP provides a period of protection called data exclusivity specifically for
pharmaceutical companies. Data exclusivity prohibits any generic competitor from using the
drug manufacturers data on the effectiveness and clinical trials of the drug to create similar
medicines that are not covered under their patents during the protective period. Data
exclusivity is controversial because it exists simultaneously to the patent and can extend even
after the patent has expired. The TPP also contains certain additional legal obligations of
member states regarding the resolution of patent disputes that protect American
Pharmaceutical companies. For example, these provisions include mandatory notification of
the patent holder of any request to market a generic drug that may infringe on a patent. The
TPP also provides provisions that allow for patent term extensions in the event of regulatory
Fay 11
delays. This is very much like the 1984 Hatch-Waxman Act in the United States. Intuitively, the
extensive IP protections in the TPP should be positive for US high-tech industries.
2.2 Preferential Trade Agreements A substantial amount of literature has addressed the impact of entry into a PTA on
trade. Goldstein et al.(2007) uses a gravity model to analyze the impact of the multilateral GATT
and WTO trade agreements. The gravity model is the workhorse equation in bilateral trade
research. 4 The authors use import data between countries from 1946 to 2007 as their
dependent ant variable. They find that the GATT WTO may expanded commerce by
approximately 70 percent between industrial nations, by approximately 45 percent between an
industrial and a developing nation. Furthermore, empirical results indicate that bilateral
agreements have a substantial impact on trade. In reciprocal PTA’s they found trade increased
by between approximately 29 and 34 percent.
This paper looks at the magnitude, but not the impact of PTAs on inter industry or intra
industry trade. Foster and Stehrer (2011) analyze the impact of PTA on the structure of member
countries trade. Using a Sample 1962- 2000 168 countries the authors use a Gravity model of
trade to identify the effects of entry into a PTA. The authors use Grubel-Lloyd index of intra
industry trade as a proxy for trade composition and dummy variables in this equation account
for the presence of a PTA.
Their results showed overall intra-industry trade between richer countries increased
significantly. There was a positive impact of the PTA on intra industry trade among poorer
4 See Methodology for further explanation of the gravity model
Fay 12
countries as well, but of a smaller magnitude. This is consistent with the intuition that richer
countries already have necessary infrastructure, and when the PTA is created industries engage
in more intra industry trade.
Previous literature does not account for differences in content across PTAs. Dur et
al.(2013) addresses the impact of PTAs on trade looking specifically at content and design of the
agreements. Some agreements, like the EU, are very broad. On the other hand, some
agreements are narrower and require fewer commitments. Tariffs have been studied
extensively by a bulk of literature, but other provisions in PTAs, such as IPR, are likely
important. To account for depth, the authors create a new data set that codes for agreement
depth. Provisions that create depth include statements on services trade, investment
standards, public procurement, competition, IPR. Using a gravity econometric model, the
authors analyze exports between countries for 536 PTAs signed between 1945 and 2009.
The empirical findings suggest that PTAs increase exports between two countries,
especially those agreements with depth. Overall the results stress the significance of design of a
PTA as an important determinant of trade flow. One of these factors of depth is the presence
of IPR in the treaty. These results follow the intuition that strong international institutions make
international businesses more confident in their ability to market IP sensitive goods abroad.
This paper did not differentiate between PTAs based on IP provisions. Maskus and
Ridley (2016) investigate how PTAs with complex IPR impact aggregate exports and aggregate
imports, relative to a control group. The authors use a treatment-control technique, where the
treatment group is comprised of countries who will eventually become members of a PTA with
IP provisions, to measure the impact on aggregate exports and imports, controlling for high-IP
Fay 13
goods. The authors classify goods based on IP intensity clustering errors for IP intensity. The
countries in the data set are then broken into middle and low income groups based on national
income levels from UN Comrade and World Bank. The authors include a control for each
nations level of TRIPS compliance to further isolate the impact of IPR on trade.
The authors find that trade agreements that contain IP provisions have significant
effects on countries aggregate trade, especially in middle income and developing countries. The
effects are also seen sectors of high and low income countries as well. These results also seem
consistent with the intuition a more pronounced IPR regulatory framework creates conditions
that facilitate international trade. For further investigation Maskus and Ridley(2016) suggest
that bilateral trade would provide a better understanding of trade patterns in relation to PTAs
with IP provisions.
2.3 IPR Reform & US Companies Branstetter et al. (2006) investigate the impact of IPR reform on tech transfer for U.S.
multinational firms (MNF) in 16 countries. In environments with weak patent protection, MNF
risk their technology being leaked to other firms, without being able to collect damages. In
theory, MNF should respond to IP reforms by increasing tech transfers. Two indicators that
demonstrate increased tech transfer include exporting production abroad and hiring workers in
these countries. Branstetter et al. (2006) uses data on 2156 firms with 12,961 affiliate
companies collected in BEA US bureau of economic analysis surveys from 1982 to 1999. IPR
reform is measured as increased protection in 5 specific areas. These are coverage of protection
for more types of goods, expansion of scope, increase in length, improvements in enforcement,
and improvements in administration. The authors use 16 countries and their timing who
Fay 14
underwent extensive IPR reform reforming countries, 15 of which expanded protections in at
least 4 of the 5 dimensions (Maskus, 2000, Qian,2004, Ginarte and Park, 1997). The dependent
variables are intrafirm royalty payments, affiliate research and development expenditures, and
the growth rate of nonresident patent applications. The authors use reform dummies and a
number of fixed effects and country specific controls. In addition the authors conduct an event
study on each of the dependent variables, using a series of timing dummies to identify a
possible anticipation or lagged effect of the reform
The authors find royalty payments for technology transfers and affiliate research and
development expenditures increase after IPR reform. Additionally, these increases were
concentrated mostly among parent and affiliate companies that use patents heavily before
reform. The findings suggest royalty payments increase by about 34 percent after reform in
these affiliates. Interestingly the authors do not identify any upward trend before the reforms
take place. They also concluded that the growth in the rate nonresident patent filing increases,
while resident patent filing does not.
Following Branstetter et al. (2006), Canals and Şener (2011) analyze the offshoring
activities of US industries in the years surrounding IPR reform. In theory, better protection of
proprietary technology should encourage greater technology transfer among US firms. This
should manifest itself in more offshoring activities especially those firms who own foreign
production facilities, hire foreign contractors, and work closely with local suppliers. The impact
of IPR reform should be especially large in high-tech industries.
Fay 15
The data in this paper consists of 23 US industries and 16 trade partners from 1973 to
2006. The authors construct two measures of offshoring intensity to use in this analysis. Broad
offshoring intensity is defined as the value of intermediate goods imported by a US industry
from all industries of the partner country to produce one dollar of product. Intra industry
offshoring is defined as the import of intermediate goods that a US industry from the same
industry in the other country to produce one dollar of output. Canals and Şener (2011) use an
econometric model consisting of country characteristics, a reform dummy, and high tech
interaction term along with country specific time trends, country-industry, and time fixed
effects. The authors also use pre-and post-reform dummies and interaction terms in an event
study to identify possible anticipation or lags in offshoring in response to IPR reform.
Empirical findings indicate that high tech industries expand offshoring activities in
response to reform. In broad offshoring, an estimated 27% when compared to low-tech
industries: In intra-industry offshoring an estimated increase of 82% relative to low-tech
industries. The authors also find that pre-reform dummies are mostly insignificant, indicating
that there is not an anticipation effect of the IPR reform. However, the regressions identify an
effect on high tech industries 2 to 3 years after the reform in broad offshoring, and 3 to 4 years
after reform in intra industry off shoring.
2.4 Contribution The literature suggests that trade agreements that require increased IP protections
should result in increased trade, especially among for the US in high-tech industries. Maskus
and Ridley (2016) looked at PTAs with IP provisions using aggregate trade data. Canals and
Şener (2011) found that high-tech industries US industries respond positively to IPR reform in
Fay 16
other nations. Synthesizing the two findings, this paper investigates how US exports to a nation
change after signing a PTAs with that nation. First differentiating between high-Tech and
pharmaceutical commodity exports.
Fay 17
Chapter 3: Data Description and Econometric Model First, this section describes the data. Next, it explains the gravity model, the binary
variables, and the specification of the model. Finally, it provides a brief narrative of the
procedure of the analysis.
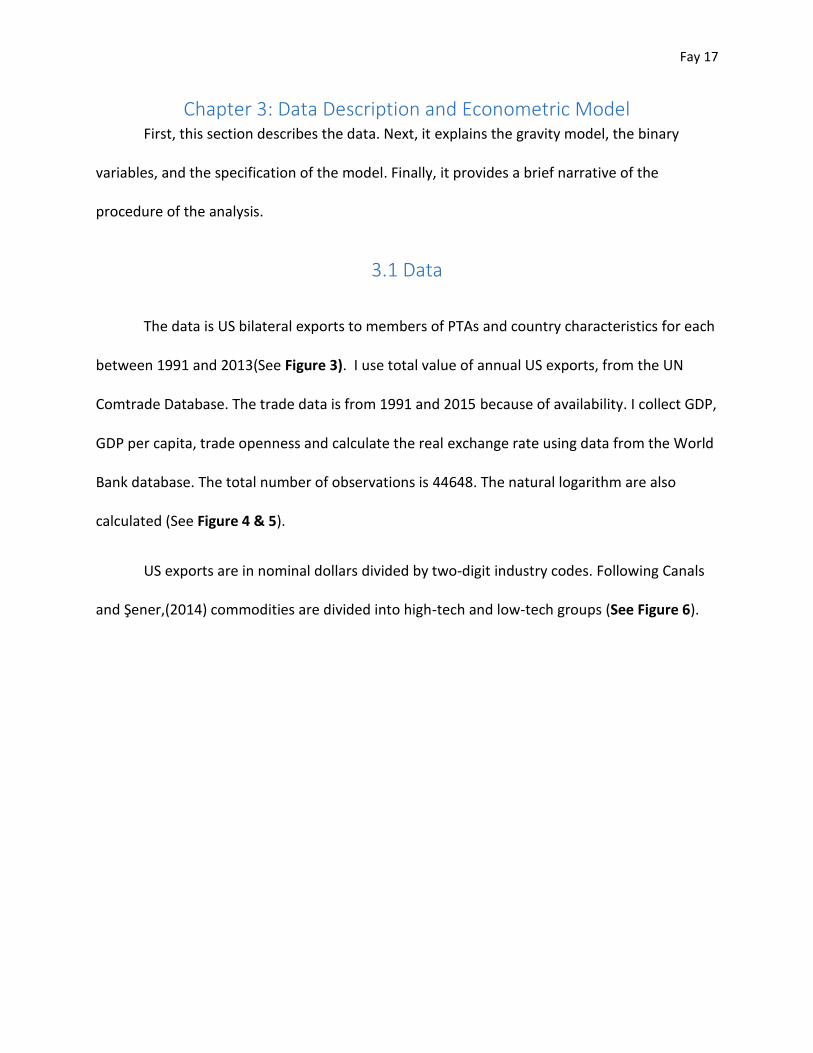
3.1 Data
The data is US bilateral exports to members of PTAs and country characteristics for each
between 1991 and 2013(See Figure 3). I use total value of annual US exports, from the UN
Comtrade Database. The trade data is from 1991 and 2015 because of availability. I collect GDP,
GDP per capita, trade openness and calculate the real exchange rate using data from the World
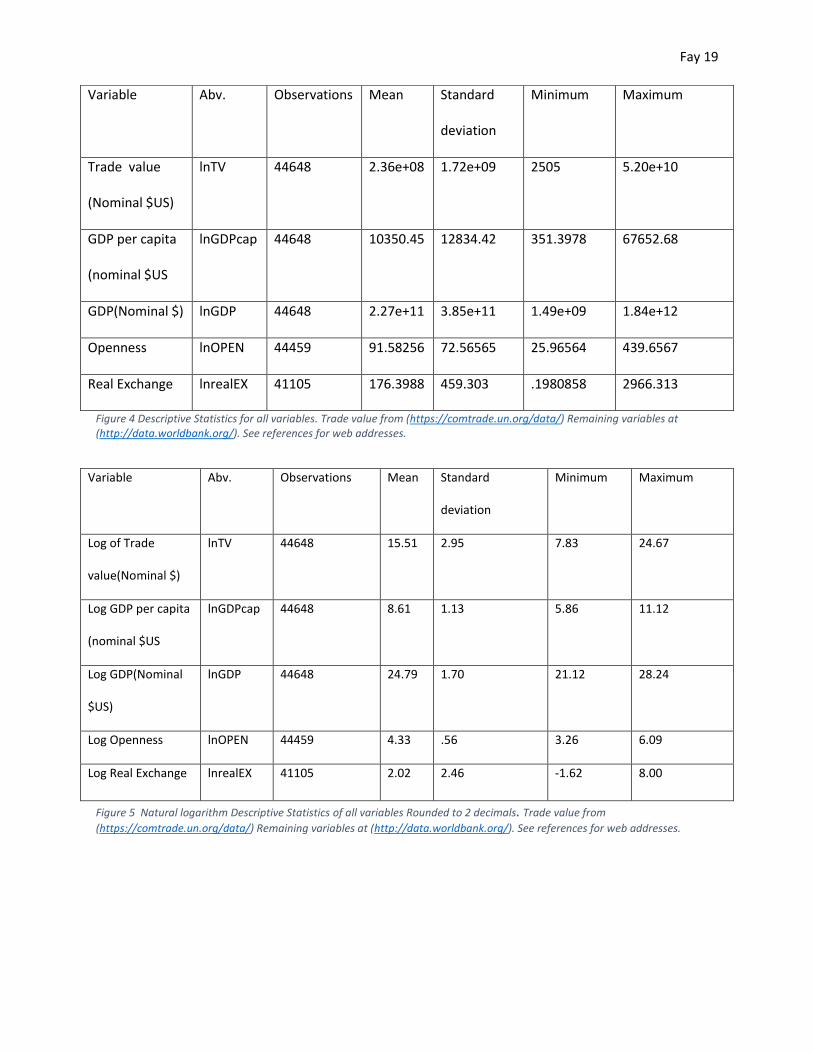
Bank database. The total number of observations is 44648. The natural logarithm are also
calculated (See Figure 4 & 5).
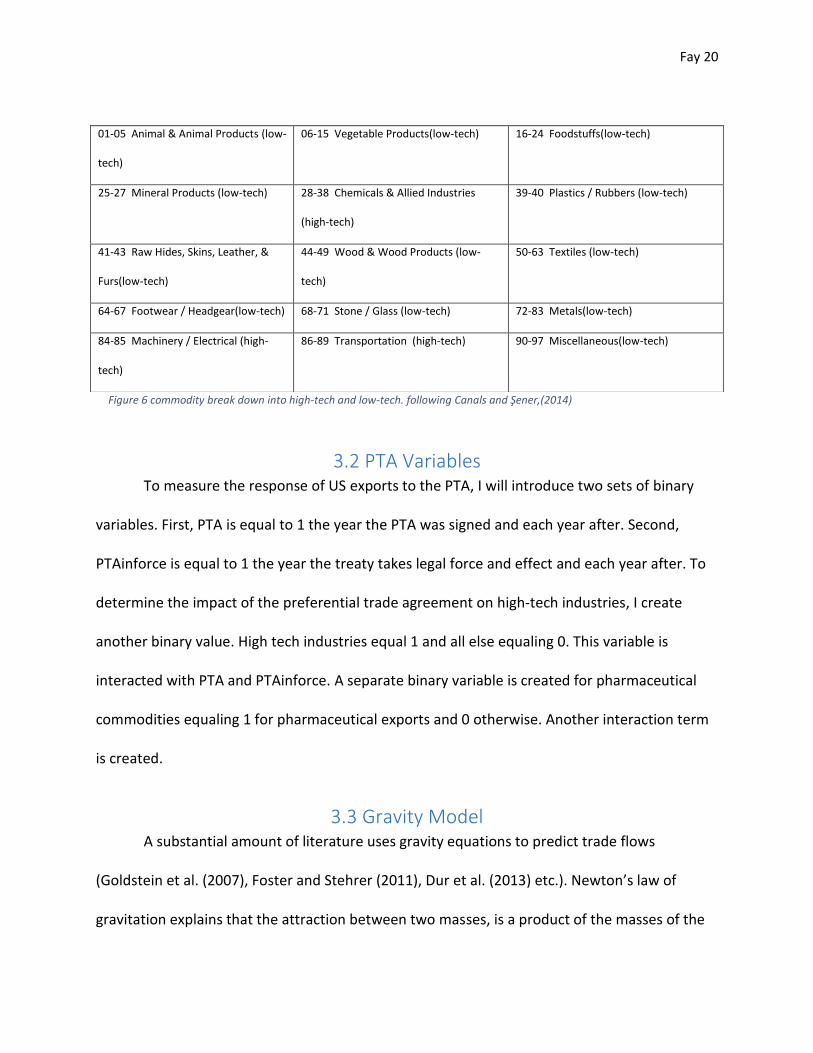
US exports are in nominal dollars divided by two-digit industry codes. Following Canals
and Şener,(2014) commodities are divided into high-tech and low-tech groups (See Figure 6).
Fay 18
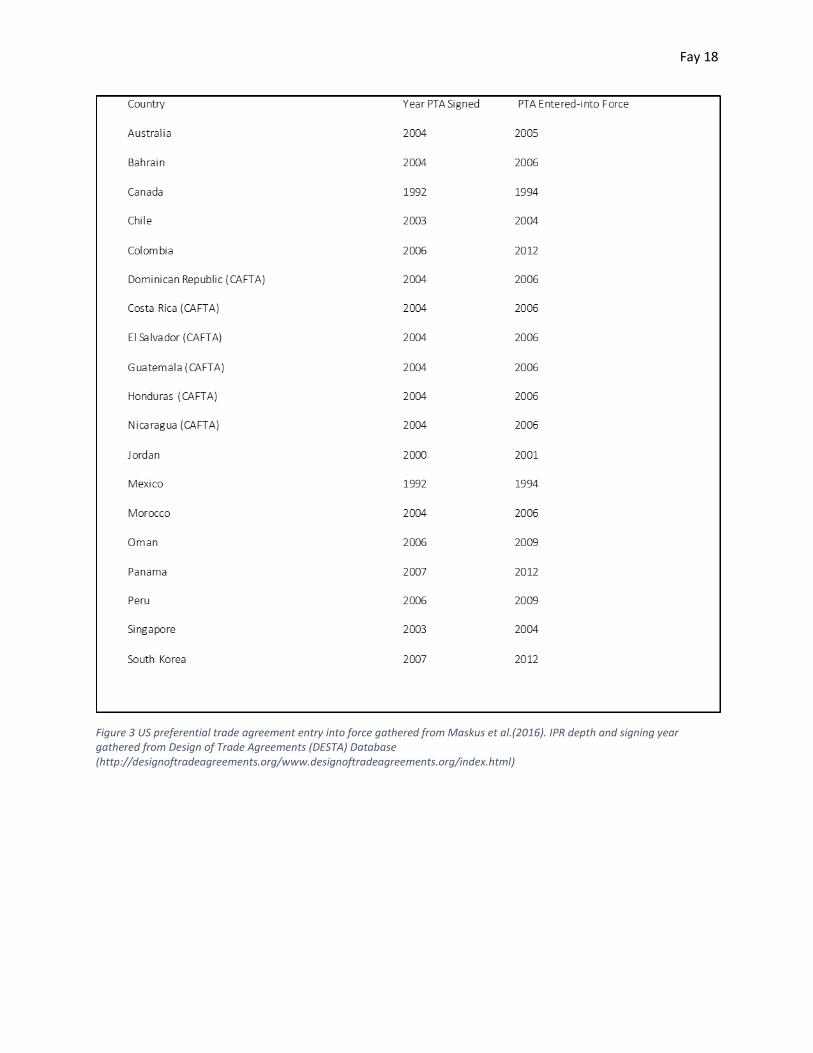
Figure 3 US preferential trade agreement entry into force gathered from Maskus et al.(2016). IPR depth and signing year gathered from Design of Trade Agreements (DESTA) Database (http://designoftradeagreements.org/www.designoftradeagreements.org/index.html)
Fay 19
Figure 4 Descriptive Statistics for all variables. Trade value from (https://comtrade.un.org/data/) Remaining variables at (http://data.worldbank.org/). See references for web addresses.
Variable Abv. Observations Mean Standard
deviation
Minimum Maximum
Log of Trade
value(Nominal $)
lnTV 44648 15.51 2.95 7.83 24.67
Log GDP per capita
(nominal $US
lnGDPcap 44648 8.61 1.13 5.86 11.12
Log GDP(Nominal
$US)
lnGDP 44648 24.79 1.70 21.12 28.24
Log Openness lnOPEN 44459 4.33 .56 3.26 6.09
Log Real Exchange lnrealEX 41105 2.02 2.46 -1.62 8.00
Figure 5 Natural logarithm Descriptive Statistics of all variables Rounded to 2 decimals. Trade value from
(https://comtrade.un.org/data/) Remaining variables at (http://data.worldbank.org/). See references for web addresses.
Variable Abv. Observations Mean Standard
deviation
Minimum Maximum
Trade value
(Nominal $US)
lnTV 44648 2.36e+08 1.72e+09 2505 5.20e+10
GDP per capita
(nominal $US
lnGDPcap 44648 10350.45 12834.42 351.3978 67652.68
GDP(Nominal $) lnGDP 44648 2.27e+11 3.85e+11 1.49e+09 1.84e+12
Openness lnOPEN 44459 91.58256 72.56565 25.96564 439.6567
Real Exchange lnrealEX 41105 176.3988 459.303 .1980858 2966.313
Fay 20
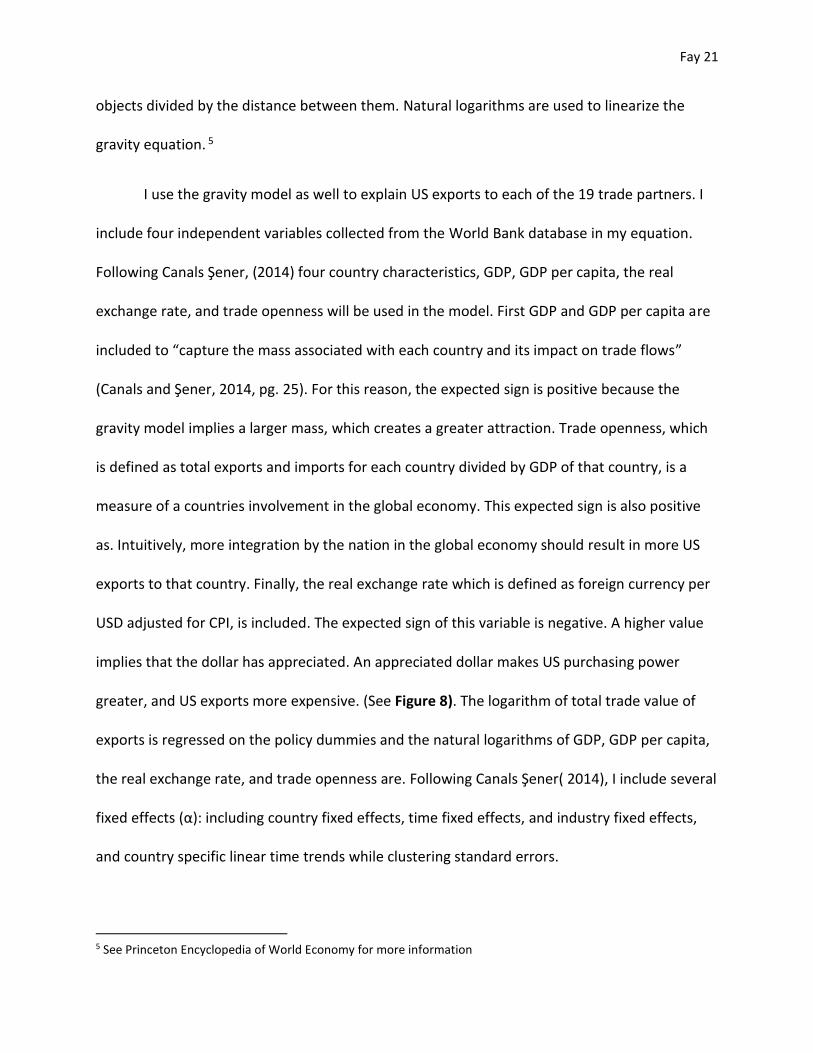
3.2 PTA Variables To measure the response of US exports to the PTA, I will introduce two sets of binary
variables. First, PTA is equal to 1 the year the PTA was signed and each year after. Second,
PTAinforce is equal to 1 the year the treaty takes legal force and effect and each year after. To
determine the impact of the preferential trade agreement on high-tech industries, I create
another binary value. High tech industries equal 1 and all else equaling 0. This variable is
interacted with PTA and PTAinforce. A separate binary variable is created for pharmaceutical
commodities equaling 1 for pharmaceutical exports and 0 otherwise. Another interaction term
is created.
3.3 Gravity Model A substantial amount of literature uses gravity equations to predict trade flows
(Goldstein et al. (2007), Foster and Stehrer (2011), Dur et al. (2013) etc.). Newton’s law of
gravitation explains that the attraction between two masses, is a product of the masses of the
01-05 Animal & Animal Products (low-
tech)
06-15 Vegetable Products(low-tech) 16-24 Foodstuffs(low-tech)
25-27 Mineral Products (low-tech) 28-38 Chemicals & Allied Industries
(high-tech)
39-40 Plastics / Rubbers (low-tech)
41-43 Raw Hides, Skins, Leather, &
Furs(low-tech)
44-49 Wood & Wood Products (low-
tech)
50-63 Textiles (low-tech)
64-67 Footwear / Headgear(low-tech) 68-71 Stone / Glass (low-tech) 72-83 Metals(low-tech)
84-85 Machinery / Electrical (high-
tech)
86-89 Transportation (high-tech) 90-97 Miscellaneous(low-tech)
Figure 6 commodity break down into high-tech and low-tech. following Canals and Şener,(2014)
Fay 21
objects divided by the distance between them. Natural logarithms are used to linearize the
gravity equation. 5
I use the gravity model as well to explain US exports to each of the 19 trade partners. I
include four independent variables collected from the World Bank database in my equation.
Following Canals Şener, (2014) four country characteristics, GDP, GDP per capita, the real
exchange rate, and trade openness will be used in the model. First GDP and GDP per capita are
included to “capture the mass associated with each country and its impact on trade flows”
(Canals and Şener, 2014, pg. 25). For this reason, the expected sign is positive because the
gravity model implies a larger mass, which creates a greater attraction. Trade openness, which
is defined as total exports and imports for each country divided by GDP of that country, is a
measure of a countries involvement in the global economy. This expected sign is also positive
as. Intuitively, more integration by the nation in the global economy should result in more US
exports to that country. Finally, the real exchange rate which is defined as foreign currency per
USD adjusted for CPI, is included. The expected sign of this variable is negative. A higher value
implies that the dollar has appreciated. An appreciated dollar makes US purchasing power
greater, and US exports more expensive. (See Figure 8). The logarithm of total trade value of
exports is regressed on the policy dummies and the natural logarithms of GDP, GDP per capita,
the real exchange rate, and trade openness are. Following Canals Şener( 2014), I include several
fixed effects (α): including country fixed effects, time fixed effects, and industry fixed effects,
and country specific linear time trends while clustering standard errors.
5 See Princeton Encyclopedia of World Economy for more information
Fay 22
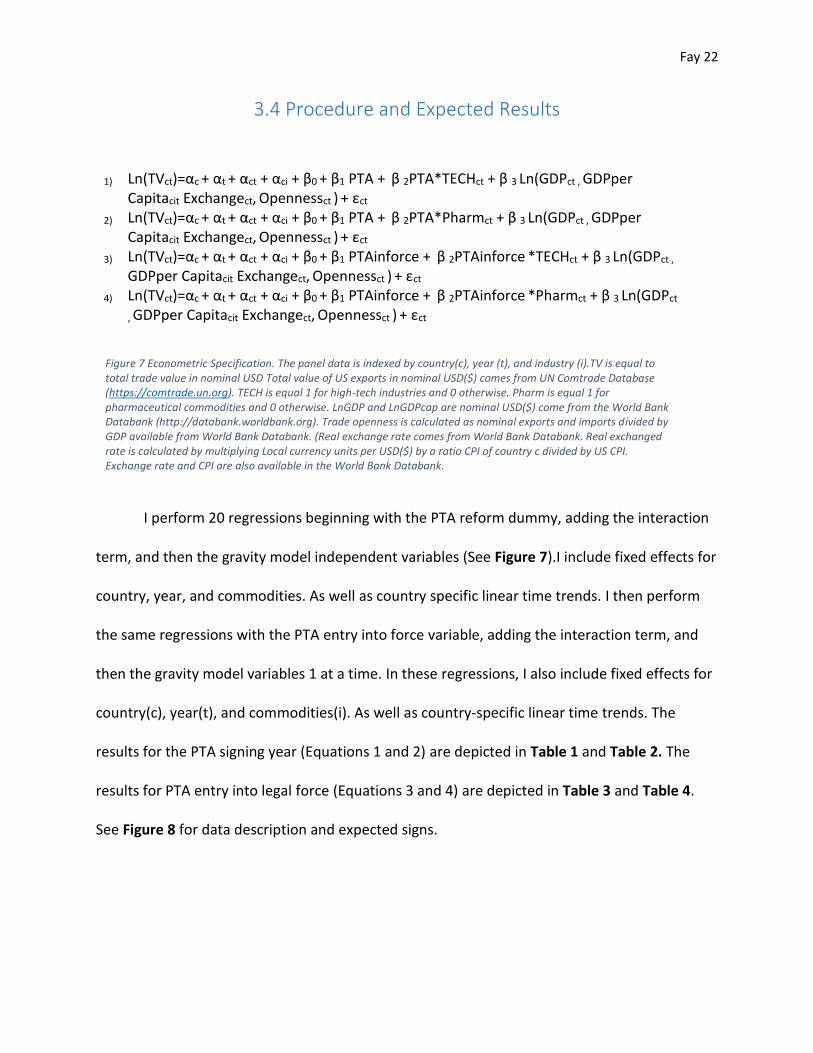
3.4 Procedure and Expected Results
I perform 20 regressions beginning with the PTA reform dummy, adding the interaction
term, and then the gravity model independent variables (See Figure 7).I include fixed effects for
country, year, and commodities. As well as country specific linear time trends. I then perform
the same regressions with the PTA entry into force variable, adding the interaction term, and
then the gravity model variables 1 at a time. In these regressions, I also include fixed effects for
country(c), year(t), and commodities(i). As well as country-specific linear time trends. The
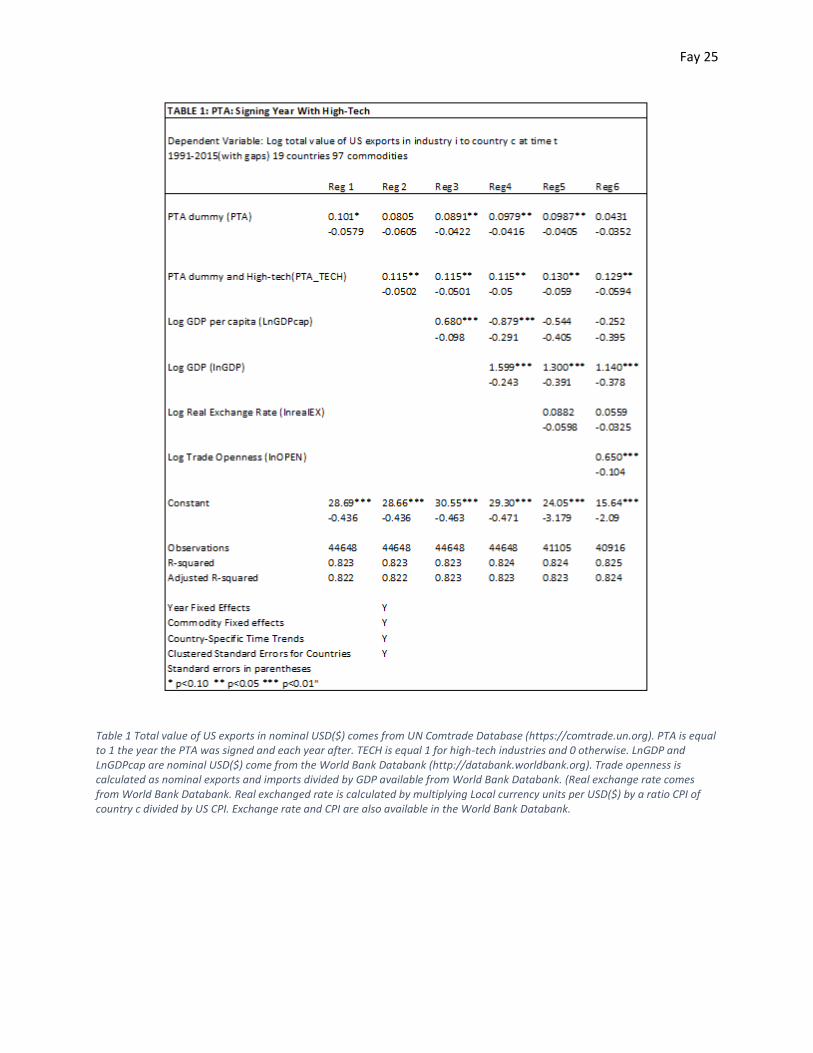
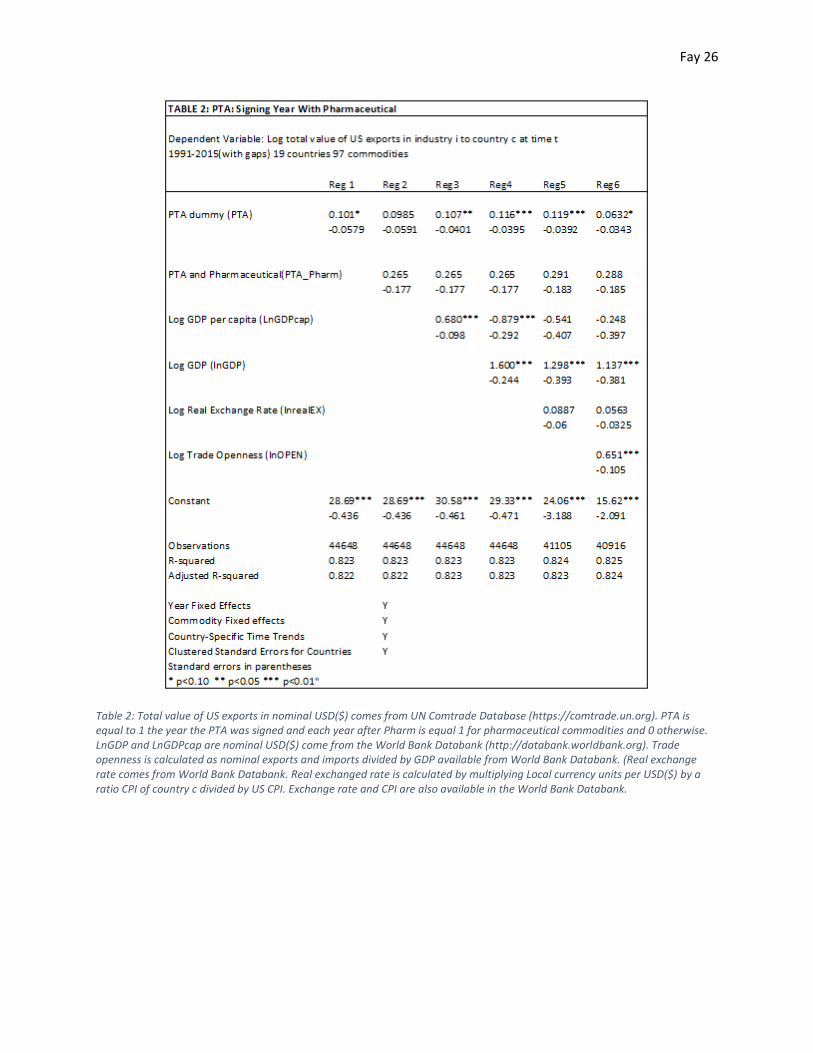
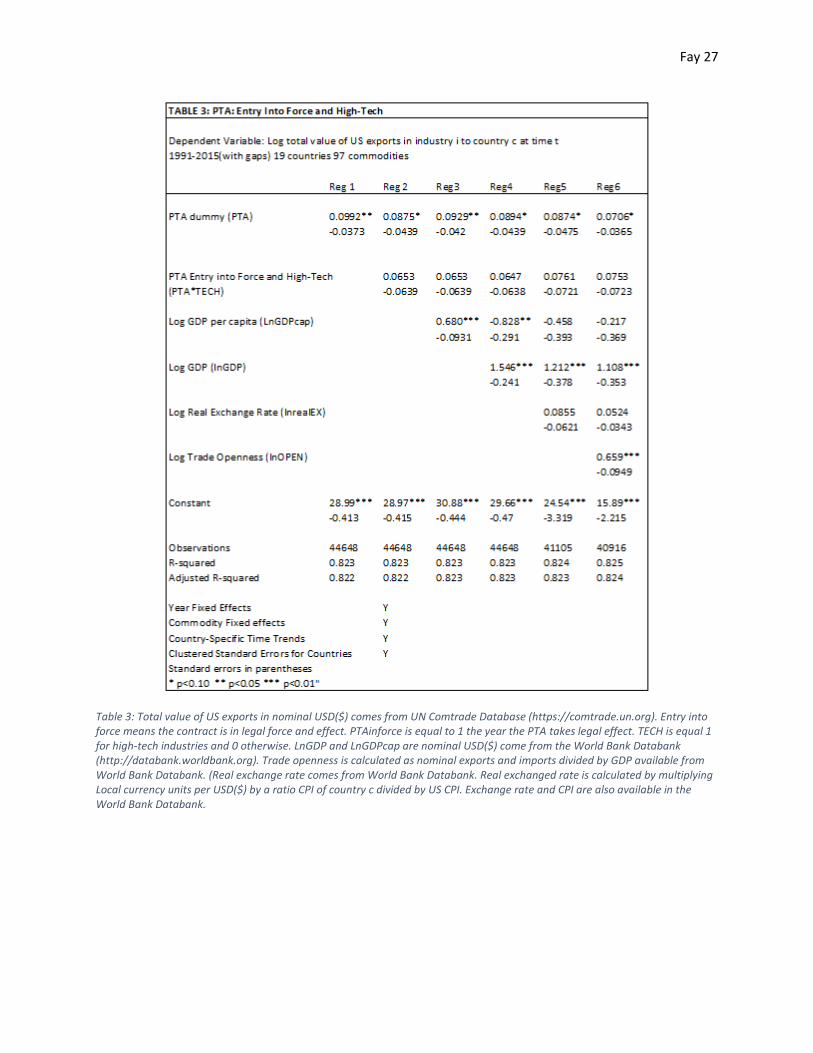
results for the PTA signing year (Equations 1 and 2) are depicted in Table 1 and Table 2. The
results for PTA entry into legal force (Equations 3 and 4) are depicted in Table 3 and Table 4.
See Figure 8 for data description and expected signs.
1) Ln(TVct)=αc + αt + αct + αci + β0 + β1 PTA + β 2PTA*TECHct + β 3 Ln(GDPct , GDPper Capitacit Exchangect, Opennessct ) + εct
2) Ln(TVct)=αc + αt + αct + αci + β0 + β1 PTA + β 2PTA*Pharmct + β 3 Ln(GDPct , GDPper Capitacit Exchangect, Opennessct ) + εct
3) Ln(TVct)=αc + αt + αct + αci + β0 + β1 PTAinforce + β 2PTAinforce *TECHct + β 3 Ln(GDPct ,
GDPper Capitacit Exchangect, Opennessct ) + εct
4) Ln(TVct)=αc + αt + αct + αci + β0 + β1 PTAinforce + β 2PTAinforce *Pharmct + β 3 Ln(GDPct
, GDPper Capitacit Exchangect, Opennessct ) + εct
Figure 7 Econometric Specification. The panel data is indexed by country(c), year (t), and industry (i).TV is equal to total trade value in nominal USD Total value of US exports in nominal USD($) comes from UN Comtrade Database (https://comtrade.un.org). TECH is equal 1 for high-tech industries and 0 otherwise. Pharm is equal 1 for pharmaceutical commodities and 0 otherwise. LnGDP and LnGDPcap are nominal USD($) come from the World Bank Databank (http://databank.worldbank.org). Trade openness is calculated as nominal exports and imports divided by GDP available from World Bank Databank. (Real exchange rate comes from World Bank Databank. Real exchanged rate is calculated by multiplying Local currency units per USD($) by a ratio CPI of country c divided by US CPI. Exchange rate and CPI are also available in the World Bank Databank.
Fay 23
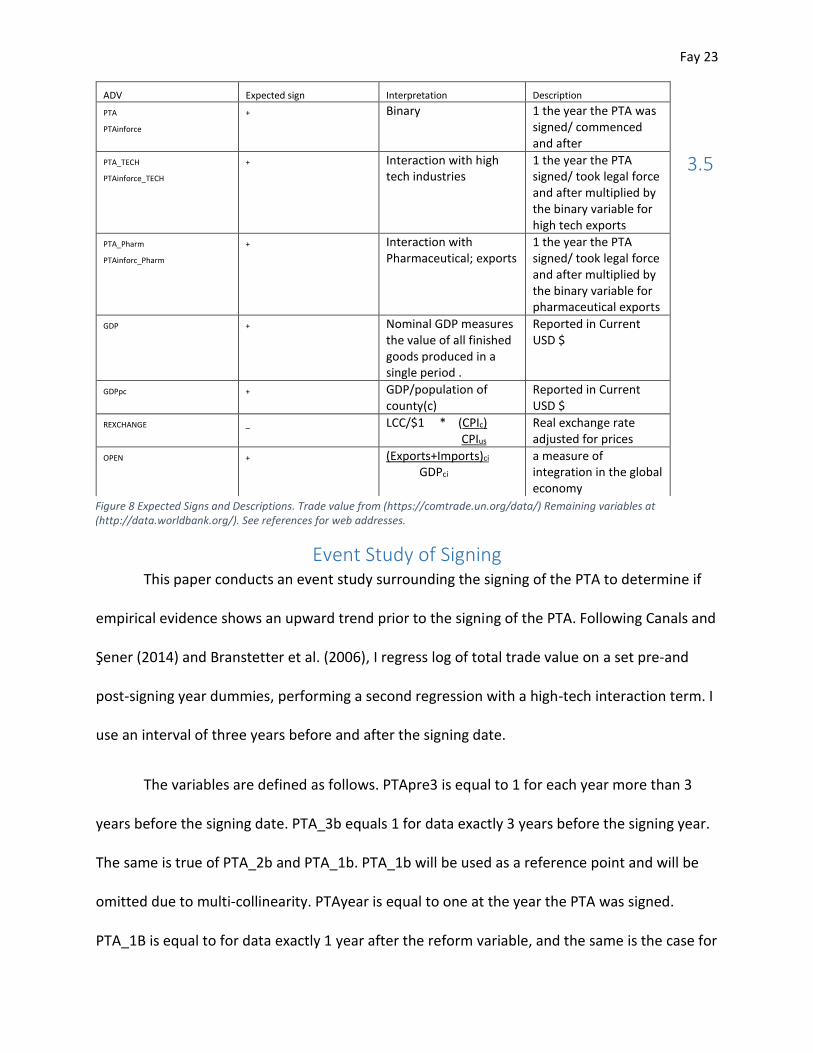
3.5
Event Study of Signing This paper conducts an event study surrounding the signing of the PTA to determine if
empirical evidence shows an upward trend prior to the signing of the PTA. Following Canals and
Şener (2014) and Branstetter et al. (2006), I regress log of total trade value on a set pre-and
post-signing year dummies, performing a second regression with a high-tech interaction term. I
use an interval of three years before and after the signing date.
The variables are defined as follows. PTApre3 is equal to 1 for each year more than 3
years before the signing date. PTA_3b equals 1 for data exactly 3 years before the signing year.
The same is true of PTA_2b and PTA_1b. PTA_1b will be used as a reference point and will be
omitted due to multi-collinearity. PTAyear is equal to one at the year the PTA was signed.
PTA_1B is equal to for data exactly 1 year after the reform variable, and the same is the case for
ADV Expected sign Interpretation Description
PTA
PTAinforce
+ Binary 1 the year the PTA was signed/ commenced and after
PTA_TECH
PTAinforce_TECH
+ Interaction with high tech industries
1 the year the PTA signed/ took legal force and after multiplied by the binary variable for high tech exports
PTA_Pharm
PTAinforc_Pharm
+ Interaction with Pharmaceutical; exports
1 the year the PTA signed/ took legal force and after multiplied by the binary variable for pharmaceutical exports
GDP + Nominal GDP measures the value of all finished goods produced in a single period .
Reported in Current USD $
GDPpc + GDP/population of county(c)
Reported in Current USD $
REXCHANGE _ LCC/$1 * (CPIc) CPIus
Real exchange rate adjusted for prices
OPEN + (Exports+Imports)ci
GDPci
a measure of integration in the global economy
Figure 8 Expected Signs and Descriptions. Trade value from (https://comtrade.un.org/data/) Remaining variables at (http://data.worldbank.org/). See references for web addresses.
Fay 24
PTA_2a and PTA_3a. PTApost3 equals 1 for each year more than 3 years after the signing year.
Each dummy is then interacted with high tech industries. The results are depicted in Table 5
and Table 6. See Figure 9 for graphical representation.
Fay 25
Table 1 Total value of US exports in nominal USD($) comes from UN Comtrade Database (https://comtrade.un.org). PTA is equal to 1 the year the PTA was signed and each year after. TECH is equal 1 for high-tech industries and 0 otherwise. LnGDP and LnGDPcap are nominal USD($) come from the World Bank Databank (http://databank.worldbank.org). Trade openness is calculated as nominal exports and imports divided by GDP available from World Bank Databank. (Real exchange rate comes from World Bank Databank. Real exchanged rate is calculated by multiplying Local currency units per USD($) by a ratio CPI of country c divided by US CPI. Exchange rate and CPI are also available in the World Bank Databank.
Fay 26
Table 2: Total value of US exports in nominal USD($) comes from UN Comtrade Database (https://comtrade.un.org). PTA is equal to 1 the year the PTA was signed and each year after Pharm is equal 1 for pharmaceutical commodities and 0 otherwise. LnGDP and LnGDPcap are nominal USD($) come from the World Bank Databank (http://databank.worldbank.org). Trade openness is calculated as nominal exports and imports divided by GDP available from World Bank Databank. (Real exchange rate comes from World Bank Databank. Real exchanged rate is calculated by multiplying Local currency units per USD($) by a ratio CPI of country c divided by US CPI. Exchange rate and CPI are also available in the World Bank Databank.
Fay 27
Table 3: Total value of US exports in nominal USD($) comes from UN Comtrade Database (https://comtrade.un.org). Entry into force means the contract is in legal force and effect. PTAinforce is equal to 1 the year the PTA takes legal effect. TECH is equal 1 for high-tech industries and 0 otherwise. LnGDP and LnGDPcap are nominal USD($) come from the World Bank Databank (http://databank.worldbank.org). Trade openness is calculated as nominal exports and imports divided by GDP available from World Bank Databank. (Real exchange rate comes from World Bank Databank. Real exchanged rate is calculated by multiplying Local currency units per USD($) by a ratio CPI of country c divided by US CPI. Exchange rate and CPI are also available in the World Bank Databank.
Fay 28
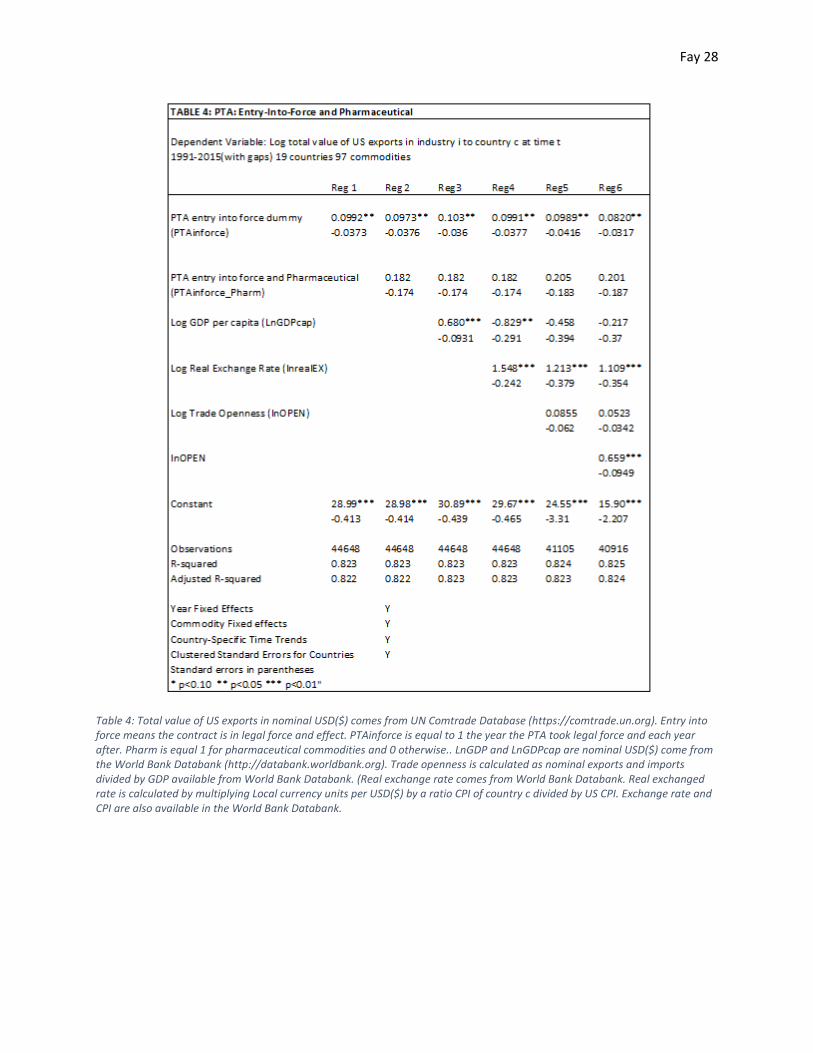
Table 4: Total value of US exports in nominal USD($) comes from UN Comtrade Database (https://comtrade.un.org). Entry into force means the contract is in legal force and effect. PTAinforce is equal to 1 the year the PTA took legal force and each year after. Pharm is equal 1 for pharmaceutical commodities and 0 otherwise.. LnGDP and LnGDPcap are nominal USD($) come from the World Bank Databank (http://databank.worldbank.org). Trade openness is calculated as nominal exports and imports divided by GDP available from World Bank Databank. (Real exchange rate comes from World Bank Databank. Real exchanged rate is calculated by multiplying Local currency units per USD($) by a ratio CPI of country c divided by US CPI. Exchange rate and CPI are also available in the World Bank Databank.
Fay 29
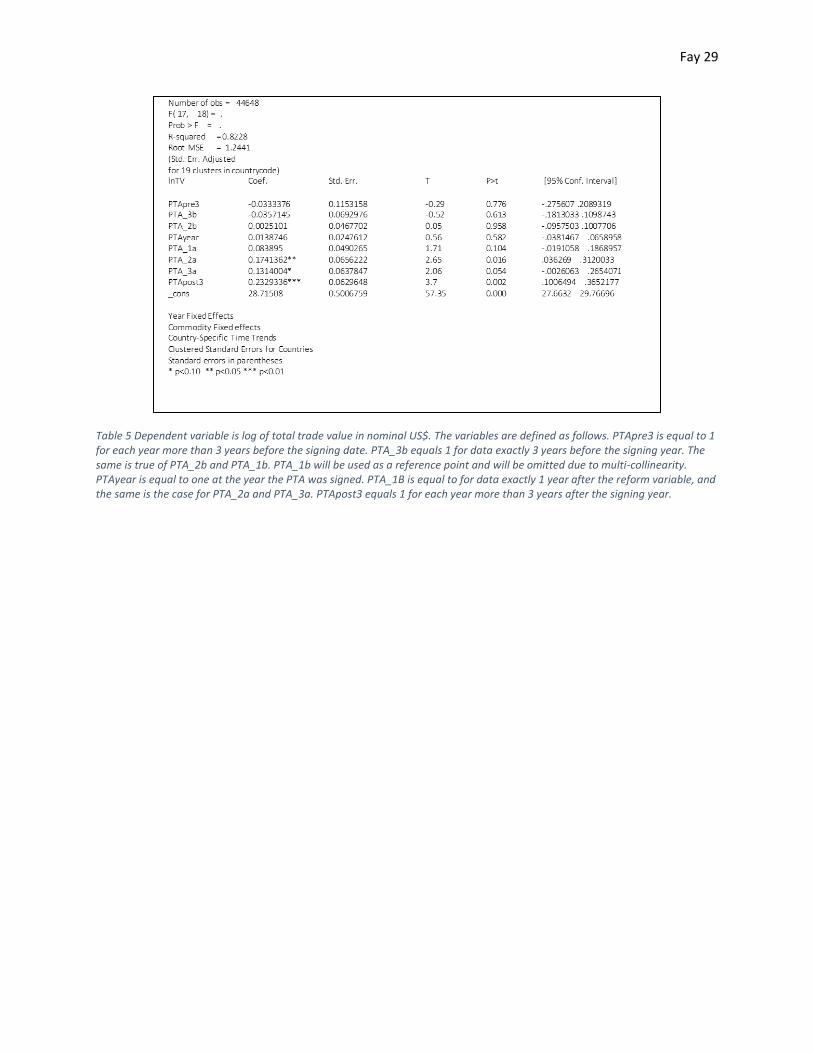
Table 5 Dependent variable is log of total trade value in nominal US$. The variables are defined as follows. PTApre3 is equal to 1 for each year more than 3 years before the signing date. PTA_3b equals 1 for data exactly 3 years before the signing year. The same is true of PTA_2b and PTA_1b. PTA_1b will be used as a reference point and will be omitted due to multi-collinearity. PTAyear is equal to one at the year the PTA was signed. PTA_1B is equal to for data exactly 1 year after the reform variable, and the same is the case for PTA_2a and PTA_3a. PTApost3 equals 1 for each year more than 3 years after the signing year.
Fay 30
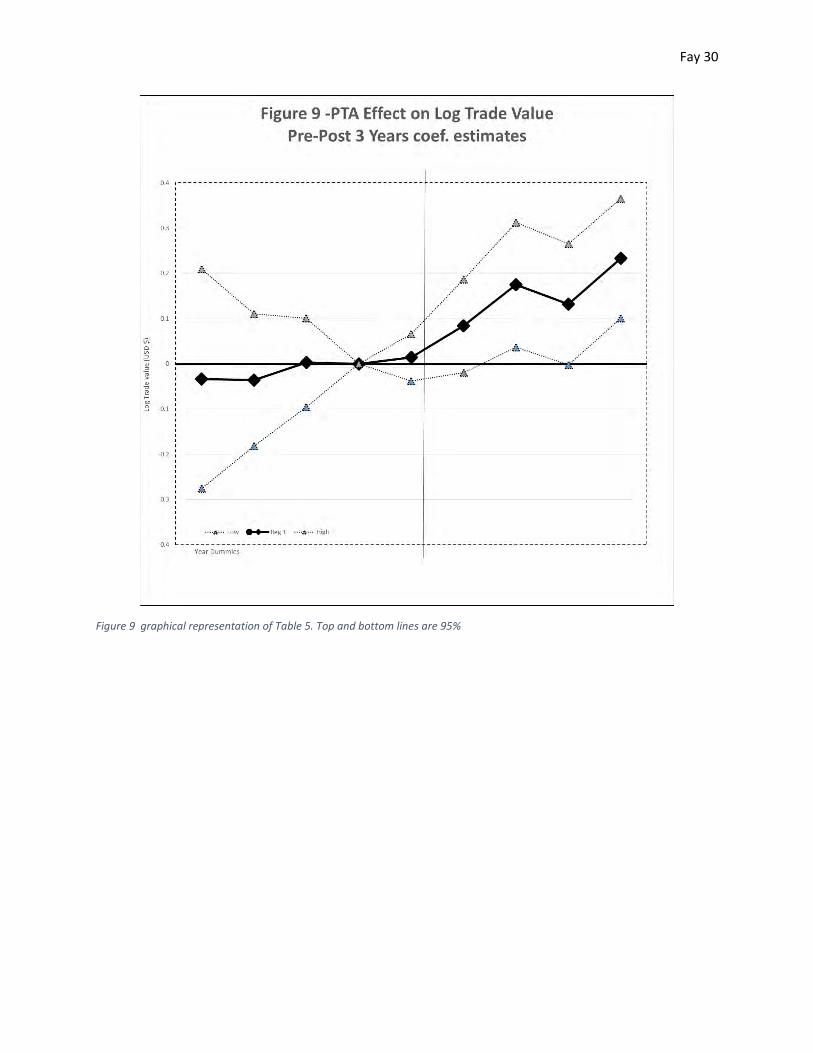
Figure 9 graphical representation of Table 5. Top and bottom lines are 95%
Fay 31
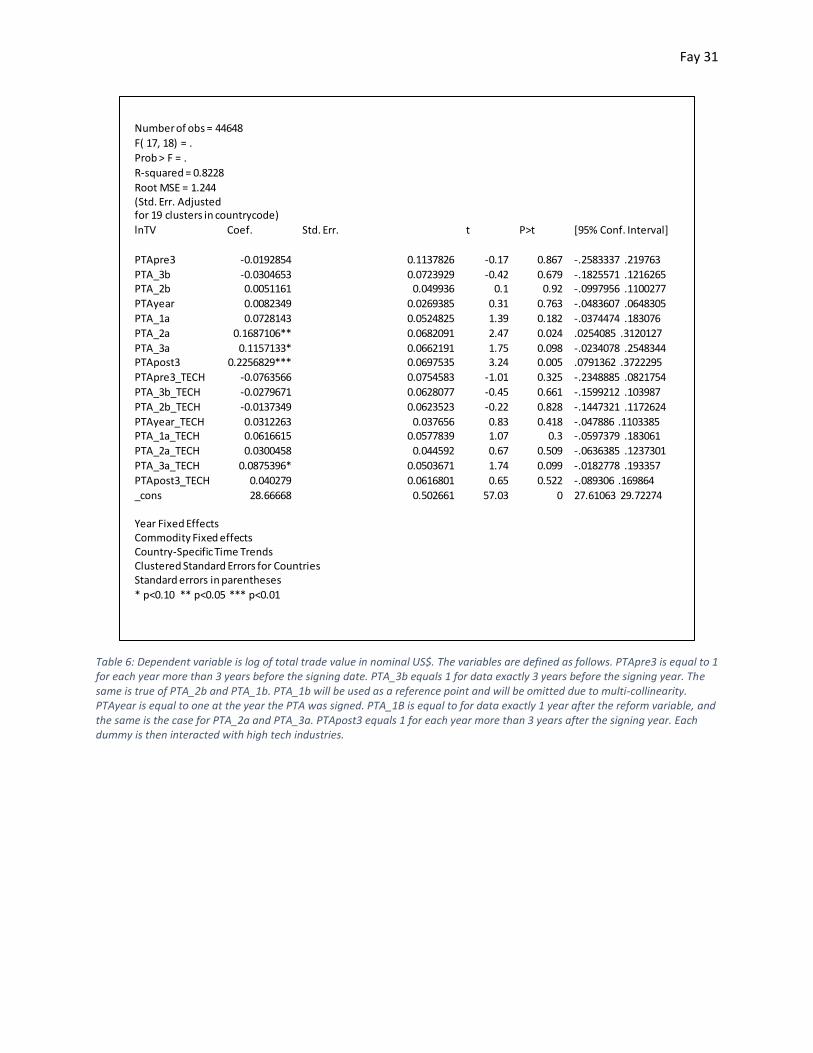
Table 6: Dependent variable is log of total trade value in nominal US$. The variables are defined as follows. PTApre3 is equal to 1 for each year more than 3 years before the signing date. PTA_3b equals 1 for data exactly 3 years before the signing year. The same is true of PTA_2b and PTA_1b. PTA_1b will be used as a reference point and will be omitted due to multi-collinearity. PTAyear is equal to one at the year the PTA was signed. PTA_1B is equal to for data exactly 1 year after the reform variable, and the same is the case for PTA_2a and PTA_3a. PTApost3 equals 1 for each year more than 3 years after the signing year. Each dummy is then interacted with high tech industries.
Number of obs = 44648
F( 17, 18) = .
Prob > F = .
R-squared = 0.8228
Root MSE = 1.244 (Std. Err. Adjusted for 19 clusters in countrycode)
lnTV Coef. Std. Err. t P>t [95% Conf. Interval]
PTApre3 -0.0192854 0.1137826 -0.17 0.867 -.2583337 .219763
PTA_3b -0.0304653 0.0723929 -0.42 0.679 -.1825571 .1216265 PTA_2b 0.0051161 0.049936 0.1 0.92 -.0997956 .1100277
PTAyear 0.0082349 0.0269385 0.31 0.763 -.0483607 .0648305
PTA_1a 0.0728143 0.0524825 1.39 0.182 -.0374474 .183076
PTA_2a 0.1687106** 0.0682091 2.47 0.024 .0254085 .3120127
PTA_3a 0.1157133* 0.0662191 1.75 0.098 -.0234078 .2548344 PTApost3 0.2256829*** 0.0697535 3.24 0.005 .0791362 .3722295
PTApre3_TECH -0.0763566 0.0754583 -1.01 0.325 -.2348885 .0821754
PTA_3b_TECH -0.0279671 0.0628077 -0.45 0.661 -.1599212 .103987
PTA_2b_TECH -0.0137349 0.0623523 -0.22 0.828 -.1447321 .1172624
PTAyear_TECH 0.0312263 0.037656 0.83 0.418 -.047886 .1103385 PTA_1a_TECH 0.0616615 0.0577839 1.07 0.3 -.0597379 .183061
PTA_2a_TECH 0.0300458 0.044592 0.67 0.509 -.0636385 .1237301
PTA_3a_TECH 0.0875396* 0.0503671 1.74 0.099 -.0182778 .193357
PTApost3_TECH 0.040279 0.0616801 0.65 0.522 -.089306 .169864
_cons 28.66668 0.502661 57.03 0 27.61063 29.72274 Year Fixed Effects Commodity Fixed effects Country-Specific Time Trends Clustered Standard Errors for Countries Standard errors in parentheses
* p<0.10 ** p<0.05 *** p<0.01
Fay 32
Chapter 4: Results This Chapter presents the empirical results of the regressions and discusses the
implications of the findings. It also assesses the robustness of the models. Table 4.1 and 4.2
report the results for the signing dummies. Tables 4.3 and 4.4 report the result dummies that
signal the agreement is in full legal force and affect. The data set in Table 4.1-4.4 are balanced
data sets for regression 1 through 4. Regressions 5 and 6 in both are some missing some values
in each of the tables. See Figure 3 for exact discrepancies in observations. Table 4.5 and Table
4.6 report the results of the PTA event study. These sets are complete, except for Mexico and
Canada in the pre-dummy set. Graph 3 presents a visual interpretation for of table 4.5.
4.1 PTA Signing In Table 1, the signs of the PTA dummy are positive, indicating the presence of a PTA
with IP provisions leads to an increase in exports. While these results match the expected signs,
the PTA coefficient Regression 1 is only significant at the 10 percent level. Regressions 3
through 5 are statistically significant at the 5 percent level. While the coefficient for Regressions
2 and 6 is not significant at any accepted level. The interaction term with technology is positive
and significant at the 5 percent level for all regressions. This indicates that the presence of a
PTA with IP provisions may lead to an increase in US. In Regression 6, for example the signing of
a PTA increases exports by high tech industries by approximately 13 percent.
Overall, the model in Table 1 appears to support the hypothesis that high-tech exports
increase differently than low-tech exports. The R-squared and adjusted R-squared remain
consistent throughout the regression table. This suggest the model is robust. For example,
regression 1 has an R-squared of .823 meaning the model explains 82.3 percent of the variation
Fay 33
in the dependent variable. Model 6, including the high-tech interaction term and four country
characteristics has an R-Squared of .825 meaning 82.5 percent of the variation is explained by
this model. A modest .2 percent increase from the baseline equation.
Signs of the coefficients generally match the expectations in Figure 7 with a few
exceptions. For example, in Regression 4, 5 and 6 GDP per capita takes a negative sign.
However, in both Regression 5 and 6 it is not statistically significant. Likewise, real exchange
rate has a positive sign. Like GDP per capita, real exchange rate is not significant.
In Table 2 the coefficient on the PTA variable are positive except for regression 2.
Regressions 1 and 4 are marginally significant, while regression 3 is significant at the 10 percent
level. Regressions and 5 are both significant at the 1 percent level suggesting that total value of
bilateral exports increase by approximately 11 percent after the PTA is signed. The coefficients
on the pharmaceutical interaction terms are all positive, but none are statistically significant.
The R-squared for table 2 is also robust throughout. Regression 1 has an R-squared of
.823 and increases to only .825 adding in all the gravity control variables. Meaning that the
complete model explains approximately 82.8 percent of the variation in the data.
4.2 PTA Entry into force For the second set of regressions, the results are less promising. In Table 3 the entry into
force variable is significant in regression 1 and 3 at the 5 percent level. In Regressions 1 and 3,
the presence of a PTA with IP provisions total value of US exports increase by approximately 10
percent when the agreement is in full legal force. The remaining regressions results are only
statistically significant at the 10 percent level. In this case, interaction with high tech industries
Fay 34
in this set yield no significant coefficients. The coefficient of GDP is significant at the 1 percent
level for regression 6 including all gravity control variables. This coefficient of 1.108 indicates
that a one standard deviation $3.85e+11 increase in GDP of a country in the sample group
corresponds to a $4.2658e+11 in total trade value.
The R-squared in these Regressions is the same as the previous set. Regression 1 has a
R-squared of .823, increasing to .825 in Regression 6. Like the previous table, this small increase
suggests the regression is robust.
The signs of the estimated coefficients generally match the expected, with a few
exceptions. Once again real exchange rate is positive, but not significant. Additionally, GDP per
capita becomes negative in Regressions 4 through 6.
In Table 4, the results are similar. However, the PTA coefficients are all statically
significant at the 5 percent level. These coefficients suggest that once the agreement takes full
legal force, bilateral exports increase by approximately 8 to 10 percent. Like Table 2, the
pharmaceutical interaction term was positive in each regression, but none of the coefficients
were significant. The gravity controls are also not significant apart from GDP and trade
openness. The coefficient for log of GDP is 1.109, only slightly larger than the result in Table 3.
4.3 Event Study The Results of the event study, show no upward trend in anticipation of the signing of
PTA. However, Table 5 shows a statistically significant trend after the treaty is signed. 1 year
after the signing, the coefficient is .08 with a p value of .104. The coefficients on the 2 year
dummy is .17 with a p value of .016. 3 years after coefficient drops to .13 with a p value of .054.
Fay 35
The dummy for 4 years and after has a remarkable .23 with a t statistic of 3.7. This indicates
strong evidence against the null hypothesis, that exports do not increase 4 years after the PTA
is signed, is false (see Graph 3).
The results in Table 4 are like the previous regression. The coefficients indicate there is
not an anticipatory trend prior to signing. The coefficients on PTA show an upwards trend after
the PTA with IP provisions is signed. 1 year after, the dummy has a coefficient of .05 with a p
value of .18. Two years after the coefficient increases to approximately .17 with a p value of
.024.Three years after the coefficient drops to .12 and loses some significance. Four years and
after, the coefficient jumps to .22 with a p value of .005. Indicating strong evidence that US
exports increase by approximately 22 percent in this period.
Fay 36
Chapter 5: Conclusion As the United States negotiates additional trade deals, it is more important to
understand how international treaties and IPR provisions effect trade flows in different
industries. The presence of an IPR chapter in each agreement, and the corresponding rise in
high-tech exports after the treaty is signed suggests there may be some relation between the
two. IPR has the potential to facilitate a greater flow of ideas across international borders by
providing innovators with the necessary incentives. IPR protection is equally important in
maintaining these incentives.
The primary purpose of this study was to assess the responsiveness of US bilateral
exports to a country in response to a PTA with that country using a series of fixed effects.
Overall, the results show the PTA leads to more exports. The extensive IPR mandates in these
agreements may be viewed as a sort of IPR reform. Similar to the findings in Maskus and Ridley
(2016), I find that these PTA, which contain IPR depth, correspond to an increase in trade. Like
Canals and Şener (2014), my results suggest IPR reform affects US high-tech industries in a
significant way. In addition, like Branstetter et al. (2006) and Canals and Şener (2014), the use
of a set of pre-and post-dummies shows that there is not an anticipation of the agreement, and
its IPR provisions. There appears to be an additional kick beginning 2 years after the agreement
is signed.
5.1 Further Research Future research may also wish to examine how US bilateral exports are effected looking
at differing national income levels of trade partners. Further research may also seek to address
the issue of a control group in this experiment. A control group is not possible with this data set
Fay 37
because each preferential trade agreements the US is a member of contains IPR depth. A
synthetic control group may be useful in this task to isolate the impact of the IPR component in
US treaties.6
6 A synthetic control group is constructed as a weighted average of several countries to form an placebo country. Countries used to create the synthetic control would need to have PTAs without and without IPR depth. Countries should be selected based on their degree of similarities with the United States and weighted to resemble the United States as closely as possible. Country characteristics such as those used in this gravity model may be useful when selecting countries. See Borias(2015) “Wage Impact of the Marielitos: a Reappraisal” for information on modeling with a synthetic control group.
Fay 38
References
Branstetter, Lee G., Raymond Fisman, and C. Fritz Foley. 2006. Do stronger intellectual property rights increase international technology transfer? empirical evidence from U.S. firm-level panel data. Quarterly Journal of Economics 121 (1): 321.
Branstetter, Lee. TPP and the Conflict over Drugs: Incentives for Innovation Versus Access to Medicines. Vol. 2. Assessing the Trans-Pacific Partnership.
Canals, Claudia, and Fuat Şener. 2014. Offshoring and intellectual property rights reform.
Journal of Development Economics 108 : 17-31.
"Consumer price index (2010 = 100)." Consumer price index (2010 = 100) | Data. Accessed March 10, 2017. http://data.worldbank.org/indicator/FP.CPI.TOTL.
"Download trade data | UN Comtrade: International Trade Statistics." United Nations. Accessed March 10, 2017. https://comtrade.un.org/data/.
Dür, Andreas, Leonardo Baccini, and Manfred Elsig. 2014. The design of international trade agreements: Introducing a new dataset. The Review of International Organizations 9 (3): 353-75.
Foster, Neil, and Robert Stehrer. 2011. Preferential trade agreements and the structure of international trade. Review of World Economics / Weltwirtschaftliches Archiv 147 (3): 385-409.
"GDP (current US$)." GDP (current US$) | Data. Accessed March 10, 2017. http://data.worldbank.org/indicator/NY.GDP.MKTP.CD.
"GDP per capita (current US$)." GDP per capita (current US$) | Data. Accessed March 10, 2017. http://data.worldbank.org/indicator/NY.GDP.PCAP.CD.
Goldstein, Judith L., Douglas Rivers, and Michael Tomz. "Institutions in International Relations: Understanding the Effects of the GATT and the WTO on World Trade." International Organization 61, no. 01 (2007). doi:10.1017/s0020818307070014.
Maskus, Keith E., and William Ridley. "Intellectual Property-Related Preferential Trade Agreements and the Composition of Trade." Global Governance Programme, no. 223 (2016).
Maskus, Keith E. Private rights and public problems: the global economics of intellectual property in the 21st century. Washington, DC: Peterson Institute for International Economics, 2012.
"Official exchange rate (LCU per US$, period average)." Official exchange rate (LCU per US$, period average) | Data. Accessed March 10, 2017. http://data.worldbank.org/indicator/PA.NUS.FCRF.
Fay 39
"Patent applications, nonresidents." Patent applications, nonresidents | Data. Accessed March 10, 2017. http://data.worldbank.org/indicator/IP.PAT.NRES.
Rogowsky, Robert A. 2016. Intellectual property in the trans-pacific partnership. The Brown Journal of World Affairs 22 (2): 123
"Trade (% of GDP)." Trade (% of GDP) | Data. Accessed March 10, 2017. http://data.worldbank.org/indicator/NE.TRD.GNFS.ZS.