prediction of methanol content in natural gas with the gc ... · pdf filemartha hajiwa,*,...
TRANSCRIPT
Heriot-Watt University Research Gateway
Heriot-Watt University
Prediction of methanol content in natural gas with the GC-PR-CPA modelHajiw, Martha; Chapoy, Antonin; Coquelet, Christophe; Lauermann, Gerhard
Published in:Journal of Natural Gas Science and Engineering
DOI:10.1016/j.jngse.2015.09.021
Publication date:2015
Document VersionPeer reviewed version
Link to publication in Heriot-Watt University Research Gateway
Citation for published version (APA):Hajiw, M., Chapoy, A., Coquelet, C., & Lauermann, G. (2015). Prediction of methanol content in natural gas withthe GC-PR-CPA model. Journal of Natural Gas Science and Engineering, 27(Part 2), 745–750. DOI:10.1016/j.jngse.2015.09.021
General rightsCopyright and moral rights for the publications made accessible in the public portal are retained by the authors and/or other copyright ownersand it is a condition of accessing publications that users recognise and abide by the legal requirements associated with these rights.
If you believe that this document breaches copyright please contact us providing details, and we will remove access to the work immediatelyand investigate your claim.

Download date: 02. May. 2018

Seediscussions,stats,andauthorprofilesforthispublicationat:http://www.researchgate.net/publication/283037585
PredictionofmethanolcontentinnaturalgaswiththeGC-PR-CPAmodel
ARTICLEinJOURNALOFNATURALGASSCIENCEANDENGINEERING·SEPTEMBER2015
ImpactFactor:2.16·DOI:10.1016/j.jngse.2015.09.021
READS
21
4AUTHORS,INCLUDING:
AntoninChapoy
Heriot-WattUniversity
99PUBLICATIONS1,485CITATIONS
SEEPROFILE
ChristopheCoquelet
MINESParisTech
160PUBLICATIONS1,065CITATIONS
SEEPROFILE
Availablefrom:AntoninChapoy
Retrievedon:02November2015

PREDICTION OF METHANOL CONTENT IN NATURAL GAS WITH
THE GC-PR-CPA MODEL
Martha Hajiwa,*, Antonin Chapoyb, Christophe Coqueleta, Gerhard Lauermannc
a Mines ParisTech ,PSL University, CTP – Centre Thermodynamic of Processes , 35 rue Saint Honoré, 77305
Fontainebleau Cedex, France
b Centre for Gas Hydrate Research, Institute of Petroleum Engineering, Heriot-Watt University, Edinburgh EH14
4AS, UK
c Linde AG, Engineering Division, Dr.-Carl-von-Linde-Strasse 6-14, 82049 Pullach, Germany
Produced reservoir fluids are principally composed of hydrocarbons but contain also
impurities such as carbon dioxide, hydrogen sulphide and nitrogen. These fluids are saturated
with the formation water at reservoir conditions. During production, transportation and
processing ice and/or gas hydrates formation may occur. Gas hydrate and ice formation are a
serious flow assurance and inherently security issues in natural gas production, processing and
transport. Therefore, inhibitors are usually injected as a hydrate inhibitor and antifreeze. For
example, methanol is often used for hydrate inhibition or in some cases during start up, shut
down or pipeline plug removal. Therefore impurities, water and methanol usually end up in
natural gas conditioning and fractionation units. These units produce end user pipeline gas
subject to local specifications and natural gas liquids like ethane, LPG or heaviers. This is
why the accurate knowledge of methanol content at different operating conditions is
important. In this study, a group contribution model, the GC-PR-CPA EoS [1] (Group
Contribution – Peng-Robinson – Cubic-Plus-Association), is successfully applied for
hydrocarbons systems containing methanol. Predictions of phase envelopes of binary systems
as well as partition coefficients of methanol in hydrocarbons mixtures are in good agreement
with experimental data
Keywords: Natural gas fractionation; Methanol content; Partition coefficient; Group contribution method
* Corresponding author:
E-mail: [email protected] Telephone: +33 (0) 164 694 972.

1. INTRODUCTION
Natural gas is principally composed of hydrocarbons (methane, ethane, propane...), but
contain also impurities such as carbon dioxide, hydrogen sulphide and nitrogen. It is also
saturated with the formation water. The presence of small molecules and water at
transportation conditions is suitable to hydrates formation. Gas hydrates are serious flow
assurance issue and to prevent their formation, methanol is injected as hydrate inhibitor. The
different impurities, water and methanol are removed in different separation units. Purified
natural gas may then go to a fractionation train to recover the different hydrocarbon products.
However, small quantities remain in the natural gas and specifications limit the methanol
content in the purified gas to 50 ppm [2]. To optimise the different steps of separation and
meeting the requirements, accurate knowledge of methanol concentration and phase
behaviour in the different operation units is important. It must be pointed out that the systems
of interest show non-ideal behaviour due to the combination of a non-polar and a polar
component forming hydrogen bonds and an azeotrope. Modelling such behaviour is often a
challenge. In the natural gas industry, correlations or the well-known Peng-Robinson cubic
equation of state [3] are used. However in cubic EoS association interactions between
molecules (hydrogen bonding) are not taken into account.
A group contribution model, called GC-PR-CPA, has been developed to predict phase
behaviour of systems containing associating compounds (water and alcohols). It combines the
Cubic-Plus-Association equation of state (CPA EoS) [4] and a modification of the group
contribution model developed by Jaubert et al [5]. In the industry, methanol content is usually
calculated with correlations. The aim of this combination is to have a predictive model for
associating compounds. Compared to the original version of CPA-SRK model, the GC-PR-
CPA EoS is a predictive model: there is no need for additional experimental data or to
readjust the model parameters to predict phase behaviour of binary and multicomponent
systems. In parallel, there is no group for alcohols so far. In this work, the GC-PR-CPA model
has been used to predict alkane – methanol phase diagrams but also methanol content for very
low concentrations of methanol (from 10 to 1 000 molar ppm) in two phase systems. It is
therefore possible to calculate the partition coefficient at infinite dilution and consequently the
relative volatility, which is required for methanol behaviour in distillation processes. In order
to determine the possible extent of separation between the different compounds of a mixture,
there must be a known difference in volatilities. With the relative volatility, it is possible to
predict the relative ease of vaporization of the individual components.

2. THE GC-PR-CPA MODEL
2.1. Pure Compounds
The CPA EoS combines a cubic equation of state (here the Peng-Robinson (PR) EoS [3]) and
the association term from Wertheim’s theory [6]. It is expressed here, in term of pressure for a
pure compound (Eq. (1)):
𝑃𝑃 =𝑅𝑅𝑅𝑅
𝑣𝑣 − 𝑏𝑏𝑖𝑖−
𝑎𝑎𝑖𝑖(𝑅𝑅)𝑣𝑣(𝑣𝑣 + 𝑏𝑏𝑖𝑖) + 𝑏𝑏𝑖𝑖(𝑣𝑣 − 𝑏𝑏𝑖𝑖)
−12𝑅𝑅𝑅𝑅𝑣𝑣�1 + 𝜌𝜌
𝜕𝜕𝜕𝜕𝜕𝜕(𝑔𝑔)𝜕𝜕𝜌𝜌
��𝑥𝑥𝑖𝑖��1 − 𝑋𝑋𝐴𝐴𝑖𝑖�𝐴𝐴𝑖𝑖
𝑁𝑁
𝑖𝑖=1
(1)
For non-associating compounds, the CPA EoS is reduced to the PR EoS. Parameters of the
PR EoS and the association term are presented in Table 1.
Table 1: Parameters of PR-CPA EoS
Parameters Name Unit Reference
P Pressure Pa
T Temperature K
R Ideal gas constant J.mol-1.K-1
v Molar volume m3.mol-1
bi Co-volume of the
component i m3.mol-1 [3]
ai Attractive parameter
of the component i J.m3.mol-2 [3]
ρ Density [-]
g Radial distribution
function [-] [7]
xi Mole fraction of the
component i [-]
XAi Mole fraction of the
component i not
bonded to the site A
[-] [4]

In this work, the three parameters of the PR EoS (the attractive parameter a, the co-volume b
and the Soave type alpha function parameter C1), the association energy εAiBi and the
association volume βAiBi have been fitted to vapour pressure and saturated liquid density data
for associating compounds, including methanol. PR-CPA parameters for methanol are given
in Table 2.
Table 2 : PR-CPA parameters for methanol
Compound a0
(bar.L².mol-²)
b
(L.mol-1)
C1
(-)
ε
(bar.L.mol-1)
β
(103)
Temperature
range (K)
ΔP
(%)
Δρ
(%)
methanol 4.929 0.032 0.770 201.75 40.20 176 – 506 0.9 1.1
According to the terminology of Huang and Radosz [8], the 2B association scheme has been
applied for methanol.
2.2. Mixtures
When applying the equation of state for mixtures, mixing rules are introduced. In this work,
the classical mixing rule (van der Waals one fluid theory) has been applied for a(T) and b
(Eqs. (2) and (3)).
𝑎𝑎(𝑅𝑅) = ��𝑥𝑥𝑖𝑖𝑥𝑥𝑗𝑗�𝑎𝑎𝑖𝑖(𝑅𝑅)𝑎𝑎𝑗𝑗(𝑅𝑅)�1 − 𝑘𝑘𝑖𝑖𝑗𝑗�𝑁𝑁
𝑗𝑗=1
𝑁𝑁
𝑖𝑖=1
(2)
𝑏𝑏 = �𝑥𝑥𝑖𝑖𝑏𝑏𝑖𝑖
𝑁𝑁
𝑖𝑖=1
(3)
where N is the number of components in the mixture.
The binary interaction parameter kij is defined in this work by a group contribution model. For
systems with non-associating compounds (e.g. hydrocarbons mixtures), it is calculated with
the PPR78 model. However it has been modified for binary systems with associating
compounds (see our previous paper [1]), involving three group interaction parameters ℂ𝑘𝑘𝑘𝑘,
𝔻𝔻𝑘𝑘𝑘𝑘 and 𝔼𝔼𝑘𝑘𝑘𝑘 (ℂ𝑘𝑘𝑘𝑘 = ℂ𝑘𝑘𝑘𝑘, 𝔻𝔻𝑘𝑘𝑘𝑘 = 𝔻𝔻𝑘𝑘𝑘𝑘 and 𝔼𝔼𝑘𝑘𝑘𝑘 = 𝔼𝔼𝑘𝑘𝑘𝑘). It is defined by Eq. (4)
𝑘𝑘𝑖𝑖𝑗𝑗(𝑅𝑅) =−1
2 × 𝑆𝑆𝑆𝑆𝑆𝑆 − ��𝑎𝑎𝑖𝑖(𝑅𝑅)𝑏𝑏𝑖𝑖
–�𝑎𝑎𝑗𝑗(𝑅𝑅)𝑏𝑏𝑗𝑗
�2
2�𝑎𝑎𝑖𝑖(𝑅𝑅)𝑎𝑎𝑗𝑗(𝑅𝑅)
𝑏𝑏𝑖𝑖𝑏𝑏𝑗𝑗

(4)
with
• for non-associating compounds (Eq. (5), [5]):
𝑆𝑆𝑆𝑆𝑆𝑆 = ���𝛼𝛼𝑖𝑖𝑘𝑘 − 𝛼𝛼𝑗𝑗𝑘𝑘��𝛼𝛼𝑖𝑖𝑘𝑘 − 𝛼𝛼𝑗𝑗𝑘𝑘�𝔸𝔸𝑘𝑘𝑘𝑘 �298.15𝑅𝑅
��𝔹𝔹𝑘𝑘𝑘𝑘𝔸𝔸𝑘𝑘𝑘𝑘
−1�𝑁𝑁𝑁𝑁
𝑘𝑘=1
𝑁𝑁𝑁𝑁
𝑘𝑘=1
(5)
• for binary systems with associating compounds (Eq. (6), [1]):
𝑆𝑆𝑆𝑆𝑆𝑆 = ���𝛼𝛼𝑖𝑖𝑘𝑘 − 𝛼𝛼𝑗𝑗𝑘𝑘��𝛼𝛼𝑖𝑖𝑘𝑘 − 𝛼𝛼𝑗𝑗𝑘𝑘�(ℂ𝑘𝑘𝑘𝑘𝑅𝑅2 + 𝔻𝔻𝑘𝑘𝑘𝑘𝑅𝑅 + 𝔼𝔼𝑘𝑘𝑘𝑘)𝑁𝑁𝑁𝑁
𝑘𝑘=1
𝑁𝑁𝑁𝑁
𝑘𝑘=1
(6)
It also necessary to define combining rules for systems involving associating compounds. The
CR1 combining rule has been chosen for ((Eqs. (7) and (8), [9]).
𝜀𝜀𝐴𝐴𝑖𝑖𝐵𝐵𝑗𝑗 =𝜀𝜀𝐴𝐴𝑖𝑖𝐵𝐵𝑖𝑖 + 𝜀𝜀𝐴𝐴𝑗𝑗𝐵𝐵𝑗𝑗
2
(7)
𝛽𝛽𝐴𝐴𝑖𝑖𝐵𝐵𝑗𝑗 = �𝛽𝛽𝐴𝐴𝑖𝑖𝐵𝐵𝑖𝑖𝛽𝛽𝐴𝐴𝑗𝑗𝐵𝐵𝑗𝑗
(8)
The model is solved using the same procedure as for other equations of state (see appendix 1).
3. RESULTS AND DISCUSSION
Measurements of vapour-liquid equilibria of binary mixtures with methanol and of low
methanol content in pure alkanes and hydrocarbons mixtures have been conducted for a Gas
Processors Association (GPA) project [2]. Methanol content ranges from 10 to 1000 ppm.
Two binary systems have been studied: the propane – methanol and n-butane – methanol
systems in the range of temperatures from 313 to 443 K. These systems exhibit an azeotrope
at maximum pressure for certain condition of temperature. Predictions for phase diagrams and
partition coefficient will be compared to experimental data. The results obtained by our model
are also compared to those of another predictive type UNIFAC model. Different versions of
the UNIFAC model have been tested. For instance, the PSRK-UNIFAC model has been used,
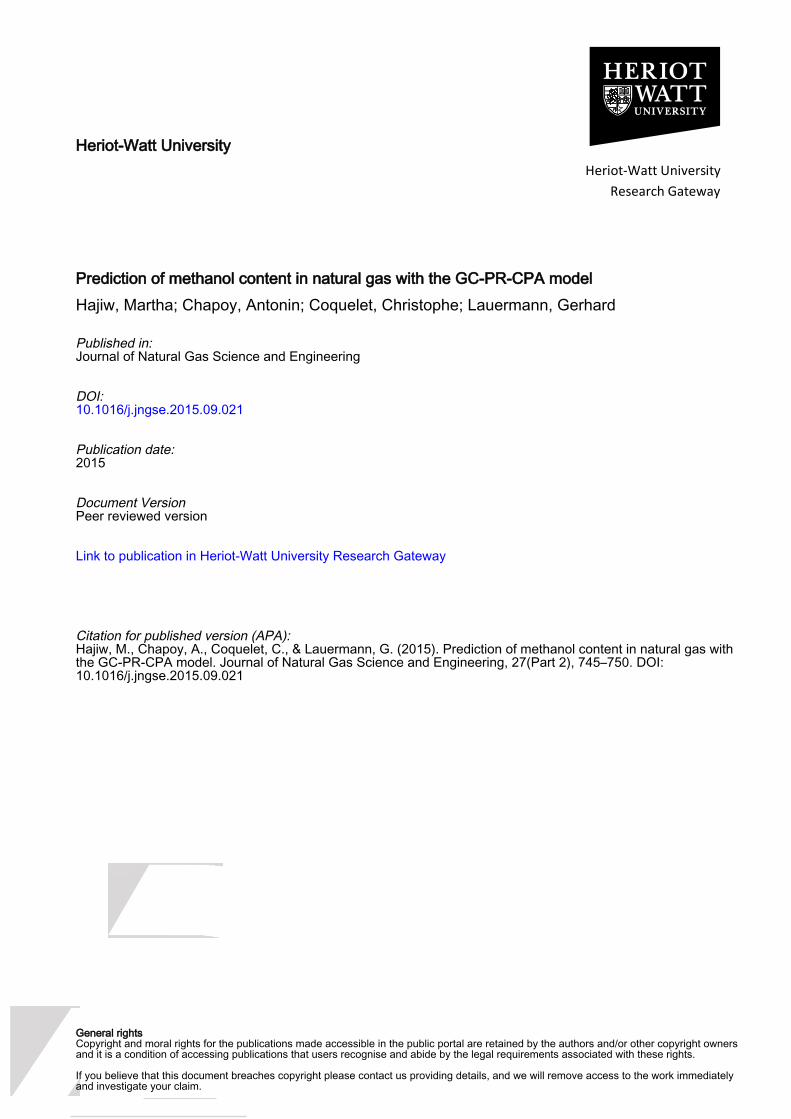
but it predicts a heteroazeotrope instead of a VLE at the azeotropic composition. Due to the
flatness of the bubble curve, a small change in pressure leads to the prediction of a LLE, that
is phase instability, corresponding to the cusp on Figure 1. Among all possible UNIFAC
models, the PR78 - MHV2 - UNIFAC model (Peng-Robinson EoS [3] with the modified
Huron-Vidal mixing rule [10, 11] and a modified UNIFAC version for the MHV2 mixing rule
[12]), is the best option even if it shows a small cusp too (Figure 1). It will be compared to the
GC-PR-CPA EoS.
Figure 1 : Phase instability in prediction at azeotropic composition of the propane-methanol system. Solid lines:
PSRK-UNIFAC model. Dashed lines: PR78-MHV2-UNIFAC model
To avoid phase instability, it is first important to well represent pure compounds.
3.1. Binary systems
Group parameters have been adjusted on VLE data of three binary systems: propane –
methanol [13], n-butane – methanol [14, 15] and n-hexane – methanol [16, 17]. They are
given in Table 3.
Table 3 : Group parameters Groups (k) Ck,CH3OH (102 Pa.K-2) Dk,CH3OH (105 Pa.K-1) Ek,CH3OH (107 Pa)
CH3 3.14 2.41 -0.776
CH2 -0.780 1.29 3.95
Predictions are evaluated for two binary systems studied in the GPA project or published in
the literature: the propane – methanol system at 313.01 K (figure 2) and n-butane – methanol
system at 323.2, (figure 3). It must be pointed out that at higher temperatures (from 400 K)
both models are not able to predict the equilibrium curve at compositions close to the
1.1
1.2
1.3
1.4
1.5
1.6
1.7
0.96 0.965 0.97 0.975 0.98 0.985 0.99
Pres
sure
(MPa
)
x, y propane (mole fraction)

azeotrope (Figure 4). Indeed, these models are not adapted close to critical and at supercritical
temperatures (425.12 K for n-butane). However, since the discontinuity is on both sides on the
azeotrope, it means that the models predict two critical points as expected for a system with a
maximum azeotrope.
Figure 2 : Phase equilibria of the propane – methanol system at 313.01 K. ♦ [2] and ● [13]. Solid lines: GC-PR-
CPA model. Dashed lines: PR78-MHV2-UNIFAC
Figure 3 : Phase equilibria of the n-butane – methanol system at 323.2 K. [18]. Solid lines: GC-PR-CPA model.
Dashed lines: PR78-MHV2-UNIFAC
0
0.2
0.4
0.6
0.8
1
1.2
1.4
1.6
0 0.2 0.4 0.6 0.8 1
Pres
sure
(MPa
)
x,y propane (mole fraction)
0
0.1
0.2
0.3
0.4
0.5
0.6
0 0.2 0.4 0.6 0.8 1
Pres
sure
(MPa
)
x,y butane (mole fraction)

Figure 4 : Phase equilibria of the n-butane – methanol system at 423.09 K. [18]. Solid lines: GC-PR-CPA model.
Dashed lines: PR78-MHV2-UNIFAC
AAE, AAD% and BIAS% between experimental data and predictive models are presented in
Tables 4 and 5 for all temperatures considered in this study for both systems.
Table 4 : Deviations on bubble pressure between experimental data and predictions
Systems
PR-MHV2-UNIFAC GC-PR-CPA
AAE
(MPa) AAD (%) BIAS (%) AAE (MPa) AAD (%) BIAS (%)
C3 – CH3OH 0.04 4.8 -3.6 0.03 2.9 -2.6
C4 –
CH3O
H
323.2 K 0.01 2.0 1.6 0.01 2.0 0.5
373.2 K 0.02 1.6 0.4 0.02 1.5 0.1
403.1 K 0.05 2.3 1.2 0.04 1.7 0.1
423.1 K 0.17 6.7 5.8 0.09 3.5 2.0
433.2 K 0.27 8.1 7.7 0.22 5.7 5.7
443.2 K 0.17 4.3 3.5 0.24 4.9 1.6
Table 5 : Deviations on methanol content between experimental data and predictions
Systems
PR-MHV2-UNIFAC GC-PR-CPA
AAE (mole
fraction) AAD (%) BIAS (%)
AAE (mole
fraction) AAD (%) BIAS (%)
C3 – CH3OH 0.01 16 12.4 3.8.10-3 9.5 6.6
C4 –
CH3OH
323.2 K 0.00 5.4 -4.2 0.01 13 5.1
373.2 K 0.02 9.1 -8.4 0.02 11 -4.2
403.1 K 0.02 8.3 -5.8 0.02 7.4 1.6
0
1
2
3
4
5
0 0.2 0.4 0.6 0.8 1
Pres
sure
(MPa
)
x,y butane (mole fraction)
423.1 K 0.04 8.6 -8.6 0.02 3.6 -3.6
433.2 K 0.04 6.5 -6.5 0.02 1.6 0.9
443.2 K 0.01 1.3 0.2 0.05 8.1 1.3
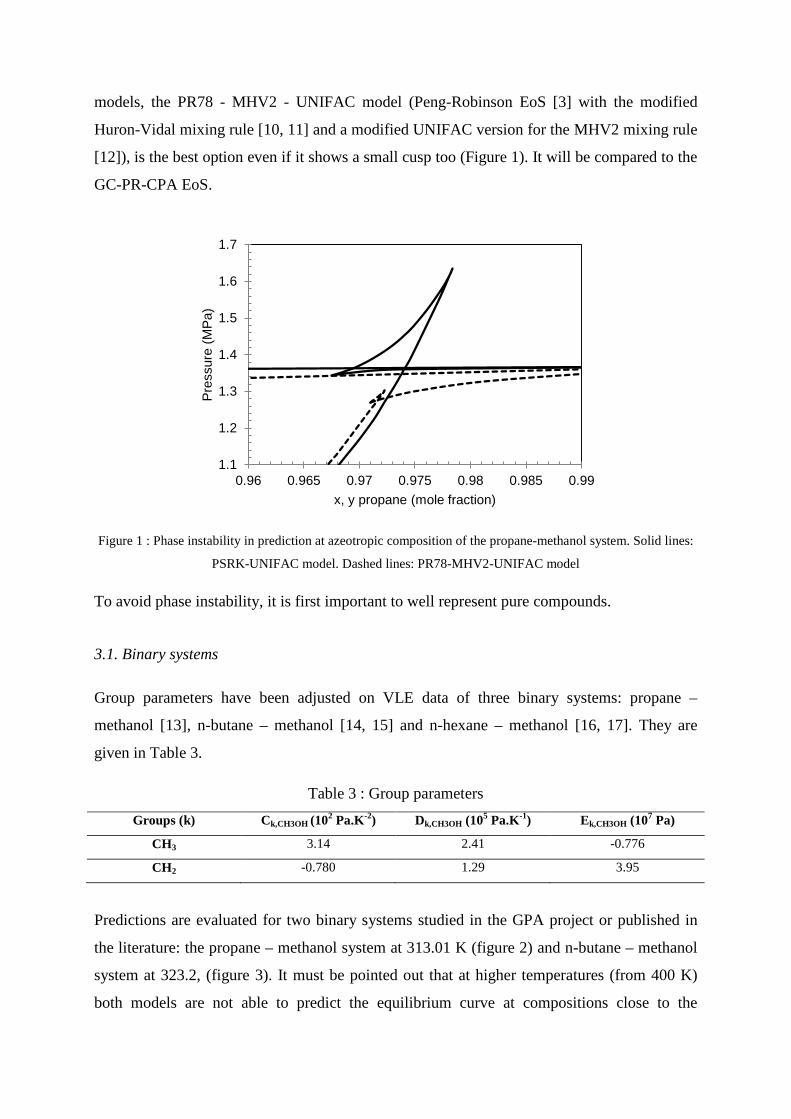
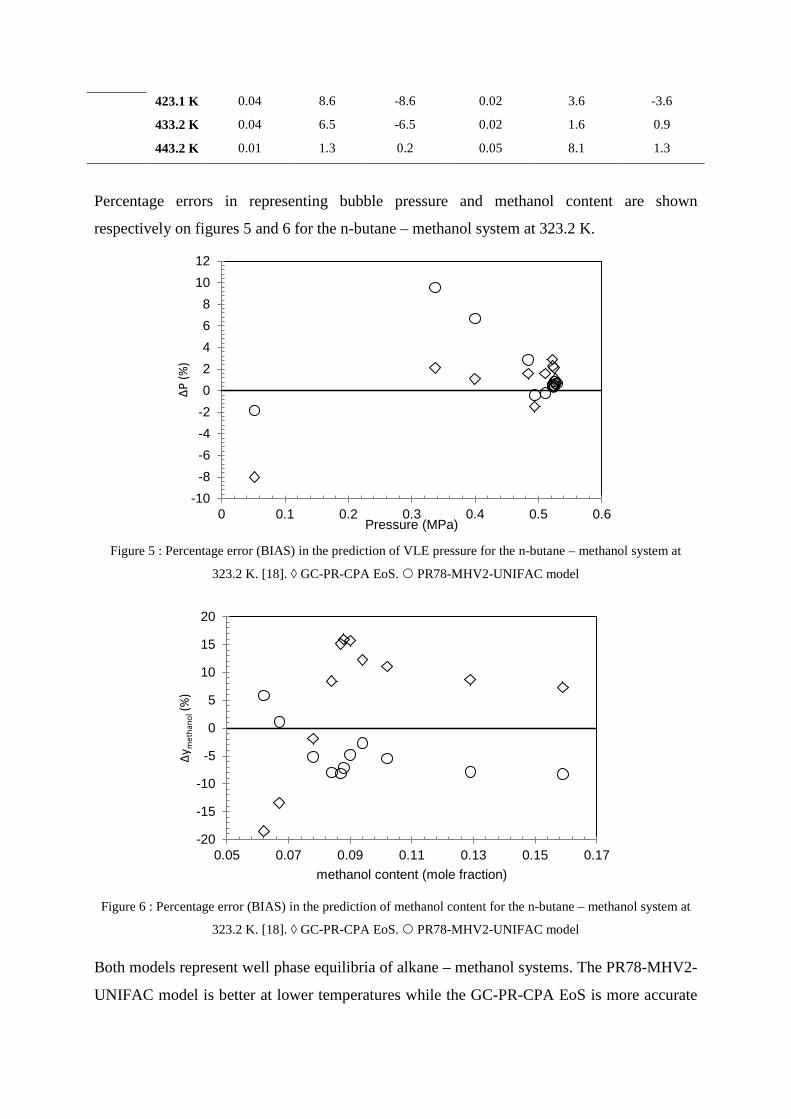
Percentage errors in representing bubble pressure and methanol content are shown
respectively on figures 5 and 6 for the n-butane – methanol system at 323.2 K.
Figure 5 : Percentage error (BIAS) in the prediction of VLE pressure for the n-butane – methanol system at
323.2 K. [18]. ◊ GC-PR-CPA EoS. PR78-MHV2-UNIFAC model
Figure 6 : Percentage error (BIAS) in the prediction of methanol content for the n-butane – methanol system at
323.2 K. [18]. ◊ GC-PR-CPA EoS. PR78-MHV2-UNIFAC model
Both models represent well phase equilibria of alkane – methanol systems. The PR78-MHV2-
UNIFAC model is better at lower temperatures while the GC-PR-CPA EoS is more accurate
-10-8-6-4-202468
1012
0 0.1 0.2 0.3 0.4 0.5 0.6
ΔP (%
)
Pressure (MPa)
-20
-15
-10
-5
0
5
10
15
20
0.05 0.07 0.09 0.11 0.13 0.15 0.17
Δym
etha
nol (
%)
methanol content (mole fraction)

at higher temperatures. However, both models fail to represent the entire phase diagram at
temperatures close to the critical region. It is one of the disadvantages of the CPA EoS.
3.2. Partition coefficient
For a vapour – liquid equilibrium, the ratio between the compositions of the component i in
the vapour phase (yi) and in the liquid phase (xi) is called the partition coefficient (or K
value). It is a function of the pressure, the temperature and composition. Composition
dependence is of great importance in case of hydrogen bonding components being present in
non-polar mixtures. The ratio of the partition coefficient between two compounds is called the
relative volatility. This parameter is the most important one for the performance of a
distillation column where the key components distribute between the products in the top and
the bottom of the column and/or their behaviour show very strong concentration dependence
towards infinite dilution. The evolution of the partition coefficient of methanol diluted in two
mixtures of hydrocarbons has been studied in the GPA Research Report 219 [2] (Table 6) at
different temperatures and pressures. The concentration of methanol in these mixtures is
lower than 1 000 ppm.
Table 6 : Composition of the two mixtures of hydrocarbons [2] Compounds Mix 1 (mole fraction) Mix 2 (mole fraction)
Propane 0.7359 -
n-Butane 0.1567 0.6189
n-Pentane 0.0874 0.3044
n-Heptane 0.0200 0.0767
Values of partition coefficients estimated from experimental data and predicted are presented
in Table 7 and two examples are shown on figures 7 and 8.
Table 7 : Values of partition coefficient
Mixtures Conditions Experimental
data
PR78-
MHV2-
UNIFAC
ΔKMeOH (%) GC-PR-
CPA ΔKMeOH (%)
Mix 1
T=353 K
P=2.22 MPa 1.89 1.32 30 1.83 3.2
T=366 K
P=2.74 MPa 1.74 1.36 22 1.72 1.1
3Mix 2 T=394 K 3.68 4.62 -26 3.96 -7.6

P=1.4 MPa
T=416 K
P=2.08 MPa 2.86 3.29 -15 3.00 -4.9
The GC-PR-CPA model is able to predict methanol low content behaviour in hydrocarbons
mixtures as well as the partition coefficient at different temperatures and pressures and is
much more reliable than the PR78-MHV2-UNIFAC model.
Figure 7 : Evolution of methanol composition in the vapour phase versus its composition in the liquid phase of
Mix 1 at 353 K and 2.22 MPa. Solid lines: GC-PR-CPA model. Dashed lines: PR78-MHV2-UNIFAC
Figure 8 : Evolution of methanol composition in the vapour phase versus its composition in the liquid phase of
Mix 2 at 394.2 K and 1.4 MPa. Solid lines: GC-PR-CPA model. Dashed lines: PR78-MHV2-UNIFAC
4. CONCLUSION
0
500
1000
1500
2000
0 500 1000 1500
y M
eOH
(ppm
)
xMeOH (ppm)
0
1000
2000
3000
4000
5000
6000
0 500 1000 1500
y M
eOH
(ppm
)
x MeOH (ppm)

Experimental data measured during an important and relevant GPA project allow a better
understanding of methanol distribution in a natural gas fractionation train. However, to
estimate methanol content in a variety of hydrocarbons mixtures and at various operating
conditions, accurate prediction models are of great importance. A reliable predictive model
based on a group contribution method has been developed for systems with associating
compounds. To evaluate its performance, predictions have been compared to experimental
data and to another predictive model (PR78-MHV2-UNIFAC). The GC-PR-CPA EoS is able
to predict phase envelopes of binary systems and to represent the azeotrope. However, it is not
suitable close to critical conditions. Predictions of partition coefficients are also in good
agreement with the experimental data.
REFERENCES
1. Hajiw, M., A. Chapoy, and C. Coquelet, Hydrocarbons - Water Phase Equilibria using the CPA Equation of State with a Group Contribution Method. The Canadian Journal of Chemical Engineering, 2014.
2. Courtial, X., et al., Methanol Distribution (as a contaminant) in Fractionation Products and Freeze Out Boundaries, G. RR-219, Editor. March 2013.
3. Peng, D. and D.B. Robinson, NEW 2-CONSTANT EQUATION OF STATE. Industrial & Engineering Chemistry Fundamentals, 1976. 15(1): p. 59-64.
4. Kontogeorgis, G.M., et al., An equation of state for associating fluids. Industrial & Engineering Chemistry Research, 1996. 35(11): p. 4310-4318.
5. Jaubert, J.N. and F. Mutelet, VLE predictions with the Peng-Robinson equation of state and temperature dependent k(ij) calculated through a group contribution method. Fluid Phase Equilibria, 2004. 224(2): p. 285-304.
6. Wertheim, M.S., FLUIDS WITH HIGHLY DIRECTIONAL ATTRACTIVE FORCES .1. STATISTICAL THERMODYNAMICS. Journal of Statistical Physics, 1984. 35(1-2): p. 19-34.
7. Kontogeorgis, G.M., et al., Ten years with the CPA (Cubic-Plus-Association) equation of state. Part 1. Pure compounds and self-associating systems. Industrial & Engineering Chemistry Research, 2006. 45(14): p. 4855-4868.
8. Huang, S.H. and M. Radosz, EQUATION OF STATE FOR SMALL, LARGE, POLYDISPERSE, AND ASSOCIATING MOLECULES. Industrial & Engineering Chemistry Research, 1990. 29(11): p. 2284-2294.
9. Kontogeorgis, G.M., et al., Ten years with the CPA (Cubic-Plus-Association) equation of state. Part 2. Cross-associating and multicomponent systems. Industrial & Engineering Chemistry Research, 2006. 45(14): p. 4869-4878.
10. Michelsen, M.L., A METHOD FOR INCORPORATING EXCESS GIBBS ENERGY MODELS IN EQUATIONS OF STATE. Fluid Phase Equilibria, 1990. 60(1-2): p. 47-58.
11. Michelsen, M.L., A MODIFIED HURON-VIDAL MIXING RULE FOR CUBIC EQUATIONS OF STATE. Fluid Phase Equilibria, 1990. 60(1-2): p. 213-219.
12. Larsen, B.L., P. Rasmussen, and A. Fredenslund, A MODIFIED UNIFAC GROUP-CONTRIBUTION MODEL FOR PREDICTION OF PHASE-EQUILIBRIA AND HEATS OF MIXING. Industrial & Engineering Chemistry Research, 1987. 26(11): p. 2274-2286.
13. Galivel-Solastiouk, F., S. Laugier, and D. Richon, Vapor-Liquid Equilibrium data for the propane-methanol and propane-methanol-carbon dioxide system. Fluid Phase Equilibria, 1986. 28: p. 73-85.
14. Leu, A.D., et al., THE EQUILIBRIUM PHASE PROPERTIES OF THE PROPANE-METHANOL AND N-BUTANE-METHANOL BINARY-SYSTEMS. Canadian Journal of Chemical Engineering, 1992. 70(2): p. 330-334.

15. Dell'Era, C., et al., Vapour-liquid equilibrium for the systems butane plus methanol, +2-propanol, +1-butanol, +2-butanol, +2-methyl-2-propanol at 364.5 K. Fluid Phase Equilibria, 2007. 254(1-2): p. 49-59.
16. Goral, M., P. Oracz, and S. Warycha, Vapour-liquid equilibria - XIII. The ternary system cyclohexane-methanol-hexane at 303.15 K. Fluid Phase Equilibria, 1998. 152(1): p. 109-120.
17. Oracz, P. and S. Warycha, VAPOR-LIQUID-EQUILIBRIA .7. THE TERNARY-SYSTEM HEXANE-METHANOL-ACETONE AT 313.15 K. Fluid Phase Equilibria, 1995. 108(1-2): p. 199-211.
18. Courtial, X., et al., Vapor-liquid equilibrium in the n-butane plus methanol system, measurement and modeling from 323.2 to 443.2 K. Fluid Phase Equilibria, 2009. 277(2): p. 152-161.
APPENDIX 1: Flow chart for the VLE calculation for the GC-PR-CPA EoS