prediction of disease damage, determination of pathogen survival
TRANSCRIPT

PREDICTION OF DISEASE DAMAGE, DETERMINATION OF PATHOGEN
SURVIVAL REGIONS, AND CHARACTERIZATION OF INTERNATIONAL
COLLECTIONS OF WHEAT STRIPE RUST
By
DIPAK SHARMA-POUDYAL
A dissertation submitted in partial fulfillment of
the requirements for the degree of
DOCTOR OF PHILOSOPHY
WASHINGTON STATE UNIVERSITY
Department of Plant Pathology
MAY 2012

ii
To the Faculty of Washington State University:
The members of the Committee appointed to examine the dissertation of DIPAK
SHARMA-POUDYAL find it satisfactory and recommend that it be accepted.
Xianming Chen, Ph.D., Chair
Dennis A. Johnson, Ph.D.
Kulvinder Gill, Ph.D.
Timothy D. Murray, Ph.D.

iii
ACKNOWLEDGEMENTS
I would like to express my sincere gratitude to Dr. Xianming Chen for his invaluable
guidance, moral support, and encouragement throughout the course of the study. I would like
to thank Drs. Dennis A. Johnson, Kulvinder Gill, and Timothy D. Murray for serving in my
committee and their valuable suggestions for my project. I also like to thank Dr. Mark Evans,
Department of Statistics, for his statistical advice on model development and selection. I am
grateful to Dr. Richard A. Rupp, Department of Crop and Soil Sciences, for his expert advice
on using GIS techniques. I am thankful to many wheat scientists throughout the world for
providing stripe rust samples. Thanks are also extended to Drs. Anmin Wan, Kent Evans, and
Meinan Wang for their kind help in the stripe rust experiments. Special thanks to Dr. Deven
See for allowing me to use the genotyping facilities in his lab. Suggestions on data analyses
by Dr. Tobin Peever are highly appreciated. I also like to thank my fellow graduate students,
especially Jeremiah Dung, Ebrahiem Babiker, Jinita Sthapit, Lydia Tymon, Renuka
Attanayake, and Shyam Kandel for their help in many ways. I am grateful to office staffs in
the Department of Plant Pathology, and colleagues in the USDA-ARS Wheat Genetics,
Quality, Physiology, and Disease Research Unit for their support during my Ph.D. program.
Lastly, I would like to extend my heartfelt appreciation to my wife Shanti, son Sudip, and
daughter Simran for their patience, sacrifice, understanding, and love.

iv
PREDICTION OF DISEASE DAMAGE, DETERMINATION OF PATHOGEN
SURVIVAL REGIONS, AND CHARACTERIZATION OF INTERNATIONAL
COLLECTIONS OF WHEAT STRIPE RUST
Abstract
by Dipak Sharma-Poudyal, Ph.D.
Washington State University
May 2012
Chair: Xianming Chen
Stripe rust of wheat (Triticum aestivum L.), caused by Puccinia striiformis Westend. f.
sp. tritici Erikss., is an economically important disease worldwide. Three studies were
conducted in regional, national, and international scopes, with a focus on the epidemiology of
the disease.
A series of models for predicting potential yield loss for the U.S. Pacific Northwest
were developed using historical climatic and disease data. Simple and multiple linear
regression models were developed to estimate yield loss using winter climatic variables that
were significantly correlated with yield loss. These models allow forecasting of potential
yield loss and improve management of stripe rust in the major wheat growing areas in the
Pacific Northwest.
Regions for overseasoning of the stripe rust pathogen were determined in the mainland
U.S. using long-term means for temperature, relative humidity, rainfall, dew point, snow

v
depth, and availability of plant hosts. The pathogen can oversummer in most regions north of
40oN and in the highlands of southern states either in the Rocky or Appalachian Mountains.
Winter survival can occur in most regions south of 40oN and the Pacific rims. The fungus
cannot survive both summer and winter in most wheat growing regions. It can oversummer
and overwinter in the Pacific rims, highlands of southern states, and in the Appalachian
Mountains.
A total of 235 P. striiformis f. sp. tritici isolates from 13 countries were tested on 20
single Yr-gene lines and 20 wheat genotypes that are used to differentiate races of the
pathogen in the U.S. Virulence to 13 Yr genes and 14 U.S. differentials were detected in all
countries. At least 80% of the isolates were virulent on 15 wheat differentials. All isolates
were avirulent to Yr5 and Yr15. Molecular characterization of 292 isolates from 18 countries
was conducted using 17 simple sequence repeat markers, which separated the isolates into
two genetic groups with some of admix genotypes. The greatest genetic variation was among
isolates within countries. This information helps us understand virulence and genetic
variation of the pathogen populations and should be useful for control of stripe rust using
disease resistance in the world.

vi
TABLE OF CONTENTS
Page
ACKNOWLEDGEMENTS ……………………………….………………….........................iii
ABSTRACT …………………………………………………………………..........................iv
LIST OF TABLES ………………………………………………………………………….....x
LIST OF FIGURES …………………………………………………………………………xiii
CHAPTER ONE. LITERATURE REVIEW
1. WORLD AND U.S. WHEAT PRODUCTION ………………………….…….…………...1
2. MAJOR DISEASES OF WHEAT .………………………………………………..………..2
3. STRIPE RUST …………………………………………………………………..………….3
3.1. Distribution …………………………………………………………………..………..3
3.2. Economic importance ………………………………………………………..………..4
3.3. Pathogen nomenclature and taxonomy……………………………….…..……………6
3.4. Symptoms and signs …………………………………………………………...………8
3.5. Similarities to other diseases on wheat ……………………………………..…………9
3.6. Disease development ……………………………………..…….…..……………...…10
3.7. Host range …………………………………………………………………..…..……11
3.8. Environment and the disease ………………………………………………...…….…13
3.8.1. Temperature ………………………………………………………….....………13
3.8.2. Moisture …………………………………………………………..……….……16
3.8.3. Wind ………………………………………………………………..……...……16

vii
3.8.4. Light ……………………………………………………………………..……...17
3.9. The pathogen survival ….….………………………………………………..……..…17
3.9.1. Summer survival …..…………………………………………………..……..…18
3.9.2. Winter survival …..…………………………………………………...…………20
3.10. Disease prediction …………………………………..………………………………22
3.11. Virulence variation ………………………………..…………...……………………24
3.12. Molecular variation ……………………………………………………..……..……27
3.13. Disease management ……………………………………………………..…………29
3.13.1. Cultural practices ………………………………………………..……….……30
3.13.2. Chemical control ……………………………………..…………..……………30
3.13.3. Genetic resistance …………………………………………………..…………31
4. RESEARCH INTRODUCTION AND OBJECTIVES ……………….……..……………33
4.1. Models for predicting potential yield loss of wheat caused by stripe rust in the U.S.
Pacific Northwest ………………………………………………...…...………………33
4.2. Potential summer and winter survival regions of the stripe rust pathogen in the
contiguous United States ……………………………..……………..…………………33
4.3. Virulence characterization of international collections of the wheat stripe rust
pathogen …………………….…………........……………………………………..……34
4.4. Molecular characterization of international collections of the wheat stripe rust
pathogen ………………………………….………………………………………..……35
LITERATURE CITED ………………………………………………………..……..………35
CONTRIBUTION PAGE ……………………………………………..………..……………53
viii
CHAPTER TWO. MODELS FOR PREDICTING POTENTIAL YIELD LOSS OF
WHEAT CAUSED BY STRIPE RUST IN THE US PACIFIC NORTHWEST
ABSTRACT ………………………………………………………………...………..………54
INTRODUCTION ……………………………………………………….……..……………55
MATERIALS AND METHODS ………………………………………...………..…………58
RESULTS ………………………………………………………………………....…………62
DISCUSSION ………………………………………………………………………..………81
LITERATURE CITED ………………….………………..……...…………………..………86
CHAPTER THREE. POTENTIAL OVERSUMMERING AND OVERWINTERING
REGIONS FOR THE WHEAT STRIPE RUST PATHOGEN IN THE CONTIGUOUS
UNITED STATES
ABSTRACT ………………………………………………………………………..………...91
INTRODUCTION ……………………………………………………….………………..…92
MATERIALS AND METHODS …………………………………………..……………...…97
RESULTS ……………………………………………………………………………..……114
DISCUSSION ………………………………………………………………………....……118
LITERATURE CITED …………………………………………………………………..…126
CHAPTER FOUR. VIRULENCE CHARACTERIZATION OF INTERNATIONAL
COLLECTIONS OF THE WHEAT STRIPE RUST PATHOGEN
ABSTRACT ……………………………………………………………………………...…134
INTRODUCTION ………………………………………………………………………….135
ix
MATERIALS AND METHODS ……………………………………………………...……137
RESULTS ………………………………………………………………………………..…141
DISCUSSION ………………………………………………………………………………152
LITERATURE CITED …………………………………………………………………..…157
CHAPTER FIVE. MOLECULAR CHARACTERIZATION OF INTERNATIONAL
COLLECTIONS OF THE WHEAT STRIPE RUST PATHOGEN
ABSTRACT ……………………………………………………………………………...…174
INTRODUCTION ……………………………………………………………………….…175
MATERIALS AND METHODS ………………………………………………………...…179
RESULTS …………………………………………………………………………………..186
DISCUSSION ………………………………………………………………………………201
LITERATURE CITED ………………………………………………………………..……206

x
LIST OF TABLES
CHAPTER TWO
1. Correlation coefficients obtained between weather variables and yield loss percentage of
winter wheat (1993-2007) and spring wheat (1995-2007) caused by stripe rust in Pullman,
Washington ………………………………………………………………………………64
2. Single variable and multiple-variable models obtained through stepwise and the best
subset regression analyses for predicting winter wheat yield loss caused by stripe rust ...71
3. Single variable and multiple-variable models obtained through stepwise and the best subset
regression analyses for predicting spring wheat yield loss caused by stripe rust ……...…73
4. Prediction accuracies and probabilities of χ² tests for selected stripe rust yield loss models
for winter and spring wheat based on predicted and actual yield loss data winter wheat
(1993-2009) and spring wheat (1995-2009) at Pullman, Washington ……………………76
CHAPTER THREE
1. Climatic parameters used for estimation of potential summer survival indices of Puccinia
striiformis f. sp. tritici ……………………………………………………………………101
2. Climatic parameters used for estimation of potential winter survival index of Puccinia
striiformis f. sp. tritici ……………………………………………………………………105
3. Puccinia striiformis f. sp. tritici host range and its statewide distribution in the United
States …………………………………………………………………………………..…110

xi
CHAPTER FOUR
1. Wheat genotypes used to differentiate Puccinia striiformis f. sp. tritici races ………..…140
2. Number and frequency (%) of virulence Puccinia striiformis f. sp. tritici isolates collected
from different countries on single Yr-gene lines and U.S. differentials …………………143
3. Number of Puccinia striiformis f. sp. tritici races based on single gene lines and U.S.
differentials from different countries ……………………………………………….……147
SUPPLEMETNAL TABLES
1A. Virulence patterns of Puccinia striiformis f. sp. tritici identified in 235 isolates collected
from 13 countries tested on single Yr-gene lines wheat differentials ……………….....164
1B. Virulence patterns of Puccinia striiformis f. sp. tritici identified in 235 isolates collected
from 13 countries tested on the U.S. wheat differentials ……………………………....166
CHAPTER FIVE
1. Sequences, repeat motifs, and annealing temperature of simple sequence repeat (SSR)
primers used for characterization of Puccinia striiformis f. sp. tritici collections ….......181
2. Number of alleles per locus, allele size, and number of genotypes for 17 primers used to
characterize Puccinia striiformis f. sp. tritici collections…………………………….…187

xii
3. Number of isolates, percentage of polymorphic loci, private alleles, and number of
genotypes identified from Puccinia striiformis f. sp. tritici isolates from various countries
…………………………………………………………………………………………...188
4. Mean values of observed alleles (na), effective alleles (ne), Shannon’s information index
(I), observed heterozygosity (Ho), expected heterozygosity (He), Unbiased expected
heterozygosity (UHe), and fixation index (F) identified for collections of Puccinia
striiformis f. sp. tritici from various countries……………………..………………...…197
5. Analysis of molecular variance based on FST and RST within and between collections of
Puccinia striiformis f. sp. tritici isolates from different countries and international regions
……………………………………………………………………………………...……199
6. Genetic differentiation and Nei genetic distance between collections of Puccinia
striiformis f. sp. tritici by international regions …………………………..…………….200

xiii
LIST OF FIGURES
CHAPTER TWO
1. Relationship between actual yield loss and predicted yield loss (%) obtained using six
models selected for winter wheat; data represent trials from 1993-2009 at Pullman,
Washington ………………………………………………………………………………77
2. Relationship between actual yield loss and predicted yield loss (%) obtained through
selected models on spring wheat; data represent trials from 1995-2009 at Pullman,
Washington ………………………………………………………………………………78
3. Comparison of actual and predicted yield loss percentages, and disease severity indices for
2005-2007 for Pullman, Washington ………………………………………………….…79
4. Comparison of monthly winter normal (long-term mean) temperatures for the periods of
1963-1979 and 1993-2007 for Pullman, Washington ……………………………………80
CHAPTER THREE
1. Epidemiological regions of wheat stripe rust, caused by Puccinia striiformis f. sp. tritici,
in the United States. Region 1 (R1) = eastern Washington, northeastern Oregon, and
northern Idaho; R2 = western Montana; R3 = southern Idaho, southeastern Oregon,
northern Nevada, northern Utah, western Wyoming, and western Colorado; R4 = western
Oregon and northern California; R5 = northwestern Washington; R6 = central and
southern California, Arizona, and western New Mexico; R7 = Texas, Louisiana, Arkansas,

xiv
Oklahoma, and eastern New Mexico; R8 = Kansas, Nebraska, and eastern Colorado; R9 =
South Dakota, North Dakota, Minnesota, and eastern Montana; R10 = Mississippi,
Alabama, Florida, Georgia, South Dakota, North Dakota, Tennessee, and Kentucky; R11
= Missouri, Illinois, Indiana, Iowa, Wisconsin, and Michigan; R12 = Virginia, West
Virginia, Ohio, Maryland, Pennsylvania and New York [see Line and Qayoum (30) and
Chen et al. (7) for details, the figure is adapted from Chen et al. (7)]………………...….96
2. Potential oversummering (A), overwintering (B), and oversummering and overwintering
(C) survival regions of the wheat stripe rust pathogen, Puccinia striiformis f. sp. tritici, in
the contiguous United States. Wheat cultivating counties are for spring and winter wheat
shown in A & C, and for winter wheat only in B ………………………………..…..…116
CHAPTER FOUR
1. Dendrogram based on virulence phenotypes of Puccinia striiformis f. sp. tritici on 20
single Yr-gene lines and 20 U.S. differentials using the unweighted pair group arithmetic
mean (UPGMA) method. Numbers along the nodes are bootstrap values >30%. AU =
Australia, CA = Canada, CL = Chile, CN = China, HU = Hungary, KE = Kenya, NP =
Nepal, PK = Pakistan, TR = Turkey, and UZ = Uzbekistan .………………………...…149
2. Three-dimensional principal coordinate plots of Puccinia striiformis f. sp. tritici isolates
based on virulence and avirulence phenotypes on the single Yr-gene lines and U.S. wheat
differentials .…………………………………………………………………………….150
xv
SUPPLEMENTAL FIGURES
1A. Dendrogram of group 1 and 2 based on virulence phenotypes of Puccinia striiformis f. sp.
tritici on 20 single Yr-gene lines and 20 U.S. wheat differentials using the unweighted pair
group arithmetic mean (UPGMA) method. Numbers along the nodes are bootstrap values
≥30%. VG = Virulence group, AU = Australia, CA = Canada, CL = Chile, CN = China,
HU = Hungary, KE = Kenya, NP = Nepal, PK = Pakistan, TR = Turkey, and UZ =
Uzbekistan. Two digits after country abbreviation represents the isolate collected year, for
example 07 = 2007, from respective countries..……...…………………………………170
1B. Dendrogram of group 3 based on virulence phenotypes of Puccinia striiformis f. sp.
tritici on 20 single Yr-gene lines and 20 U.S. wheat differentials using unweighted pair
group arithmetic mean (UPGMA) method..……………..……………………………...172
1C. Dendrogram of group 4-10 based on virulence phenotypes of Puccinia striiformis f. sp.
tritici on 20 single Yr-gene lines and 20 U.S. wheat differentials using unweighted pair
group arithmetic mean method..………………………………………………………...173
CHAPTER FIVE
1. Genetic clusters of international collections of Puccinia striiformis f. sp. tritici. The circle
size represents the relative number of isolates from each country ……..…………….…191
2. Three-dimensional principal coordinate plot of Puccinia striiformis f. sp. tritici isolates.
Isolates are represented by their genetic group as identified by Bayesian analysis in
STRUCUTRE ……………………………………………………..……………………192

xvi
3. Dendrogram of 15 molecular groups (MG) based on 17 SSR markers of Puccinia
striiformis f. sp. tritici collections using unweighted pair group arithmetic mean method.
AU = Australia, CA = Canada, CL = Chile, CN = China, DZ = Algeria, ES = Spain, HU =
Hungary, KE = Kenya, KG = Kyrgyzstan, MX = Mexico, NP = Nepal, PK = Pakistan, RU
= Russia, TJ = Tajikistan, TM = Turkmenistan, TR = Turkey, PST = United States and
UZ = Uzbekistan. Two digits after country abbreviation represents the isolate collected
year, for example 07 = 2007, from respective countries……………………………...…193
SUPPLEMENTAL FIGURES
1. Genetic clusters of 292 Puccinia striiformis f. sp. tritici isolates represented by country of
origin of at two number of clusters from STRUCUTRE program with a membership
probability of ≥ 0.80 in Q-matrices. AU = Australia, CA = Canada, CL = Chile, CN =
China, DZ = Algeria, ES = Spain, HU = Hungary, KE = Kenya, KG = Kyrgyzstan, MX =
Mexico, NP = Nepal, PK = Pakistan, RU = Russia, TJ = Tajikistan, TM = Turkmenistan,
TR = Turkey, PST = United States and UZ = Uzbekistan. Two digits after country
abbreviation represents the isolate collected year, for example 07 = 2007, from respective
countries. ……………………………………………………………………………….216
2A. Dendrogram of molecular groups (MG) 1-6 based on 17 SSR markers data of Puccinia
striiformis f. sp. tritici collections using unweighted pair group arithmetic mean method.
AU = Australia, CA = Canada, CL = Chile, CN = China, DZ = Algeria, ES = Spain, HU =
Hungary, KE = Kenya, KG = Kyrgyzstan, MX = Mexico, NP = Nepal, PK = Pakistan, RU
= Russia, TJ = Tajikistan, TM = Turkmenistan, TR = Turkey, PST = United States and

xvii
UZ = Uzbekistan. Two digits after country abbreviation represents the isolate collected
year, for example 07 = 2007, from respective countries….………………………….….218
2B. Dendrogram of molecular group (MG) 7-I based on 17 SSR markers data of Puccinia
striiformis f. sp. tritici collections using unweighted pair group arithmetic mean method.
………………...………………………………………………………………………..220
2C. Dendrogram of molecular groups (MG) 7-II, and 8-10 based on 17 SSR markers data of
Puccinia striiformis f. sp. tritici collections using unweighted pair group arithmetic mean
method…………………………………………………………………………………...222
2D. Dendrogram of molecular groups (MG) 11-15 based on 17 SSR markers data of Puccinia
striiformis f. sp. tritici collections using unweighted pair group arithmetic mean method.
……………………………………..…..........................................…………………….223

xviii
Dedication
This dissertation is dedicated to my father, Pitamber Sharma Poudyal, and mother, Homa
Devi Poudyal, who provide emotional support to me.

1
CHAPTER ONE
Literature review
1. World and U.S. wheat production
Wheat (Triticum spp.) was one of the first cultivated crops, domesticated in the Middle
East ca. 10,000 years ago and since then, wheat has become the staple food in most regions of
the world (Dixon et al. 2009). Two- to three-fold increases in wheat cultivation have occurred
in the past 50 years (Calderini and Salfer 1998). Wheat farming is most successful in areas
between the latitudes of 30° and 60°N, and 27° and 40°S (Nuttonson 1955). However, the
crop has been cultivated beyond these limits from within the Arctic Circle to higher elevations
near the equator. Wheat is also grown in non-traditional warmer regions as well as at
altitudes of more than 3,000 meters above sea level (masl) (Percival 1921; Saunders and
Hettel 1994). The top five wheat producing countries are: China (112.46 million metric tons),
India (78.57), U.S. (68.02), Russian Federation (63.76) and France (39)
(http://faostat.fao.org). Today, wheat is the most widely grown crop being produced on more
than 240 million ha, and continues to be the major source of calories for humans globally
(Dixon et al. 2009).
In the U.S., wheat is the major cereal grain grown and ranks fourth in volume of crop
production and first in volume of crop export. Both winter and spring wheat varieties are
grown in the U.S. Common winter wheat production represents 70-80% of total production
and common spring and durum wheat is 20-30% of total production. There are major five
classes of wheat in the U.S: hard red winter, hard red spring, soft red winter, white, and
durum. Each class has a different end use, and production tends to be region-specific. Hard

2
red winter wheat is principally used to make bread flour and accounts for about 40% of total
production. This wheat is grown primarily in the Great Plains (Texas north through
Montana). Hard red spring wheat is valued for high protein, which makes it suitable for
specialty breads and blending with lower protein wheat. Hard red spring wheat is primarily
cultivated in the Northern Plains (North Dakota, Montana, Minnesota, and South Dakota) and
is about 25% of total wheat production. Soft red winter wheat is used for cakes, cookies, and
crackers. Production of this wheat is about 15-20% of total wheat production, principally in
states along the Mississippi River and the eastern states. White wheat, representing 10-15%
of total production, is used for noodle products, crackers, cereals, and white-crusted breads.
Washington, Oregon, Idaho, Michigan, and New York mainly grow soft white wheat. Durum
wheat, accounting for 3-5% of total production, is grown primarily in North Dakota and
Montana and is used in the production of pasta
(http://www.ers.usda.gov/briefing/wheat/background.htm).
2. Major diseases of wheat
Common wheat (Triticum aestivum L.) and durum wheat (T. turgidum L.) are vulnerable
to many pathogens and pests. However, less than 20 diseases and about five insect and mite
pests cause major threats (Shaner 1987; Wiese 1987; McIntosh 1998). Some of these
pathogens are widespread whereas others are localized (McIntosh 1998). McIntosh (1998)
summarized the major fungal disease of wheat as Alternaria leaf blight (caused by Alternaria
triticina), black point (Bipolaris sorokiniana, Alternaria tenuis), Cephalosporium stripe
(Cephalosporium gramineum), common root rot (Bipolaris sorokiniana), crown rot
(Fusarium spp.), eyespot (Oculimacula yallundae, O. acuformis), Helminthosporium leaf
3
blight (Bipolaris sorokiniana), powdery mildew (Blumaria graminis f. sp. tritici), Rhizoctonia
root rot (Rhizoctonia solani), rusts (Puccinia triticina, Puccinia graminis. f. sp. tritici,
Puccinia striiformis f. sp. tritici), scab (Fusarium spp.), smuts (Tilletia caries, Tilletia laevis,
Tilletia controversa, Urocystis agropyri, Tilletia indica, Ustilago tritici), Septoria blotch
(Leptosphaeria nodorum, Mycosphaerella graminicola), sharp eyespot (Rhizoctonia cerealis),
take-all (Gaeumannomyces graminis var. tritici), and tan (yellow) spot (Pyrenophora tritici-
repentis). Among the bacterial diseases, bacterial stripe (Xanthomonas campestris pv.
translucens), bacterial leaf blight (Pseudomonas syringae pv. syringae), basal glume rot
(Pseudomonas syringae pv. atrofaciens), and spike blight (Rathayibacter tritici) are of
significance. Important viral disease are barley yellow dwarf virus, soil-borne wheat mosaic
virus, wheat streak mosaic virus, wheat spindle streak mosaic virus, and wheat yellow mosaic
virus. Cereal cyst nematode (caused by Heterodera avenae), root knot nematode
(Meloidogyne naasi), root lesion nematode (Pratylenchus neglectus, Pratylenchus thornei),
and seed gall nematode (Anguina tritici) are considered as major nematode pests.
Due to the impact that rust diseases have had on wheat production, they are considered to
be the most important diseases of wheat and are among the most studied of plant diseases.
Stripe or yellow rust occurs in cooler regions whereas stem or black rust tends to occur in the
warmer regions. Leaf or brown rust occurs in all wheat-growing areas (Roelfs et al. 1992).
3. Stripe rust
3.1. Distribution
Stripe rust occurs in more than 60 countries and on all continents except in Antarctica
(Chen 2005). The disease is a serious problem in cooler wheat-growing areas at high

4
elevation or higher latitudes (McIntosh 1998). Particularly vulnerable stripe rust regions
include North America (particularly the U.S.), the Arabian Peninsula (Yemen), Middle East
(Turkey, Syria, and Iran), Central Asia (Kazakhstan, Kyrgyzstan, Tajikistan, Turkmenistan,
and Uzbekistan), the Caucasus (Armenia, Azerbaijan, and Georgia), South Asia (India,
Pakistan, and Nepal), East Asia (China), Oceania (Australia, and New Zealand), East Africa
(Ethiopia, Kenya), and Northwest Europe (England, the Netherlands, Belgium, France, and
Germany) (Stubbs 1985; Ziyaev et al. 2011; Wellings 2011).
In the U.S., stripe rust is historically most important in the Pacific Northwest (PNW)
(Washington, Oregon, and Idaho) and California (Line 2002; Chen 2005). Before 2000, the
disease was a minor problem in states east of the Rocky Mountains, but has become
increasingly important in this region. In 2000, stripe rust was observed in Texas, Louisiana,
Oklahoma, Arkansas, Mississippi, Kansas, Colorado, Missouri, Nebraska, Alabama, Georgia,
Indiana, Louisiana, Michigan, Minnesota, Montana, North Dakota, South Dakota, Virginia,
and other states with varying degree of severities (Chen 2005). The disease has become more
widespread in the U.S. in 2003, 2005, and 2010 (Chen 2005, 2007; Wan and Chen 2011).
3.2. Economic importance
The major impacts of stripe rust epidemics are the reduction in grain yield and the cost of
disease management. Yield reduction varies depending upon the time of infection, severity of
disease, and the duration of infection in the major grain-producing parts of the wheat plant
(Murray et al. 1994; Line 2002; Chen 2005). Yield losses range from 10% to 70% (Chen
2005) and may be over 50% where the infections occur very early (Batts 1957; Doodson et al.
1964; Murray et al. 1994). Chen (2005) observed 100% yield losses in highly susceptible

5
wheat cultivars under severe disease conditions. In general, regional yield losses of 0.1 to
5%, with rare losses of 5-25% are common in major wheat growing regions of the world
(Wellings 2011).
In recent years, major stripe rust epidemics have occurred (Wellings 2011). China has
the largest stripe rust epidemic region where the disease causes notable yield loss in the
northwest and southwest wheat growing areas since 1950. Major yield losses occurred in
1950, 1964, 1990, and 2002 resulting in losses of 6.00, 3.20, 2.65, and 1.40 million metric
tons, respectively (Li and Zeng 2000; W.Q. Chen et al. 2009). Every year, China loses about
1 million metric tons due to stripe rust (W.Q. Chen et al. 2007).
Central Asia and the Caucasus region had five major stripe rust epidemics (1998, 2000,
2005, 2009, and 2010) in the past 12 years resulting up to 60% yield loss in Tajikistan
(Rahmatov et al. 2009; Ziyaev et al. 2011). Severe epidemics of stripe rust occurred in 2010
in North and East Africa, the Middle East, and Asia due to failure of widely used Yr27
resistance gene in wheat varieties that were planted on more than 15-20 million hectares. The
moist and cool season in the Middle East further aggravated the disease epidemics. In
attempts to manage the epidemics, over $3 million worth of fungicides were used just on 30%
of the wheat area in Ethiopia whereas Iran lost 300,000 tons of wheat valued about $110
million even after fungicide application (ICARDA 2011). In South Asia, stripe rust often
causes severe yield loss in India, Pakistan, and Nepal (Singh et al. 2004). Stripe rust epidemic
caused loss of $100 million in 2005 in Northwest Frontier Province of Pakistan (Duveiller et
al. 2007). Yield loss of about 80% was observed during 1983-1986 in Australia. Repeated
stripe rust epidemics since 2002 have caused annual expenditure of $AUD 40-90 million in
fungicide application in Australia (Wellings 2007).
6
Historically, stripe rust has been more destructive in states west of the Rocky Mountains
in the U.S. Significant yield loss (78,996 t, or 4% of production) due to stripe rust in
Washington state occurred in 1958. Stripe rust caused yield losses of 25% (591,108 t) in
1960 and 17% (787,236 t) in 1976 in Washington. Frequent epidemics are common in the
PNW (Line 2002; Chen 2007). From 2000-2010, the most severe and widespread stripe rust
epidemics of wheat occurred in the U.S. in 2003, 2005, and 2010, causing estimated 2.42,
1.99, and 2.38 106 tons of yield loss, respectively
(http://www.ars.usda.gov/Main/docs.htm?docid=10123), and millions of dollars spent on
fungicide application each year (Sharma-Poudyal and Chen 2011).
3.3. Pathogen nomenclature and taxonomy
Puccinia striiformis is the causal agent of stripe rust on cereal crops and grasses. Stripe
rust was first described by Gadd and Bjerkander in 1777 (Eriksson and Henning 1896). In
1827, Schumacher described the causal agent of stripe rust on wheat as Uredo glumarum
(Humphrey et al. 1924) but the scientific name has been changed many times since. In 1854,
Westendorp described stripe rust collected from rye as Puccinia striaeformis. In 1860, Fuckel
named the pathogen Puccinia straminis, but whether it was stripe rust or leaf rust (P. triticina)
is unclear. In 1896, Eriksson and Henning showed that stripe rust was a separate rust of
grasses and named it Puccinia glumarum. Hylander et al. (1953) and Cummins and
Stevenson (1956) revived the name currently in use, P. striiformis Westend. (Manners 1960).
Puccinia striiformis has been divided into several formae speciales based on the
specialization on different host species. Eriksson (1894) reported five formae speciales: P.
striiformis f. sp. tritici from wheat, P. striiformis f. sp. hordei from barley, P. striiformis f. sp.

7
secalis from rye, P. striiformis f. sp. agropyri from Agropyron repens, and P. striiformis f. sp.
elymi on Elymus spp. Other formae speciales reported later were: P. striiformis f. sp. poae on
Kentucky blue grass (Poa pratensis) (Britton and Cummins 1956; Tollenaar 1967), P.
striiformis f. sp. dactylidis on orchard grass (Dactylis glomerata) (Manners 1960; Tollenaar
1967), P. striiformis f. sp. leymi from Leymus secalinus (Niu et al. 1991), and P. striiformis f.
sp. pseudo-hordei on barley grass Hordeum spp. in Australia (Wellings et al. 2000a,b).
Using molecular (ITS and β-tubulin sequences) and morphological data, Liu and
Hambleton (2010) performed phylogenetic analyses of 30 Puccinia specimens collected from
wide geographic and host ranges. These Puccinia specimens were P. striiformis infecting
Aegilops, Elymus, Hordeum, and Triticum; P. striiformoides infecting Dactylis glomerata,
and P. pseudostriiformis infecting Poa spp. All belong to a monophyletic group and they
proposed P. striiformis Series Striiformis for these stripe rust pathogens. Therefore,
conventional taxonomic methods based on host type and symptom similarity may not be able
to satisfactorily differentiate f. sp. within the P. striiformis group.
Puccinia striiformis f. sp. tritici belongs to class Pucciniomycetes under the
Basidiomycota division. This fungus has a predominantly dikaryotic mycelial state, lacks a
predominant type of basidiomycete septal pore, dolipore, but with simple single pore mycelial
septa. It produces basidiospores on a basidium, which is a club-shaped spore-producing
structure. Fungi in the order Pucciniales have one of the most complex life cycles, containing
up to five distinct spore stages. They have terminal teliospores and the basidiospores develop
on sterigmata and actively discharged from the promycelium. Generally, the mycelia grow
intracellularly without clamp connections. The fungi absorb nutrients through haustoria and
mostly infect aerial plant parts. The genus Puccinia is composed of heteroecious or

8
autoecious, macro- or micro-cyclic rusts with mostly 2-celled teliospores and 1-celled
urediniospores causing diseases primarily on grasses (Kirk et al. 2008; Webster and Weber
2007; http://www.mycobank.org; http://www.indexfungorum.org)
3.4. Symptoms and signs
Puccinia striiformis f. sp. tritici (Pst) infects the green tissues of wheat and many grass
species. In a mild infection, the symptoms and signs generally form on the leaves; however,
when disease is severe, the symptoms and signs may appear also on the sheath, stalk, glumes,
and awns (Mehrotra and Aggarwal 2003). The pathogen can infect any growth stage of wheat
provided that the tissue is green. Initial symptoms and sporulation develop about 1 and 2
week after infection, respectively, under optimum temperature conditions (Chen 2005). The
green color of the leaves gradually fades as pustules develop (Mehrotra and Aggarwal 2003).
An individual infection is not confined by leaf veins of wheat seedlings and thus, numerous
pustules may cover the leaf. In a mature susceptible host, the fungus forms linear, yellow- to
orange-colored narrow stripes on leaves (usually between veins), leaf sheaths, glumes and
awns. Once infection occurs on a leaf, the pathogen continues to grow parallel to the leaf
axis, producing long stripes. This linear stripe of pustules is an important characteristic that
distinguishes stripe rust from other rusts. Stripes are comprised of tiny rust pustules called
uredia; each uredium contains thousands of urediniospores (Chen 2005). Uredia are small
and oval, not usually joined together. They burst with little displacement of the epidermis.
Urediniospores are spherical to ovate in form and variable in size from 23-35 x 20-35 µm.
The spore wall is colorless, minutely echinulate, and possesses 6-16 germ pores. Near the end
of the season, when host becomes senescent or environmental condition becomes unfavorable,

9
uredia turn to telia containing teliospores. Telia are similar to uredia, but are flattened, dull
black, and often run together. Telia are arranged in rows on leaves or other green parts of the
plants and do not cause the epidermis to burst out. Teliospores are dark brown and flattened
at the top, two-celled, from 35-63 x 12-24 µm, and interspersed with brown unicellular
paraphyses (Mehrotra and Aggarwal 2003).
The aecial hosts of P. striiformis f. sp. tritici are Berberis spp. including B. chinensis, B.
holstii, B. koreana, and B. vulgaris (Jin et al. 2010). Pycnia and aecia can be produced at 8
and 14 days, respectively after inoculation with basidiospores.
3.5. Similarities to other diseases on wheat
Stripe rust, leaf rust (Puccinia triticina), and stem rust (P. graminis f. sp. tritici) are the
rust diseases of wheat. Puccinia striiformis f. sp. tritici requires the lowest temperatures
among the three wheat rust pathogens (Roelfs et al. 1992). Although these diseases are
similar, the symptoms and corresponding pathogen characteristics are different; major
differences are in color and arrangement of the uredia. Urediniospores can be distinguished
by size and color using a light microscope (Mehrotra and Aggarwal 2003).
3.6. Disease development
Puccinia striiformis f. sp. tritici is a macrocyclic, heteroecious rust fungus producing
spermagonia and aecia on alternative host, barberry, and uredinia and telia on primary host,
wheat. Alternate hosts have been identified (Jin et al. 2010) but the role of basidiospores in
disease cycle is yet to be determined under natural conditions. Urediniospores originating
from overseasoning mycelium within host tissue or uredia on green tissue, such as volunteer

10
wheat or wild grasses, are the principal source of inoculum for disease initiation (Line 2002).
Urediniospores are wind borne and disseminated easily from their point of origin. By
gravitational forces, most of urediniospores are deposited close to their source (Roelfs and
Martell 1984). Once they land on the wheat leaf surface, urediniospores germinate and infect
the plant after at least 3 hours of dew or free water (Burleigh 1965). Previously, it was
thought that Pst urediniospores do not form appressoria (Marryat 1907; Allen 1928), but it
was recently demonstrated that the pathogen can form small appressoria over stomatal
openings (Wang et al. 2007). Urediniospore germ tubes penetrate the stomata and form a
substomatal vesicle. Usually, two or three (in some cases four) infection hyphae are formed
from the substomatal vesicle. Infection hyphae were clubbed, abbreviated, and sometimes
constricted at the base (Moldenhauer et al. 2006). Haustorial mother cells were separated by a
septum from the infection hyphae (Niks 1989). Haustoria were formed within 24 h after
inoculation and grew rapidly up to four days post inoculation. Haustoria were predominantly
located in the host mesophyll cells, but ca. 15% were found in epidermal cells. Young
haustoria have a spherical shape, becoming increasingly branched as they aged (Hovmøller et
al. 2011). Long hyphae, also known as ‘runners’, were formed after four days of inoculation
and infection hyphae branched off one day later (Moldenhauer et al. 2006). These 'runners'
produce linear branches up and down of the leaf length, and later develop into to uredinia,
which appear as stripes on the leaves of adult plants at the time of sporulation (Pole 1907).
The latent period, the time from inoculation to sporulation, is usually 12-14 days when
infection occurs under optimum conditions. Based on studies conducted in the U.S., Line
(2002) determined that the optimum temperature for spore germination ranged from 7-12oC
whereas the optimum temperature for development of rust in plants was 13-16oC.

11
Urediniospores cause multiple infections initiating new infection cycles on wheat plants as
long as the host tissue remain live and green (Chen 2005). In a favorable environment, severe
rust occurs 30-40 days after the initial infection.
3.7. Host range
Puccinia striiformis is a pathogen of cereal crops and grasses. During the last century,
investigators identified a large number of genera and species in the Gramineae as hosts. Dietz
and Hendrix (1962) inoculated 948 randomly selected grass lines in a greenhouse at Pullman,
WA and observed stripe rust on 372 lines representing 105 species in 16 genera. The host
range, summarized by Hassebrauk (1965), consists of 230 species in 40 genera. Triticum
aestivum (wheat), Hordeum vulgare (barley), and Secale cereale (rye) are major crop hosts
(CPC 2005). Rye was often reported as a host of stripe rust in the last century, but in more
recent years, infection is rarely seen (Stubbs 1985). Other common hosts are Agropyron
(wheat grass), Bromus (brome grasses), Dactylis (orchard grass), Elymus, Hordeum, and
Secale (rye) (CPC 2005).
It is not known if stripe rust from these grasses infects wheat. Rusts from 30 grass
species infected wheat successfully and conversely, wheat and barley stripe rust infected
about 150 grass species (Hassebrauk 1965). Investigations were done to determine the host
range of Pst in both natural and artificially inoculated situations. Hungerford (1923) found
that Elymus glaucus, E. canadensis, Bromus marginatus, Hordeum nodosum, and H. jubatum
harbored dormant mycelium of the pathogen at low elevations in Oregon. Additionally,
urediniospores were found viable for 58 and 49 days on infected leaves of Agropyron
dasystachyum and Elymus condensatus, respectively, when kept in herbarium packets at room

12
temperature. Hendrix et al. (1965) later found that B. marginatus harbors the pathogen at
high elevations in areas bordering the wheat growing regions of Washington. Other grass
hosts found in Washington were: Agropyron bakeri, A. reparium, A. spicatum, Bromus
carinatus, B. pumpellianus, B. sitchensis, B. marginatus, Hordeum jubatum, Sitanion hystrix,
and Poa nemoralis. When spring-planted winter wheat is used as ground cover, it can also
harbor the pathogen during summer in central Washington. Tu (1967) found early infections
in wheat plots in early fall when grasses were present.
Tu (1967) selected susceptible grasses reported by Dietz and Hendrix (1962) and studied
the behavior of stripe rust on grasses during the summer. Selected grasses were artificially
inoculated in a greenhouse and transplanted to the field during the summers of 1963 and 1964
at Pullman, WA. Continuous sporulation was observed throughout the summer on Elymus
glaucus, Bromus marginatus, Agropyron trachycaulum, A. caespitosum. Sporulation
occurred in early and late summer but with a dormant period near mid-summer on Agropyron
trichophorum, A. sussecundum, A. spicatum, A. spicatum, A. brachyphyllum, A. caespitosum,
A. cristatum, A. dasystachyum, A. intermedium, A. spicatum, Bromus carinatus, B. scoparius,
Elymus crinitus, Festuca arundinacea, F. rubra, Hesperochloa kingie, and Hordeum
bulbosum. Sporulation was observed on Alopecurus arundinaceus and Hesperochloa kingie
in early summer but the fungus succumbed with the advent of hot weather.
Outside of the U.S., Sanford and Broadfoot (1929) observed stripe rust on grasses
throughout the summer in Canada. Stripe rust oversummering was reported on Agropyron
caninum and A. repens at high elevations in Germany (Becker and Hart 1939). In Australia,
Holmes and Dennis (1985) found successful infection after inoculating wheat with
urediniospores collected from Bromus mollis, B. unioloides, Hordeum hystrix, H. leporinum,

13
H. marinum, H. vulgare, Phalaris minor, P. paradoxa, and Triticosecale.
3.8. Environment and the disease
The stripe rust pathogen is highly sensitive to environmental factors. Temperature is the
most important factor influencing pathogen survival and disease development although
moisture, wind, and light also contribute to disease epidemics (Line 2002).
3.8.1. Temperature
Temperature has a significant role in spore germination, infection, latent period,
sporulation, and survival of spores and mycelium (Line 2002). In the presence of dew,
urediniospores germinate when temperatures are between 2 and 15oC, with an optimum at 7
oC
(Rapilly 1979). The minimum temperature required for urediniospore germination ranges
from 0 to 5oC. Relatively low percentage of germination was reported at -4
oC but not at -5
oC.
Urediniospore germination and infection at subfreezing temperatures below 0oC was observed
in field conditions but not under controlled conditions (Burleigh 1965). Urediniospores germ
tube production below 0oC suggests possibility of mycelial growth at low temperatures.
However, mycelial growth in host leaves at subfreezing temperatures was not demonstrated
for Pst so that even if urediniospores can germinate, infection may not take place.
The maximum temperature range for urediniospore germination observed was 20 to 25oC
(Tu 1967), but Straib (1940) reported that some urediniospores can germinate at temperatures
up to 28oC. de Vallavieille-Pope et al. (1995) observed the maximum spore germination at 8-
12oC and no germination occurred above 20
oC. Isolates collected after 2000 from south-

14
central U.S. was reported as having higher germination ability at 18oC than at 12
oC by Milus
and Seyran (2006).
Infection can take place at 11oC even when dew is present for 3 h (Burleigh 1965). The
maximum temperature range in which infection takes place is 20 to 23oC (Bever 1934;
Naoumova 1937; Tu 1967). Under field conditions, high levels of infection were observed
from 19 to 30°C (Park 1990). However, de Vallavieille-Pope et al. (1995) observed the
maximum infection efficiency at 5-12oC, with no infection occurring above 15
oC under
controlled conditions. The minimum temperature range for infection was near 0 (Zadoks
1961) to 3oC (Naoumova 1937), with Burleigh (1965) observing infection below -4
oC under
field conditions. Under controlled conditions infection did not take place at -1.5oC. In
conclusion, different magnitudes of infection can take place generally from 3 to 21oC.
Temperature during sporulation also influences sporulation rate, spore mass and
urediniospore germinability (Straib 1940). Plants maintained at temperatures between 10 and
12.7oC sporulated for longer periods than those kept either above or below those temperatures
(Tu 1967). Plants exposed to alternate temperatures of 12.7 and 18.3oC exhibited spore
production that was 316% higher than alternate temperatures of 1.6 and 29.4oC. Similarly,
infected wheat plants continue to sporulate up to 34 days when kept constantly at 12.7oC and
28 days at 18.3oC and 8 day at 29.4
oC. Germination was greater at alternating temperatures of
12.7 and 18.3oC; 10 and 21.1
oC; and 7.2 and 23.8
oC than constantly at 7.2, 10.0, 12.7, and
18.7oC. Therefore, in spite of high temperatures during days, low temperatures during nights
favor the sporulation of P. striiformis under field conditions. Alternate day/night cycle of
26.6oC and 4.4
oC, 1.6 and 29.4
oC yielded 24 times more spore mass than the plant constantly
kept either at 26.6oC or 29.4
oC after inoculation. But constant temperatures of 26.6
oC or

15
higher has a deleterious effect on spore production. Thus, the stripe rust pathogen can
continue its spore production in areas where daily temperature range is large and nights are
cool.
Temperature also influences the latent period (Shaner and Powelson 1971; Rapilly 1979).
Latent period is the shortest (11 days) at 12 to 19oC (Zadoks 1961; Tollenaar and Houston
1967; Burleigh and Hendrix 1970). Latent periods also vary among isolates. Isolates of P.
striiformis collected after 2000 had latent periods of 9-13 days, compared to a minimum of 11
days for older isolates collected before 2000 in the U.S. Isolates with short latent periods may
cause up to 2.5 times more disease in the field compared to isolates with longer latent periods,
contributing to increased disease severity (Milus et al. 2006).
Experiments conducted at constant temperatures at 2.5, 4, 6, 11, 15, 20, 21, 22, 23, 24.5,
and 25.5oC identified the shortest latent period for stripe rust at 20
oC (Hungerford and Huston
1966). Temperatures either higher or lower than 20oC resulted in a longer latent period and
became infinite with the temperature approaching 0oC. Low daily mean temperature could
prolong the latent period of stripe rust up to 5 months (Hecke 1911). Zadoks (1961) reported
latency of 180 days with near freezing temperatures and 150 days under a snow cover. Thus,
leaves infected in the fall or early winter would show no symptoms of infection during winter
until the next spring (Hungerford 1923; Hungerford and Huston 1966). The length of the
latent period depends on the number of hours necessary to accumulate a total of 4,397 degree-
hours (Hungerford and Huston 1966). Temperatures ≥25°C increase the latent period length
but the pathogen cannot survive more than 25 days (Dennis 1987a). Besides temperature,
other variables such as changes in day length, light intensity, host, and the pathogen race also
alter the latent period (Hungerford 1923; Line and Qayoum 1992; Milus et al. 2006).

16
3.8.2. Moisture
Stripe rust epidemics have close associations with the occurrence of wet weather (Tu
1967). Free water or dew is essential for spore germination, the production of germ tubes,
and infection (Rapilly 1979). Burleigh (1965) studied the minimum period of free moisture
requirement for infection at different temperatures. At least 3 h of continuous dew period was
necessary for successful infection at 11oC. Infection took place within 3.5 h, 4 h, and 5.5 h
when plants were exposed at 7, 4, and 2oC, respectively (Burleigh 1965). A wet period of 6 h
was required for infection at 15oC. No infection took place at 18
oC even when the wet period
was extended up to 12 h (Dennis 1987b). Moisture enhances germination and infection, but
too much free water inhibits infection by reducing the viability of the pathogen. One reason
for this is that when the moisture is very high, stripe rust pustules can be parasitized by
Verticillium lecani (Mendgen 1981). Although high moisture adversely affects urediniospore
survival (Chen 2005), rain can efficiently help the pathogen dispersal because raindrops
release urediniospores either by direct impact or splashing (Rapillly 1979).
3.8.3. Wind
Wind plays a significant role in urediniospores dissemination, especially in long distance
dispersal (Nagarajan and Singh 1990). Wind affects the release, take off, and movement of
spores. Urediniospores could be lifted as high as thousands of meters by air turbulence (Little
1981) and can spread more than 800 km from the area of origin (Zadoks 1961, 1965). As a
result, introduction of the pathogen into areas that are geographically distant is possible.
Thus, the pathogen is disseminated into an area where it cannot survive during summer or
winter (Wang et al. 2010). Wind can have an adverse effect on disease initiation. Wind can

17
desiccate the moisture or dew present on host surface and thus making unfavorable for spore
germination and infection. However, reduction in the relative humidity or water content in
spores may increase the spore viability period (Maddison and Manners 1973).
3.8.4. Light
Light affects spore survival and the disease development (Bever 1934; Manners 1950;
Stubbs 1967; Maddison and Manners 1973). Pst urediniospores have reduced pigmentation in
cell wall compared to P. triticina or P. graminis. Light colored wall of Pst uredinispores are
more sensitive to ultraviolet radiation. These spores tend to be short lived under field
conditions. The lethal effect of radiation was found independent of temperatures but
increases as water content in urediniospores increases or with relative humidity (Maddison
and Manners 1973). The germinability of urediniospores was reduced to 10% when exposed
to 6-10 h sunlight on relatively clear days in midsummer. Germination was further decreased
to less than 0.1% when urediniospores were exposed to sun for a complete day (Maddison and
Manners 1972). May be due to effect of light, under high light intensity conditions even
susceptible plants may produce resistance reactions (Stubbs 1985).
3.9. The pathogen survival
Puccinia striiformis is an obligate parasite that survives either in live hosts or as uredia
(CPC 2005). Teliospores of the cereal rusts typically are dormant and an important means of
perennation during unfavorable environment (Mengden 1983). Teliospores produce
basidiospores which infect alternate hosts. The teliospores of P. striiformis have a short
dormancy and basidiospores are produced very quickly (Wright and Lennard 1978; Wang et

18
al. 2011). Pst survival on alternate hosts is less likely due to unfavorable conditions for
infection by basidiospores on aecial hosts (Rapilly 1979). Role of aecial hosts, Berberis spp.,
on the pathogen survival is still unknown (Jin et al. 2010), but recent experiments conducted
in our laboratory indicate that barberry is not important for stripe rust in the U.S. PNW (Wang
et al. 2011).
3.9.1. Summer survival
High summer temperatures are critical for summer survival of the pathogen and restrict
the pathogen survival in cool or mild summer regions (Metha 1933; Newton and Johnson
1936). Highlands or mountainous areas play a significant role in providing inoculum to low
land wheat growing areas. Because the U.S. PNW has cool summer and warm winter, Pst
survives in this region (Tu 1967). Oversummering of the stripe rust pathogen was
consistently reported in the Sierra Nevadas, from the Oregon border in the north at 1,371 m or
above to as far south as Sequoia National Park at 1,828 m or above (ca. 36oN latitude) on wild
grasses. Generally, stripe rust does not oversummer at elevations below 1,828 m because of
hot environment at these altitudes in southern California (Tollenaar and Houston 1967). But
the pathogen survives during summer at lower elevations, ≥1,600 m, in the Himalayan range
of South Asia (ca. 28-29o N), as compared to southern California. These hilly regions of the
Himalayas provide inoculum for epidemics in the foothills and sub mountainous parts of
northwestern Indian subcontinent (Mehrotra and Aggarwal 2003). Year round survival was
observed in Nilgiri hills, 2,500 m ca. 11oN latitude, of south India (Stubbs 1985). In Africa,
Pst can survive all year around even on or near equator in Mau Escarpment and Aberdare
mountain range (>3,000 m) in Kenya (Bonthuis 1985).

19
The stripe rust pathogen can oversummer in three ways: persistence of active uredia,
persistence of dormant mycelium in host, and the survival of urediniospores on both dead and
living hosts. Inoculum from these sources causes the disease on autumn-sown seedlings in
the U.S. PNW. The mycelium in infected leaves can survive up to 28, 28, 18, 14, and 10 days
when plants exposed to constant temperature of 18.3, 21.1, 23.8, 26.6, and 29.6oC,
respectively. However, when infected plants were kept at alternate temperatures of 12.7 and
18.3, 10 and 21.1, 7.2 and 26.6, and 1.6 and 29.6oC, mycelium in leaves could survive up to
32, 34, 36, 36, and 36 days, respectively. These mycelium survival days are very close to
survival days found when plants were subjected to respective lower temperatures. Short
exposure to the higher temperatures does not kill the pathogen (Tu 1967). Sporulation is
reduced at temperatures over 30°C and ceases at 33°C and above (Rapilly 1979). A long
latent period is induced at temperatures above 30°C (Dennis 1987a). Tu (1967) reported
survival of P. striiformis as a latent infection during the summer of 1963 and 1964 in
Pullman, WA when the maximum temperatures during 1963 and 1964 were 34.4 and 36.6°C,
respectively. The fungus can tolerate temperatures up to 38°C without being destroyed for a
short period (Georgievskaja 1966). In contrast the pathogen ceases to develop and is killed
when exposed at constant or mean temperatures above 22 to 25oC (Sharp 1965; Tollenaar and
Houston 1967; Shaner and Powelson 1971). Stripe rust incidence under field condition
decreases when the daily mean temperature is above 18oC. Uredia ceased to develop when
either 10 days mean or maximum temperature is above 22.3oC or 32.4
oC, respectively.
Controlled experiments indicated that Pst mycelium could not thrive at 24.5oC for 10 days
(Tollenaar and Houston 1967). Latent and sporulating infections of P. striiformis can survive
even at 40°C for 5 h, at 35oC for 16 h, at 30
oC for 26 h and at 25
oC for 264 h (Dennis 1987b).

20
The pathogen can oversummer as viable urediniospores especially in dry and cool
environment (Tu 1967). As revealed by germination test, Pst urediniospores remained viable
up to September 16 in the western WA. Tu (1967) found 0.1% germinability of
urediniospores collected from crop stubble at Wawawai, Lind, and Pullman, WA. Similarly,
urediniospores collected from wheat heads at Pullman on October 1 had 0.1% germinability.
Although the percentage of viable urediniospores is low, based on the population size of the
pathogen, the germinability of 0.1% should provide enough inoculum to initiate disease on
late fall or early winter. In addition, these dates are significant since they overlap with the
wheat planting dates at the respective sites in the PNW.
Scientists reported different maximum lethal temperatures. These differences might be
due to differences in heat tolerance among Pst isolates, the degree of resistance in the plant
governed by the daily mean temperature (Zadoks 1961), and/or the daily temperature profile
(Sharp 1965). The information regarding the effect of different temperature combinations and
its duration on pathogen mortality is still inadequate. In fact, in spite of high day-time
temperatures, low night temperatures favor the pathogen survival and disease development
(Chen 2005).
3.9.2. Winter survival
In 1896, Eriksson and Henning observed overwintering of Pst at temperatures below
subzero oC; however, they could not explain the mechanism of survival. Later, Hecke (1911)
described a prolonged latent period of up to five months at low daily mean temperatures
(Tollenaar and Houston 1967). Field studies conducted in Washington State discovered three
mechanisms of overwintering: as a dormant mycelium in host tissue, the persistence of active

21
uredia, and the survival of urediniospores either on living or dead tissues (Burleigh 1965).
Active uredia are recognized as a principal source of overwintering inoculum (Straib 1938),
but sporulating lesions make wheat foliage more vulnerable to frost killing or temperatures
below -4oC. In snow falling areas, snow cover can insulate sporulating lesions from the cold
temperatures so even if air temperatures fall below -4oC the pathogen cannot be eliminated
from its host (Zadoks 1961; Burleigh 1965). Uredia covered by the host epidermis in
desiccated leaves usually ruptured by a longitudinal slit when temperatures rose above 0oC
during winter. Urediniospores from such uredinia may provide inoculum for infection during
winter season depending upon the availability of living host tissue, and favorable conditions
for germination and infection (Burleigh 1965). However, periodic occurrence of wet and dry
weather conditions due to frequent rainfall or snow melt shorten the uredinia survival period.
The importance of dormant mycelium for overwintering and succession of disease
development in spring has been discussed by Burleigh (1965), Tollenaar and Houston (1967),
Shaner and Powelson (1971), and Zadoks (1971). The survival of dormant mycelium is host
dependent and it survives as long as the host tissue survives during winter. In the PNW, the
pathogen can infect wheat seedlings and other grasses, survive the winter, produce disease
foci in the spring and sometimes in a mild winter, and cause an epidemic as the season
progresses in the spring and summer (Burleigh 1965).
Urediniospores remain viable even when severe winters kill the infected and noninfected
foliage which was an important means of overwintering in England (Biffen 1908). During the
winter of 1963 in WA, Pst mycelium was apparently destroyed. However, viable
urediniospores were collected until February. These observations indicate that the conditions
permitting urediniospore overwintering can be distinct from those permitting overwintering of

22
mycelium. In addition, urediniospores tolerate more harsh winter than dormant mycelium in
infected host. Severe winter causes the mortality of host tissue and kills the fungal mycelium
leaving overwintering urediniospores as a source of inoculum. However, the role of such
overwintering urediniospores for disease initiation in spring is yet to be determined.
Urediniospores have been reported to withstand severe cold, -21oC. Rapilly (1979) reported a
minimum lethal temperature of -10oC, but this was not conclusive. In contrast, mycelium, can
withstand temperatures down to -18oC under field condition (Burleigh 1965). The length of
time that urediniospores and mycelium can tolerate such low temperatures has not been
documented. Dry urediniospores survive better than wet spores and therefore, it is crtitical to
keep spores dry to maintain rust isolates. Dry urediniospores are still infectious after being
stored at -80oC for a couple of years and in liquid nitrogen (below -196
oC) for more than 10
years (Chen unpublished).
3.10. Disease prediction
Disease forecasting models can be classified as empirical models based upon statistical
relationships between environmental variables and disease, and fundamental models based
upon laboratory, greenhouse, or field experiments (Krause and Massie 1975). Both types of
disease forecasting models have been developed for wheat foliar fungal diseases (De Wolf
and Isard 2007). Most forecasts use weather data to predict the probability and level of
disease severity. Major weather parameters influencing most plant disease epidemics are
temperature, leaf wetness duration, and light (Papastamati and van den Bosch 2007).
Historically, stripe rust was a problem primarily in the PNW and forecasting models were
developed for this region. An initial study revealed the relationship between climatic

23
variables and stripe rust epidemics at Pendleton, OR (Coakley 1978). No epidemics were
observed between 1935 and 1960, but between 1961 and 1975, relatively warm average
temperatures in January and February (2oC warmer than normal) and a cool April (1.2
oC
cooler than normal) favored stripe rust epidemics (Coakley 1978). A series of studies and
forecasting models have been developed (Coakley and Line 1981; Coakley et al. 1982;
Coakley et al. 1983; Coakley et al. 1988). Using disease data from Pullman, WA from 1963
to 1979, Coakley and Line (1981) quantified the relationships between temperature and stripe
rust epidemics on winter wheat. A base temperature of 7oC was selected because it was found
to be the most optimum for urediniospore germination and infection (Sharp 1965). Negative
and positive degree days were used to identify the cumulative effect of temperature on disease
development using the base temperature. A study revealed high correlation coefficients of
stripe rust disease index with the cumulative negative (December 1 to January 31) and
positive degree days (April 1 to June 30) (Coakley and Line 1981). Simple linear regression
models for predicting stripe rust disease severity were developed for the Pullman area using
these positive and negative degree days as weather descriptors. These models were further
extended to other locations in the PNW using standardized negative degree days accumulated
during December and January (Coakley et al. 1982). More predictive models to estimate
disease index were developed using temperature and other meteorological factors such as the
amount and frequency of precipitation from 1968 to 1986 at Pullman, WA with a multiple
regression approach (Coakley et al. 1988). However, the simple linear models based on
negative and positive degree days have been used mostly in forecasting for stripe rust
management in the PNW (Line 2002; Chen 2005). Fundamental prediction models for stripe
rust were developed recently in Kansas using the logistic regression model approach (Eddy

24
2009). These models used hours at relative humidity >87%, leaf wetness, and mean relative
humidity as explanatory variables.
3.11. Virulence variation
Virulence is the ability of a pathogen to overcome a specific gene conferring resistance in
the host (Flor 1971; Brown 2003). A race has a specific virulence spectrum, which allows it
to attack certain cultivars of wheat but not others. A set of wheat genotypes, called
differentials, is used to identify the virulence variation with the stripe rust isolates. Changes
in virulence of Pst are caused by mutation, somatic recombination, and may be sexual
recombination (Stubbs 1985; Jin et al. 2010). Migration of pathogen from one region to
another brings changes in pathogen virulence to an area where it becomes established (Brown
and Hovmøller 2002).
Historically, Hungerford and Owens (1923) were the first to report “strains” in Pst.
Allison and Isenbeck determined the existence of races in Europe in 1930. Straib (1935,
1937) introduced a differential set of wheat cultivars to differentiate Pst races in Germany and
an international race survey was initiated by means of stripe rust trials sown at many locations
in Europe (Zadoks 1961). In North America, Newton et al. (1933) isolated physiologic races
in Canada. In the U.S., Bever (1934) was the first to identify the presence of two races.
Extensive race studies began in the 1960s when stripe rust appeared seriously on wheat and
races were found infecting wheat cultivars previously resistant to stripe rust, such as Suwon
92 (Purdy and Allan 1966) and Moro (Yr10) (Beaver and Powelson 1969). In Asia, Mehta
(1933) initiated race study in India according to the system developed by Gassner and Straib
(1932). Fang (1944), in China, found the presence of races using eight differential cultivars

25
whereas in Japan, Kajiwara et al. (1964) used the Gassner and Straib (1932) differential set
with Lee (Yr7) and Reichersberg 42 as supplements.
Different differential sets and nomenclature systems have been proposed in different
countries to determine rust races (Park et al. 2010). Johnson et al. (1972) proposed the World
[Chinese 166 (Yr1), Lee (Yr7), Heines Kolben (Yr2, Yr6), Vilmorin 23 (Yr3), Moro (Yr10),
Strubes Dickkopf (YrSD), and Suwon 92 x Omar (YrSU)]; and the European differentials set
[(Hybrid 46 (Yr4+), Reichersberg 42 (Yr7+), Heines Peko (Yr2, Yr6+), Nord Desprez (Yr3),
Compair (Yr8,Yr19), Carstens V (YrCV), Spaldings Prolific (YrSP), and Heines VII (Yr2,
YrHVII)] for differentiating Pst races. In China, a set of 19 differential wheat genotypes
consisting of Trigo Eureka (Yr6), Fulhard, Lutescens 128, Mentana, Virgilio (YrVir1,YrVir2),
Abbondanza, Early Premium, Funo (YrA, +), Danish 1 (Yr3), Jubilejina 2 (YrJu1, YrJu2,
YrJu3, YrJu4), Fengchan 3 (Yr1), Lovrin 13 (Yr9, +), Kangyin 655 (Yr1, YrKy1, YrKy2),
Suwon 11 (YrSu), Zhong 4, Lovrin 10 (Yr9), Hybrid 46 (Yr3b, Yr4b), Triticum spelta album
(Yr5) and Guinong 22 are in use currently (Chen et al. 2009). In North America, a set of 20
differentials are used for race identification and virulence studies (Chen 2005). These
differentials are: Lemhi (Yr21), Chinese 166 (Yr1), Heines VII (Yr2, YrHVII), Moro (Yr10,
YrMor), Paha (YrPa1, YrPa2, YrPa3), Druchamp (Yr3a, YrD, YrDru), AvSYr5NIL (Yr5),
Produra (YrPr1, YrPr2), Yamhill (Yr2, Yr4a, YrYam), Stephens (Yr3a, YrS, YrSte), Lee (Yr7,
Yr22, Yr23), Fielder (Yr6, Yr20), Tyee (YrTye), Tres (YrTr1, YrTr2), Hyak (Yr17, YrTye),
Express (YrExp1, YrExp2), AvSYr8NIL (Yr8), AvSYr9NIL (Yr9), Clement (Yr9, YrCle), and
Compair (Yr8, Yr19). The near-isogenic lines in the ‘Avocet Susceptible’ (AvS) background
for Yr genes have been developed at the Plant Breeding Institute, University of Sydney,
Australia. These isogenic lines are being used throughout the world for monitoring virulence

26
genes of Pst. Due to the presence of single resistance genes, these isogenic lines are
increasingly gaining acceptance among wheat rust workers (Wellings et al. 2009). Recently,
a new set of 18 single gene line differential sets consisting of Yr1, Yr5, Yr6, Yr7, Yr8, Yr9,
Yr10, Yr15, Yr17, Yr24, Yr27, Yr32, Yr43, Yr44, YrTr1, YrSP, YrTye, and YrExp2 is being
used for differentiating Pst races (Chen and Wan 2011).
Regular virulence surveys of the stripe rust pathogen are being conducted in Australia
(Wellings 2007), China (Kang et al. 2010), India (Stubbs 1985), the U.S. (Chen 2005), and
European countries (Stubbs 1985; Hovmøller et al. 2011). Virulence spectra on many wheat
cultivars grown in developing countries were monitored through trap nursery (Stubbs 1985).
Few studies have been conducted to compare virulence at an international scale (Stubbs
1985; Hovmøller et al. 2008). Direct comparison of virulence patterns among the wheat
growing countries is difficult due to difference in differential sets and virulence formula to
denote races (Park et al. 2011). A total of 68 races were identified in China (Wan et al. 2007;
W. Q. Chen et al. 2009). Predominant races are virulent with one or more of Yr1, Yr2, Yr3,
Yr3b, Yr4b Yr4, Yr6, Yr7, Yr8, Yr9, and other unnamed resistant genes. Liu et al. (2010) first
detected virulence to resistance gene Yr24 (=Yr26) in wheat cultivar ‘Chuanmai 42’. The
pathogen populations are still avirulent to Yr5, Yr10, Yr15, YrZH84, and some unnamed genes
(W. Q. Chen et al. 2009; Kang et al. 2010). Similarly, virulence to YrA, Yr1, Yr2, Yr6, Yr7,
Yr8, Yr9, Yr17, Yr18, Yr27, Yr28, Yr29, Yr31, and YrSU are common in Pakistan (Anonymous
2007; Bahri et al. 2011). Virulences to Yr3, Yr4, Yr17, and YrSD were rare, whereas Pst
isolates were avirulent to Yr5, Yr10, Yr15, Yr24, Yr32, and YrSP. In Nepal, the Pst population
was virulent to YrA, Yr1, Yr2, Yr4, Yr6, Yr7, Yr8, Yr9, Yr17, Yr18, Yr27, and Yr32; but
avirulent to Yr5, Yr10, Yr15, Yr24, and Yr26 (Sharma et al. 1995; Adhikari 2009). Virulences

27
to YrA, Yr2, Yr3, Yr4, Yr6, Yr7, Yr8, Yr9, Yr10, Yr17, and Yr25 have been reported in
Australia (Wellings 2007).
In the U.S., the Pst population is virulent on Lemhi (Yr21), Chinese 166 (Yr1), Heines
VII (Yr2, YrHVII), Moro (Yr10, YrMor), Paha (YrPa1, YrPa2, YrPa3), Druchamp (Yr3a, YrD,
YrDru), Produra (YrPr1, YrPr2), Yamhill (Yr2, Yr4a, YrYam), Stephens (Yr3a, YrS, YrSte),
Lee (Yr7, Yr22, Yr23), Fielder (Yr6, Yr20), Tyee (YrTye), Tres (YrTr1, YrTr2), Hyak (Yr17,
YrTye), Express (YrExp1, YrExp2), AvSYr8NIL (Yr8), AvSYr9NIL (Yr9), Clement (Yr9,
YrCle), and Compair (Yr8, Yr19). In addition, Pst were also virulent to Yr27, Yr43, and Yr44,
but no races have been found virulent to Yr5 and Yr15 (Chen and Wan 2011).
3.12. Molecular variation
Conventional studies of genetic diversity of Pst populations are based on virulence data
(Line 2002). Since virulence is governed by a few loci that are under continuous intense
selection pressure by resistance genes in wheat cultivars, the information on diversity is not
neutral (Michelmore and Hulbert 1987). Thus, molecular markers are important tools to study
the genetic diversity and population structure of the pathogen. Such studies are helpful in
understanding the origin of races, evolutionary mechanisms, disease epidemiology, and
effective disease control measures (McDonald and Linde 2002).
Several molecular techniques have been used to determine Pst diversity at regional,
national, and international levels. Previous studies were generally focused on the origin of
races, gene flow or migration, recombination, and diversity within or between countries.
DNA polymorphism was detected among U.S. Pst races and even single-spore isolates within
races using randomly amplified polymorphic DNA (RAPD) markers (Chen et al. 1993).

28
Differences in the RAPD markers within races virulent to Yr1 indicate a separate origin of the
Yr1 virulence in Pst populations. The study demonstrated that DNA polymorphism and
virulence patterns are independent of each other. RAPD marker data did not correlated with
geographic region but virulence data did. Shan et al. (1998) used a moderately repetitive
DNA sequence to study genetic variation among Pst isolates of China. Low levels of genetic
differentiation among regions as well as within regions showed gene flow between Pst
populations in different epidemic regions in China. Zheng et al. (2001) demonstrated the
possibility of evolution of new pathotypes independently from reference strains using
amplified fragment length polymorphism (AFLP) markers. Often, a low level of molecular
variability has been reported as compared to virulence phenotype at national and regional
scales in Europe (Steele et al. 2001; Hovmøller et al. 2002; Enjalbert et al. 2005). No
polymorphisms were observed among isolates collected between 1979 and 1991 from
Australia using the RAPD and AFLP techniques (Steele et al. 2001). However, the same
markers showed polymorphism among isolates from the United Kingdom and Denmark. The
authors considered the lack of molecular variation in the Australian collection to be consistent
with the stepwise mutation theory of pathotype evolution from a single introduction. Justesen
et al. (2002) studied the Pst population in Denmark and suggested that it might have
originated from immigrant aerial dispersal of urediniospores based on the disease incidence
data and AFLP markers. Further study demonstrated the long distance migration of Pst
throughout Northwestern Europe using the same AFLP primer combinations (Hovmøller et al.
2002). Ancient divergence of two clonal lineages and subsequent local adaption of Pst
population in northern and southern France were discovered through phylogeographical
analysis using AFLP, SSR, and virulence data (Enjalbert et al. 2005). Distinct AFLP groups

29
were observed between Pst isolates collected in the eastern United States before and since
2000 (Markell and Milus 2008). It was concluded that the new population was more likely
introduced to the U.S. rather than from a mutation in the old population, supporting the
previous conclusion based on virulence tests (Chen et al. 2002). Hovmøller et al. (2008)
demonstrated intercontinental spread of similar strains of Pst in North America, Australia, and
Europe in less than three years using the AFLP technique. Bahri et al. (2009) used SSR
markers to demonstrate the divergence of southern France Pst isolates from a northwestern
European population. Using AFLP markers, they found gene flow from the Middle East with
subsequent founder effects, genetic divergence, and local survival of a western Mediterranean
population. Bahri et al. (2011) studied the molecular diversity of Pst population from
Pakistan using SSR markers. Most isolates (80%) belonged to Pakistani lineage and other
isolates were close to either a Mediterranean lineage or a Northern European lineage. The
Pakistan Pst population has a high degree of genetic diversity associated with evidence of
recombination. Genetic recombination was suspected in isolates collected from Tianshui,
China based on AFLP and SSR marker phenotypes even before the discovery of alternate host
of Pst (Mboup et al. 2009). Similar findings were found by Duan et al. (2010) in Pst isolates
collected from Gansu province of China using AFLP markers.
3.13. Disease management
A combination of cultural control practices with disease resistance and fungicide
applications are the most effective means for wheat rust control (Roelfs et al. 1982). The
principal control of stripe rust has been achieved through growing resistant cultivars (Chen
2007).

30
3.13.1. Cultural practices
Cultural practices are mostly used to supplement the other disease control methods.
Mexican farmers used to sow early to avoid rusts prior to the use of resistant cultivars.
Removing greenbridge plants with tillage or herbicides is another effective control measure
for epidemics resulting from endogenous inoculum. Offseason removal of volunteer plants
reduces inoculum amount (Roelfs et al. 1982). However, cultural practices, such as late
planting, reduced irrigation, avoidance of excessive nitrogen use, and elimination of volunteer
and grass plants, when used alone, may not be profitable (Chen 2007). Late planting of winter
wheat in the U.S. PNW shortens the time of seedling exposure to Pst inoculum and thus
reduces fall infection. Even though the amount of overwintering inoculum would be less in
late planting of winter wheat, late planting alone is not sufficient to protect wheat stripe rust
development in spring.
3.13.2. Chemical control
Fungicides are the first line of defense when susceptible cultivars are grown and when
resistant varieties succumb to new races. Chemical interventions provide a practical, rapid-
response solution to manage stripe rust. Farmers in high productivity areas use fungicides
more often than those of small farms in low-yield producing areas. However, fungicide
application has become more and more common in developing countries where wheat is a
major source of national food security (ICARDA 2011).
In the U.S. PNW, economical and successful use of fungicides started in 1981.
Triadimefon (Bayleton®
) was widely applied to prevent multi-million dollar losses from stripe
rust in 1980s and 1990s (Line 2002). Currently, several fungicides are labeled for control of

31
stripe rust, including Tilt® (propiconazole), Quadris
® (azoxystrobin), Stratego
®
(propiconazole+trifloxystrobin), Headline® (strobilurin), Quilt
®
(azoxystrobin+propiconazole), Quilt Xcel, Folicur, and Prosaro. Use of fungicides has
prevented significant yield losses from stripe rust in the U.S. since 2000. Washington State
farmers saved 15-30 million dollars at a cost of 2-4 million dollars of fungicides every year
from 2002 to 2005 (Chen 2005), and saved much more in 2010 and 2011 (Chen, unpublished
data). Although fungicide application is effective in control of stripe rust, the use of
fungicides adds more cost as well as potentially impacting the environment and human health.
In addition, continuous use of fungicides favors the selection pressure for potential fungicide-
tolerant strains of the pathogen (Chen 2007).
3.13.3. Genetic resistance
Use of host resistance is proved to be most effective, environment-friendly, and
economical (Line and Chen 1995; Line 2002; Chen 2005, 2007). Stripe rust has been
managed by using resistant cultivars in all wheat growing environments and stripe rust
epidemics regions (Singh et al. 2004).
Race-specific and non-specific resistances have been used in developing cultivars
resistant to rusts (Kolmer et al. 2009). Race-specific resistance can be detected at the seedling
stage, but usually provides high-level resistance to specific races throughout all growth stages
(Chen and Line 1992; Chen 2005). Cultivars with race specific resistance frequently become
susceptible to new races. Therefore, virulences to most race specific resistance genes are
present in the pathogen population. Genes for race specific resistance are often provide
complete control and easy to incorporate into cultivars. However, genes for race-specific

32
resistance are generally not durable. Severe epidemics are often associated with the failure of
widely grown cultivars with race-specific resistance. To overcome this problem, multiline
cultivars, cultivar mixture, and gene pyramiding have been employed and successfully used to
control stripe rust (Chen 2005).
Slow rusting, which is often race non-specific, retards the disease progress rate, resulting
in intermediate to low disease levels against all pathotypes of a pathogen (Caldwell 1968).
Many minor genes for slow rusting have been identified and are being incorporated into
commercial cultivars to achieve durable resistance. Slow rusting wheat cultivars are
prioritized in the CIMMYT wheat breeding program and have been successfully employed in
many countries (Singh et al. 2000). Eastern Australia currently recommended that wheat
cultivars have at least a moderate level of adult-plant resistance to stripe rust (McIntosh and
Brown 1997).
High temperature adult-plant (HTAP) resistance is a race non-specific type of resistance
and therefore, durable against stripe rust (Chen and Line 1995; Line and Chen 1995; Chen
2005). Cultivars with HTAP resistance are susceptible at the seedling stage but become
resistant as the plants grow older and temperature becomes higher. With HTAP resistance,
the flag leaf, which makes the largest contribution to grain yield, is more resistant to stripe
rust than lower leaves (Qayoum and Line 1985). HTAP resistance protects the crop by
lowering the infection type and the number of new infections, particularly in flag leaves of the
plants. Thus, it reduces the amount and spread of inoculum. Sporulation can be completely
inhibited on cultivars with high degree of HTAP resistance (Chen and Line 1995). HTAP in
combination with effective race specific resistance has been proved to be the best disease
control strategy (Chen 2007).

33
4. Research introduction and objectives
4.1. Models for predicting potential yield loss of wheat caused by stripe rust in the U.S.
Pacific Northwest
The U.S. PNW has favorable climatic conditions for stripe rust epidemics (Line 2002).
Stripe rust forecasting models were developed based on December and January temperatures
for this region (Coakley et al. 1982, 1983, 1988). These models were applicable in most
years; however, the models do not predict disease accurately when the minimum temperatures
deviate beyond December and January or from its normal value. In addition, these models
predict disease index at wheat flowering stage. The estimated disease index is hard to
translate proportionally to yield loss incurred due to stripe rust. It is necessary to develop new
stripe rust forecasting models to estimate potential yield loss covering the winter months,
November to February. The objective of this study was to identify weather variables
correlated to yield loss and to develop a series of models for early prediction of potential yield
loss caused by stripe rust in the PNW.
4.2. Potential Oversummering and Overwintering Regions for the Wheat Stripe Rust
Pathogen in the Contiguous United States
Historically, stripe rust has been more destructive states west of the Rocky Mountains;
however, since 2000 it has become more destructive in states east of the Rocky Mountains
(Chen 2005). Between 2000-2010, the most severe and widespread stripe rust epidemics of
wheat occurred in the U.S. in 2003, 2005, and 2010, causing estimated 2.42, 1.99, and 2.38
106 tons of yield loss, respectively, with millions of dollars spent on fungicide application

34
each year (Sharma-Poudyal and Chen 2011). Effects of climatic parameters on the biology of
the fungus and its survival have been well documented in the western U.S., but not so for the
eastern U.S. (states east of the Rocky Mountains) (Burleigh 1965; Tollenaar and Houston
1967; Tu 1967; Shaner and Powelson 1971). The objectives of this study were to determine
geographic regions within the contiguous U.S. where the stripe rust fungus is potentially able
to survive summer and/or winter, providing inoculum within and beyond the regions.
4.3. Virulence Spectrum of International Collections of the Wheat Stripe Rust Pathogen,
Puccinia striiformis f. sp. tritici
Growing resistant cultivars is the most economical, environmental friendly, and
effective method for disease control (Chen 2005). Often new races emerge within a few years
of cultivation of a new resistant cultivar, and potentially spread as airborne urediniospores
causing severe stripe rust epidemics (Chen 2007; Wan et al. 2007). Monitoring of virulence
of the Pst population across a region is important to develop effective disease control
strategies (McIntosh and Brown 1997). Virulence spectrum information is helpful to screen
cultivars or breeding lines to know the current resistance level or explore new resistance
sources efficiently to manage the potential epidemics once the race spread into or evolve in
the regions (Singh et al. 2004). The objectives of this study were to characterize virulence
and virulence combinations of the stripe rust pathogen from international collections and to
determine their virulence relationships in an international scale.

35
4.4. Genetic Diversity of International Collections of Puccinia striiformis f. sp. tritici, the
Wheat Stripe Rust Pathogen
Epidemiological zones of wheat stripe rust have been defined in an international scale and
mostly at a national level based on the similarity of virulences or virulence patterns in
combination with geographical features and potentials of urediniospore spread (Stubbs 1985;
Chen et al 2010). Molecular characterization of a Pst population at the regional and national
levels has been done using neutral markers to reveal genetic structures of the pathogen
populations (Chen et al 1993; Shan et al. 1998; Steele et al. 2001; Hovmøller et al. 2002;
Enjalbert et al. 2005). Low association between virulence and molecular markers often yield
different results in genetic studies using molecular markers as compared to virulence diversity
(Chen et al 1993; Shan et al. 1998; Steele et al. 2001; Enjalbert et al. 2005). The objectives of
this study were to determine the genetic relationships among the international populations of
P. striiformis f. sp. tritici using molecular markers that have been developed for the pathogen.
LITERATURE CITED
1. Adhikari, S. 2009. Epidemiology and Yellow rust (Puccinia striiformis Westend f. sp.
tritici) resistance of wheat genotypes in midhills of Nepal. December, 2009. MS thesis,
Department of Plant Pathology, Tribhuvan University, Rampur, Chitwan, Nepal.
2. Allen, R. E. 1928. A cytological study of Puccinia glumarum on Bromus marginatus and
Triticum vulgare. J. Agric. Res. 36:487-513.
3. Allison, C., and Isenbeck, K. 1930. Biologische specialisierung von Puccinia glumarum
tritici Erikss. und Henn. J. Phytopathol. 2:87-98.

36
4. Anonymous. 2007. A report on screening of wheat against yellow and leaf rusts under
NUWYT and NWDSN and wheat rusts situation in Pakistan. Crop diseases research
program, National agriculture research center, Islamabad, Pakistan.
5. Bahri, B., Leconte, M., Ouffroukh, A., de Vallavieille-Pope, C., and Enjalbert, J. 2009.
Geographic limits of a clonal population of wheat yellow rust in the Mediterranean
region. Mol. Ecol. 18:4165-4179.
6. Bahri, B., Shah, S. J. A., Hussain, S., Leconte, M., Enjalbert, J., and de Vallavieille-Pope,
C. 2011. Genetic diversity of the wheat yellow rust population in Pakistan and its
relationship with host resistance. Plant Pathol. 60:649-660.
7. Batts, C. C. V. 1957. The reaction of wheat varieties to yellow rust, Puccinia glumarum,
1951-1956. Natl. Inst. Agr. Bot. 8:7-18.
8. Beaver, R. G., and Powelson, R. L. 1969. A new race of stripe rust pathogenic on the
wheat variety Moro, C.I. 13740. Plant Dis. Rep. 53:91-93.
9. Becker, H., and Hart, H. 1939. Das Ayftreteb und die Verbreitung von Gelbrost in
Ostharz und den daran angrenzenden Wizenanbaugebieten. Z. Pflanzenkrankh. 49:449-
481.
10. Bever, W. M. 1934. Physiologic specialization in Puccinia glumerum in the United
States. Phytopathology 24:686-688.
11. Biffen, R. H. 1908. Rust in wheat. J. Borad Agr. 15:241-53.
12. Bonthuis, H. 1985. Survival of stripe rust (Puccinia striiformis) on wheat in the Kenyan
highlands and the consequences for virulence. Mededelingen Faculteit and
Bouwwetenschappen Rijks Universiteit Gent. 50:1109-1117.

37
13. Britton, M., and Cummins, G. B. 1956. The reaction of species of Poa and grasses to
Puccinia striiformis. Plant Dis. Rep. 40:643-645.
14. Brown, J. K. M. 2003. Little else but parasites. Science 299:1680-1681.
15. Brown, J. K. M., and Hovmøller, M. S. 2002. Aerial dispersal of pathogens on the global
and continental scales and its impact on plant disease. Science 297:537-541.
16. Burleigh, J. R. 1965. The winter biology of Puccinia striiformis West. in the Pacific
Northwest. PhD thesis, Department of Plant Pathology, WSU, Pullman, WA.
17. Burleigh, J. R., and Hendrix, J. W. 1970. The winter biology of Puccinia striiformis
West. in the Pacific Northwest. Wash. Agric. Exp. Stn., Coll. Agric., Wash. State Univ.
Stn. Tech. Bull. 65:1-6.
18. Calderini, D. F., and Salfer, G. A. 1998. Changes in yield and yield stability in wheat
during the 20th
century. Field Crops Res. 57:335-347.
19. Caldwell, R. M. 1968. Breeding for general and /or specific plant disease resistance. P.
263-272. K. W. Finlay, and K. W. Shepard (Eds.). Pro Int. Wheat Genet. Symp., 3rd
,
Canberrra, Australia. 5-9 Aug. 1968. Australian Academy of Science, Canberra,
Australia.
20. Chen, W. Q., Wu, L. R., Liu, T. G., Xu, S. C., Jin, S. L., Peng, Y. L., and Wang, B. T.
2009. Race dynamics, diversity, and virulence evolution in Puccinia striiformis f. sp.
tritici, the causal agent of wheat stripe rust in China from 2003 to 2007. Plant Dis.
93:1093-1101.
21. Chen, W. Q., Xu, S. C., Liu, T. G., Lin, R. M., Wu, L. R., Jin, S. L., and Cao, S. Q. 2007.
Wheat stripe rust and its prospects for ecological control in China. Proc. 16th
Int. Plant
Prot. Congr., Vol. 2, 11D-1, Glasgow, UK.

38
22. Chen, X. M. 2005. Epidemiology and control of stripe rust [Puccinia striiformis f. sp.
tritici] on wheat. Can. J. Plant Pathol. 27:314-337.
23. Chen, X. M. 2007. Challenges and solutions for stripe rust control in the United States.
Aust. J. Agri. Res. 58:648-655.
24. Chen, X. M., and Line, R. F. 1992. Identification of stripe rust resistance genes in wheat
cultivars used to differentiate North American races of Puccinia striiformis.
Phytopathology 82:1428-1434.
25. Chen, X. M., and Wan, A. 2011. Epidemics and Races of Puccinia striiformis in the
United States in 2010. North American Rust workers meeting June 12, 2011,
Minneapolis. P 26.
26. Chen, X. M., and Line, R., F. 1995. Gene action in wheat cultivars for durable high-
temperature adult-plant resistance and interactions with race-specific, seedling resistance
to stripe rust caused by Puccinia striiformis. Phytopathology 85:567-572.
27. Chen, X. M., Line, R. F., and Leung, H. 1993. Relationship between virulence variation
and DNA polymorphism in Puccinia striiformis. Phytopathology 83:1489-1497.
28. Coakley, S. M., and Line, R. F. 1981. Quantitative relationships between climatic
variables and stripe rust epidemics on winter wheat. Phytopathology 71:461-67.
29. Coakley, S. M., Boyd, W. S., and Line, R.F. 1982. Statistical models for predicting stripe
rust on winter wheat in the Pacific Northwest. Phytopathology 72:1539-42.
30. Coakley, S. M., Line, R. F., and Boyd, W. S. 1983. Regional models for predicting stripe
rust on winter wheat in the Pacific Northwest. Phytopathology 73:1382-85.

39
31. Coakley, S. M., Line, R. F., and McDaniel, L. R. 1988. Predicting stripe rust severity on
winter wheat using an improved method for analyzing meteorological and rust data.
Phytopathology 78:543-550.
32. Coakley, S. M., Line, R. F., and McDaniel, L. R. 1988. Predicting stripe rust severity on
winter wheat using an improved method for analyzing meteorological and rust data.
Phytopathology 78:543-50.
33. Coakley, S. M., McDaniel, L. R., and Shaner, G. 1985. Model for predicting severity of
Septoria tritici blotch on winter wheat. Phytopathology 75:1245-1251.
34. CPC, 2005. Crop Protection Compendium. CAB International. UK.
35. Cummins, G. B., and Stevenson, J. A. 1956. A check list of North American rust fungi
(Uredinales). Plant. Dis. Rep., Suppl. 240:109-193.
36. De Wolf, E. and Isard, S. 2007. Disease cycle approach to plant disease prediction. Annu.
Rev. Phytopathol. 45:203-220.
37. de Vallavieille-Pope, C., Huber, L., Leconte, M., and Goyeau, H. 1995. Comparative
effects of temperature and interrupted wet periods on germination, penetration, and
infection of Puccinia recondita f. sp. tritici and P. striifornis on wheat seedlings.
Phytopathology 85:409-415.
38. Dennis, J. I. 1987a. Effect of high temperatures on survival and development of Puccinia
striiformis on wheat. Trans. Br. Mycol. Soc. 88:91-96.
39. Dennis J. I. 1987b. Temperature and wet-period conditions for infection by Puccinia
striiformis f. sp. tritici race 104E137A+. Trans. Br. Mycol. Soc. 88:119-121.
40. De Wolf, E. and Isard, S. 2007. Disease cycle approach to plant disease prediction.

40
41. Dietz, S. M., and Hendrix, J. W. 1962. Reaction of grasses to stripe rust at Pullman,
Washington. Phytopathology 52:730
42. Dixon, J., Braun, H. J., Kosina, P., and Crouch, J. 2009. Wheat Facts and Futures 2009
(Eds.). Mexico, D.F.: CIMMYT.
43. Doodson, K. J., Manners, J. G., and Myers, A. 1964. Some effects of yellow rust
(Puccinia striiformis) on the growth and yield of spring wheat. Ann. Bot. 28:459-472.
44. Duan, X., Tellier, A., Wan, A., Leconte, M., de Vallavieille-Pope, G., and Enjalbert, J.
2010. Puccinia striiformis f. sp. tritici presents high diversity and recombination in the
over-summering zone of Gansu, China. Mycologia 102:44-53.
45. Duveiller, E., Singh, R. P., and Nicol, J. M. 2007. The challenges of maintaining wheat
productivity: pests, diseases, and potential epidemics. Euphytica 157:417-430.
46. Eddy, R. 2009. Logistic regression models to predict stripe rust infections on heat and
yield response to foliar fungicide application on wheat in Kansas. Master thesis,
Department of Plant Pathology, Kansas State University, Manhattan, Kansas (Online
http://krex.k-state.edu/dspace/bitstream/2097/2298/5/RachelEddy2009.pdf accessed on
6-9-2011)
47. Enjalbert, J., Duan, X., Leconte, M., Hovmοller, M. S., and de Vallavieille-Pope, C.
2005. Genetic evidence of local adaptation of wheat yellow rust (Puccinia striiformis f.
sp. tritici) within France. Mol. Ecol. 14:2065-2073.
48. Eriksson, J. 1894. Über die Spezialisierung des Parasitsimus bei den Getreiderostpilzen.
Ber. Dtsch. Bot. Ges. 12:292-331.
49. Eriksson, J., and Henning, E. 1896. Die Getreideroste. Norstedt & Söner, Stockholm.

41
50. Fang, C. T. 1944. Physiologic specialization of Puccinia glumarum Erikss. and Henn. in
China. Phytopathology 34:1020-1024.
51. Flor, H. H. 1971. Current status of the gene-for-gene concept. Annu. Rev. Phytopathol.
9:275-296.
52. Gassner, G., and Straib, W. 1928. Untersuchungen Über Die Infektions- bedingungen
Von Puccinia glumarum und Puccinia graminis. Arb. Biol. Reichsanst. Land- Forst-
wirtsch Berlin-Dahlem. 16:609-629.
53. Georgievskaja, N. A. 1966. Quelques lois sur Ie developpement de la rouille Jaune du
ble. Tr. Vses. Nauchno Issled. Inst. Zabtsh. Rost. Leningrad 26:55-63.
54. Hassebrauk, K. 1965. Nomenklatur, geographische Verbreitung und Wirtsbereich
desGelbrostes, Puccinia striiformis West. Mitt. Biol. Bundesanst. Land= Forstwirtsch.,
Berlin-Dahlem 116, 1-75.
55. Hecke, L. 1911. Beobachtungen der uberwinterungsart von Pflanzenparasieten. Naturw.
Z. Forst- Landwirtsch. 9:44-53.
56. Hendrix, J. W., Burleigh, J. R., and Tu, J. C. 1965. Oversummering of stripe rust at high
elevations in the Pacific Northwest-1963. Plant Dis. Rep. 49:275-278.
57. Holmes, R., and Dennis, J. 1985. Accessory hosts of wheat stripe rust in Victoria,
Australia. Trans. Br. Mycol. Soc. 85:159-160.
58. Hovmoeller, M. S, Yahyaoui, A. H., Milus, E. A., and Justesen, A. F. 2008. Rapid global
spread of two aggressive strains of a wheat rust fungus. Mol. Ecol. 17:3818-3826.
59. Hovmoller, M. S., Justesen, A. F., and Brown, J. K. M. 2002. Clonality and long-distance
migration of Puccinia striiformis f. sp. tritici in north-west Europe. Plant Pathol. 51:24-
32.

42
60. Hovmøller, M. S., Sørensen, C. K., Walter, S., and Justesen, A. F. 2011. Diversity of
Puccinia striiformis on Cereals and Grasses. Annu. Rev. Phytopathol. 2011. 49:197-217
61. Humphrey, H. B., Hungerford, C. W., and Johnson, A. G. 1924. Stripe rust (Puccinia
glumarum) of cereals and grasses in the United States. J. Agric. Res. 29: 209-227.
62. Hungerford, C. W. 1923. Studies on the life history of stripe rust, Puccinia glumarum
Schm. Erikss. and Henn. J. Agr. Res. 24:607-620.
63. Hungerford, C. W., and Owens, C. E. 1923. Specialized varieties of Puccinia glumarum
and hosts for variety tritici. J. Agric. Res. 25:363-401.
64. Hylander, N., Jørstad, I., and Nannfeldt, J. A. 1953. Enumeratio uredionearum
Scandinavicarum. Opera Bot. 1:1-102.
65. ICARDA, 2011. The International Wheat Stripe Rust Symposium. Strategies to reduce
the emerging wheat stripe rust disease. Synthesis of a dialog between policy makers and
scientists from 31 countries at: International Wheat Stripe Rust Symposium, Aleppo,
Syria, April 2011.
66. Jin, Y., Szabo, L., and Carson, M. 2010. Century-old mystery of Puccinia striiformis life
history solved with the identification of Berberis spp. as an alternate host.
Phytopathology 100:432-435.
67. Johnson, R., Stubbs, R. W., Fuchs, E., and Chamberlain, N. H. 1972. Nomenclature for
physiologic races of Puccinia striiformis infecting wheat. Trans. Br. Mycol. Soc. 58:475-
480.
68. Justesen, A. F., Ridout, C. J., and Hovmøller, M. S. 2002. The recent history of Puccinia
striiformis f. sp. tritici in Denmark as revealed by disease incidence and AFLP markers.
Plant Pathol. 51:13-23.

43
69. Kajiwara, T., Ueda, I., and Iwata, Y. 1964. Untersuchungen über die Physiologische
Spezialisierung des Weizengelbrostes Puccinia striiformis West. f. sp. tritici Erikss. et
Henn. in Japan. J. Phytopathol. 51:19-28.
70. Kang, Z., Zhao, J., Han, D., Zhang, H., Wang, X., Wang, C., Han, Q., Guo, J., and
Huang, L. 2010. Status of wheat rust research and control in China. BGRI 2010
Technical Workshop, May 30-31 2010, St Petersburg, Russia. (Online:
http://www.globalrust.org/db/attachments/bgriiwc/24/2/07-kang-ca-A4-embargo.pdf
accessed on December 14, 2010).
71. Kirk, P. M., Cannon, P. .F., Minter, D. W., and Stalpers, J. A. (Eds.). 2008. Dictionary of
the Fungi (10th
Ed.). CABI Europe-UK. Pages 576-579.
72. Kolmer, J. A., Chen, X. M., and Jin, Y. 2009. Diseases which challenge global wheat
production-The Cereal Rusts. Pages 89-124. In: Wheat: Science and Trade. B. F. Carver,
(Eds.). Wiley-Blackwell, Ames, USA.
73. Krause, R. A., and Massie, L. B. 1975. Predictive systems: Modern approaches to disease
control. Annu. Rev. Phytopathol. 13:31-47.
74. Li, Z. Q., and Zeng, S. M. 2000. Wheat rusts in China. China Agricultural Press, Beijing.
75. Line, R. F. 2002. Stripe rust of wheat and barley in North America: a retrospective
historical review. Annu. Rev. Phytopathol. 40:75-118.
76. Line, R. F., and Chen, X. M. 1995. Successes in breeding for and managing durable
resistance to wheat rusts. Plant Dis. 79:1254–1255.
77. Line, R. F., and Qayoum, A. 1992. Virulence, aggressiveness, evolution, and distribution
of races of Puccinia striiformis (the cause of stripe rust of wheat) in North America,

44
1968-87. Technical Bulletin Number 1788. United States Department of Agriculture,
Agricultural Research Service.
78. Little, L. J. 1981. Field biology of plant resistance. Ames: Iowa State Univ. Press. P 103.
79. Liu M., and Hambleton, S. 2010. Taxonomic study of stripe rust, Puccinia striiformis
sensu lato, based on molecular and morphological evidence. Fungal Bio. 114:881-899
80. Liu, T. G., Peng, Y. L., Chen, W. Q., and Zhang, Z. Y. 2010. First Detection of Virulence
in Puccinia striiformis f. sp. tritici in China to Resistance Genes Yr24 (=Yr26) Present in
Wheat Cultivar Chuanmai 42. Plant Dis. 94:1193
81. Maddison, A. C., and Manners, J. G. 1972. Sunlight and viability of cereal rust
uredospores. Trans. Br. Mycol. Soc. 59:429-443.
82. Maddison, A. C., and Manners, J. G. 1973. Lethal effects of artificial ultraviolet radiation
on cereal rust uredospores. Trans. Br. Mycol. Soc. 60:471-494.
83. Manners, J. G. 1950. Studies on the physiologic specialization of yellow rust (Puccinia
glumarum (Schm.) Erikss. & Henn.) in great Britain. Ann. Appl. Biol. 37:187-214.
84. Manners, J. G. 1960. Puccinia striiformis Westend. var. dactylidis var. nov. Trans. Br.
Mycol. Soc. 43:65-68.
85. Markell, S. G., and Milus, E. A. 2008. Emergence of a novel population of Puccinia
striiformis f. sp. tritici in eastern United States. Phytopathology 98:632-639.
86. Marryat, D. C. E. 1907. Note on the infection and histology of two wheats immune to
attacks of Puccinia glumarum, yellow rust. J. Agric. Sci. 2:129-138.
87. Mboup, M., Leconte, M., Gautier, A., Wan, A. M., Chen, W., de Vallavieille-Pope, C.,
and Enjalbert, J. 2009. Evidence of genetic recombination in wheat yellow rust
populations of a Chinese oversummering area. Fungal Genet. Biol. 46:299-307.

45
88. McDonald, B. A., and Linde, C. 2002. Pathogen population genetics, evolutionary
potential, and durable resistance. Annu. Rev. Phytopathol. 40:349-379.
89. McIntosh, R. A. 1998. Breeding wheat for resistance to biotic stresses. Euphytica 100:19-
34.
90. McIntosh, R. A., and Brown, G. N. 1997. Anticipatory breeding for resistance to rust
diseases in wheat. Annu. Rev. Phytopathol. 35:311-326.
91. Mehta, K. C. 1933. Rusts of wheat and barley in India. Indian J. Agric. Sci. 3:939-962.
92. Mehrotra, R. S., and Aggarwal, A. 2003. Plant Pathology, (2nd
Ed). Tata McGraw-Hill
Publishing Company Limited. New Delhi.
93. Mendgen, K. 1981. Growth of Verticillium lecani in pustules of stripe rust (Puccinia
striiformis). J. Phytopathol. 102:301-309.
94. Mengden, K. 1983. Development and physiology of teliospores. Pages 375-398. In: Vol.
I. The Cereal Rusts. W. R. Bushnell and A. P. Roelfs (Eds.). Academic Press, New York.
546 pp.
95. Metha, K. C. 1933. Rusts of wheat and barley in India. A study of their annual
recurrence, life histories, and physiologic forms. Indian J. Agr. Sci. 3:939-962.
96. Michelmore, R. W., and Hulbert, S. H. 1987. Molecular markers for genetic analysis of
phytopathogenic fungi. Annu. Rev. Phytopathol. 25:383-404.
97. Milus, E. A., and Seyran, E. 2006. Aggressiveness of Puccinia striiformis f. sp. tritici
isolates in the South-Central United States. Plant Dis. 90:847-852.
98. Moldenhauer, J., Moerschbacher, B. M., and Van der Westhuizen, A. J. 2006.
Histological investigation of stripe rust (Puccinia striiformis f. sp. tritici) development in
resistant and susceptible wheat cultivars. Plant Pathol. 55:469-474.

46
99. Murray, G. M., Ellison, P. J., Watson, A., and Cullis, B. R. 1994. The relationship
between wheat yield and stripe rust as affected by length of epidemic and temperature at
the grain development stage of crop growth. Plant Pathol. 43:397-405.
100. Nagarajan, S., and Singh, D. V. 1990. Long-distance dispersion of rust pathogens. Annu.
Rev. Phytopathol. 28:139-153.
101. Naoumova, N. A. M. 1937. Natural fluctuations of temperature and the duration of the
incubation period of Puccinia glumarum f. tritici. Zaschita Rasteniy 12:51-66.
102. Newton, M. and Johnson, T. 1936. Stripe rust, Puccinia glumarum, in Canada. Can. J.
Res. 14:89-108.
103. Newton, M., Johnson, T., and Brown, A. M. 1933. Stripe rust in Canada. Phytopathology
23:27-28.
104. Niks, R. E. 1989. Morphology of infection structures of Puccinia striiformis var.
dactylidis. Neth. J. Plant Path. 95:171-175.
105. Niu, Y. C., Li, Z. Q., and Shang, H. S. 1991. Puccinia striiformis West. f. sp. leymi and f.
sp. elymi, two new formae speciales. Acta Univ. Agric. Boreali Occident. 19:58-62.
106. Nuttonson, M.Y. 1955. Wheat-climatic relationships and the use of phenology in
ascertaining the thermal and photothermal requirements of wheat. Washington, DC,
American institute of crop ecology. P. 388.
107. Papastamati, K., and van den Bosch, F. 2007. The sensitivity of the epidemic growth rate
to weather variables, with an application to yellow rust on wheat. Phytopathology
97:202-210.
47
108. Park, R. F. 1990. The role of temperature and rainfall in the epidemiology of Puccinia
striiformis f. sp. tritici in the summer rainfall area of eastern Australia. Plant Pathol.
39:416-423.
109. Park, R., Fetch, T., Hodson, D., Jin, Y., Nazari, K., Prashar, M., and Pretorius, Z. 2011.
International surveillance of wheat rust pathogens: progress and challenges. Euphytica
179:109-119.
110. Percival, J. 1921. The wheat plant. A monograph. E.P. Dutton & Company. New York,
NY, USA P 463.
111. Pole, I. B. E. 1907. The cereal rusts. I. The development of their uredo mycelia. Ann.
Bot. 21:441-66.
112. Purdy, L. H., and Allan, R. E. 1966. A stripe rust race pathogenic to ‘Suwon 92’ wheat.
Plant Dis. Rep. 50:205-207.
113. Qayoum, A., and Line, R. F. 1985. High-temperature, adult-plant resistance to stripe rust
of wheat. Phytopathology 75:1121-1125.
114. Rahmatov, M., Eshonova, Z., Ibragimov, A., and Otambekova, M. 2009. Monitoring and
evaluation of yellow rust for breeding resistant varieties of wheat in Tajikistan. In:
Abstracts of the 4th regional yellow rust conference for Central and West Asia and North
Africa. 10-12 October 2009, Antalya, Turkey. ICARDA, Aleppo, Syria, P 51
115. Rapilly, F. 1979. Yellow rust epidemiology. Annu. Rev. Phytopathol.17:59-73.
116. Roelfs, A. P., and Martell, L. B. 1984. Uredospore dispersal from a point source within a
wheat canopy. Phytopathology 74:1262-1267.
117. Roelfs, A.P., Singh, R.P. and Saari, E.E. 1992. Rust diseases of wheat: concepts and
methods of disease management. Mexico, DF, CIMMYT.

48
118. Samborski, D. J., and Dyck, P. L. 1976. Inheritance of virulence in Puccinia recondita on
six backcross lines of wheat with single genes for resistance to leaf rust. Can. J. Bot.
54:1666-1671.
119. Sanford, G. B., and Broadfoot, W. C. 1929. Stripe rust in Alberta. Sci. Agr. 9:337-345.
120. Saunders, D. A., and Hettel, G. P. 1994. (Eds.). Wheat in heat stressed environments:
irrigated, dry areas and rice-wheat farming systems. Mexico, DF, CIMMYT.
121. Shan, W. X., Chen, S. Y., Kang, Z. S., Wu L. R., and Li., Z. Q. 1998. Genetic diversity in
Puccinia striiformis Westend. f. sp. tritici revealed by pathogen genome-specific
repetitive sequence. Can. J. Bot. 76:587-595.
122. Shaner, G., 1987. Wheat Diseases. In: E.G. Heyne (Ed.), Wheat and Wheat Improvement
2nd Ed., pp. 508-624. Amer. Soc. Agron., Madison, Wisc., USA.
123. Shaner, G., and Powelson R. L. 1971. Epidemiology of stripe rust of wheat, 1961-1968.
OR Agric. Exp. Stn. Tech. Bull. 117.
124. Sharma-Poudyal, D., and Chen, X. M. 2011. Models for predicting potential yield loss of
wheat caused by stripe rust in the US Pacific Northwest. Phytopathology 101:544-554.
125. Sharp, E. L. 1965. Prepenetration and postpenetration environment and development of
Puccinia striiformis on wheat. Phytopathology 55:198-203.
126. Singh, R. P., Huerta-Espino, J., Rajaram, S., Barna, B., and Kiraly, Z. 2000. Achieving
near-immunity to leaf and stripe rusts in wheat by combining slow rusting resistance
genes. In Proceedings of the 10th Cereal Rusts and Powdery Mildews Conference,
Budapest, Hungary, 28 August-1 September 2000. 35:133-139.
127. Singh, R. P., William, H. M., Huerta-Espino, J., and Rosewarne, G. 2004. Wheat rust in
Asia: meeting the challenges with old and new technologies. In: New Directions for a
49
Diverse Planet: Proceedings of the 4th
International Crop Science Congress, Brisbane,
Australia, 26 September-1 October 2004. 2004.ISBN 1 920842 20 9.
URL:http://www.pngg.org/pp590_790/Singh-4thIntCSCong2004.pdf (accessed Dec 7
2010).
128. Steele, K. A., Humphreys, E., Wellings, C. R., and Dickinson, M. J. 2001. Support for a
stepwise mutation model for pathogen evolution in Australasian Puccinia striiformis f.
sp. tritici by use of molecular markers. Plant Pathol. 50:174-180.
129. Straib, W. 1935. Auftreten und Verbreitung biologischer Rassen des Gelbrostes
(Puccinia glumarum (Schm.) Erikss. et Henn.) im Jahre 1934. Arb. Biol. Reichsanst.
Land= Forstwirtsch., Berlin-Dahlem 21:455-466.
130. Straib, W. 1937. Untersuchungen über das Vorkommen physiologischer Rassen des
Gelbrostes (Puccinia glumarum) in den Jahren 1935-1936 und über die Agressivität
einiger neuer Formen auf Getreide und Gräsern. Arb. Biol. Reichsanst. Land=
Forstwirtsch., Berlin-Dahlem 22:91-119.
131. Straib, W. 1938. Untersuchungen zur Verlaul der Herbstinfektion und uberwinterung des
Gelbrostes auf Weizen und Gerste. J. Phytopathol. 11:331-359.
132. Straib, W. 1940. Uber die Interferenczwirkung von Luftfeuchtigkeit und Temperatur auf
das Zusstandekommen der Infektion mit Uredosporen verschiedener Getreiderostarten.
Z. Pflanzekrankh. 50:529-552.
133. Stubbs, R. W. 1967. Influence of light intensity on the reactions of wheat and barley
seedlings to Puccinia striiformis. Phytopathology 57:615-619.
134. Stubbs, R. W. 1985. Stripe rust. In: The cereal rusts, Vol. II. (pp. 61-101). A.P. Roelfs,
and W.R. Bushnell (Eds.). Orlando, FL: Academic Press.

50
135. Tollenaar, H. 1967. A comparison of Puccinia striiformis f. sp. poae on bluegrass with P.
striiformis f. sp. tritici and f. sp. dactylidis. Phytopathology 57:418-420.
136. Tollenaar, H., and Houston, B. R. 1967. A study on the epidemiology of stripe rust,
Puccinia striiformis West., in California. Can. J. Bot. 45: 291-307.
137. Tu, J. C. 1967. The summer biology of Puccinia striiformis West. In Southeastern
Washington. PhD thesis, Department of Plant Pathology, WSU, Pullman, WA.
138. Wan, A. M., Chen, X. M., and He, Z. H. 2007. Wheat stripe rust in China. Aust. J. Agri.
Res. 58:605-619.
139. Wang, C.F., Huang, L.L., Buchenauer, H., Han, Q. M., Zhang, H. C., and Kang, Z. S.
2007. Histochemical studies on the accumulation of reactive oxygen species (O2- and
H2O2) in the incompatible and compatible interaction of wheat-Puccinia striiformis f. sp.
tritici. Physiol. and Mol. Plant Pathol. 71:230-239.
140. Wang, H., Yang, X. B., and Ma, Z. 2010. Long-Distance Spore Transport of Wheat
Stripe Rust Pathogen from Sichuan, Yunnan, and Guizhou in Southwestern China. Plant
Dis. 94:873-880.
141. Wang, M. N., Wan, A., Chen, X. M., and Evans, K. C. 2011. Barberry is more important
as an alternate host for stem rust than for stripe rust in the U.S. Pacific Northwest. Poster
presented as a part of 2011 BGRI Technical Workshop, June 13-16 in St. Paul, MN.
142. Webster J., and Weber, R. W. S. 2007. Introduction to Fungi (3rd
Ed). Cambridge
University Press, U. K. Pages 609-612.
143. Wellings, C. R. 2007. Puccinia striiformis in Australia: a review of the incursion,
evolution, and adaptation of stripe rust in the period 1979-2006. Aust. J. Agri. Res.
58:567-575.

51
144. Wellings, C. R. 2011. Global status of stripe rust: a review of historical and current
threats. Euphytica 179:129-141.
145. Wellings, C. R., Burdon, J. J., McIntosh, R. A., Wallwork, H., Raman, H., and Murray,
G. M. 2000a. A new variant of Puccinia striiformis causing stripe rust on barley and wild
Hordeum species in Australia. Plant Pathol. 49:803-803.
146. Wellings, C. R., Read, B., and Moody, D. 2000b. Stripe rust affecting barley in
Australia-current and potential threats. In: Proc 8th Int. Barley Genet. Symp., Adelaide,
Australia, September 2000, Vol III, Pages 197-199.
147. Wellings, C. R., Singh, R. P., Yahyauoi, A., Nazari, K., and McIntosh, R. A. 2009. The
development and application of near-isogenic lines for monitoring cereal rust pathogens.
In: McIntosh R (Ed.) Proc Oral Papers and Posters, 2009 Technical Workshop, BGRI,
Cd. Obregón, Sonora, Mexico, Pages 77-87.
148. Wiese, M. S. 1987. Compendium of wheat diseases, 2nd ed. American Phytopathological
Society, St Paul, Minnesota.
149. Wright, R. G., and Lennard, J. H. 1978. Mitosis in Puccinia striiformis light microscopy.
Trans. Br. Mycol. Soc. 70:91-98.
150. Zadoks, J. C. 1961. Yellow rust on wheat, studies in epidemiology and physiologic
specialization. Neth. J. Plant Pathol. 67:69-256.
151. Zadoks, J. C. 1965. Epidemiology of wheat rust in Europe. FAO Plant Prot. Bull. 13:97-
108.
152. Zheng, W. M., Liu, F., Kang, Z. S., Chen, S. Y,. Li, Z. Q., and Wu, L. R. 2001. AFLP
fingerprinting of Chinese epidemic strains of Puccinia striiformis f. sp. tritici. Progr. Nat.
Sci. 11:587-593.

52
153. Ziyaev, Z. M., Sharma, R. C., Nazari, K., Morgounov, A. I. Amanov, A. A. Ziyadullaev,
Z. F. Khalikulov, Z. I., and Alikulov, S. M. 2011. Improving wheat stripe rust resistance
in Central Asia and the Caucasus. Euphytica 179:197-207.

53
Contributions of the Candidate and his collaborators
CHAPTER TWO: Models for Predicting Potential Yield Loss of Wheat Caused by
Stripe Rust in the US Pacific Northwest.
Dipak Sharma-Poudyal collected and conducted all data, analyzed the data, and
prepared manuscript. Dr. Xianming Chen conceived and guided the project, suggested the
data analysis techniques, and contributed on preparation and submission of the manuscript.

54
CHAPTER TWO
Models for Predicting Potential Yield Loss of Wheat Caused by Stripe Rust
in the US Pacific Northwest
D. Sharma-Poudyal and X. M. Chen
First and second authors: Department of Plant Pathology, Washington State University,
Pullman, WA 99164-6430, USA; and second author: USDA-ARS, Wheat Genetics,
Quality, Physiology, and Disease Research Unit, Pullman, WA 99164-6430, USA.
Accepted for publication 16 December 2010.
Corresponding author: X. M. Chen; E-mail address: [email protected]
ABSTRACT
Sharma-Poudyal, D., and Chen, X. M. 2011. Models for predicting potential yield loss of
wheat caused by stripe rust in the US Pacific Northwest. Phytopathology 101:544-554.
Climatic variation in the US Pacific Northwest (PNW) affects epidemics of wheat stripe
rust, caused by Puccinia striiformis f. sp. tritici. Previous models estimated disease severity
at the flowering stage only, which may not predict the actual yield loss. To identify weather
factors correlated to stripe rust epidemics and develop models for predicting potential yield
loss, correlation and regression analyses were conducted using weather parameters and
historical yield loss data from 1993 to 2007 for winter wheat and 1995 to 2007 for spring
wheat. Among 1,376 weather variables, 54 were correlated to yield loss of winter wheat and

55
18 to yield loss of spring wheat. Among seasons, winter temperature variables were more
highly correlated to wheat yield loss than other seasons. The sum of daily temperatures and
accumulated negative degree days in February were more highly correlated to winter wheat
yield loss than other monthly winter variables. In addition, the number of winter rainfall days
was significantly correlated with yield loss. Six yield loss models were selected for winter
and spring wheat based on their correlation coefficients, time of weather data availability
during the crop season, and performance in validation tests. Compared to previous models,
the new system using a series of models has advantages that should make it more suitable for
forecasting and managing stripe rust in the major wheat growing areas in the US PNW, where
weather conditions are favorable to stripe rust.
Additional keywords: Triticum aestivum, yellow rust
INTRODUCTION
Stripe rust of wheat (Triticum aestivum L.) is caused by Puccinia striiformis Westend. f.
sp. tritici Eriks. The disease can cause severe yield loss in many wheat growing areas of the
world including the United States (3-5,7,23,32). Stripe rust epidemics are more frequent in
the western US, especially the Pacific Northwest (PNW), which includes Washington (WA),
Oregon (OR), and Idaho (ID).
Yield loss caused by stripe rust depends on several factors including the degree of
cultivar susceptibility, infection time, rate of disease development, and duration of disease (3).
These crop and disease factors are influenced by environmental factors, among which
temperature and moisture are the most important in determining disease severity and yield
56
loss (4,17,28,35). Because temperature and moisture conditions vary significantly from year
to year in most wheat producing regions, they are the major limiting factors for development
of stripe rust epidemics and therefore, have been used to develop descriptive and forecasting
models for the disease.
Forecasting models have been developed and used in management of many plant diseases
(2,12-14,18,19,27,29,30,34,36) including stripe rust (10,11,23). Because temperature has the
most profound effect on the P. striiformis f. sp. tritici life cycle, influencing pathogen
survival, infection, latent period, and sporulation, it has been used to develop forecasting
models for stripe rust (9-11,23). Coakley (8) initially studied the relationship between
climatic variables and stripe rust epidemics in Pendleton, Oregon and found epidemics were
favored by winter temperatures that are higher than normal (the mean winter temperature
from 1961 to 1975). In a subsequent study, Coakley and Line (9) quantified the relationship
between temperature and stripe rust epidemics on winter wheat using disease data from
Pullman, WA from 1963 to 1979. Negative and positive degree days were used to determine
the effect of cumulative temperatures on disease development using 7oC as a base
temperature, which was selected because it was optimal for urediniospore germination and
infection (31). Coakley and Line (9) found that the mean temperature for January was
positively correlated with stripe rust intensity recorded on susceptible cultivars. However, the
cumulative negative (December 1 to January 31) and positive degree days (April 1 to June 30)
had higher negative correlations to disease intensity than January mean temperature.
Therefore, simple linear regression models for predicting stripe rust severity were developed
using the positive and negative degree days as descriptors. Later, Coakley et al. (10) extended
their stripe rust forecasting models developed for Pullman to other locations in the PNW

57
using standardized negative degree days accumulated during December and January.
Additional predictive models were developed by Coakley et al. (11) using disease index,
temperature, and other meteorological factors such as the amount and frequency of
precipitation from 1968 to 1986 at Pullman, WA using multiple regression analysis.
However, the simpler models based on negative and positive degree days have been widely
used in forecasting for stripe rust management in the PNW (3,23).
Previous models generally predict disease intensity in a 0-9 scale at the flowering stage of
wheat growth (9-11). Though these models have been used successfully to predict stripe rust
in most years, they do not accurately predict epidemic severity in years when the weather
conditions do not follow the normal pattern. It is possible that weather pattern in the PNW
may have changed after the period used to develop the previous forecasting models, which
might make the models less suitable for stripe rust forecasting in recent years. The major
limitation of these models using negative and positive degree days is the lumping of the
temperature during December and January, which usually are the coldest months. If
temperatures increase dramatically in this period, they negate the effect of the colder period.
For example, the mean monthly temperature in December 2005 was significantly lower than
normal and that of January 2006 was much higher than normal. Using these models, stripe
rust in 2006 was predicted to be as severe as in 2005, the most severe year since the early
1980s (4); however, the actual damage in 2006 was much less than in 2005 (6). Furthermore,
the greatest stripe rust intensity index (9 in the 0-9 scale) or severity (>95% of the foliage
infected) at the flowering stage, which was used in previous models (10), occurred in
experimental fields at the Pullman location in 2004, 2005, and 2006, but yield loss for
susceptible winter wheat varied considerably with 40% in 2004, 74% in 2005, and 30% in

58
2006 (Chen, unpublished data). The difference in yield loss was caused by variation in
epidemic duration. The previous models do not consider duration and thus, cannot give a
precise estimate of epidemic severity or yield loss when disease reaches the highest severity
level by the flowering stage. This highlights the need for prediction models that provide
information on potential yield loss rather than disease severity. Because previous models
require expert help to translate predicted disease index to yield loss, growers have relied on
experts to do forecasting and interpretation. Prediction models requiring simple calculations
may be directly used by growers, extension agents, and farm consultants. Therefore, the
major objective of this study was to identify weather variables correlated to yield loss and to
develop a series of models for early prediction of potential yield loss caused by stripe rust in
the PNW.
MATERIALS AND METHODS
Meteorological data. Data for daily minimum and maximum temperature and
precipitation for Pullman, WA from 1975 to 2007 were obtained from the National Oceanic
and Atmospheric Administration (NOAA) National Data Centers (NNDC) Climatic Data
Online service (http://cdo.ncdc.noaa.gov/CDO/dataproduct). The Pullman meteorological
station is at 46o 45′ N latitude, 117
o 12′ W longitude, and 775 m elevation. A year was
divided into four seasons based on P. striiformis f. sp. tritici biology and wheat crop seasons
applicable to Pullman: winter (November 1 to February 28), spring (March 1 to May 30),
summer (June 1 to August 31), and fall (September 1 to October 31). The relatively long
winter season was used to insure that all cold periods were included. Daily mean
temperatures were calculated based on the daily maximum and minimum temperatures. If the

59
maximum, minimum, and average temperatures of one day were missing, they were
calculated by averaging the previous and following day temperatures. Any year with two or
more continuous days of missing daily temperature was excluded from analysis. The
minimum, maximum, and mean temperatures for each period were calculated based on daily
minimum, maximum, and mean temperatures in that period, respectively. In addition,
minimum and maximum moving average temperatures (MAT) were calculated based on daily
minimum and maximum mean temperatures for 10-, 20-, 30-, and 60-day periods of 1, 2, 3,
and 4 months in each season wherever applicable. The sum of accumulated positive degree
days (APDD) and accumulated negative degree days (ANDD) were calculated as previously
described (10). Instead of the sum of degree days, the sum of temperatures (ST) was
calculated due to ease of computation. The amounts of rainfall and snowfall, rainfall days,
snow depth, and snow ground cover days (>2.54 cm) were also used. Thus, a total of 1,376
weather variables were tested in this study.
Disease data. Historical data for stripe rust yield loss for winter and spring wheat were
taken from fungicide and cultivar yield loss studies conducted in Pullman, WA over the years
in our program, some of which were published in Fungicide and Nematicide Tests Reports
and Plant Disease Management Reports
(http://www.plantmanagementnetwork.org/pub/trial/pdmr/). In the fungicide tests, standard
susceptible wheat genotypes ‘PS 279’ and ‘Lemhi’ were used for winter wheat and spring
wheat, respectively. A completely randomized block design was used with four replications
for each non-sprayed check and fungicide-sprayed treatments. Percentage yield loss caused
by stripe rust was obtained using following formula: Y(%) = (Y1-Y2)/Y1∙100%, where Y1 was
the mean grain yield of a fungicide treatment providing the complete or best control of stripe

60
rust and Y2 was the mean grain yield of the non-sprayed check. In cultivar tests, PS 279 or
Lemhi was tested together with 23 winter or 15 spring wheat cultivars grown in a randomized
split-block design with four replications for sprayed and non-sprayed treatments of each
cultivar. A fungicide, the most popularly used in any particular period (e.g. Tilt at 4 fl oz/A
used from 2000-2007), was sprayed before stripe rust reached 5% severity and when plants
were usually at boot to heading stages. Percentage of yield loss was calculated using the
above formula with Y1 as the mean grain yield of the sprayed treatment and Y2 as the non-
sprayed PS 279 or Lemhi. The tests were conducted under natural infection, without artificial
inoculation and fields were managed using the standard cultural practices of commercial
fields in the region. Stripe rust severity for each plot was recorded one day before or on the
same day of fungicide application and two to four times after application. Stripe rust yield
loss data confounded by other diseases (in most cases, leaf rust) >5% were excluded from
analysis. Yield loss data were available for winter and spring wheat from 1993 to 2007 and
1995 to 2007, respectively.
Data analyses. Yield loss percentage of winter or spring wheat due to stripe rust (Y),
and temperature- and precipitation-based variables (X) included in this study. Pearson's
correlation coefficient was calculated between yield loss and temperature-based variables
(minimum, maximum, mean, minimum MAT, maximum MAT, ANDD, APDD, and ST) as
well as precipitation [total rainfall, total rainfall days (RFD), snow depth (SD), and snow
ground cover days (SCD)] for different periods. Separate but similar analyses were
performed to develop yield loss models for winter and spring wheat.
Simple linear regression models were developed for each variable that was significantly
correlated with yield loss. Models for different months within a season were selected based
61
on the coefficient of determination (R2) and prediction sum of squares (PRESS) (22).
Stepwise regression was used to select the explanatory variables for different winter periods:
1, 2, 3, and 4 months. Selected independent variables were subjected again to stepwise
regression to select descriptors for the entire winter season. Stepwise regression identified
variables that explained the maximum variation in yield loss. Explanatory variables identified
by stepwise regression were subjected to the best subset regression algorithm for model
selection (22). Mallows′ Cp, which is an indication of goodness of fit of the regression
equations with different numbers of independent variables, was used to select models. In
addition, the adjusted coefficient of multiple determination (R2adj), which accounts for the
number of independent variables, was used to identify the total variation in a response
variable associated with the multiple descriptors (12,22). A multicolinearity test was
performed as indicated by variance inflation factors (VIFs) (15,22,26). After stepwise
regression analysis, all explanatory variables from each season were used for yearly model
development. Descriptors for yearly models were identified by stepwise regression analysis.
Correlated independent variables with a small regression sum of square were excluded from
further model development in multiple regressions. The best subset regression algorithm was
used to identify different models in the seasonal and yearly multiple regressions. Principal
component analysis was also used to select explanatory variables with the most information
(1,20,21). Principal component analysis addresses the problem of multicolinearity
transforming the variables into a set of orthogonal or uncorrelated variables (15,16).
Model validation. Model validation was done based on the PRESS value, which is
equivalent to the leave-one out cross validation method (25,33). The best fitting models
should have the lowest PRESS value. Models with small PRESS values fit well because these

62
models have small prediction errors (15,22,26). Additionally, prediction accuracy percentage
for selected models was calculated using contingency tables (11). In addition to data used for
model development, yield loss data from 2008 and 2009 of winter and spring wheat, Pullman,
WA were included to compute prediction accuracy percentage, Chi-squared test and predicted
R2. Because stripe rust caused yield loss ranging from 3% to 86% during the period of 1975-
2007 on susceptible cultivars in the PNW, yield loss of 20% or less was generally considered
light, more than 20% to 50% moderate, and more than 50% severe. The probability of Chi-
squared test was used to compare the observed and expected frequency of yield loss
categories for different selected models. Furthermore, predicted R2 values were determined to
find out the predictive ability of the selected models (11).
RESULTS
Winter temperature variables correlated with winter wheat yield loss. None of the
November based variables were significantly correlated with yield loss. Out of the seven
significantly correlated December variables, accumulated negative degree days based on daily
maximum [DecANDD(Max), X2] had the highest correlation coefficient (r = - 0.72, P =
0.02). In January, only one variable, accumulated positive degree days based on 10 days
MAT using daily maximum temperature [JanAPDD10D-MAT(Max), X9], had a significant
correlation coefficient (r = 0.66, P = 0.03) with yield loss (Table 1). Among the monthly
winter temperature variables, February had relatively higher correlation coefficient than the
other months. February sum of temperatures based on daily maximum temperature
[(FebST(Max), X18] had the highest correlation coefficient, (r = 0.94, P = 0.0001).

63
Among significantly correlated bi-monthly variables, January to February 20 days
maximum MAT based on daily maximum temperature [(JanFeb20D-MaxMAT(Max), X27]
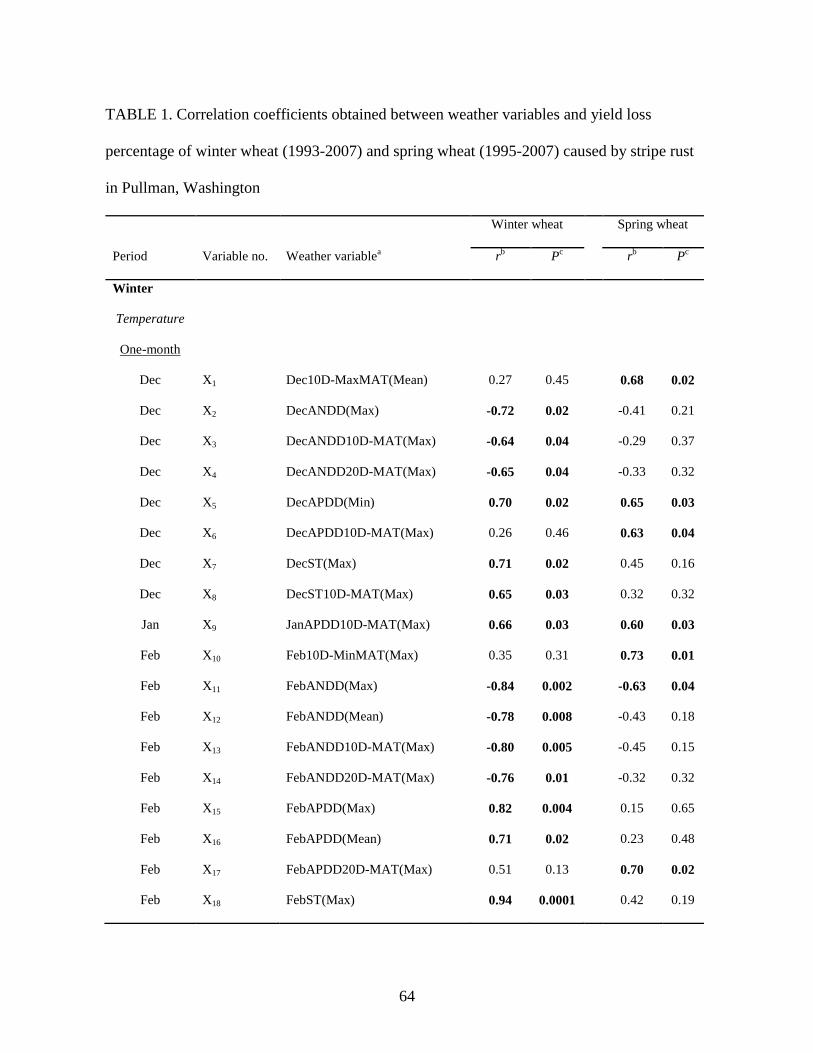
64
TABLE 1. Correlation coefficients obtained between weather variables and yield loss
percentage of winter wheat (1993-2007) and spring wheat (1995-2007) caused by stripe rust
in Pullman, Washington
Winter wheat Spring wheat
Period Variable no. Weather variablea r
b P
c r
b P
c
Winter
Temperature
One-month
Dec X1 Dec10D-MaxMAT(Mean) 0.27 0.45 0.68 0.02
Dec X2 DecANDD(Max) -0.72 0.02 -0.41 0.21
Dec X3 DecANDD10D-MAT(Max) -0.64 0.04 -0.29 0.37
Dec X4 DecANDD20D-MAT(Max) -0.65 0.04 -0.33 0.32
Dec X5 DecAPDD(Min) 0.70 0.02 0.65 0.03
Dec X6 DecAPDD10D-MAT(Max) 0.26 0.46 0.63 0.04
Dec X7 DecST(Max) 0.71 0.02 0.45 0.16
Dec X8 DecST10D-MAT(Max) 0.65 0.03 0.32 0.32
Jan X9 JanAPDD10D-MAT(Max) 0.66 0.03 0.60 0.03
Feb X10 Feb10D-MinMAT(Max) 0.35 0.31 0.73 0.01
Feb X11 FebANDD(Max) -0.84 0.002 -0.63 0.04
Feb X12 FebANDD(Mean) -0.78 0.008 -0.43 0.18
Feb X13 FebANDD10D-MAT(Max) -0.80 0.005 -0.45 0.15
Feb X14 FebANDD20D-MAT(Max) -0.76 0.01 -0.32 0.32
Feb X15 FebAPDD(Max) 0.82 0.004 0.15 0.65
Feb X16 FebAPDD(Mean) 0.71 0.02 0.23 0.48
Feb X17 FebAPDD20D-MAT(Max) 0.51 0.13 0.70 0.02
Feb X18 FebST(Max) 0.94 0.0001 0.42 0.19

65
Feb X19 FebST(Mean) 0.79 0.007 0.42 0.19
Feb X20 FebST10D-MAT(Max) 0.79 0.007 -0.20 0.54
Feb X21 FebST20D-MAT(Max) 0.81 0.005 -0.21 0.53
Two-month
Nov-Dec X22 NovDecANDD(Max) -0.73 0.01 0.31 0.32
Nov-Dec X23 NovDecAPDD10D-MAT(Max) 0.03 0.92 0.64 0.03
Dec-Jan X24 DecJanAPDD(Min) 0.7 0.02 -0.36 0.26
Jan-Feb X25 JanFeb10D-MaxMAT(Max) 0.71 0.02 0.10 0.70
Jan-Feb X26 JanFeb10D-MaxMAT(Mean) 0.74 0.01 0.05 0.86
Jan-Feb X27 JanFeb20D-MaxMAT(Max) 0.85 0.002 0.44 0.17
Jan-Feb X28 JanFeb20D-MaxMAT(Mean) 0.82 0.003 0.44 0.17
Jan-Feb X29 JanFeb30D-MaxMAT(Max) 0.80 0.005 0.37 0.34
Jan-Feb X30 JanFeb30D-MaxMAT(Mean) 0.66 0.03 0.31 0.34
Jan-Feb X31 JanFebAPDD(Max) 0.77 0.009 0.31 0.34
Jan-Feb X32 JanFebAPDD(Mean) 0.67 0.03 0.20 0.57
Jan-Feb X33 JanFebAPDD20D-MAT(Max) 0.25 0.28 0.68 0.02
Jan-Feb X34 JanFebAPDD30D-MAT(Max) 0.13 0.31 0.63 0.04
Three-month
Dec-Feb X35 DecFeb10D-MaxMAT(Max) 0.7 0.02 0.05 0.86
Dec-Feb X36 DecFeb20D-MaxMAT(Max) 0.80 0.005 0.47 0.14
Dec-Feb X37 DecFeb30D-MaxMAT(Max) 0.76 0.01 0.35 0.28
Dec-Feb X38 DecFeb60D-MaxMAT(Mean) 0.69 0.02 0.33 0.31
Dec-Feb X39 DecFebAPDD(Max) 0.73 0.01 0.37 0.26
Dec-Feb X40 DecFebAPDD(Min) 0.70 0.02 -0.09 0.79
Dec-Feb X41 DecFebAPDD10D-MAT(Max) 0.74 0.01 0.42 0.19
Dec-Feb X42 DecFebAPDD20D-MAT(Max) 0.75 0.01 0.67 0.02
Dec-Feb X43 DecFebAPDD30D-MAT(Max) 0.73 0.01 0.62 0.04

66
Dec-Feb X44 DecFebST(Max) 0.70 0.02 0.45 0.17
Dec-Feb X45 DecFebST10D-MAT(Max) 0.67 0.03 0.41 0.21
Four-month
Nov-Feb X46 NovFebAPDD(Max) 0.68 0.03 0.42 0.19
Nov-Feb X47 NovFebST(Max) 0.68 0.03 0.52 0.10
Nov-Feb X48 NovFebAPPD30D-MAT(Max) 0.48 0.15 0.63 0.04
Precipitation
One-month
Dec X49 Dec-RFD -0.64 0.04 -0.50 0.11
Jan X50 Jan-RFD -0.76 0.01 -0.42 0.20
Two-month
Dec-Jan X51 DecJan-RFD -0.90 0.001 -0.64 0.03
Dec-Jan X52 DecJan-SD -0.43 0.21 -0.72 0.01
Jan-Feb X53 JanFeb-RFD -0.82 0.004 -0.31 0.35
Three-month
Nov-Jan X54 NovJan-RFD -0.87 0.001 -0.48 0.15
Nov-Jan X55 NovJan-SD -0.38 0.28 -0.71 0.01
Dec-Feb X56 DecFeb-RFD -0.92 0.001 -0.51 0.11
Dec-Feb X57 DecFeb-SD -0.51 0.12 -0.64 0.03
Four-month
period
Nov-Feb X58 NovFeb-RFD -0.82 0.004 -0.38 0.14
Nov-Feb X59 NovFeb-SD -0.46 0.17 -0.64 0.03
Spring
March X60 Mar20D-MaxMAT(Max) 0.67 0.04 0.21 0.53
April X61 Apr10D-MaxMAT(Mean) 0.74 0.02 0.01 0.97
May X62 MayANDD(Max) -0.27 0.48 -0.60 0.05

67
March-April X63 MarApr10D-MaxMAT(Mean) 0.74 0.02 -0.03 0.93
Summer
July X64 Jul10D-MinMAT(Min) 0.70 0.02 0.006 0.99
July X65 Jul10D-MinMAT(Mean) 0.64 0.04 0.002 0.99
July-August X66 JulAug30D-MaxMAT(Max) 0.70 0.02 0.33 0.31
June-August X67 JunAug30D-MaxMAT(Max) 0.70 0.02 0.18 0.58
a D = days, Max = maximum, MAT = moving average temperature, (Min) = based on daily minimum
temperature, (Mean) = based on daily mean temperature, (Max) = based on daily maximum temperature, ST =
sum of temperatures, ANDD = accumulated negative degree days, SD = snow depth, RFD = rain fall days, r =
correlation coefficient. Significant r values are highlighted in bold, P = probability. Significant P values (< 0.05)
are highlighted in bold.

68
had the highest correlation coefficient (r = 0.85, P = 0.002). However, all correlated bi-
monthly variables had lower correlation coefficients than the single month variable,
[FebST(Max), X18].
None of the three month period temperature-based variables from November to January
were significantly correlated to yield loss of winter wheat. All significant temperature
variables were from December to February periods. None of the significantly correlated tri-
monthly variables had a higher correlation coefficient than the one month [FebST(Max), X18]
and bi-monthly variable [(JanFeb20D-MaxMAT(Max), X27].
Only two variables based on the entire winter season (November to February) were
significantly correlated to yield loss of winter wheat, but these variables had a lower
correlation coefficient than most of the significant variables for one-, two-, and three-month
periods (Table 1). All variables were positively correlated to yield loss of winter wheat,
except ANDD variables that were negatively correlated. These results indicated that higher
temperatures during the winter season were likely to result in greater yield loss due to stripe
rust.
Winter precipitation variables correlated with winter wheat yield loss. Among
precipitation variables, total rainfall days (RFD) of different winter periods were significantly
correlated to yield loss of winter wheat (Table 1). January RFD (r = -0.76, P = 0.01) had a
higher correlation coefficient than December RFD (r = -0.64, P = 0.04); however, the highest
correlation coefficient (r = -0.92, P = 0.001) was associated with the three-month
precipitation variable, December to February RFD (DecFeb-RFD, X56). Except for monthly
precipitation variables, correlation coefficients obtained for two-, three-, and four-month
winter periods had higher values than the temperature variables for the same periods. Snow

69
depth and snow cover days were not significantly correlated to yield loss. All of the RFD
variables were negatively correlated with yield loss of winter wheat. These results indicate
that more rainfall days in the winter season is associated with less yield loss caused by stripe
rust.
Spring and summer weather variables correlated with winter wheat yield loss. Only
three and four temperature variables of the spring and summer seasons were significantly
correlated with winter and spring wheat yield loss, respectively (Table 1). None of the
significantly correlated variables had higher correlation coefficients than the best winter
temperature and precipitation variables. Precipitation variables from both seasons were not
correlated with yield loss.
Simple linear models developed for winter wheat yield loss. Simple linear regression
models developed based on temperature variables explained different amounts of variation in
yield loss. Models with relatively high R2
values, and low PRESS values were selected (Table
2). Different prediction models were developed using the temperature variables from the
winter period (Models 1 to 5, Table 2). Yield loss could be predicted using temperature data
as early as December, but the total variation explained was relatively low (Model 1, Table 2).
Among the simple linear models, the one-month explanatory variable, Model 2 (Table 2),
described the highest yield loss variation. Model 3 (Table 2), developed with two month-
variables explained more variation in yield loss than the best early single month model
(Model 1, Table 2). Model 8 had the highest R2 among the precipitation-based models;
however, it explained less variation than temperature-based Model 2. Models 9 to 11, based
on spring and summer variables, had lower R2 values and higher PRESS values than did most
simple linear models based on winter weather variables. Therefore, models based on winter

70
weather variables are more predictive than those from the other seasons. Since none of the bi-
monthly, tri-monthly, and winter season models explained more variation in yield loss than
monthly Model 2, the latter was considered the best for predicting yield loss due to stripe rust.
Multiple linear models developed for winter wheat yield loss. All of the 54
significantly correlated variables were subjected to a stepwise regression for selection of
variables that could explain the most of variation in yield loss. After stepwise regression, five
independent variables were identified (Model 12, Table 2). All selected explanatory variables
were winter temperature variables. Multicolinearity as indicated by the VIF values was found
among weather variables. Therefore, explanatory variables with a high VIF value and a low
regression sum of squares were excluded for model refinement. Another set of yield loss
prediction models (Models 13 to 17, Table 2) was developed for different numbers of
descriptors through the best subset algorithm. These multiple regression models explained
more yield loss variation (6 - 11.4% more) than the best simple linear model (Model 2, Table
2). Multiple regression models (Model 18 & 19, Table 2) based on spring and summer
variables had lower adjusted R2 and higher PRESS values than did Models 13 to 17.
Therefore multiple regression models based on winter weather variables explained the most
variation in yield loss among all multiple variable models. Model 12 with the highest
predicted R2 was the best predicted model followed by Model 14 among the multiple
regression models (Table 2).
Weather variables correlated with spring wheat yield loss. Twelve temperature and
six precipitation variables were significantly correlated with yield loss (Table 1). Among the
twelve winter temperature variables, X10 [Feb10D-MinMAT(Max)] had the highest
correlation coefficient (r = 0.73, P = 0.01). Of the earlier variables, the best correlation was

71
TABLE 2. Single variable and multiple-variable models obtained through stepwise and the best subset regression analyses for
predicting winter wheat yield loss caused by stripe rust
No. Modelsa P
b
R2/R
2adj
(%)c PRESS
d
Mallows′
Cp VIFe
Single variable models
1 Y = 84.3 - 0.323 X2 0.001 51.1 2255.8
2 Y= - 6.22 + 0.312 X18 0.0001 88.1 605.6
3 Y= 89.1 - 0.274 X22 0.01 53.3 2139.7
4 Y= - 17.2 + 8.34 X27 0.002 73 1147.5
5 Y= - 16.0 + 7.96 X36 0.005 64.4 1533.7
6 Y= 84.7 - 3.64 X49 0.04 41.5 2510.1
7 Y= 112 - 2.56 X51 0.0001 80 732.3
8 Y= 116 - 2.01 X56 0.0001 85.4 1343.7
9 Y= - 139 + 17.3 X61 0.023 54.8 1985.6
10 Y= - 139 + 17.3 X63 0.023 54.8 1985.6
11 Y= - 19.1 + 6.74 X64 0.025 48.5 1934.3
Multiple-variable models
Based on yearly/winter weather variables

72
12 Y= 68.6 + 0.448 X18 - 0.0502 X47- 0.390 X3 - 0.368 X7 + 0.265 X43 0.0001 99.4 119.5 6
5.7 X18, 5.2 X47, 38 X3,
55.6 X7, 3.4 X43
13 Y= 17.3 + 0.444 X18 - 0.0640 X47 - 0.0840 X3 - 0.021 X43 0.0001 96.8 7316.8 25.4
5.7 X18, 4.2 X47, 1.6 X3,
2.3 X43
14 Y= 52.2 + 0.469 X18 - 0.0569 X47 - 0.304 X3 - 0.255 X7 0.0001 98.7 110.7 10.1
4.8 X18, 4.4 X47, 27.9 X3,
37.1 X7
15 Y= 17.3 + 0.441 X18 - 0.0637 X47 - 0.0831 X3 0.0001 97.3 125.7 23.4 4.2 X18, 4 X47, 1.5 X3
16 Y= 4.00 + 0.438 X18 - 0.0649 X47 + 0.0769 X7 0.0001 96 197.4 35.6 4.4 X18, 4.1 X47, 2 X7
17 Y= 3.16 + 0.467 X18 - 0.0592 X47 0.001 94 238.3 59.4 4 X18, 4 X47
Based on spring weather variables
18 Y= - 148 + 3.57 X60 + 14.2 X61 0.008 73.4 1206.9 3 1.1 X60, 1.1 X61
Based on summer weather variables
19 Y= - 132 + 4.36 X64 + 4.29 X66 0.03 52.7 1974.4 3 1.4 X64, 1.4 X66
a Xn, explanatory variables as described in Table 1.
b P = probability.
c R
2= coefficient of determination for single-variable variable models, R
2adj = adjusted coefficient of multiple determination for multiple-variable models.
d PRESS = prediction sum of squares.
e VIF = variance inflation factor.
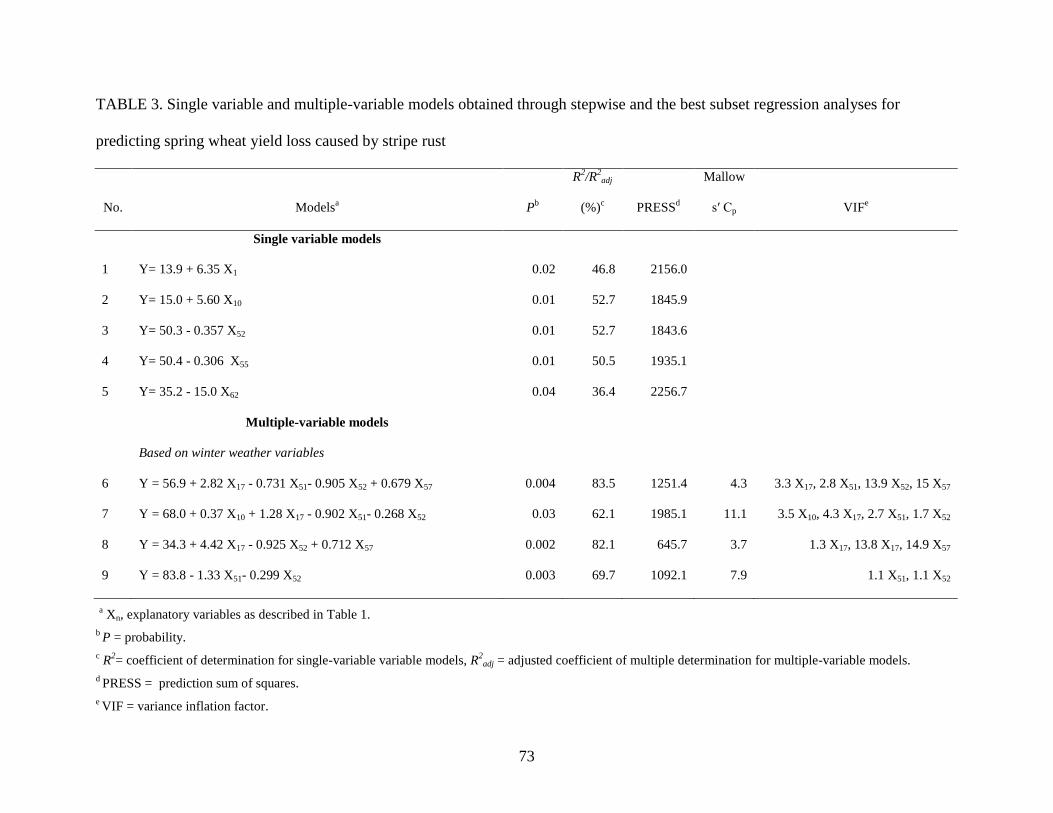
73
TABLE 3. Single variable and multiple-variable models obtained through stepwise and the best subset regression analyses for
predicting spring wheat yield loss caused by stripe rust
No. Modelsa P
b
R2/R
2adj
(%)c PRESS
d
Mallow
s′ Cp VIFe
Single variable models
1 Y= 13.9 + 6.35 X1 0.02 46.8 2156.0
2 Y= 15.0 + 5.60 X10 0.01 52.7 1845.9
3 Y= 50.3 - 0.357 X52 0.01 52.7 1843.6
4 Y= 50.4 - 0.306 X55 0.01 50.5 1935.1
5 Y= 35.2 - 15.0 X62 0.04 36.4 2256.7
Multiple-variable models
Based on winter weather variables
6 Y = 56.9 + 2.82 X17 - 0.731 X51- 0.905 X52 + 0.679 X57 0.004 83.5 1251.4 4.3 3.3 X17, 2.8 X51, 13.9 X52, 15 X57
7 Y = 68.0 + 0.37 X10 + 1.28 X17 - 0.902 X51- 0.268 X52 0.03 62.1 1985.1 11.1 3.5 X10, 4.3 X17, 2.7 X51, 1.7 X52
8 Y = 34.3 + 4.42 X17 - 0.925 X52 + 0.712 X57 0.002 82.1 645.7 3.7 1.3 X17, 13.8 X17, 14.9 X57
9 Y = 83.8 - 1.33 X51- 0.299 X52 0.003 69.7 1092.1 7.9 1.1 X51, 1.1 X52
a Xn, explanatory variables as described in Table 1.
b P = probability.
c R
2= coefficient of determination for single-variable variable models, R
2adj = adjusted coefficient of multiple determination for multiple-variable models.
d PRESS = prediction sum of squares.
e VIF = variance inflation factor.

74
with Dec10D-MaxMAT(Mean), X1, (r = 0.68, P = 0.02). Among the precipitation variables,
December to January snow depth (DecJan-SD, X52) had the highest correlation coefficient (r
= - 0.72, P = 0.01), which is the second highest coefficient after Feb10D-MinMAT(Max),
X10. Only one spring variable, [MayANDD(Max), X62], was significantly correlated with
yield loss (r = - 0.60 P = 0.01). None of the summer weather variables were correlated with
spring wheat yield loss.
Prediction models for yield loss of spring wheat. Five models were developed using
temperature and precipitation variables (Model 1 to5, Table 3). Winter temperature (Models
1 and 2) and precipitation (Models 3 and 4) explained more variation in yield loss than a
spring temperature-based model (Model 5). In general, models developed for predicting yield
loss of spring wheat, including multiple regression models, were not as good as those for
winter wheat. A simple linear model (Model 1, Table 3) with Dec10D-MaxMAT(Mean) (X1)
as a descriptor allows for prediction of spring yield loss in early January. However,
temperature-based Model 2 [Feb10D-MinMAT(Max)] and the precipitation based Model 3
(DecJan-SD) explained the greatest amounts of variation in yield loss and predicted yield loss
in the end of the winter season. Four multiple regression models were developed with one
temperature, and three precipitation-based variables (Model 6 to 9, Table 3). Due to presence
of multicolinearity among the precipitation variables, other multiple regression models with
different numbers of descriptors (Model 7 to 9) were developed through the best subset of
algorithm.
Model validation. Six models each for winter and spring wheat was chosen for model
validation. In addition to PRESS values, validations were done by the Chi-squared test using
yield loss categories (Table 4) and by regressing prediction and actual values of yield loss for

75
selected models (Figs. 1 and 2). For winter wheat, all selected multiple regression models had
a prediction accuracy (based on categories) of 92% and were superior to the two single-
variable models (Table 4). The same pattern was evident with regression analysis of the
percent yield loss; multiple-variable models had higher R2 values than single-variable models,
although in this case the multiple-variable models had different R2
values, with Model 12
(Table 2) having the highest.
Predictions were generally better with both validation approaches for winter wheat than
for spring wheat. In the latter case, there was less clear superiority of multiple-variable
models although one model (Model 9, Table 3) had a prediction accuracy of 92%, which was
the highest. However, the R2
of Model 9 was slightly lower than Model 6 (58.9% and 64%,
respectively) and overall, R2 values were higher for winter wheat, ranging from 55.9% to
87.6%, than for spring wheat, ranging from 34.9% to 64% (Fig. 1 and 2).
A partial comparison of a new model and an older model was made for winter wheat.
Model 12 (Table 2) predicted yield loss similar to the observed in all three years (Fig. 3),
whereas the older model based on disease index predicted the actual index accurately in only
2 of the 3 years.

76
TABLE 4. Prediction accuracies and probabilities of χ² tests for selected stripe rust yield loss
models for winter and spring wheat based on predicted and actual yield loss data winter wheat
(1993-2009) and spring wheat (1995-2009) at Pullman, Washington.
Model for Prediction χ² test Model for Prediction χ² test
winter wheat accuracy (%)a P
b spring wheat accuracy (%)
a P
b
Model 1, Table 2 75 0.21 Model 1, Table 3 83 0.57
Model 2, Table 2 83 0.49 Model 2, Table 3 85 0.41
Model 12, Table 2 92 0.49 Model 3, Table 3 69 0.57
Model 15, Table 2 92 0.49 Model 6, Table 3 85 0.80
Model 16, Table 2 92 0.49 Model 8, Table 3 84 0.41
Model 17, Table 2 92 0.49 Model 9, Table 3 92 0.80
a The accuracy values were calculated as frequency (%) of predicted and actual values in the same yield
loss categories.
b P = Chi-squared test probability.

77
Fig. 1. Relationship between actual yield loss and predicted yield loss (%) obtained using six
models selected for winter wheat; data represent trials from 1993-2009 at Pullman,
Washington.

78
Fig 2. Relationship between actual yield loss and predicted yield loss (%) obtained through
selected models on spring wheat; data represent trials from 1995-2009 at Pullman,
Washington.

79
Fig. 3. Comparison of actual and predicted yield loss percentages, and disease severity indices
for 2005-2007 for Pullman, Washington
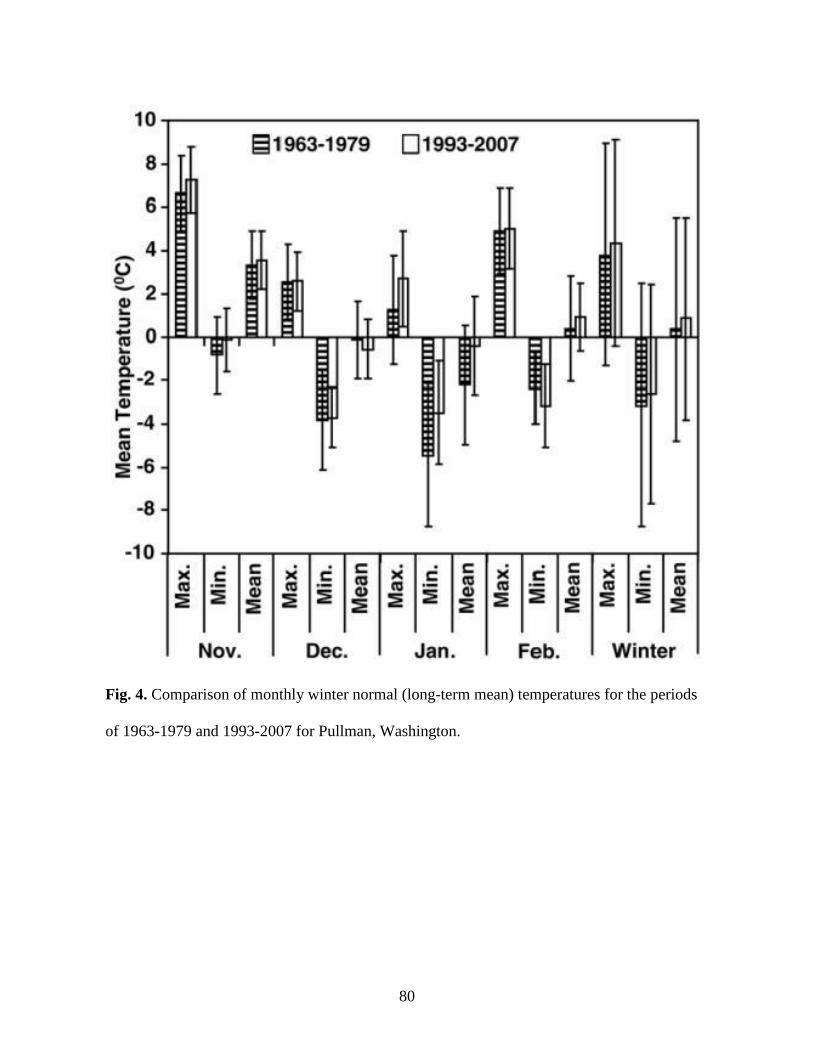
80
Fig. 4. Comparison of monthly winter normal (long-term mean) temperatures for the periods
of 1963-1979 and 1993-2007 for Pullman, Washington.

81
DISCUSSION
From a total of 1,376 weather variables, 54 (40 temperature and 14 precipitation
variables) were correlated to yield loss with winter wheat and 18 (12 temperature and 6
precipitation variables) of spring wheat caused by stripe rust (Table 1). Using these correlated
variables, 19 models with single or multiple variables were developed for predicting yield loss
of winter wheat and 9 for spring wheat (Table 2, Table 3). Based on their greater practicality,
six models each (Table 4) were selected for both winter and spring wheat to be validated, and
eventually used in disease management. Use of the series of selected models will allow
prediction of yield loss as early as January and also more accurate predictions as the season
progresses and more weather data become available.
Compared to previous models (9-12), the new system of prediction using a series of
models has several advantages. First, the new models directly predict yield loss rather than
disease severity at the flowering stage, which makes predictions more meaningful. Second,
the new model system makes prediction one month earlier than old models (December vs.
January). Growers in the PNW would benefit from knowing the potential severity of a stripe
rust epidemic in the following crop season as early as possible to select spring cultivars to
plant and prepare for early management of winter wheat crops. Third, the new system uses a
series of models, which allows refinement of prediction as weather conditions change and
crop growth progresses. Fourth, several selected models that use simple weather factor values
without complicated calculation and conversion of negative or positive degree days should be
easy to understand by growers. Finally, the new models, which were developed using
weather and disease data from 1993 to 2007, should be more suitable than the old models,
which were based on the data from 1963 to 1979 (9) for reasons discussed below.

82
In the present study, two different periods of weather data were analyzed: 1975-2007 and
1993-2007 for winter wheat and 1979-2007 and 1995-2007 for spring wheat. In addition to
data from the 1960s and 1970s used in previous studies (9,10), yield loss data since 1975 were
used in this study. The variables with the highest correlation to stripe rust yield loss were not
the same for 1975-2007 and 1993-2007. A number of weather variables from 1993-2007 had
higher correlation coefficients with yield loss percentage than the weather variables from
1975-2007 (data not shown). For example, the highest correlation coefficient obtained for the
1975-2007 period was for the entire winter season, NovFebST(Max), (r = 0.71, P = 0.0001),
whereas the highest correlation coefficient obtained for variables of the 1993-2007 period was
with FebST(Max) (r = 0.94, P = 0.0001). Since the weather variables of 1993-2007 had
higher correlation coefficients than those of 1975-2007, the new models were developed using
weather variables of 1993 to 2007. Within the winter season, December temperatures were
found more highly correlated with winter and spring yield loss than the January temperatures
in the present study. However, January temperatures were previously thought to be a more
limiting factor (9). This difference may indicate changes in weather patterns between the
periods.
Comparison between the normal winter temperatures for the period of 1963-1979 used in
a previous study (9) and that of 1993-2007 revealed increases and pattern changes in winter
temperature during the winter period (November to February) in the PNW except for
December mean and February minimum temperatures (Fig. 4). The coldest month for the
period of 1963-1979 was January, while December was the coldest month for the period of
1993-2007, although overall winter temperatures have risen. Therefore, the more recent

83
winter temperature probably had less limiting effect on pathogen winter survival and thus in
stripe rust development as compared to the previous period, 1963-1979 (Fig. 4).
The monthly mean minimum temperature for April was significantly correlated with
stripe rust intensity during the period of 1963-1979 (9). In the present study, none of the
spring weather variables based on minimum temperature correlated to yield loss. These
results indicate that spring temperature in the period of 1993-2007 was not as critical for
stripe rust development as in 1963-1979. For example, April and spring season mean
maximum, minimum, and mean temperatures were 13.74oC, 1.94
oC, and 7.84
oC; and
14.00oC, 2.53
oC, and 8.26
oC, respectively for the period of 1993-2007. In contrast, during the
period of 1963 to 1979, these temperatures were 8.03oC, -1.03
oC, and 3.5
oC; and 12.66
oC,
1.68oC, and 7.17
oC, respectively. Normal mean temperatures of April and spring season of
1993 to 2007 were closer to the basal temperature, 7oC, for P. striiformis f. sp. tritici than
during the 1963-1969 period. The 1993-2007 April temperatures were more favorable for
stripe rust development, and therefore, the spring-season temperatures were more favorable to
stripe rust and might no longer be a critical limiting factor for stripe rust development in the
PNW. The changes in winter and spring temperatures in the periods compared here
demonstrate the necessity of periodically updating forecasting models based on these weather
variables. The disease-favorable temperature changes in the spring, together with the changes
in the winter season toward conditions less detrimental for pathogen survival, could partially
explain the more frequent severe epidemics that have occurred in the region in the recent
years (3-7).
A number of approaches are available to develop crop loss models (19,24,28,29).
We relied on the commonly used least squares regression analysis to develop yield loss

84
prediction models using weather variables (24). Absolute yield loss may provide direct
information for wheat growers, however, relative yield loss can be expressed in different
forms (24). Relative yield loss should be interpreted cautiously in accordance with wheat
productivity of a locality. For example, 10 percent yield loss represents different actual yield
losses in Whitman and Benton Counties (WA) because of different productivities: 4.7 and 2.4
t ha-1
, respectively. However, yield loss percentage gives a good indication of absolute loss
for a particular cultivar in a given region. Our program annually conducts yield loss
experiments for major wheat cultivars grown in the PNW to estimate percentage and absolute
value of yield loss for each cultivar and uses this information to guide disease management on
the basis of individual cultivars (X. M. Chen, unpublished data).
Simple linear models developed using an independent variable of different
months/periods can be used for long-term, mid-term, and short-term yield loss predictions.
Prediction models such as Model 1 (Table 2) based on December temperature would be
applicable for very early forecasting of yield loss. Model 2 (Table 2) with FebST(Max) as a
descriptor is the best simple linear model because this model has the least PRESS and the
highest predicted R2 and prediction accuracy percentage among the simple regression models.
Model 7 (Table 2) with DecJan-RFD can predict yield loss in early February, earlier than
Model 2 (Table 2). Without measuring other weather parameters, just counting raining days
during December-January, this model can be used to predict potential yield loss.
A relatively few weather variables were significantly correlated with spring wheat yield
loss as compared to winter wheat yield loss. Among the simple linear models developed for
spring wheat, Model 1 (Table 3) can be used for yield loss prediction in early January.
Models 2 and 3 (Table 3) can be used for yield loss prediction in early February and March,
85
respectively. Better prediction can be obtained with multiple regression Model 6 (Table 3) or
Model 8 (Table 3).
Winter wheat and spring wheat yield loss due to stripe rust is highly correlated (r = 0.91,
P = 0.001). Yield loss prediction models developed for winter wheat are practically useful for
managing stripe rust of spring wheat in the PNW. In the PNW, winter wheat is generally
planted in September and October and harvested in July and August; and spring wheat is
planted in March and April, and harvested in August and September. Urediniospores
produced on winter crops provide inoculum for spring wheat. Any control measures for stripe
rust management of winter wheat, such as growing resistant cultivars and timely use of
fungicides should reduce the disease pressure for spring wheat. However, it is also important
to grow resistant spring wheat cultivars because stripe rust only varies in the inoculum level
from year to year, but never disappears in the PNW, and also because the summer weather
conditions allow stripe rust to develop on spring wheat.
Although the selected models were developed with yield loss and weather data at
Pullman, WA, they can be useful for other areas in the PNW with the exceptions of western
Oregon, western Washington, and possibly southern Idaho. However, the stripe rust epidemic
levels in the Pullman region (southeastern Washington and north-central Idaho) give
indications of severe, moderate, and light damage levels for the whole PNW even though
damage can vary among different areas in the region. The prediction models can be directly
used for stripe rust management in the PNW. Based on our observations, if stripe rust is
predicted to be light (1 to 20% yield loss) on susceptible cultivars, fungicide application is not
necessary for most of the currently grown cultivars that are resistant to moderately
susceptible. Moderately susceptible to susceptible cultivars should be sprayed and
86
moderately resistant to resistant cultivars may not need to be sprayed with fungicides if stripe
rust is predicted to be moderate (>20 to 50% yield loss). If stripe rust is predicted to be severe
(>50% yield loss), all cultivars except those highly resistant should be sprayed with
fungicides one or two times.
ACKNOWLEDGEMENTS
This research was supported by the US Department of Agriculture, Agricultural
Research Service (Project No. 5348-22000-014-00D) and Washington State University
(Project No. 11W-3061-7824 and 13C-3061-3923). PPNS No. 0541, Department of Plant
Pathology, College of Agricultural, Human, and Natural Resource Sciences, Agricultural
Research Center, Project Number WNP00823, Washington State University, Pullman, WA
99164-6430, USA. We would like to thank Dr. Dennis A. Johnson and Dr. Timothy D.
Murray for critical review of the manuscript, and Dr. Marc Evans for statistical consultation.
LITERATURE CITED
1. Al-Kandari N. M., and Jolliffe I. T. 2005. Variable selection and interpretation in
correlation principal components. Environmetrics 16:659-672.
2. Audsley, E., Milne, A., and Paveley, N. 2005. A foliar disease model for use in wheat
disease management decision support systems. Ann. Appl. Biol. 147:161-172.
3. Chen, X. M. 2005. Epidemiology and control of stripe rust [Puccinia striiformis f. sp.
tritici] on wheat. Can. J. Plant Pathol. 27:314-337.
4. Chen, X. M. 2007. Challenges and solutions for stripe rust control in the United States.
Aust. J. Agric. Res. 58:648-655.

87
5. Chen, X. M., Moore, M. K., Milus, E. A., Long, D. L., Line, R. F., Marshall, D., and
Jackson, L. 2002. Wheat stripe rust epidemics and races of Puccinia striiformis f. sp. tritici
in the United States in 2000. Plant Dis. 86:39-46.
6. Chen, X. M., Moore, M. K., and Wood, D. A. 2003. Epidemics and control of stripe rust
on spring wheat in the Pacific Northwest in 2002. Phytopathology 93:S16.
7. Chen, X. M., Penman, L., Wan, A. M., and Cheng, P. 2010. Virulence races of Puccinia
striiformis f. sp. tritici in 2006 and 2007 and development of wheat stripe rust and
distributions, dynamics, and evolutionary relationships of races from 2000 to 2007 in the
United States. Can. J. Plant Pathol. (Online:
http://pdfserve.informaworld.com/475514_925538792_925538723.pdf
8. Coakley, S. M. 1978. The Effect of climate variability on stripe rust of wheat in the Pacific
North-west. Phytopathology 68:207-212.
9. Coakley, S. M., Boyd, W. S., and Line, R. F. 1982. Statistical models for predicting stripe
rust on winter wheat in the Pacific Northwest. Phytopathology 72:1539-1542.
10. Coakley, S. M., and Line, R. F. 1981. Quantitative relationships between climatic
variables and stripe rust epidemics on winter wheat. Phytopathology 71:461-67.
11. Coakley, S. M., Line, R. F., and McDaniel, L. R. 1988. Predicting stripe rust severity on
winter wheat using an improved method for analyzing meteorological and rust data.
Phytopathology 78:543-550.
12. Coakley, S. M., McDaniel, L. R., and Shaner, G. 1985. Model for predicting severity of
Septoria tritici blotch on winter wheat. Phytopathology 75:1245-1251.
13. De Wolf, E. D., and Isard, S. A. 2007. Disease cycle approach to plant disease prediction.
Annu. Rev. Phytopathol. 45:203-220.

88
14. De Wolf, E. D., Madden, L. V., and Lipps, P. E. 2003. Risk assessment models for wheat
Fusarium head blight epidemics based on within-season weather data. Phytopathology
93:428-435.
15. Draper, N. R., and Smith, H. 1981. Applied Regression Analysis. (Pages 419-422, 709)
John Wiley & Sons, New York.
16. Fekedulegn, B. D., Colbert, J. J., Hicks Jr., R. R., and Schuckers, M. E. 2002. Coping with
multicollinearity: An example on application of principal components regression in
dendroecology. Pages 1-40 in Research Paper NE-721, USDA Forest Service,
Northeastern Research Station, Newton Square, PA.
17. Gladders, P., Langton, S. D., Barrie, I. A., Hardwick, N. V., Taylor, M. C., and Paveley,
N. D. 2007. The importance of weather and agronomic factors for the overwinter survival
of yellow rust (Puccinia striiformis) and subsequent disease risk in commercial wheat
crops in England. Annals Appl. Biol. 150:371-382.
18. Hardwick NV. 1998. Disease forecasting. Pages 207-230. In: The Epidemiology of Plant
Diseases. D. G. Jones ed. Kluwer Academic, Boston, MA.
19. James W. C. 1974. Assessment of plant disease and losses. Annu. Rev. Phytopathol.
12:27-48.
20. Jolliffe, I. T. 1972. Discarding variables in a principal component analysis. I: Artificial
data. Appl. Statist. 21:160-173.
21. King J. R., and Jackson D. A. 1999. Variable selection in large environmental data sets
using principal components analysis. Environmetrics 10:67-77.
22. Kutner, M. H., Christopher, J. N., John, N., and William, L. 2005. Applied Linear
Statistical Models. (Pages 134-137; 256-293; 343-382) McGraw-Hill, New York, USA.

89
23. Line, R. F. 2002. Stripe rust of wheat and barley in North America: a Retrospective
Historical Review. Annu. Rev. Phytopathol. 40:75-118.
24. Madden, L. V., Hughes, G., and van den Bosch, F. 2007. The study of plant disease
epidemics. (Pages 40; 360) The American Phytopathologicval Society, St. Paul,
Minnesota, USA.
25. Michaelsen, J. 1987. Cross-validation in statistical climate forecast models, J. of Climate
and Applied Meteorology. 26: 1589-1600.
26. Montgomery, D. C., and Peck, E. A. 1982. Introduction to Linear Regression Analysis.
(Pages 424-429) John Wiley & Sons, New York.
27. Moschini R. C., and Perez, B. A. 1999. Predicting wheat leaf rust severity using planting
date, genetic resistance, and weather variables. Plant Dis. 83:381-384.
28. Park, R. F. 1990. The role of temperature and rainfall in the epidemiology of Puccinia
striiformis f. sp. tritici in the summer rainfall area of eastern Australia. Plant Pathol. 39:
416-423.
29. Savary S., Teng, P. S., Willocquet, L., and Nutter, F. W. 2006. Quantification and
Modeling of Crop Losses: A Review of Purposes. Annu. Rev. Phytopathol. 44:89-112.
30. Savary S., Willocquet L., Elazegui F. A., Castilla N. P., and Teng P. S. 2000. Rice pest
constraints in tropical Asia: quantification of yield losses due to rice pests in a range of
production situations. Plant Dis. 84:357-69.
31. Sharp, E. L. 1965. Prepenetration and postpenetration environment and development of
Puccinia striiformis on wheat. Phytopathology 55:198-203.

90
32. Stubbs, R. W. 1985. Stripe rust. Page 61-101 In: The Cereal Rusts II. Diseases,
Distribution, Epidemiology and Control. A. P. Roelfs and W. R. Bushnell (Eds.).
Academic Press, New York.
33. Weisberg, S. 1985. Applied Linear Regression (Page 324) John Wiley, New York, USA.
34. Xu, X. M. 1999. Modeling and forecasting epidemics of apple powdery mildew
(Podosphaera leucotricha). Plant Pathol. 48:462-471.
35. Zadoks, J. C. 1961. Yellow rust on wheat: Studies in epidemiology and physiologic
specialization. Neth. J. Plant Pathol. 67:69-259.
36. Zadoks, J. C. 1984. A quarter century of disease warning, 1958-1983. Plant Dis. 68:352-
355.
91
CHAPTER THREE
Potential Oversummering and Overwintering Regions for the Wheat Stripe Rust
Pathogen in the Contiguous United States
ABSTRACT
Stripe rust, caused by Puccinia striiformis f. sp. tritici (Pst), is one of the most
important diseases of wheat. Epidemics are more frequent in the regions where Pst can
oversummer and overwinter. Regions for potential oversummering and overwintering of Pst
were determined in the contiguous United States using long-term means for temperature,
relative humidity, rainfall, dew point, and snow depth. A survival index (SI) ranging from 0
(most unfavorable) to 10 (most favorable) was developed. The pathogen can oversummer (SI
≥5) in most regions north of latitude 40oN, particularly Washington, Idaho, Montana, Oregon,
and California. It marginally survives summer (SI = 1-4) in Arkansas, Delaware, Georgia,
Iowa, Illinois, Indiana, Kansas, Kentucky, Massachusetts, Missouri, Ohio, Oklahoma, Rhode
Island, and Texas; or cannot survive summer (SI = 0) in Louisiana, Mississippi, Alabama, and
Florida in the most regions south of 40oN. Highlands of Arizona, Colorado, North Carolina,
New Mexico, Nevada, Tennessee, Utah, Virginia, and West Virginia in the Rocky or
Appalachian Mountains have climatic suitability for summer survival. Winter survival (SI ≥
5) can occur in most regions south of 40oN and the Pacific Coast, including Alabama,
Arkansas, Arizona, California, Florida, Georgia, Idaho, Louisiana, Mississippi, New Mexico,
Nevada, Oregon, South Carolina, Texas, and Washington. The pathogen cannot overwinter
(SI = 0) in most regions north of 40oN and east of the Rocky Mountains (Colorado,

92
Connecticut, Iowa, Maine, Minnesota, Montana, Nebraska, New Hampshire, New York,
South Dakota, Vermont, Wisconsin, and Wyoming). Winter survival of Pst is marginal (SI =
1-4) in Delaware, Illinois, Indiana, Kansas, Kentucky, Massachusetts, Maryland, Michigan,
Missouri, North Carolina, New Jersey, New York, Ohio, Oklahoma, Pennsylvania, Rhode
Island, Tennessee, Utah, and Virginia. Most wheat-growing regions in the United States are
either suitable for oversummering or overwintering. Both oversummering and overwintering
can occur in Arizona, California, Idaho, North Carolina, New Mexico, Oregon, Pennsylvania,
Virginia, Washington, and West Virginia. These regions may provide primary inoculum for
stripe rust epidemics in their local and surrounding regions.
Additional keywords: Triticum aestivum, yellow rust, GIS
INTRODUCTION
The United States is one of the major wheat producing and exporting nations in the
world. It produces 570 million tons of wheat annually, representing 9.5% of world’s total
production (34). Wheat is planted in 42 contiguous mainland states, but states in the Great
Plains and Pacific Northwest are major producers (http://www.nass.usda.gov/). Production of
wheat in the United States has been challenged by wheat stripe rust (yellow rust), caused by
Puccinia striiformis Westend. f. sp. tritici Erikss. (Pst). The disease often causes over 50%
yield losses in a local or farm level if the infections are very early and continued throughout
the growth of the crops (1,14,36,42). Yield loss may reach up to 100% on highly susceptible
cultivars under severe disease conditions (6).

93
Wheat stripe rust has been historically more destructive in states west of the Rocky
Mountains, especially Washington, Idaho, Oregon, and California since late 1950s; and has
become more frequently destructive in states east of the Rocky Mountains since 2000 (6).
During 2000-2010, the most severe stripe rust epidemics occurred in 2010, causing 5.8%
(2,364,125 t) and 1.4% (242,316 t) yield loss of the United States total winter and spring
wheat production, respectively (http://www.ars.usda.gov/Main/docs.htm?docid=10123), even
after the widespread application of fungicides to control the disease (42). Stripe rust was
reported in 27 states in 2010; however, the most widespread epidemic occurred in 2005 in 33
states. Significant yield losses have been incurred in many other years. The highest statewide
wheat yield loss, 25%, was recorded in California in 2003
(http://www.ars.usda.gov/Main/docs.htm?docid=10123). Other states with significant yield
loss include: Texas (15.2 % in 2003), Kansas (10.6% in 2003), Nebraska (10% in 2003),
Oregon (10% in 2010), Colorado (8% in 2001), Arkansas (7% in 2007), Louisiana (5% in
2003 and 2005), Oklahoma (5% in 2005 and 2010), Montana (4% in 2010), Idaho (3% in
2005 and 2010), Mississippi (3% in 2003), North Dakota (3% in 2010), Washington (3% in
2010), Missouri (2.5% in 2003), Georgia (1% in 2005), Kentucky (1% in 2010), Minnesota
(1% in 2010), South Dakota (1% in 2001 and 2010), Wisconsin (1% in 2010), and Alabama
(0.5% in 2001) (http://www.ars.usda.gov/Main/docs.htm?docid=10123). Trace yield loss was
observed in Florida, Illinois, Indiana, Iowa, Maryland, Michigan, North Carolina, Ohio, South
Carolina, Tennessee, Utah, Virginia, West Virginia, and Wyoming. Significant yield loss has
not been reported in Arizona, Connecticut, Delaware, Maine, Massachusetts, Nevada, New
Hampshire, New Jersey, New Mexico, New York, Pennsylvania, Rhode Island, and Vermont
94
during 2000-2010. Most of these states either do not cultivate wheat or are minor wheat
producing states (http://www.nass.usda.gov/).
Puccinia striiformis is an obligate parasite that primarily infects wheat (Triticum spp.)
and barley (Hordeum vulgare L.). In addition, Aegilops, Agropyron, Bromus, Elymus,
Hordeum, and Secale are also hosts. Under natural or controlled conditions, Pst can infect
about 320 species of grasses from 50 genera (19). Pst has potential to overseason on any of
its hosts and provide inoculum for the next season. Though the alternate host, barberry
(Berberis spp.), for Pst has been recently reported (26), whether it is significant in the disease
cycle under natural conditions still needs further investigation. The fungus mainly survives in
wheat, volunteer wheat plants, and/or grass hosts as dormant mycelia or uredinia (5,53,54).
Volunteer wheat plants, wild grasses, and/or late-maturing spring wheat crops in mountainous
areas with cool temperatures harbor Pst during summer (49).
Oversummering and overwintering dormant mycelia of Pst can produce disease foci
and cause an epidemic as the conducive season progresses (5,29,52,53,54). Stripe rust often
initiates in foci primarily because overseasoning pathogen populations are restricted into the
patches of wheat crops, volunteer wheat plants or other grass hosts (56). Stripe rust is a
polycyclic disease and the pathogen produces urediniospores in multiple cycles.
Urediniospores can spread from the origin as aerial spores (58). Wind facilitates long
distance movement of urediniospores causing local, regional, and interregional epidemics
(46,57). Besides, Pst summer and winter survival areas are often hotspots for producing more
races than other areas. This is because new races are often reported in these areas and survive
throughout the year (7,28,30). Identification of survival hot spots and adaptation of integrated
disease management strategies in these areas can reduce inoculum pressure and increase

95
effective duration of resistance genes in other epidemiological regions. Therefore, pathogen
overseasoning areas may have large epidemic consequences with its importance in local,
regional, and interregional scale for the disease prediction and management.
Previously the United States has been classified into seven stripe rust epidemiological
regions based on geographic barriers; prevailing wind, temperature, and precipitation; classes
of wheat and barley; cropping methods; and Pst races (29,30). Chen et al. (7) further
subdivided the regions into 12 stripe rust epidemiological regions also considering epidemic
frequencies and levels (Fig. 1). Climatic suitability for potential survival of Pst in these
regions is yet to be done, especially in regions East of the Rocky Mountains. Pathogen
oversummering and overwintering areas have been studied and identified in some areas of
California, Montana, Idaho, Oregon, and Washington (5,40,41,44,52-54). These studies have
explained the role of climatic parameters on the biology of Pst and its survival. Studies
conducted outside the United States have added valuable information on weather parameters
favorable for active and dormant survival of Pst (10-12,15,18,22,39). Weather variables have
been used to determine the potential oversummering and overwintering Pst regions in China
using a geographical information system (31,45). Thus identified survival regions have been
used to devise sustainable stripe rust management strategies in China (27). Although the
previous studies have identified oversummering and overwintering areas, and weather
variables favorable for Pst survival in a few western regions of the United States, these
variables have not been extrapolated to determine the potential survival regions in the United
States. Therefore, the objectives of this study were to identify geographic regions within the
contiguous United States that are potentially suitable for Pst survival during summer and
winter, and identify the areas that can serve as sources of inoculum for stripe rust epidemics.

96
Fig. 1. Epidemiological regions of wheat stripe rust, caused by Puccinia striiformis f. sp.
tritici, in the United States. Region 1 (R1) = eastern Washington, northeastern Oregon, and
northern Idaho; R2 = western Montana; R3 = southern Idaho, southeastern Oregon, northern
Nevada, northern Utah, western Wyoming, and western Colorado; R4 = western Oregon and
northern California; R5 = northwestern Washington; R6 = central and southern California,
Arizona, and western New Mexico; R7 = Texas, Louisiana, Arkansas, Oklahoma, and eastern
New Mexico; R8 = Kansas, Nebraska, and eastern Colorado; R9 = South Dakota, North
Dakota, Minnesota, and eastern Montana; R10 = Mississippi, Alabama, Florida, Georgia,
South Dakota, North Dakota, Tennessee, and Kentucky; R11 = Missouri, Illinois, Indiana,
Iowa, Wisconsin, and Michigan; R12 = Virginia, West Virginia, Ohio, Maryland,
Pennsylvania and New York [see Line and Qayoum (30) and Chen et al. (7) for details, the
figure is adapted from Chen et al. (7)].

97
MATERIALS AND METHODS
Study areas and data sources. The mainland United States with 48 states was
included in the study. A total of 445 weather stations were selected representing at least one
weather station per 160 km (about 100 miles) in radius. Weather stations were chosen more
intensely for areas with a varied topography and major wheat growing areas. Climatic data
from 1950 to 2007 and geographical information (longitude, latitude, and elevation) of each
location were obtained from the National Climatic Data Center (NCDC)
(http://cdo.ncdc.noaa.gov/CDO/dataproduct). Dew point and snow depth data were obtained
from PRISM data explorer (http://prismmap.nacse.org/nn/) and snow climatology
(http://www.ncdc.noaa.gov/ussc/index.jsp), respectively. Relative humidity was calculated
from temperature and dew point using the August-Roche-Magnus approximation method
(http://einstein.atmos.colostate.edu/~mcnoldy/Humidity.html).
Survival index. A survival index was developed from most unfavorable (0) to most
favorable (10) for winter and summer based on climatic parameters for Pst published in the
literature (Table 1 and 2) (5,9-11,28,39,40,43,52-54). Temperature is an important factor
influencing stripe rust development and its survival (6,29). Temperature affects spore
germination, infection, latent period, sporulation, and survival of active and dormant mycelia
and spores (5,10,11). Therefore, survival index was primarily based on temperature and
corrected with relative humidity, dew point, and rainfall. Initially, survival indices were
estimated for selected locations in Washington, Oregon, and Idaho where the history of stripe
rust epidemics is known. These calibrated survival indices were then extended to other
regions of the United States.

98
Summer survival index. High temperatures during summer limit the survival of Pst
(6,52-54). Constant high temperature has more detrimental effects on mycelia and uredinial
survival than alternating high and low temperatures (10,54). A short exposure to extreme
temperatures does not kill the pathogen and consequently disease develops (6). Therefore,
both maximum and minimum temperatures were used to estimate survival index. Summer
season was defined from June to September. Maximum moving average temperature (MAT)
for 10, 20, 30, and 60 days based on daily maximum and mean temperatures were calculated
as described by Sharma-Poudyal and Chen (42). Similarly, a minimum temperature for
respective MAT periods was computed from the daily minimum temperatures. These 10- to
60-day maximum MATs and respective minimum temperatures were used to determine the
appropriate MAT period to estimate survival index based on the climatic parameters
described in Table 1. Survival indices obtained from 30-day maximum MAT based on the
daily maximum temperature [Max30D-MAT(Max)] and respective 30-day minimum (30D-
Min) temperature had consistent and reasonable survival indices for selected PNW locations.
Max30D-MAT(Max) and 30D-Min were used as temperature parameters to estimate summer
survival index.
Max30D-MAT(Max) and 30D-Min temperatures were classified into three and six
categories, respectively (Table 1). Max30D-MAT(Max) temperature parameter defines the
lethal limit for survival (≥38°C), dormant survival (34-37°C) and active survival (<33°C).
Although Pst can tolerate 38°C peak temperature for a very short period of time (18), the 10-
day maximum temperature ≥32.4oC was found to be lethal for Pst survival (53). However,
the pathogen can survive if the daily temperature range is large even if the maximum
temperature is 32.4oC. Latent infection of Pst during the summer season with a maximum

99
temperature of 36.6°C in Pullman, WA has been reported (54). Therefore, the Max30D-
MAT(Max) ≥38oC is considered as the lethal temperature regardless of daily temperature
range. Temperatures above 33°C stop sporulation (39) and therefore daily maximum
temperatures ≥34 to 37
oC induce dormant survival of the pathogen. Relatively high
temperatures during late summer favor dormant survival; Pst resumes active survival in the
fall when temperature becomes low in Canada and the United State Pacific Northwest (29).
The mycelium in a leaf can survive up to 30 days when alternate high (<30oC) and low daily
temperatures (<18oC) occur. These mycelium survival days are very close to survival days
found when plants were subjected to lower temperatures (54). But the pathogen ceases to
develop and destroy when exposed at constant or mean temperatures above 22oC (40,43,53).
Li and Zeng (28) reported that a mean temperature >22oC for a 10-day period is enough to kill
the pathogen. Therefore, the pathogen does not survive when either Max30D-MAT(Max) is
≥38oC or 30 days or minimum temperature is >22
oC. When the daily maximum temperature
is not lethal for Pst, it can establish in plants and survive if the daily temperature range is high
or the minimum temperature is favorable. In such conditions, minimum temperature plays a
significant role in the survival of Pst. Therefore, the corresponding 30D-Min temperature
during the hottest period was simultaneously integrated into the temperature parameter. 30D-
Min temperatures were further classified into six classes based on suitability for Pst
germination, infection, and survival. Tu (54) observed trace infection at 21.1oC under
controlled conditions. Therefore, temperatures from 19 to 22oC are considered as a putative
upper limit for marginal infection. Similarly, 16-18oC marginally favors infection if an
extended wet period exists (11). Infection was reported more at temperatures of 14-15oC
compared to 16-18oC, but less than at 12-13
oC (9,11). Temperatures of 14-15
oC and 12-13
oC

100
were classified as moderately favorable and favorable for infection, respectively. The
optimum temperature for germination is 7oC and for infection is 7-11
oC. Therefore,
temperatures less than 11oC are considered as highly favorable for germination and infection
(9,11,39).
Temperature-based calculated survival indices were corrected with relative humidity
and minimum temperature. In general, temperature and relative humidity influence the spore
longevity. For most fungi, the length of spore life, as measured by ability to germinate after
various periods, decreases as temperature, conidial moisture content, or relative humidity
increase (22). Hydrated rust urediniospores at higher relative humidity lose spore longevity,
germinability, and infectivity compared to nonhydrated spores at lower relative humidity even
at the same temperature, whereas lower temperatures and decreasing relative humidity
increase longevity (22,25). Stripe rust urediniospores are sensitive to UV radiation and the
lethal effect of radiation increases as water content in urediniospores increases or with relative
high humidity (32). The relationship between relative humidity and viability does not appear
to be simple; most persist longer at lower humidity (47). If a location had 30 days minimum
temperature ≥20oC and relative humidity ≥65%, then an assumption was made that Pst could
not survive even as urediniospores and therefore the survival index based on temperature was
transformed to 0.
Survival indices also were corrected based on dew point, minimum temperature, and
amount of rainfall for the hottest month to address the free water or dew requirement for
successful germination and infection. Requirement of different wetness periods for infection
at different temperature ranges has been demonstrated in controlled conditions (5,11). Under

101
TABLE 1. Climatic parameters used for estimation of potential summer survival indices of Puccinia
striiformis f. sp. tritici
Climatic parametera SI (0-10)
b
Temperature (oC)
Max30D-MAT (Max):
Description
30-D Min: Description
≥ 38: Unfavorable for survival Otherwise 0
Otherwise >22: Unfavorable for survival 0
37-34: Dormant survival 19-22: Putative upper marginal limit for infection 1
37-34: Dormant survival 16-18: Marginally favorable for infection 2
37-34: Dormant survival 14-15: Moderately favorable for infection 3
37-34: Dormant survival 12-13: Favorable for infection 4
37-34: Dormant survival ≤11: Highly Favorable for germination and
infection
5
≤33: Active survival 19-22: Putative upper marginal limit for infection 2
≤33: Active survival 16-18: Marginally favorable for infection 4
≤33: Active survival 14-15: Moderately favorable for infection 6
≤33: Active survival 12-13: Favorable for infection 8
≤33: Active survival ≤11: Highly Favorable for germination and
infection
10
Correction factors for temperature based survival index
Temperature and Relative humidity: Description
30 days Min Temp ≥ 20oC and Relative humidity ≥65%: Unfavorable for survival 0

102
Dew point and Min temp, and Precipitation (mm): Description
Dew point < Min temp >30: Favorable for infection No correction
11-30: Moderately favorable for infection -1 on Temp
based SI
6-10: Marginally favorable for infection
-2 on Temp
based SI
≤5: Unfavorable for infection 0
Dew point ≥ Min temp >10: Favorable for infection No correction
6-10: Moderately favorable for infection
-1 on Temp
based SI
<5: Marginally favorable for infection
-2 on Temp
based SI
a Max = Maximum, MAT = moving average temperature, Temp = temperature, Min = minimum.
b SI = survival index

103
field conditions; however, the relationships among the dew point, ambient temperature and
rainfall for the infection and survival are yet to be studied. Therefore, we used climate data of
historically stripe rust epidemics known areas, Mt. Vernon, Pullman, Lind, and Walla Walla
of WashingtonState. These areas were used to standardize the dew point, minimum
temperature, and rainfall parameters for Pst survival (Table 1). When the dew point is less
than the minimum temperature, infection depends on the amount of rainfall. Rainfall greater
than 30 mm during a 30-day period is considered favorable for infection. Similarly, rainfall
from 11 to 30 mm was classified as moderately favorable and 6 to 10 mm as marginally
favorable for infection. Rainfall equal or less than 5 mm evaporates quickly and is
unfavorable for infection. Areas with low rainfall (<5 mm during a month) are like deserts
with no or very little vegetation (3). Although temperature may be favorable for survival of
the rust pathogen in this region, availability of suitable hosts for Pst is very unlikely.
Therefore, these desert-like areas were transformed to unfavorable. But when a dew point is
equal or more than the minimum temperature, in addition to rainfall, dew present on leaves
plays a significant role to provide necessary wet period for spore germination and infection.
Dew periods often last for more than 3 h up to 12 h during summer growing season and this
range of dew duration frequently favors plant infection by obligate pathogens (50).
Therefore, rainfall greater than 10 mm was considered as favorable, 6 to 10 mm moderately
favorable, and <5 mm marginally favorable for infection.
Winter survival index. The winter season was considered from November to
February to cover any coldest period of the year. During the winter season, the minimum
temperature is a limiting factor for Pst survival (5). A winter survival index for each location
was calculated based on temperature and snow depth, temperature and relative humidity, dew

104
point and amount of rain fall. In the presence of dew or free water, the maximum temperature
during a day time may allow infection. Urediniospores of Pst can germinate and infect hosts
even in the presence of light (33). Therefore, survival indices were estimated simultaneously
based on minimum and maximum temperatures. Minimum MATs were calculated based on
the daily minimum and mean temperatures. Minimum MATs for the 10-, 20-, 30-, and 60-
day periods were calculated. Similarly, maximum temperatures for respective MAT periods
were computed based on the daily maximum temperatures. These periods of MATs along
with snow depth, and maximum temperature for respective MATs were used to determine the
appropriate MAT period to calculate the potential survival index based on survival parameters
developed in Table 2. A minimum snow cover of 7.6 cm (3 inches) is sufficient to protect
winter wheat from winter kill (38) and thus, the Pst can survive as dormant mycelium as long
as infected leaves survive during winter (44). In snow areas, snow cover insulates sporulating
lesions from the cold temperatures, so air temperatures do not eliminate the pathogen (5,58).
Survival index obtained using the 30-day minimum MAT based on daily minimum
temperatures [30D- MinMAT(Min)] and respective 30-day maximum (30D-Max) temperature
yielded consistent and plausible survival indices with known stripe rust epidemic locations.
The 30-day minimum moving average temperature based on the daily minimum
temperatures, 30D-MinMAT(Min), was classified into four categories based on effect of
temperature and snow cover on Pst survival (Table 2). Burleigh (5) found that the Pst could
not survive when 30D-MinMAT(Min) was -10oC in field conditions even in presence of snow
cover. But in the absence of sufficient snow cover, a monthly mean temperature of -6oC or
less is enough to kill the pathogen (28). Severe cold eliminated the green foliage and

105
TABLE 2. Climatic parameters used for estimation of potential winter survival index of
Puccinia striiformis f. sp. tritici
Climatic parametera SI (0-10)
b
Temperature (oC) and Snow cover (cm)
Min30D-MAT(Min) and snow cover:
Description
30-D Max: Description
≤-11oC and ≥7.6 cm: Lower limit for
survival
Otherwise 0
≤-6oC and <7.6 cm: Lower limit for survival Otherwise 0
Otherwise ≤-5oC: Lower limit for germination and
infection
0
≤ -2 to -10oC and ≥7.6 cm or ≤-2 to -5
oC and
<7.6 cm: Survive as dormant mycelium
≤-3 to -4oC: Putative lower marginal limit
for germination and infection
1
≤-2 to -1oC: Marginally favorable for
infection and infection
2
0 to 1oC: Moderately favorable for
germination infection
3
2 to 11oC: Favorable for germination and
infection
4
≥ 12 to 30oC: Favorable disease
development
5
≥ -1 to 11oC : Active survival ≤-3 to -4
oC: Putative lower marginal limit
for germination and infection
2
≤-2 to -1oC: Marginally favorable for
infection and infection
4

106
0 to 1oC: Moderately favorable for
germination infection
6
2 to 11oC: Favorable for germination and
infection
8
≥ 12 to 30oC: Favorable disease
development
10
Correction factorsc
a Max = Maximum, MAT = moving average temperature, Temp = temperature, and Min = minimum.
b SI = survival index.
c Correction for temperature and relative humidity; and dew point, minimum temperature and precipitation was
done as described on Table 1. If minimum temperature is ≥12oC then survival index calculation as described for
summer survival index on Table 1.

107
consequently the stripe rust fungus was also eliminated from the wheat plants. Therefore, in
the presence of sufficient snow cover (>7.6 cm), Pst can survive as a dormant mycelium when
30D-MinMAT(Min) is >-10oC but Pst cannot survive ≤-6
oC without snow cover. The rust
fungus can survive as dormant mycelium when monthly temperatures are >-6oC regardless of
snow cover (5,28). Temperature range from ≥-1 to 11oC permits active survival of Pst (5).
Pst can infect plants in 3 h at 11oC under optimum moisture conditions (5). However,
different amounts of germination, infection, and disease development have been reported
within the range of ≥-1 to 11oC (5,11,29,37,58). Burleigh (5) observed infection below -4
oC
under field conditions but did not observe infection under laboratory conditions even at -
1.5oC. Therefore maximum temperature ≤-5
oC was considered as the low limit for
germination and infection and ≤-3 to -4oC as a putative low marginal limit for germination
and infection. Similarly temperature from ≤-2 to -1oC was defined as marginally favorable
for infection. The stripe rust fungus can infect host plants near 0oC and temperature from 0 to
1oC was defined as moderately favorable for germination and infection (11,58). In presence
of dew, germination occurs from 2 to 15oC, with an optimum at 7
oC (39). Temperature from
2 to 11oC is favorable for Pst germination and infection, and temperature from ≥12 to 30
oC is
favorable for disease development. Adjustment to temperature and relative humidity, dew
point, and rain fall was done as described for summer survival. No adjustment was done
based on dew point and rain fall if dew point was <0oC. If a minimum temperature for 30-day
coldest period was ≥12oC, the survival index was calculated as summer survival indices as
described in Table 1.
Spatial interpolation. Summer and winter survival indices for each location with
their respective geographical coordinates were exported to geographic information system

108
software (ArcMap 10; ESRI, Redlands, CA) to interpolate values between weather stations.
A deterministic interpolation method inverse distance weighting (IDW) was used. IDW
assumes that the interpolating surface is influenced most by the nearby points than by more
distant points (51). Out of the 445 locations, 35 weather stations were randomly withheld for
model validation. Interpolation was done at different power values. Optimization of power
value is important since the interpolated values are proportional to the inverse of the distance,
between the calculated and predicted location, raised to the power value. As power value
increases, the weights for distant points decrease rapidly and thus if the power values is very
high, only the immediate neighbors will influence the interpolated points
(http://resources.arcgis.com/). After each interpolation, maps were overlaid to find the
predicted values for those withheld locations. Thus, predicted survival indices were treated as
observed values. Frequency distribution of expected values, previously calculated, and
observed values were compared by Chi-squared tests and used for optimization of power
value (55). Maximum and minimum neighbor locations used for interpolation were eight and
four, respectively without any modification on full sector and angle. The interpolation was
done on an equidistant conical projected United States map. Lower survival index was
chosen either from summer or winter survival indices for each location to map the Pst
oversummer and winter survival regions.
Host distribution. Spring and winter wheat cultivation areas by county were obtained
from the USDA National Agricultural Statistics Service
(http://www.nass.usda.gov/Data_and_Statistics/). Counties were classified into three
categories based on areas of wheat cultivation. Besides wheat, Pst can also survive on many

109
grass hosts (2,13,20,21,23,24,54). The distribution and growth habit of these grass hosts was
obtained taken from the USDA plants database (Table 3) (http://plants.usda.gov).
Model validation. The 35 withheld locations not included in interpolations were used
for model validation separately for oversummering and overwintering studies. Survival
indices before interpolation were considered as observed and interpolated index was treated as
expected. Survival indices from 1 to 4, and 5 to 10 were combined due to the low number of
sites with these indices for withheld 35 locations. The classified three categories were
unfavorable (SI = 0), marginal (SI = 1-4), and favorable (SI = 5-10). The goodness of fit was
determined using Chi-squared tests.

110
TABLE 3. Puccinia striiformis f. sp. tritici host range and its statewide distribution in the United Statesa
No. Scientific name (references) Common name Growth habit State distributionb
1 Aegilops cylindrical (19) Jointed goatgrass Annual
AL, AR, AZ, CA, CO, IA, ID, IL, IN, KS, KY, LA, MI, MO,
MT, ND, NE, NM, NV, NY, OH, OK, OR, PA, SD, TN, TX,
UT, VA, WA, WV, WY
2 Agropyron bakeri (20) Baker's wheatgrass Perennial CO, ID, MT, NM, OR, UT, WA, WY
3 A. caninum (2) Bearded wheatgrass Perennial OR, WA
4 A. cristatum (13,54) Crested wheatgrass Perennial CA, CO, DE, IA, ID, IL, IN, KS, KY, MA, MI, MN, MT, ND,
NE, NH, NM, NV, NY, OK, OR, SD, TX, UT, WA, WY
5 A. dasystachyum (13,54) Thickspike wheatgrass Perennial AZ, CA, CO, ID, IL, MI, MT, ND, NE, NM, NV, OR, SD, WA,
WI, WY
6 A. intermedium (13,54) Intermediate wheatgrass Perennial AZ, CA, CO, GA, IA, ID, MA, MT, ND, NE, NJ, NM, NV,
NY, OR, SD, TX, UT, WA, WY
7 A. repens (2) Quackgrass Perennial All states except in AL, FL, GA, LA, and SC
8 A. spicatum (13,20,54) Bluebunch wheatgrass Perennial AZ, CA, CO, ID, MI, MT, ND, NM, NV, OR, SD, UT, WA,
WY

111
9 A. trachycaulum (13,54) Slender wheatgrass Perennial AZ, CA, CO, CT, IA, ID, IL, IN, KS, MA, MD, ME, MI, MN,
MO, MT, NC, ND, NE, NH, NJ, NM, NV, NY, OH, OR, PA,
RI, SD, TX, UT, VA, VT, WA, WI, WV, WY
10 A. trichophorum (13,54) Intermediate wheatgrass Perennial AZ, CA, CO, GA, IA, ID, MA, MT, ND, NE, NJ, NM, NV,
NY, OR, SD, TX, UT, WA, WY
11 Alopecurus arundinaceus
(13,54)
Creeping meadow foxtail Perennial AZ, CO, ID, KY, MT, ND, NE, SD, UT, WA, WY
12 Bromus carinatus (20) California brome Perennial CA, OR, WA
13 B. marginatus (20,23,24) Mountain brome Perennial AZ, CA, CO, CT, IA, ID, IL, KS, MA, ME, MT, NE, NH, NM,
NV, NY, OR, SD, UT, WA, WY
14 B. mollis (21) Soft brome Annual All states except in AL, FL, GA, and MS
15 B. pumpellianus (20) Pumpelly's brome Perennial CO, ID, MI, MT, NM, OR, WA, WY
16 B. scoparius (13,54) Broom brome Annual CA, MI, NY, VA
17 B. sitchensis (20) Alaska brome Perennial CA, OR, WA
18 B. unioloides (21) Rescuegrass Annual/Perennial AL, AR, AZ, CA, CO, DC, FL, GA, IA, IL, KS, KY, LA, MD,
MO, MS, NC, ND, NE, NJ, NM, NV, NY, OH, OK, OR, PA,
SC, SD, TN, TX, UT, VA
19 Dactylis glomerata (8) Orchardgrass Perennial All States

112
20 E. Canadensis (23,24) Canada wildrye Perennial All states except in AL, FL, GA, LA, and MS
21 E. glaucus (13,23,24,54) Blue wildrye Perennial AR, AZ, CA, CO, ID, IL, MI, MO, MT, ND, NM, NV, NY,
OK, OR, SD, TX, UT, WA, WY
22 Festuca arundinacea (13,54) Tall fescue Perennial All states except in ND and IN
23 F. rubra (13,54) Red fescue Perennial All states except in AR, KS, LA, MS, OK, SD, and FL
24 Hordeum bulbosum (13,54) Bulbous barley Perennial CA
25 H. hystrix (21) Mediterranean barley Annual AZ, CA, ID, IL, MA, MT, NJ, NV, OH, OK, OR, PA, UT, WA
26 H. jubatum (20,23,24) Foxtail barley Perennial All states except in AL, FL, GA, LA, and MS
27 H. leporinum (21) Hare barley Annual AZ, CA, CT, DC, DE, GA, ID, MA, MD, ME, MT, NC, NJ,
NM, NV, NY, OK, OR, PA, SC, TX, UT, VA, WA, WY
28 H. marinum (21) Seaside barley Annual AZ, CA, ID, IL, MA, MT, NJ, NV, OH, OK, OR, PA, UT, WA
29 H. nodosum (23,24) Meadow barley Perennial AZ, CA, CO, ID, IL, IN, MD, ME, MO, MS, MT, NH, NJ, NM,
NV, NY, OH, OR, PA, TX, UT, WA, WY
30 H. vulgare (8,21) Common barley Annual All states except SC
31 Phalaris minor (21) Littleseed canarygrass Annual AL, AZ, CA, CO, FL, LA, NJ, NM, OR, PA, SC, TX
32 P. paradoxa (21) Hood canarygrass Annual AZ, CA, LA, MD, NJ, OR, PA, WA
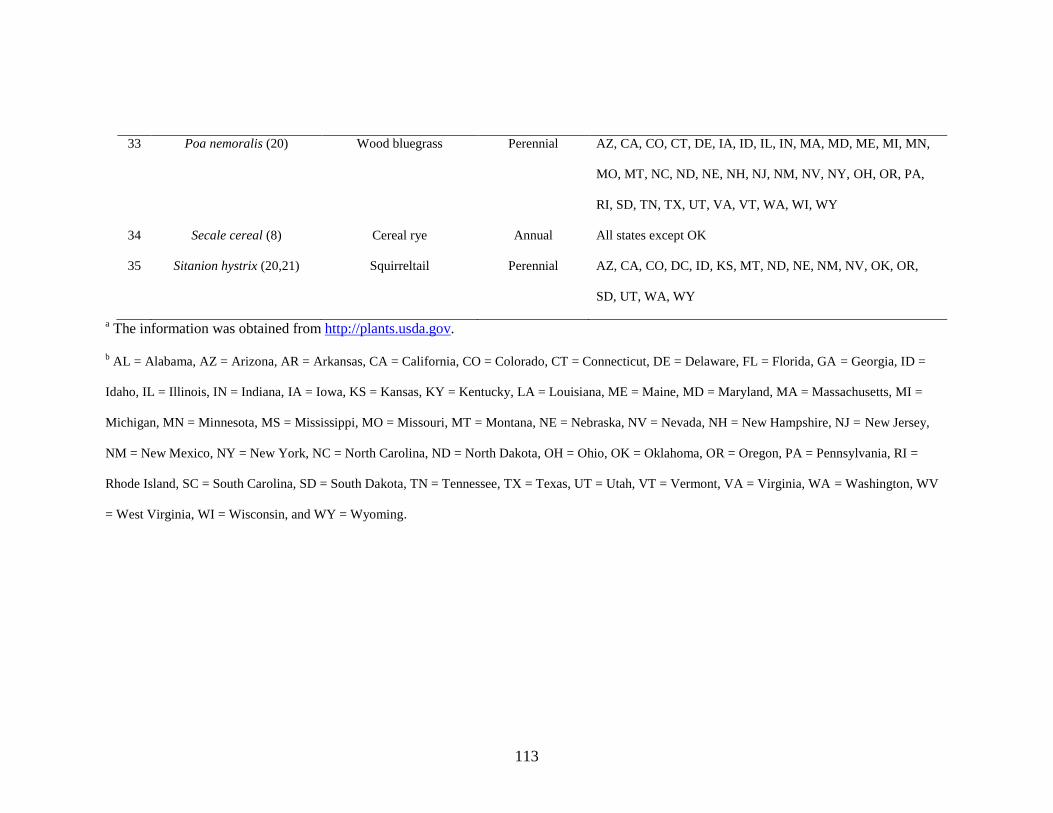
113
33 Poa nemoralis (20) Wood bluegrass Perennial AZ, CA, CO, CT, DE, IA, ID, IL, IN, MA, MD, ME, MI, MN,
MO, MT, NC, ND, NE, NH, NJ, NM, NV, NY, OH, OR, PA,
RI, SD, TN, TX, UT, VA, VT, WA, WI, WY
34 Secale cereal (8) Cereal rye Annual All states except OK
35 Sitanion hystrix (20,21) Squirreltail Perennial AZ, CA, CO, DC, ID, KS, MT, ND, NE, NM, NV, OK, OR,
SD, UT, WA, WY
a The information was obtained from http://plants.usda.gov.
b AL = Alabama, AZ = Arizona, AR = Arkansas, CA = California, CO = Colorado, CT = Connecticut, DE = Delaware, FL = Florida, GA = Georgia, ID =
Idaho, IL = Illinois, IN = Indiana, IA = Iowa, KS = Kansas, KY = Kentucky, LA = Louisiana, ME = Maine, MD = Maryland, MA = Massachusetts, MI =
Michigan, MN = Minnesota, MS = Mississippi, MO = Missouri, MT = Montana, NE = Nebraska, NV = Nevada, NH = New Hampshire, NJ = New Jersey,
NM = New Mexico, NY = New York, NC = North Carolina, ND = North Dakota, OH = Ohio, OK = Oklahoma, OR = Oregon, PA = Pennsylvania, RI =
Rhode Island, SC = South Carolina, SD = South Dakota, TN = Tennessee, TX = Texas, UT = Utah, VT = Vermont, VA = Virginia, WA = Washington, WV
= West Virginia, WI = Wisconsin, and WY = Wyoming.

114
RESULTS
Most oversummering and overwintering areas of the wheat stripe rust pathogen have
different spatial distributions within the contiguous United States. Only a few locations
overlap and are favorable for both oversummering and overwintering of the pathogen.
Oversummering. Summer survival of Pst within the contiguous United States was found
either in higher latitudes north of >40oN, in northern states, or higher altitudes in southern
states (Fig. 2A). At least one location in 23 states, Arizona, California, Colorado, Idaho,
Maine, Michigan, Minnesota, Montana, North Carolina, North Dakota, Nebraska, New
Hampshire, New Mexico, Nevada, New York, Oregon, Pennsylvania, South Dakota,
Tennessee, Utah, Washington, Wisconsin, and Wyoming is favorable for summer survival (SI
≥8). Among these states, the coastal range of Oregon and Washington and the Rocky
Mountain range in Idaho, Montana, Wyoming, and Colorado were major regions favorable for
oversummering. Highlands of the Sierra Nevada in California or Rocky Mountains in
Arizona, New Mexico, and Nevada were also favorable for summer survival. Similarly, the
high hills of the Appalachian Mountains range in North Carolina and Tennessee favor Pst
summer survival. Other favorable locations are in localized areas in the northern states.
Moderately and intermediately favorable summer environments (SI = ≥6-7) were found in 26
states: Maryland, Virginia, and West Virginia and 23 states listed above for SI ≥8.
Most areas of southern California, the southern Great Plains, and the southeast coastal
regions were either marginally favorable or unfavorable for Pst oversummering. At least one
marginally suitable area for Pst survival was in Connecticut, Georgia, Iowa, Indiana,
Kentucky, Massachusetts, New Jersey, Ohio, Rhode Island, South Carolina, and Vermont
(maximum SI = 4). Summer is unfavorable for Pst survival in Arkansas, Delaware, Illinois,

115

116
Fig 2. Potential oversummering (A), overwintering (B), and oversummering and
overwintering (C) survival regions of the wheat stripe rust pathogen, Puccinia striiformis f.
sp. tritici, in the contiguous United States. Wheat cultivating counties are for spring and
winter wheat shown in A & C, and for winter wheat only in B.

117
Kansas, Missouri, Oklahoma, and Texas (maximum SI = 2); Louisiana (maximum SI = 1);
and Alabama, Florida, and Mississippi (SI = 0).
Overwintering. Areas favorable for winter survival (SI ≥5) of Pst were found in 14 U.S.
contiguous states. These states are either in south of 40oN or in the Pacific Rim. These states
were Alabama, Arkansas, Arizona, Florida, Georgia, Louisiana, Mississippi, New Mexico,
Nevada, South Carolina, Texas, California, Oregon, and Washington (Fig. 2B). All of these
states except New Mexico had favorable or more favorable (SI ≥8) overwintering locations.
Moderately and intermediately favorable winter survival locations (SI = ≥6-7) were found in
13 states.
In general, Pst cannot overwinter in most regions north of 40oN in states east of the
Rocky Mountains. The fungus can survive marginally during winter (maximum SI = 4) in
Delaware, Idaho, Illinois, Indiana, Kansas, Kentucky, Massachusetts, Maryland, Missouri,
North Carolina, New Jersey, New York, Ohio, Oklahoma, Pennsylvania, Rhode Island,
Tennessee, Utah, Virginia, and West Virginia. Overwintering is unfavorable in Michigan
(maximum SI = 1) and most unfavorable in Colorado, Connecticut, Iowa, Maine, Minnesota,
Montana, North Dakota, Nebraska, New Hampshire, South Dakota, Vermont, Wisconsin, and
Wyoming (maximum SI = 0).
Oversummering and overwintering. Most of the areas of the United States are not
suitable for Pst survival in both summer and winter (Fig. 2C). Only the Pacific Rim states,
California, Oregon, and Washington, have areas favorable for survival in summer and winter
seasons (minimum SI ≥8). The pathogen can marginally survive in Arizona, Georgia,
Kentucky, Massachusetts, North Carolina, New Jersey, New Mexico, Ohio, Pennsylvania,
Rhode Island, South Carolina, Tennessee, Virginia, and West Virginia (minimum SI = 4),

118
Idaho (except areas bordering Washington), Indiana, and Utah (minimum SI = 3).
Oversummering and overwintering are unfavorable in Arkansas, Delaware, Illinois,
Maryland, Missouri, Nevada, Oklahoma, and Texas (minimum SI = 2); and Kansas,
Louisiana, and Michigan (minimum SI = 1). Both oversummering and overwintering was
most unfavorable (minimum SI = 0) in Alabama, Colorado, Connecticut, Florida, Iowa,
Maine, Minnesota, Mississippi, Montana, North Dakota, Nebraska, New Hampshire, New
York, South Dakota, Vermont, Wisconsin, and Wyoming.
Model validation. The 35 withheld locations for model validation were from 27
different states. Observed and expected frequencies of three categories of survival indices,
unfavorable (SI = 0), marginal (SI = 1-4), and favorable (SI = 5-10), did not differ
significantly for summer (χ² = 5.27, df = 2, P =0.05) and winter (χ² = 1.05, df = 2, P =0.05).
A power value was selected when the Chi-squared test revealed no significant difference
between observed and expected survival index frequencies. The validated interpolated
surface had a power parameter of 2 and was used for summer and winter survival interpolated
maps (Fig. 2).
DISCUSSION
The contiguous United States has climatic and spatial variability for oversummering and
overwintering survival of the stripe rust pathogen. The major wheat growing regions are
either favorable for oversummering or overwintering of the pathogen but not suitable for both
oversummering and overwintering. Both summer and winter survival regions are located
mostly in the Pacific coastal areas and the Appalachian Mountains range. Favorable
environments in the highlands of southern states suggest that the pathogen can oversummer

119
and overwinter in those areas too. Wind may facilitate dispersal of urediniospores from
survival to non-survival regions (4). Besides wheat, the role of grass hosts for harboring the
pathogen during offseason is important to provide inoculum later on the wheat growing
seasons. Although potential survival areas were developed based on biology of the wheat
stripe rust pathogen, these findings equally applicable for the barley stripe rust pathogen (P.
striiformis f. sp. hordei) too.
The survival potentials of Pst during summer and winter were different for the previously
defined stripe rust regions in the United States. Line and Qayoum (30) classified the United
States wheat growing regions into seven stripe rust regions based on geographic barriers,
prevailing wind, temperature, precipitation; classes of wheat and barley, cropping methods,
and Pst races. The largest region 7, east of Rocky Mountains, has been subdivided into six
regions giving a total of 12 stripe rust epidemiological regions (Fig. 1) (7). Most of the
northern wheat growing states have mostly favorable [Stripe rust epidemiological region 1
(R1), R2, R3, R4, and R5] or at least marginally favorable (R9, R11 and R12) environment
for summer survival of the pathogen. This is because the temperatures are not a limiting
factor for Pst survival in these regions. Since wheat is ready to harvest during July to
September (http://www.nass.usda.gov/Publications/Usual_Planting_and_Harvesting_Dates),
the pathogen needs to rely on early volunteers and/or other grass hosts for summer survival in
some of the regions.
Oversummering inoculum can serve as local or endogenous sources, causing fall
infection in winter wheat. However, the cultivation of winter wheat is not as common in the
northern Great Plains of the United States compared to southern states. Therefore, inoculum
originating from summer survival in the low density winter wheat cultivating states may not

120
play as an important role in disease initiation as intensive winter wheat cultivation states.
Furthermore, high humidity in the Great Plains may not be favorable for urediniospore
survival during summer (6). Therefore, the oversummering of Pst is less likely in Midwestern
states than in PNW states.
Oversummering of Pst in the highlands of Rocky Mountains in southern states, Arizona,
Colorado, New Mexico, Nevada, and Utah, (R3, R6, and R7) or the Appalachian Mountains,
North Carolina, Tennessee Virginia, and West Virginia, (R10 and R12) may be sources of
inoculum for late fall or winter infection for those regions. Climatic suitability of some areas
in the Appalachian Mountains range for Pst survival may provide inoculum on either side of
the mountain range. This may explain the appearance of stripe rust in Virginia similar to or
earlier than in southern states, Colorado, Kansas, and Nebraska, close to Texas (7). Thus,
reestablishment of the rust in the Alabama, Mississippi, Georgia, and Florida may also be
result of urediniospores carried north by winds from the Appalachian Mountains.
Highlands or mountainous areas play a significant role in oversummering of Pst and
provide inoculum to lowland wheat growing areas. Mountains Brasstown Bald, Georgia
(1,458 m; coordinates:34.86o N, 83.8
o W), Mt. Sunflower, Kansas (1,231 m; 39.01
o N,
102.03o W), Black Mt., KY (1,262 m 36.9
o N, 82.88
o W), Panorama Point, Nebraska (1,653
m; 41.46o N, 104.01
o W), Wheeler Peak, New Mexico (4,011 m; 36.33
o N, 105.41
o W), Black
Mesa, Oklahoma (1,516 m; 36.55o N, 102.98
o W), Sassafras Mt., South Carolina (1,085 m;
35.05o N, 82.76
o W), Harney Peak, South Dakota (2,207 m, 43.85
o N, 103.51
o W), Clingmans
Dome, Tennessee (2,025 m; 35.55o N, 83.48
o W), Guadalupe Peak, Texas (2,667 m; 31.88
o N,
104.85o W), Mt. Rogers, Virginia (1,746 m; 36.65
o N, 81.53
o W), and Spruce Knob, West
Virginia (1,482 m; 38.68o N, 79.31
o W) were not included in the study due to lack of

121
sufficient weather data or weather stations in these locations (http://geology.com/state-high-
points.shtml). These mountains are either further north or higher in altitude and or both than
the Sequoia National Park Mountains, California (1,828 m, ca. 36oN) or Himalaya (≥1,600m,
ca. 28-29o N), and Nilgiri hills in India (2,500 m, ca. 11
oN), where oversummering of Pst has
been consistently reported (49,53). Therefore, Pst can survive in mountains of above
mentioned states during summer. Since winter survival of Pst is possible around the tallest
mountains in New Mexico, Oklahoma, Tennessee, South Carolina, Texas, Virginia, and West
Virginia, the pathogen very likely can survive during both summer and winter seasons in
these regions.
In general, hot and dry summer in Texas and northeastern Mexico was considered
unfavorable for summer survival of the cereal rusts and had no role in the annual cycle of rust
(17). A possible source of inoculum for stripe rust in Texas in the fall was supposedly from
late-planted crops at high elevations in Mexico (29). But Guadalupe Peak, Texas has climatic
suitability for oversummering of Pst. This area may be a potential source of inoculum for fall
infection for Texas. The highlands of Mexico may not be the only source of inoculum to
initiate the disease in Texas and other Great Plains, and eastern states.
Climatic suitability for overwintering of Pst in the PNW (R1, R2, R4, R5, and R6) is
in agreement with previous field studies conducted in these regions (6,29,41,53,54). Early
sown wheat infected during the previous fall may provide the primary inoculum for disease
epidemics in the spring (29,54). A similar phenomenon for stripe rust development may
occur in other overwintering regions of the United States. The stripe rust pathogen cannot
overwinter due to the low temperatures in the major winter-wheat-growing areas in the
regions east of Rocky Mountains and in the northern Great Plains. But Pst can overwinter as

122
long as the infected foliage remain green during winter. The stripe rust pathogen can
overwinter in those regions where overwintering of leaf rust fungus (P. triticina) have been
reported as in central Nebraska (16). Therefore, in the regions north of Nebraska, stripe rust
can initiate mostly from the exogenous sources of inoculum where the pathogen can
overwinter from fall infections. The Rocky Mountains provide a barrier for the wind
movement from the oversummering and overwintering regions, west of the Rockies.
Therefore, the overwintering inocula originating in the southern states are very likely causes
of stripe rust in the northern Great Plains during spring (6). Since the climatic conditions in
some areas of the Appalachian Mountains are suitable for overwintering of Pst. They may be
a potential source of inoculum for surroundings states. In addition, as the winter hardiness of
winter wheat increases, Pst may survive in the green foliage as dormant mycelium.
The most favorable year round climatic conditions for survival were found in
northwestern Washington (R5), western Oregon and northern California (R4), and a few
locations in central and southern California, Arizona, and western New Mexico (R6). Most of
these regions have mild winters and cool summers favorable for the year-round survival of the
pathogen. Stripe rust urediniospores can be detected most of the year especially west of the
Cascade Mountains. Regions east of the Cascade Mountains in eastern Washington often
have survival of the pathogen as dry urediniospores in summer (54) or dormant mycelium
during winter season (5). The disease can be initiated by indigenous inoculum and provide
inoculum for those regions where the pathogen cannot survive in either one or both summer
and winter seasons. The identified oversummering and overwintering regions match with the
most vulnerable and historically important stripe rust epidemic regions, the PNW and
California (6) and western mountain ranges of the United States. In addition, the large

123
number of races and first reports of new races often occur in the PNW and California, where
the pathogen can oversummer and overwinter (7). Therefore, the oversummering and
overwintering regions can be considered as hot spot areas of stripe rust. Similarly in China,
year-round survival areas such as southern Gansu, northwestern Sichuan, southern Shaanxi,
and Yunnan are considered stripe rust hot spots since these regions were associated with
evolution of new races and high pathogenic variability (28). Considering the high virulence
diversity, screening of wheat breeding lines for resistance has been done in Mt. Vernon (R5)
and Pullman (R1), Washington in the United States.
The stripe rust pathogen could not survive either in summer or winter in most of the
Great Plains states, northeastern states, and southeastern states, except in highlands. The
pathogen may actively survive in the Appalachian Mountains range spreading from Georgia
(R10) to Pennsylvania (R12). These areas may favor the survival of Pst during both summer
and winter as in the PNW and California where the pathogen can survive year around, and
provide inoculum to the surroundings regions. Similarly, in a mild summer, the northwestern
part of Texas and Oklahoma (R7) may have dormant stripe rust inoculum. States in Region 2
(western MT), Region 8 (Kansas, NE, and eastern Colorado), R9 (South Dakota, North
Dakota, Minnesota, and eastern Montana), Region 10 (Mississippi, Alabama, Florida,
Georgia, South Dakota, Tennessee, and Kentucky), and Region 11 (Missouri, Illinois,
Indiana, Iowa, Wisconsin, and Michigan) are unfavorable for summer and/or winter survival
and mostly rely on exogenous sources of inoculum to initiate the disease.
The contiguous United States has great variation in the spatial distribution of survival
regions for Pst and wind is paramount to spread of stripe rust inoculum. Since urediniospores
of Pst can spread more than 800 km from the area of origin, wind plays a significant role in

124
the urediniospores dispersal between the stripe rust survival regions (57,58). Dispersal of Pst
from oversummering and/or overwintering areas into an area where it cannot survive from
year to year has been reported in the United States as the Puccinia pathway (48) and also in
China (57). Wind directions and speed are variable during different seasons in the United
States (http://hurricane.ncdc.noaa.gov/cgi-bin/climaps/climaps.pl). For example, in general
southerly winds prevail during March and April in Texas, Louisiana, Alabama, Mississippi,
and Georgia where Pst can overwinter. Urediniospores may dispersal further north from
these states and ultimately reach northern wheat growing states like North Dakota, South
Dakota, and Canada. Stripe rust was reported from January to April in overwintering regions
in Texas and reached to non-overwintering north states, South Dakota and North Dakota, in
June to July (7). Although there is no field evidence of oversummering of Pst in New Mexico
and Guadalupe Peak, Texas, based on the climatic suitability, Pst can survive during summer
and have potential of dispersal in north, northwest, and south during October to December.
These regions may provide inoculum to the major wheat growing areas of Texas, where the
Pst cannot oversummer. But Cascade, Sierra Nevada, Rocky and Appalachian mountains
may create barriers for wind dispersal between the different survival regions.
Grass hosts of Pst are widely distributed in Pst potential survival areas and may act as a
green bridge between seasons. The pathogen can survive during summer on these hosts as:
active uredinia, dormant mycelium, and/or urediniospores on both dead and living hosts (54).
But unlike winter survival, Pst cannot oversummer in these hosts even if the hosts survive
during the summer season because Pst cannot tolerate temperature above 22oC for more than
10 days (28,40,43,52,53). The USDA plant database (http://plants.usda.gov) shows the wide
distribution of previously reported grass hosts in the PNW (Table 3) (2,13,20,2123,24,26,54).

125
Among these hosts, Elymus glaucus, E. canadensis, Bromus marginatus, Hordeum nodosum,
and H. jubatum harbored dormant mycelium of the pathogen at low elevations in Oregon
(23,24). Similar findings were found on Agropyron bakeri, A. spicatum, B. marginatus, B.
carinatus, B. pumpellianus, B. sitchensis, H. jubatum, Sitanion hystrix, and Poa nemoralis at
high elevations bordering the wheat regions of Washington (20). Dormant survival during
mid-summer was observed in Agropyron trichophorum, A. cristatum, A. dasystachyum, A.
intermedium, A. spicatum, B. scoparius, Festuca arundinacea, F. rubra, and Hordeum
bulbosum, in Pullman, Washington (54). Continued sporulation was found on A.
trachycaulum, B. marginatus, and E. glaucus in field during the summers of 1963 and 1964 at
Pullman, Washington. Other grasses reported as the hosts of Pst outside the United States are
also widely distributed in the United States (Table 3) (2,21). Since the latent period of the Pst
is influenced by host and the pathogen race, Pst can survive during summer for different
summer periods (23,30,35). Early infections in wheat plots in early fall in the vicinity of
grass hosts in high elevation of Washington indicate the role of these host of stripe rust
epidemics (20). Most of these hosts are perennial in growth habits. Periodic infections are
not necessary if these hosts can remain green in summer and winter. Role of these hosts
would be particularly important on the southern states mountains or highlands.
In general, potential oversummering areas for Pst are the northern states and highlands of
southern states whereas the Pacific coast and southern states favor overwintering. The
pathogen cannot survive in most of the wheat growing areas in both summer and winter
seasons. Therefore, stripe rust epidemics in these regions depend on exogenous inoculum.
Oversummering and overwintering regions are the historically important stripe rust epidemic
regions, California and the PNW. Other areas for potential summer and winter survival are

126
the highlands of Arizona and the Appalachian Mountains range. Oversummered and
overwintered Pst may produce disease foci under conducive weather conditions, cause an
epidemic as the season progresses, and provide inoculum for other regions. Further studies on
the role of these survival areas will help to understand regional and interregional
epidemiology of stripe rust in the United States.
ACKNOWLEDGEMENTS
This research was supported by the US Department of Agriculture, Agricultural
Research Service (Project No. 5348-22000-014-00D) and Washington State University
(Project No. 13C-3061-3925 and 13C-3061-3232) PPNS No. 0???, Department of Plant
Pathology, College of Agricultural, Human, and Natural Resource Sciences, Agricultural
Research Center, Project Number WNP00823, Washington State University, Pullman, WA
99164-6430, USA. We would like to thank Drs. D. A. Johnson and T. D. Murray for critical
review of the manuscript.
LITERATURE CITED
1. Batts, C. C. V. 1957. The reaction of wheat varieties to yellow rust, Puccinia glumarum,
1951-1956. J. Natl. Inst. Agric. Bot. 8:7-18.
2. Becker, H., and Hart, H. 1939. Das Ayftreteb und die Verbreitung von Gelbrost in Ostharz
und den daran angrenzenden Wizenanbaugebieten. Z. Pflanzenkrankh. 49:449-481.

127
3. Brouwer, C., and Heibloem, M. 1986. Irrigation water management: Irrigation water
needs, irrigation water management training manual No. 3. (Online
http://www.fao.org/docrep/S2022E/s2022e06.htm accessed on December 18, 2010).
4. Brown, J. K. M., and Hovmøller, M. S. 2002. Aerial dispersal of pathogens on the global
and continental scales and its impact on plant disease. Science 297:537-541.
5. Burleigh, J. R. 1965. The winter biology of Puccinia striiformis West. in the Pacific
Northwest. PhD thesis, Department of Plant Pathology, WSU, Pullman, WA.
6. Chen, X. M. 2005. Epidemiology and control of stripe rust [Puccinia striiformis f. sp.
tritici] on wheat. Can. J. Plant Pathol. 27:314-337.
7. Chen, X. M., Penman, L., Wan, A. M., and Cheng, P. 2010. Virulence races of Puccinia
striiformis f. sp. tritici in 2006 and 2007 and development of wheat stripe rust and
distributions, dynamics, and evolutionary relationships of races from 2000 to 2007 in the
United States. Can. J. Plant Pathol. 35:315-333.
8. CPC, 2005. Crop Protection Compendium. CAB International. UK.
9. de Vallavieille-Pope, C., Huber, L., Leconte, M., and Goyeau, H. 1995. Comparative
effects of temperature and interrupted wet periods on germination, penetration, and
infection of Puccinia recondita f. sp. tritici and P. striiformis on wheat seedlings.
Phytopathology 85:409-415.
10. Dennis, J. I. 1987a. Effect of high temperatures on survival and development of Puccinia
striiformis on wheat. Trans. Br. Mycol. Soc. 88:91-96.
11. Dennis, J. I. 1987b. Temperature and wet-period conditions for infection by Puccinia
striiformis f. sp. tritici race 104E137A +. Trans. Br. Mycol. Soc. 88:119-121.

128
12. Dennis, J., and Brown, J. 1986. Summer survival of Puccinia striiformis f. sp. tritici in
Victoria, Australia. Aust. Plant Pathol. 15:57-60.
13. Dietz, S. M., and Hendrix, J. W. 1962. Reaction of grasses to stripe rust at Pullman,
Washington. Phytopathology 52:730.
14. Doodson, K. J., Manners, J. G., and Myers, A. 1964. Some effects of yellow rust
(Puccinia striiformis) on the growth and yield of spring wheat. Ann. Bot. 28:459-472.
15. Ellison, P. J., and Murray, G. M. 1992. Epidemiology of Puccinia striiformis f. sp. tritici
on wheat in southern New South Wales. Aust. J. Agric. Res. 43:29-41.
16. Eversmeyer, M. G., and Kramer, C. L. 1996. Modeling winter wheat and early spring
survival of Puccinia recondita in wheat nurseries during 1980 to 1993. Plant Dis. 80:490-
493.
17. Eversmeyer, M. G., and Kramer, C. L. 2000. Epidemiology of wheat leaf and stem rust in
the central great plains of the USA. Annu. Rev. Phytopathol. 38:491-513.
18. Georgievskaja, N. A. 1966. Quelques lois sur Ie developpement de la rouille Jaune du ble.
Tr. Vses. Nauchno Issled. Inst. Zabtsh. Rost. Leningrad 26:55-63.
19. Hassebrauk, K. 1965. Nomenklatur, geographische Verbreitung und wirtsbereich des
Gelbrostes, Puccinia striiformis West. Mitt. Biol. Bundesanst. Land Forstwirtsch, Berlin-
Dahlem, 116:1-75.
20. Hendrix, J. W., Burleigh, J. R., and Tu, J. C. 1965. Oversummering of stripe rust at high
elevations in the Pacific Northwest-1963. Plant Dis. Rep. 49:275-78.
21. Holmes, R., and Dennis, J. 1985. Accessory hosts of wheat stripe rust in Victoria,
Australia. Trans. Br. Mycol. Soc. 85:159-160.

129
22. Hong, T. D., Ellis, R. H., and Moore, D. 1997. Development of a model to predict the
effect of temperature and moisture on fungal spore longevity. Ann. Bot. 79:121-128.
23. Hungerford, C. W. 1923. Studies on the life history of stripe rust, Puccinia glumarum. J.
Agric. Res. 24:607-20.
24. Hungerford C. W., and Owens, C. E. 1923. Specialized varieties of Puccinia glumarum
and hosts for variety tritici. J. Agric. Res. 25:363-401.
25. Imbaby, I. A.; Nazim, M.; Ali, M. M., and Abdel-Malek, N. I. 2005. Viability of wheat
rust urediniospores produced on different stages of susceptible plants. Egypt. J.
Phytopathol. 33:59-76.
26. Jin, Y., Szabo, L. J., and Carson, M. 2010. Century-old mystery of Puccinia striiformis
life history solved with the identification of Berberis spp. as an alternate host.
Phytopathology 100:432-435.
27. Kang, Z., Zhao, J., Han, D., Zhang, H., Wang, X., Wang, C., Han, Q., Guo, J., and Huang,
L. 2010. Status of wheat rust research and control in China. BGRI 2010 Technical
Workshop, May 30-31 2010, St Petersburg, Russia. (Online:
http://www.globalrust.org/db/attachments/bgriiwc/24/2/07-kang-ca-A4-embargo.pdf
accessed on December 14, 2010).
28. Li, Z. Q., and Zeng, S. M. 2002. Wheat rusts in China. China Agricultural Press, Beijing.
29. Line, R. F. 2002. Stripe rust of wheat and barley in North America: a retrospective
historical review. Annu. Rev. Phytopathol. 40:75-118.
30. Line, R. F., and Qayoum, A. 1992. Virulence, aggressiveness, evolution, and distribution
of races of Puccinia striiformis (the cause of stripe rust of wheat) in North America, 1968-

130
87. Technical Bulletin Number 1788. United States Department of Agriculture,
Agricultural Research Service.
31. Ma, Z. H., Shi, S. D., Jiang, Y. Y., and Zhao, Z. H. 2005. Climate-based regional
classification for oversummering of Puccinia striiformis in China with GIS. Acta
Phytopathol. Sin. 34:455-462.
32. Maddison, A. C., and Manners, J. G. 1973. Lethal effects of artificial ultraviolet radiation
on cereal rust uredospores. Trans. Br. Mycol. Soc. 60:471-494.
33. McCracken, F. I., and Burleigh, J. R. 1962. Influence of light and temperature on in vitro
germination of Puccinia striiformis uredospores. Phytopathology 52:742 (Abstr.)
34. McFall, K. L., and Fowler, M. E. 2009. Overview of wheat classification and trade. Pages
439-454. In: Wheat: Science and Trade. B. F. Carver (Ed.), Wiley-Blackwell, Ames,
USA.
35. Milus, E. A., Seyran, E., and McNew, R. 2006. Aggressiveness of Puccinia striiformis f.
sp. tritici isolates in the South-Central United States. Plant Dis. 90:847-852.
36. Murray, G. M., Ellison, P. J., Watson, A., and Cullis, B. R. 1994. The relationship
between wheat yield and stripe rust as affected by length of epidemic and temperature at
the grain development stage of crop growth. Plant Pathol. 43:397-405.
37. Naoumova, N. A. M. 1937. Natural fluctuations of temperature and the duration of the
incubation period of Puccinia glumarum f. sp. tritici. Zaschita Rasteniy 12:51-66.
38. Peel, M. D., and Riveland, N. 1977. Winter wheat production in North Dakota. Extension
bulletin 33. (http://www.ag.ndsu.edu/pubs/plantsci/smgrains/eb33w.htm accessed on May
5, 2011).
39. Rapilly, F. 1979. Yellow rust epidemiology. Annu. Rev. Phytopathol. 17:59-73.

131
40. Shaner, G., and Powelson, R. L. 1971. Epidemiology of stripe rust of wheat, 1961-1968.
Oreg. Agric. Exp. Stn. Tech. Bull. 117.
41. Shaner, G., and Powelson, R. L. 1973. The oversummering and dispersal of inoculum of
Puccinia striiformis in Oregon. Phytopathology 63:13-17.
42. Sharma-Poudyal, D., and Chen, X. M. 2011. Models for predicting potential yield loss of
wheat caused by stripe rust in the US Pacific Northwest. Phytopathology 101:544-554.
43. Sharp, E. L. 1965. Prepenetration and postpenetration environment and development of
Puccinia striiformis on wheat. Phytopathology 55:198-203.
44. Sharp, E. L., and Hehn, E. R. 1963. Overwintering of stripe rust in winter wheat in
Montana. Phytopathology 53:1239-40.
45. Shi, S. D., and Ma, Z. H. 2005. Climate-based regional classification for overwintering of
Puccinia striiformis in China with GIS and geostatistics. ACTA Phytophylacica Sin.
32:29-32.
46. Singh, R. P, Hodson, D. P., Jin, Y., Huerta-Espino, J. M., Kinyua, G., Wanyera, R., Njau,
P. and Ward, R. W. 2006. Current status, likely migration and strategies to mitigate the
threat to wheat production from race Ug99 (TTKS) of stem rust pathogen. CAB Reviews:
perspectives in agriculture, veterinary science, nutrition and natural resources 1, No. 054.
47. Smilanick, J. L., and Mansour, M. F. 2007. Influence of temperature and humidity on
survival of Penicillium digitatum and Geotrichum citri-aurantii. Plant Dis. 91:990-996.
48. Stakman, E.C. 1934. Epidemiology of Cereal Rusts. Proc. Pac. Sci. Congr., 5th, 1933 vol.
4, Pp. 3177-3184.

132
49. Stubbs, R. W. 1985. Stripe rust. Pages 61-101. In: The Cereal Rusts, Vol. II. Diseases,
Distribution, Epidemiology, and Control. A.P. Roelfs, and W.R. Bushnell (Eds.). Orlando,
FL: Academic Press.
50. Sutton, J. C. 1988. Predictive value of weather variables in the epidemiology and
management of foliar diseases. Fitopatol. Bras. 13:305-12
51. Theobald, D. M. 2005. GIS concepts and ArcGIS methods, 2nd
Ed. Conservation Planning
Technologies. Fort Collins, USA. p 278.
52. Tollenaar, H., and Houston, B. R. 1966. Effect of temperature during uredospore
production and light on in vitro germination of urediniospores of Puccinia striiformis.
Phytopathology 56:787-790.
53. Tollenaar, H., and Houston, B. R. 1967. A study on the epidemiology of stripe rust,
Puccinia striiformis West., in California. Can. J. Bot. 45:291-307.
54. Tu, J. C. 1967. The summer biology of Puccinia striiformis West. In Southeastern
Washington. PhD thesis, Department of Plant Pathology, WSU, Pullman, WA.
55. Venette, R. C., and Cohen, S. D. 2006. Potential climatic suitability for establishment of
Phytophthora ramorum within the contiguous United States. Forest Ecol. Manag. 231:18-
26.
56. Waggoner, P. E., and Aylor, D. E. 2000. Epidemiology: A science of patterns. Annu. Rev.
Phytopathol. 38:71-94.
57. Wang, H., Yang, X. B., and Ma, Z. 2010. Long-distance spore transport of wheat stripe
rust pathogen from Sichuan, Yunnan, and Guizhou in southwestern China. Plant Dis.
94:873-880.
133
58. Zadoks, J. C. 1961. Yellow rust on wheat, studies in epidemiology and physiologic
specialization. Neth. J. Plant Pathol. 67:69-256.

134
CHAPTER FOUR
Virulence characterization of international collections of the wheat stripe rust pathogen
ABSTRACT
Wheat stripe rust (yellow rust, Yr), caused by Puccinia striiformis f. sp. tritici (Pst), is an
economically important disease of wheat worldwide. Virulence information of Pst
populations is important to implement effective disease control with resistant cultivars. A
total of 235 Pst isolates from Algeria, Australia, Canada, Chile, China, Hungary, Kenya,
Nepal, Pakistan, Russia, Spain, Turkey, and Uzbekistan were tested on 20 single Yr-gene lines
and the 20 wheat genotypes that are used to differentiate Pst races in the U.S. The 235
isolates were identified as 114 races on the single-gene lines and 160 races on the U.S.
differentials. Virulences to YrA, Yr2, Yr6, Yr7, Yr8, Yr9, Yr17, Yr25, YrUkn, Yr27, Yr28,
Yr31, YrExp2, Lemhi (Yr21), Paha (YrPa1, YrPa2, YrPa3), Druchamp (Yr3a, YrD, YrDru),
Produra (YrPr1, YrPr2), Stephens (Yr3a, YrS, YrSte), Lee (Yr7, Yr22, Yr23), Fielder (Yr6,
Yr20), Tyee (YrTye), Tres (YrTr1, YrTr2), Express (YrExp1, YrExp2), Clement (Yr9, YrCle),
and Compair (Yr8, Yr19) were detected in all countries. At least 80% of the isolates were
virulent on YrA, Yr2, Yr6, Yr7, Yr8, Yr17, YrUkn, Yr28, Yr31, YrExp2, Yr21, Produra (YrPr1,
YrPr2), Stephens (Yr3a, YrS, YrSte), Lee (Yr7, Yr22, Yr23), and Fielder (Yr6, Yr20).
Virulences to Yr1, Yr9, Yr25, Yr27, Heines VII (Yr2, YrHVII), Paha (YrPa1, YrPa2, YrPa3),
Druchamp (Yr3a, YrD, YrDru), Yamhill (Yr2, Yr4a, YrYam), Tyee (YrTye), Tres (YrTr1,
YrTr2), Hyak (Yr17, YrTye), Express (YrExp1, YrExp2), Clement (Yr9, YrCle), and Compair
(Yr8, Yr19) were moderately frequent (>20-<80%). Virulences to Yr10, Yr24, Yr32, YrSP,

135
and Moro (Yr10, YrMor) were low (≤20%). Virulence to Moro was absent in Algeria,
Australia, Canada, Russia, Spain, Turkey and China, but 10% of the Chinese isolates were
virulent to Yr10. None of the isolates from Canada, China, and Kenya were virulent to Yr24;
none of the isolates from Algeria, Australia, Canada, Nepal, Russia, and Spain were virulent
to Yr32; none of the isolates from Australia, Canada, Chile, Hungary, Kenya, Nepal, Pakistan,
Russia, and Spain, were virulent to YrSP; and none of the isolates from all countries were
virulent to Yr5 and Yr15. Although the frequency of virulence factors were different, most of
the Pst isolates from these countries shared common virulence factors.
Additional keywords: Triticum aestivum, yellow rust
INTRODUCTION
Stripe rust (yellow rust), caused by Puccinia striiformis Westend. f. sp. tritici Eriks.
(Pst), is a worldwide economically important disease of wheat (Stubbs 1985; Line 2002; Chen
2005). Frequent and severe disease epidemics are common in major wheat growing countries
(Wellings 2011). Among the countries in the Americas, stripe rust is especially important in
the U.S. (Chen 2005), Mexico, Chile, and other Andean countries (CPC 2005). Similarly,
stripe rust has been a serious problem in Europe, the Middle East (Stubbs 1985; Wellings
2011), Central Asia (Morgounov et al. 2005), China (W. Q. Chen et al. 2009), and the
northern Indian subcontinent (Singh et al. 2004). In Africa, the disease occurs on wheat
grown on the highlands of Ethiopia, Kenya, and Uganda (CPC 2005; Stubbs 1988). In recent
decades, wheat stripe rust has spread into new areas and has become important in Australia,
New Zealand, and South Africa (Wellings 2011).

136
Cultivation of resistant cultivars is the most economically effective method for stripe
rust management and minimizes environmental impacts by reducing the use of fungicides
(Line 2002; Chen 2005). However, within a few years of deploying cultivars with a race-
specific resistance genes new virulent races (pathotypes) of the rust pathogen often emerge
(Line and Qayoum 1992; Stubbs 1988; Singh et al. 2004). As a result, new races can render
previously resistant cultivars susceptible (Stubbs 1985; Chen 2005). Severe stripe rust
epidemics are often due to the emergence of new races that cause failure of resistance genes
(Chen 2007). For example in China, more than 80% of the released cultivars in the late 1980s
had Yr9 and as a result, a new race virulent on Yr9 was reported in 1985; this race
subsequently caused an epidemic resulting in yield loss of 2.65 million tons in 1990 (Wan et
al. 2004; W. Q. Chen et al. 2009). Similarly, Yr27 has been widely used in wheat cultivars
grown in India and Pakistan and the emergence of new races virulent to Yr27 has been
reported in South Asia between 2002 and 2004 (Singh et al. 2004). Serious stripe rust
outbreaks in south and central Asian countries in 2009 have been attributed to races virulent
to Yr27 (BGRI 2010). These epidemics are further aggravated when new races possess more
complex virulence combinations evolved through mutation, recombination, or migration over
long distance (Stubbs 1988; Singh et al. 2004; Wellings 2011). Such epidemics result in
application of a large amount of fungicides to manage the disease that would otherwise cause
substantial yield loss (Chen 2005; Chen 2007).
Monitoring Pst races should be a high priority in all epidemic regions in the world as
the rust urediniospores can be wind transported over long distances (Singh et al. 2004).
Frequent monitoring of the virulence spectra of Pst isolates and identification of new races are
prerequisite to devising effective disease management strategies through resistance breeding

137
and prediction of future races (McIntosh and Brown 1997). Identification of virulent races is
also essential for the characterization of non-race specific resistance (Chen 2005). Virulence
information can be useful to screen cultivars or breeding lines so that the current resistance
level can be determined. It will also be useful in exploring new resistance genes. In addition,
virulence monitoring of stripe rust pathogen populations in different regions helps to
understand the current genetic variability of both host and pathogen interactions.
Virulence of the stripe rust pathogen has been studied routinely at a national scale
(Chen 2005; W. Q. Chen et al. 2009); however, few studies have reported comparing
virulence at an international scale. Stubbs (1988) reviewed and narrated the regional
distribution of stripe rust virulence in Africa, Asia, Europe, and Americas. Recently,
Hovemøller et al. (2008) carried out a virulence study of international collections of Pst but
isolates were predominantly from Denmark and the Red Sea Area. In addition, the study
mainly focused on the spread of aggressive strains rather than all virulences. Therefore, the
objectives of this study were to identify virulence and race, determine their frequency and
distribution of Pst collections made from different wheat growing countries.
MATERIALS AND METHODS
Isolate collection and spore production. A total of 235 Pst isolates were analyzed.
Pst collections were 1 from Algeria, 5 from Australia, 5 from Canada, 15 from Chile, 60 from
China, 4 from Hungary, 4 from Kenya, 21 from Nepal, 46 from Pakistan, 2 from Russia, 2
from Spain, 54 from Turkey, and 16 from Uzbekistan. Leaf samples bearing stripe rust
uredinia were stored at 4oC upon receipt; urediniospores were revived and increased as soon
as possible from the leaf samples. Each leaf sample was cut into pieces about 3 cm in length

138
and incubated on moist blotting paper in Petri dishes overnight at temperatures gradually
cycling from 15o to 4
o to 15
oC. Fresh urediniospores produced on the leaf surface were
inoculated with a clean fine paint brush on leaves of susceptible winter wheat cultivar
‘Nugaines’ that was grown in plastic pots to the two-leaf stage. Isolates stored as
urediniospores in liquid nitrogen were reactivated by submerging spore-containing glass vials
or foil bags in a water bath at 50oC for 2 min and inoculated on Nugaines seedlings to
increase urediniospores (Chen et al. 2010). Nugaines was grown in plastic pots (7 x 7 x 7 cm)
filled with a potting mixture of 24 L peat moss, 8 L perlite, 12 L sand, 12 L commercial
potting soil mix, 16 L vermiculite and 250 g 14-14-14 Osmocote fertilizer. Plants were grown
in a rust-free greenhouse prior to inoculation. Inoculated plants were kept in a dew chamber
for at least 12 h at 10oC, and then transferred into a temperature-controlled growth chamber.
The temperature of the growth chamber was programmed between a minimum of 4°C at 2:00
am during the 8 h dark period and a maximum of 20°C at 2:00 pm during the 16-h light
period. Metal halide lights were used as a supplement to the daylight of a 16 h photoperiod.
Inoculated seedlings were isolated from each other with a transparent plastic cylinder
surrounding each pot to prevent cross-contamination (Chen et al. 2002). Urediniospores were
collected 16 days after inoculation and spore collection was repeated 3 to 4 times until
sufficient quantities were harvested (ca. 20 mg). Urediniospores were dried in a desiccator at
4oC for 1 week before being stored at 4
oC for short term (up to 2 months) or in liquid nitrogen
for long term (years). Fresh urediniospores or those stored at 4oC within 2 months were tested
on wheat differentials (Chen et al. 2010).
Evaluation of Pst races. Twenty single Yr-gene lines and 20 wheat genotypes used to
differentiate races of Pst in the U.S. (Chen et al. 2002, 2010) (Table 1) were used to identify
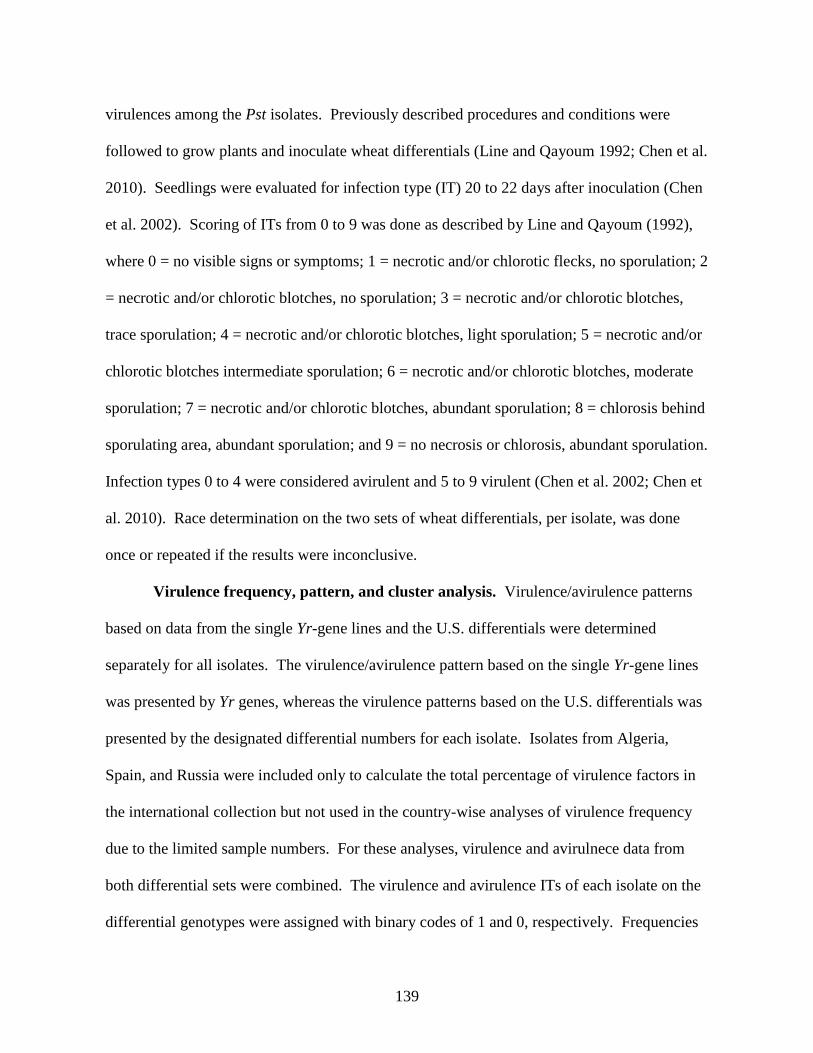
139
virulences among the Pst isolates. Previously described procedures and conditions were
followed to grow plants and inoculate wheat differentials (Line and Qayoum 1992; Chen et al.
2010). Seedlings were evaluated for infection type (IT) 20 to 22 days after inoculation (Chen
et al. 2002). Scoring of ITs from 0 to 9 was done as described by Line and Qayoum (1992),
where 0 = no visible signs or symptoms; 1 = necrotic and/or chlorotic flecks, no sporulation; 2
= necrotic and/or chlorotic blotches, no sporulation; 3 = necrotic and/or chlorotic blotches,
trace sporulation; 4 = necrotic and/or chlorotic blotches, light sporulation; 5 = necrotic and/or
chlorotic blotches intermediate sporulation; 6 = necrotic and/or chlorotic blotches, moderate
sporulation; 7 = necrotic and/or chlorotic blotches, abundant sporulation; 8 = chlorosis behind
sporulating area, abundant sporulation; and 9 = no necrosis or chlorosis, abundant sporulation.
Infection types 0 to 4 were considered avirulent and 5 to 9 virulent (Chen et al. 2002; Chen et
al. 2010). Race determination on the two sets of wheat differentials, per isolate, was done
once or repeated if the results were inconclusive.
Virulence frequency, pattern, and cluster analysis. Virulence/avirulence patterns
based on data from the single Yr-gene lines and the U.S. differentials were determined
separately for all isolates. The virulence/avirulence pattern based on the single Yr-gene lines
was presented by Yr genes, whereas the virulence patterns based on the U.S. differentials was
presented by the designated differential numbers for each isolate. Isolates from Algeria,
Spain, and Russia were included only to calculate the total percentage of virulence factors in
the international collection but not used in the country-wise analyses of virulence frequency
due to the limited sample numbers. For these analyses, virulence and avirulnece data from
both differential sets were combined. The virulence and avirulence ITs of each isolate on the
differential genotypes were assigned with binary codes of 1 and 0, respectively. Frequencies

140
Table 1. Wheat genotypes used to differentiate Puccinia striiformis f. sp. tritici races
Single Yr gene linesa U.S. differentials
No. Name Yr gene Name Yr gene
1 AvSYrANIL YrA Lemhi Yr21
2 AvSYr1NIL Yr1 Chinese 166 Yr1
3 Siete Cerros T66 Yr2 Heines VII Yr2,YrHVII
4 AvSYr5NIL Yr5 Moro Yr10,YrMor
5 AvSYr6NIL Yr6 Paha YrPa1,YrPa2,YrPa3
6 AvSYr7NIL Yr7 Druchamp Yr3a,YrD,YrDru
7 AvSYr8NIL Yr8 AvSYr5NIL Yr5
8 AvSYr9NIL Yr9 Produra YrPr1,YrPr2
9 AvSYr10NIL Yr10 Yamhill Yr2,Yr4a,YrYam
10 AvSYr15NIL Yr15 Stephens Yr3a,YrS,YrSte
11 AvSYr17NIL Yr17 Lee Yr7,Yr22,Yr23
12 AvSYr24NIL Yr24 Fielder Yr6,Yr20
13 TP981 Yr25 Tyee YrTye
14 AvSYrUknNIL YrUknb Tres YrTr1,YrTr2
15 AvSYr27NIL Yr27 Hyak Yr17,YrTye
16 AvSYr28NIL Yr28 Express YrExp1,YrExp2
17 AvSYr31NIL Yr31 AvSYr8NIL Yr8
18 AvSYr32NIL Yr32 AvSYr9NIL Yr9
19 AvSYrSpNIL YrSP Clement Yr9,YrCle
20 AvS/EXP1/1-1 Line 74 YrExp2 Compair Yr8,Yr19
a The Yr gene lines are in the ‘Avocet Susceptible’ (AvS) background.
b YrUkn was included in the study initially as Yr26, but later it was found not to be Yr26 and
also different from any known genes used in differentials.

141
were calculated for all virulence factors. Virulence relationships among the isolates were
analyzed using the NTSYSpc software version 2.10e (Applied Biostatistics Inc., New York,
NY) (Chen et al. 2010). A similarity matrix based on simple matching coefficient was
generated and cluster analysis was performed based on similarity matrix to generate a
dendrogram using the unweighted pair group arithmetic mean (UPGMA) method (Rohlf
2000). Correlation coefficient between cophenetic matrix and similarity matrix was
calculated using the Mantel test. Robustness of the dendrogram branches was determined
with Bootstrap analysis with Winboot programs (Nelson et al. 1994;
http://archive.irri.org/science/software/winboot.asp). In addition, three dimensional principal
coordinate plot was generated in NTSYSpc by transforming the similarity matrix using the
DCENTER module and then using EIGEN module. Eigen vectors calculated using the
SIMINT module compared with the DCENTER matrix to measure the extent of PC analysis
showed the pattern of relative distances among the isolates.
RESULTS
Virulences and their frequencies and distributions. Stripe rust isolates from
different countries differed in virulence frequencies and distributions except for Algeria,
Russia and Spain due limited number of sample (Table 2). At an international scale, the most
frequent virulences (≥80%) were to resistance genes YrA (90%), Yr2 (92%), Yr6 (93%), Yr7
(91%), Yr8 (80%), Yr17 (88%), YrUkn (89%), Yr31 (99%), YrExp2 (89%), Yr21 (98%), and
U.S. differentials 8 (81%), 10 (92%), 11 (84%), and 12 (85%). Moderately frequent
virulences (>20-<80%) included Yr1 (52%), Yr9 (68%), Yr25 (40%), Yr27 (75%), U.S.
differentials 3 (58%), 5 (71%), 6 (43%), 9 (36%), 13 (42%), 14 (47%), 15 (32%), 16 (73%),

142
19 (54%), and 20 (71%). The least frequent virulences (≤20%) were to Yr10 (10%), Yr24
(11%), Yr32 (12%), YrSP (9%), and Moro (6%). None of the isolates were virulent to Yr5
and Yr15.
Out of 36 single Yr genes or gene combinations of the two sets of differentials,
virulence to 25 lines, YrA, Yr2, Yr6, Yr7, Yr8, Yr9, Yr17, Yr25, YrUkn, Yr27, Yr28, Yr31,
YrExp2 and U.S. differentials 1, 5, 6, 8, 10, 11, 12, 13, 14, 16, 19, and 20 was observed in all
countries. All isolates from these countries were virulent on Yr21 except for five isolates
from Pakistan. More than 50% of isolates from these countries were virulent to YrA, Yr2,
Yr6, Yr17, YrUkn, and U.S. differentials 1, 10, and 12. All isolates from Canada, China,
Hungary, Nepal, and Uzbekistan were virulent to YrA. Similarly, all isolates from Australia,
Canada, Chile, Hungary, Kenya, Nepal, and Uzbekistan were virulent to Yr2 and Yr31. All
isolates from Turkey were virulent to Yr31. All isolates from Canada, Hungary, and Nepal
were virulent to both Yr6 and Yr7, whereas all isolates from Uzbekistan and Kenya were
virulent on Yr6 and Yr7, respectively. Virulence on Stephens was detected in all isolates from
Australia, Canada, Hungary, and Uzbekistan.

143
Table 2. Number and frequency (%) of virulence Puccinia striiformis f. sp. tritici isolates collected from different countries on
single Yr-gene lines and U.S. differentials.
Number (No) and frequency (%) of virulence in P. striiformis f. sp. tritici isolates from different countriesa
Yr Total AU CA CL CN HU KE NP PK TR UZ
No gene (%) No % No % No % No % No % No % No % No % No % No %
Single Yr-gene lines
1 A 90 4 80 5 100 9 60 61 100 4 100 3 75 21 100 32 70 53 98 16 100
2 1 52 2 40 0 0 4 27 25 41 2 50 4 100 15 71 26 57 21 39 14 88
3 2 92 5 100 5 100 15 100 56 92 4 100 4 100 21 100 41 89 49 91 16 100
4 5 0 0 0 0 0 0 0 0 0 0 0 0 0 0 0 0 0 0 0 0 0
5 6 93 3 60 5 100 9 60 57 93 4 100 3 75 21 100 44 96 52 96 16 100
6 7 91 2 40 5 100 12 80 58 95 4 100 4 100 21 100 42 91 51 94 10 63
7 8 80 1 20 3 60 6 40 54 89 3 75 3 75 18 86 34 74 51 94 10 63
8 9 68 2 40 3 60 5 33 31 51 3 75 4 100 12 57 39 85 40 74 16 100
9 10 10 0 0 0 0 5 33 6 10 2 50 1 25 5 24 5 11 0 0 1 6
10 15 0 0 0 0 0 0 0 0 0 0 0 0 0 0 0 0 0 0 0 0 0
11 17 88 5 100 5 100 14 93 42 69 4 100 4 100 19 90 45 98 50 93 15 94
12 24 11 1 20 0 0 4 27 1 2 1 25 0 0 1 5 13 28 4 7 1 6
13 25 40 1 20 1 20 6 40 20 33 3 75 2 50 8 38 18 39 22 41 12 75
14 Ukn 89 4 80 4 80 10 67 50 82 2 50 3 75 21 100 45 98 52 96 16 100
15 27 75 3 60 5 100 5 33 41 67 3 75 2 50 17 81 38 83 45 83 12 75
16 28 80 4 80 5 100 13 87 37 61 4 100 1 25 19 90 36 78 50 93 15 94
17 31 99 5 100 5 100 15 100 60 98 4 100 4 100 21 100 45 98 54 100 16 100
18 32 12 0 0 0 0 6 40 2 3 2 50 1 25 0 0 13 28 4 7 1 6
19 SP 9 0 0 0 0 0 0 15 25 0 0 0 0 0 0 0 0 4 7 2 13
20 Exp2 89 2 40 5 100 12 80 57 93 4 100 4 100 20 95 43 93 49 91 10 63

144
U.S. differentials
1 21 98 5 100 5 100 15 100 61 100 4 100 4 100 21 100 41 89 54 100 16 100
2 1 52 2 40 0 0 4 27 25 41 2 50 4 100 15 71 26 57 21 39 14 88
3 2,HVII 58 5 100 3 60 4 27 23 38 4 100 1 25 10 48 33 72 35 65 14 88
4 10,Mor 6 0 0 0 0 4 27 0 0 2 50 0 0 4 19 5 11 0 0 1 6
5 Pa1,Pa2,Pa3 71 5 100 1 20 5 33 49 80 3 75 2 50 17 81 31 67 34 63 16 100
6 3a,D,Dru 43 4 80 1 20 7 47 24 39 2 50 2 50 10 48 17 37 17 31 14 88
7 5 0 0 0 0 0 0 0 0 0 0 0 0 0 0 0 0 0 0 0 0 0
8 Pr1,Pr2 81 3 60 4 80 7 47 56 92 4 100 1 25 18 86 35 76 47 87 14 88
9 2,4a,Yam 36 1 20 1 20 6 40 21 34 2 50 0 0 6 29 11 24 25 46 11 69
10 3a,S,Ste 92 5 100 5 100 12 80 55 90 4 100 3 75 20 95 39 85 52 96 16 100
11 7,22,23 84 2 40 5 100 10 67 53 87 4 100 3 75 18 86 40 87 50 93 10 63
12 6,20 85 3 60 4 80 9 60 42 69 4 100 4 100 20 95 43 93 52 96 16 100
13 Tye 42 1 20 2 40 1 7 25 41 3 75 2 50 9 43 22 48 21 39 13 81
14 Tr1,Tr2 47 1 20 4 80 6 40 38 62 2 50 1 25 9 43 21 46 23 43 5 31
15 17,Tye 32 2 40 2 40 0 0 20 33 2 50 1 25 2 10 20 43 18 33 9 56
16 Exp1,Exp2 73 2 40 4 80 7 47 43 70 4 100 4 100 20 95 35 76 41 76 8 50
17 8 80 1 20 3 60 6 40 54 89 3 75 3 75 18 86 34 74 51 94 10 63
18 9 68 2 40 3 60 5 33 31 51 3 75 4 100 12 57 39 85 40 74 16 100
19 9,Cle 54 1 20 3 60 4 27 25 41 3 75 3 75 9 43 25 54 38 70 15 94
20 8,19 71 1 20 3 60 5 33 51 84 3 75 3 75 15 71 30 65 43 80 7 44
a AU= Australia, CA= Canada, CL = Chile, CN = China, HU = Hungary, KE = Kenya, NP = Nepal, PK = Pakistan, TR = Turkey, and UZ = Uzbekistan. Isolates from Algeria, Spain, and Russia
were used to calculate the total virulence percentage (%) but country-wise virulence frequency was not calculated for the three countries due to the limited sample numbers.

145
Virulences to Yr1, Yr10, Yr24, Yr32, YrSP, and U.S. differentials 3, 4, 9, and 15, were
present but not in all countries. None of the isolates from Australia, Canada, and Turkey were
virulent to Yr10 and Moro. None of the Chinese Pst isolates were virulent on Moro (Yr10,
YrMor) but some were (10%) virulent to Yr10. None of the isolates from Canada, China, and
Kenya, were virulent to Yr24; none of the isolates from Australia, Canada and Nepal were
virulent to Yr32; and none of the isolates from Australia, Canada, Chile, Hungary, Kenya,
Nepal, and Pakistan were virulent to YrSP. Only isolates from Chile were virulent to Hyak
(Yr17, YrTye).
Isolates from Algeria, Russia, and Spain, not included in the country-wise frequency
analysis (Table 2), were virulent to Yr2, Yr6, Yr7, Yr8, Yr9, Yr17, YrUkn, Yr28, Yr31 and U.S.
differential 1 and 10. All of these isolates were avirulent to Yr5, Yr10, Yr15, Yr24, Yr32 and
U.S. differentials 4 and 15. In addition, the isolates from Algeria and Spain were avirulent to
YrSP and U.S. differentials 6 and 9 (Supplement Table 1).
Race distribution and frequency. More races were identified based on U.S.
differentials for most countries than those based on single Yr-gene lines. Of the 235 isolates,
U.S. wheat differentials identified 160 races whereas the single Yr-gene lines identified 114
races (Table 3). The virulence/avirulence patterns of the 235 international isolates on the 20
single Yr-gene lines and the 20 U.S. wheat differentials are listed in Supplemental Table 1.
Among the 114 races identified with the single Yr-gene lines, 80 were detected only once.
The most frequent (23%) race was virulent on resistance genes YrA, Yr2, Yr6, Yr7, Yr8, Yr9,
Yr17, YrUkn, Yr27, Yr28, Yr31, and YrExp2; and avirulent to Yr1, Yr5, Yr10, Yr15, Yr24,
Yr25, Yr32, and YrSP. This race was detected in isolates from Algeria, Canada, China, Spain,
Pakistan, and Turkey.

146
The highest frequency (94%) for two virulence factors was to Yr2 and Yr31. Similarly
the highest frequencies for three, four, and five virulence factors in combination were 87%
(Yr2, Yr6 and Yr31), 80% (Yr2, Yr6, Yr7, and Yr31), and 75% (YrA, Yr2, Yr6, Yr7, and Yr31),
respectively. These virulence combinations were present in all countries.
Of the 160 races based on U.S. differentials, 122 were detected from only one isolate. The
most frequent (11%) race, which was virulent on U.S. differentials 1 (Yr21), 5 (YrPa1, YrPa2,
YRPa3), 8 (YrPr1, YrPr2), 10 (Yr3a, YrS, YrSte), 12 (Yr6, Yr20), 14 (YrTr1, YrTr2), 16
(YrExp1, YrExp2), 17 (Yr8), and 20 (Yr8, Yr19); and avirulent on 2 (Yr1), 3 (Yr2, YrHVII), 4
(Yr10, YrMor), 6 (Yr3a, YrD, YrDru), 7 (Yr5), 9 (Yr2, Yr4a, YrYam), 11 (Yr7, Yr22, Yr23), 13
(YrTye), 15 (Yr17, YrTye), 18 (Yr9), and 19 (Yr9, YrCle), was detected in isolates from China,
Chile, Nepal, and Turkey. Twenty one of the virulence patterns obtained from the
international isolates resembled races identified in the U.S. (Supplemental Table 1).
Virulence on U.S. differentials 1 and 10 appeared together at the highest frequency (91%).
The highest frequencies for combinations of virulences on three (1,10,11 and 1,10,12 ) and
four (1, 10, 11, 12), of the U.S. differentials were 78% and 70%, respectively. These
virulence combinations were detected in all of the countries.
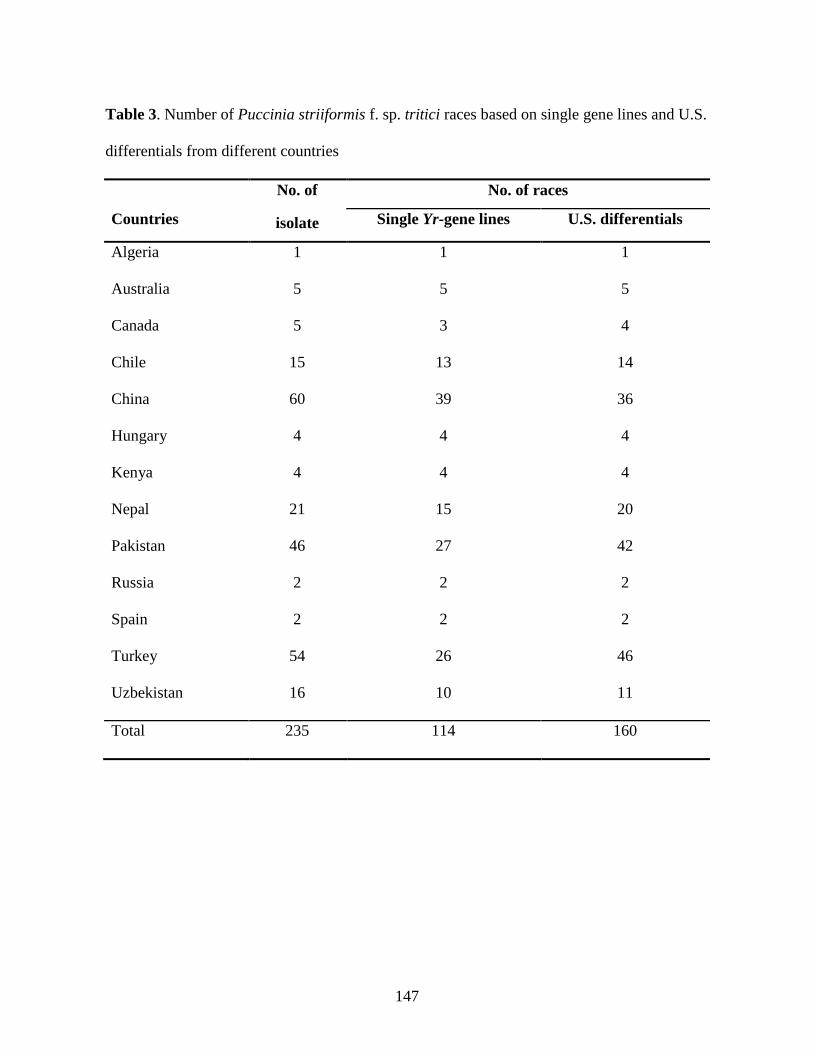
147
Table 3. Number of Puccinia striiformis f. sp. tritici races based on single gene lines and U.S.
differentials from different countries
No. of No. of races
Countries isolate Single Yr-gene lines U.S. differentials
Algeria 1 1 1
Australia 5 5 5
Canada 5 3 4
Chile 15 13 14
China 60 39 36
Hungary 4 4 4
Kenya 4 4 4
Nepal 21 15 20
Pakistan 46 27 42
Russia 2 2 2
Spain 2 2 2
Turkey 54 26 46
Uzbekistan 16 10 11
Total 235 114 160

148
Cluster analysis. Cluster analysis was performed on combined virulence/avirulence
data obtained from the single Yr-gene lines and the U.S. differentials. A cutoff point of 0.75
similarity coefficient was determined based on mean value of similarity range. In general,
isolates from different countries were grouped together in the same groups. All 235
international isolates clustered into 10 virulence groups (VGs) (Fig. 1). These 10 VGs were
further grouped into two super virulence groups at a similarity coefficient of 0.51. The first
super group consisted of VG 1 to VG 7 and accounted for 96% of the isolates; the second
super group consisted of VG 8 to VG 10 and accounted for 4% of the isolates. Isolates
belonging to VGs 8-10 had narrower virulence spectra than those in VGs 1 to 7. VGs 1 and 3
were the largest groups and accounted for 80% of isolates. VG 1 had 75 isolates (33%) [all
virulent to Yr1, YrA, Yr6, Yr31, and Stephens (Yr3a, YrS, YrSte)] from all countries except
Canada and Chile, with an average similarity of 76% (Supplemental Fig. 1). VG 3 was the
largest group with 111 (48%) isolates from all countries except Hungary, having similarity of
about 76% (Supplemental Fig. 2). Isolates belonging to VG 3 had different frequencies of
virulence on all differentials tested except Yr5 and Yr15. Isolates belonging to VG 2 were
virulent to YrA, Yr1, Yr2, Yr7, Yr9, Yr31, YrExp2 and U.S. differentials 1, 3, 10, 13 and 20.
These isolates were all avirulent to Yr5, Yr10, Yr15, Yr17, Yr24, YrUkn, Yr32, YrSP and U.S.
differentials 4 and 16. Similarly, isolates belonging to VG 4 were all virulent to Yr2, Yr6,
Yr7, Yr9, Yr17, Yr31, YrExp2 and U.S. differential 8, 10, 12, and 16. These isolates were
avirulent to Yr5, Yr10, Yr15, Yr25, Yr32, YrSP, and U.S. differential 3, 4, 9, 11, 15, and 19.
The isolates in VG 5 all had virulences to YrA, Yr2, Yr6, Yr7, Yr8, Yr9, Yr17, Yr31, YrExp2,
and U.S. differentials 1, 8, 12, 19, and 20. These isolates were avirulent on Yr5, Yr15, YrSP,

149
Fig. 1. Dendrogram based on virulence phenotypes of Puccinia striiformis f. sp. tritici on 20
single Yr-gene lines and 20 U.S. differentials using the unweighted pair group arithmetic
mean (UPGMA) method. Numbers along the nodes are bootstrap values >30%. AU =
Australia, CA = Canada, CL = Chile, CN = China, HU = Hungary, KE = Kenya, NP = Nepal,
PK = Pakistan, TR = Turkey, and UZ = Uzbekistan. Four isolates did not belong to any group
were not shown.

150
Fig 2. Three-dimensional principal coordinate plots of Puccinia striiformis f. sp. tritici
isolates based on virulence and avirulence phenotypes on the single Yr-gene lines and U.S.
wheat differentials.

151
and U.S. differential 9. VG 6 isolates were all virulent on Yr2, Yr7, Yr17, Yr28, Yr31,
YrExp2, and U.S. differential 1; and were all avirulent to Yr1, Yr5, Yr8, Yr10, Yr15, Yr32,
YrSP, and U.S. differentials 4 and 20. The isolates in VG 7 were virulent to YrA, Yr1, Yr6,
Yr7, Yr9, Yr31 and U.S. differentials 2, 5, 8, 13, and 19.
In general, isolates in VGs 8-10 had a narrow virulence spectrum as compared to those
of VGs 1-7. Isolates in VG 8 were all virulent to Yr2, Yr17, Yr27, Yr31 and U.S. differentials
1, 3, 5, 6, and 10. The VG 9 isolates had virulences to Yr2, Yr6, Yr17, YrUkn, Yr31 and U.S.
differentials 1, 3, 12, 13, and 15. These isolates were avirulent to rest of the other Yr genes or
differential cultivars. All isolates in VG 10 were virulent on Yr2, Yr10, Yr31, Yr32 and U.S.
differentials 1, 5, and 14 and some of them were virulent to Yr17, Yr24, YrUkn, Yr28 and U.S.
differentials 3 and 4, while the others differential cultivars were resistant to the VG 10
isolates.
Out of the 235 isolates, four isolates, one each from Chile (virulent on YrA, Yr1, Yr2,
Yr6, Yr7, Yr8, Yr9, Yr10, Yr17, Yr25, YrUkn, Yr28, Yr31, Yr32, YrExp2 and U.S. differentials
1, 2, 4, 6, 8, 9, 10, 11, 12, 16, 17, 18, 19), China (virulent on YrA, Yr1, Yr2, Yr7, Yr9, Yr17,
Yr27, Yr28, Yr31, YrSP, YrExp2 and U.S. differentials 1, 2, 5, 6, 8, 10, 11, 13, 15, 18), Kenya
(YrA, Yr1, Yr2, Yr7, Yr8, Yr9, Yr17, Yr25, YrUkn, Yr31, YrExp2 and U.S. differentials 1, 2, 3,
6, 11, 12, 13, 16, 17, 18, 19, 20), and Pakistan (Yr1, Yr2, Yr6, Yr7, Yr8, Yr9, Yr17, Yr24,
YrUkn, Yr27, Yr28, Yr31, YrEXP2 and U.S. differentials 2, 5, 6, 8, 10, 12, 13, 14, 16, 17, 18,
20) did not cluster into any group. These isolates were more diverse from each other and
from others than among the other isolates.
The three-dimensional principal coordinate analysis (PCA) showed the pair-wise
distance between isolates and groupings of isolates based on virulence data (Fig. 2). In

152
general isolates originating from different countries did not show group differentiation. These
results further supported the inclusion of isolates originating from different countries within
the same VGs revealed by the cluster analysis (Fig. 1). For example, isolates CL07-12 and
PK09-30, from Chile and Pakistan, respectively, had similar virulence. However, some
isolates were found to be distantly related even from the same country, for example, PK07-9
and PK06-3 from Pakistan (Fig. 2). The first dimension extracted 27% of the total virulence
variation. Second and third dimensions accounted for 15% and 7% of the total virulence
variation.
DISCUSSION
Twenty single Yr-gene lines and 20 U.S. wheat differentials were used to determine
virulences and races of 235 Pst isolates collected from 13 countries. The results revealed
common and unique virulences and races in the Pst populations in these countries. Races
differed among countries; however, most of the virulences were common among isolates from
different countries.
The Pst collections in different countries had 100% frequency for virulences to YrA,
Yr2, Yr6, Yr7, Yr31, Yr21, and Stephens (Yr3a, YrS, YrSte). Widespread deployment of
uniform resistance genes over large wheat growing regions eventually contributes to similar
or identical virulence frequencies in the Pst populations. For example, Yr2, Yr6, and Yr7 were
used extensively in Central Asia, West Asia, and North Africa and Pst races from these
regions are virulent on these genes (Bahri et al. 2011). Such populations might have been
fixed for these virulences. Our finding is consistent with previous reports that virulence to
YrA was common in all wheat growing continents (Stubbs et al. 1974; McIntosh et al. 1995).

153
Virulence for Yr2 was first recorded in 8156 cultivars in Turkey in 1967 and in 1970 it was
traced to the Indian subcontinent (Saari and Prescott 1985). Yr2 is very common in both
winter and spring wheat, and common in wheat distributed through CIMMYT (McIntosh et
al. 1995). In addition Yr2 avirulence gene in Pst is prone to mutation (Stubbs 1968).
Therefore virulence on Yr2 may have evolved simultaneously or migrated in all countries with
isolates tested in the present study. Stubbs (1985) also reported widespread presence of Yr2
in an international scale. The high frequency of Yr6 virulence in all countries may be
explained by presence of Yr6 in common wheat and durum wheat (Chilosi and Johnson 1990).
Similarly, the high frequency of Yr7 virulence may be due to the worldwide use of Yr7
through Thatcher (Yr7) and its presence in old cultivars or landraces (McIntosh et al. 1981).
Stubbs (1985) and Hovmøller et al. (2008) also reported worldwide distribution of Yr7
virulence. The widespread and high frequency virulence factors may have been fixed in
pathogen populations throughout the world.
The widespread and high frequency of Yr8 virulence may be due to worldwide use of
this gene from Aegilops comosa and its common presence in grasses (Stubbs 1985).
Virulence on Yr8 was detected in the Middle East in 1973 (Hakim and Mamluk 1996), in
England in 1978 (Johnson et al. 1978), in Australia in the 1980s (Wellings 1988), and in Iran
during 1997 to 1999 (Nazari and Torabi 2000). Virulence to Yr8 was detected in the U.S. in
2000 (Chen et al. 2002). The present study revealed that Yr8 virulence is widespread and this
finding agrees with the results of Hovmøller et al. (2008). Similarly, the high frequency of
Yr9 virulence and its presence in all isolates in the present study may have evolved from
extensive use of Yr9, originating from Petkus rye (Secale cereale), in wheat breeding
programs worldwide (Stubbs 1985; Rabinovich 1998). Yr9 virulence was first identified in

154
the former Soviet Union in 1973 and in the Netherlands in 1974 (Stubbs et al. 1977). Until
1996, races virulent to Yr9 were reported in other regions/countries from East Africa to South
Asia (Singh et al. 2004), in China (Wang et al. 1986), in South America (Ecuador, Colombia,
Ecuador, Bolivia, and Chile) and Mexico (Stubbs and Yang 1988), and in Australasia
(Wellings and Burdon 1992). Now it is common in most races identified after year 2000 in
the U.S. (Chen et al. 2010). The emergence and spread of Yr9-virulent races caused serious
stripe rust outbreaks in many major wheat growing regions (Chen et al 2002, 2010; Singh et
al. 2004; Chen 2005, 2007).
Cultivars with Yr27 were deployed extensively in Syria, Turkey, Iran, India, Pakistan,
and other south Asian countries to address the failure of Yr9. The wide cultivation of these
cultivars created selection pressure for the pathogen and thus emerged virulence on Yr27 in
South Asia during 2002-2004 (Singh et al. 2004). In the present study, the Yr9 and Yr27
virulences were common in isolates from Pakistan, Nepal, Turkey, and Uzbekistan. Use of
Yr9 and Yr27 led to the emergence of new races virulent on both Yr9 and Yr27 in the Middle
East and South Asia (Bahri et al. 2011). Serious stripe rust epidemics in Central and Western
Asia and North Africa during the 2010 wheat season were attributed to Yr27 lineages along
with the favorable weather conditions (BGRI 2010).
In the present study, Yr17 virulence was observed in 88% of all isolates and 98% of
Pakistan isolates. In contrast, Hovmøller et al. (2008) and Bahri et al. (2011) reported ca. 3%
in isolates collected from Azerbaijan, Australia, Denmark, Eritrea, France, Iran, Italy,
Kazakhstan, Kyrgistan, Mexico, Pakistan, South Africa, United Kingdom, the U.S.,
Uzbekistan, and Yemen; and only ca. 4% in Pakistan Pst population. The difference in the
Yr17 virulence frequencies might be due to different differential genotypes used in their study
155
and the present study. In their studies, Hovmøller et al. (2008) and Bahri et al. (2011) used
VPM1 (Yr17+) and the other Yr gene(s) in VPM1 might have masked the virulence to Yr17 in
their isolates. In the U.S. Pacific Northwest, the Yr17 single-gene line has been widely
susceptible, whereas VPM1 is still resistant (Chen, unpublished data).
Yr10 virulence has been reported in Eastern Europe, the eastern Mediterranean region
(including East Africa) and North America (Stubbs 1985; Hovmøller et al. 2008). The
presence of Yr10 virulence in Southeast Asia, Nepal, and Pakistan, was different with the
findings of Stubbs (1985) and Hovmøller et al. (2008). Virulence to Yr10 in low frequency
(10%) in China may have a serious implication as Yr10 has been reported to be effective
(Wan et al. 2004) and the gene has been widely used in breeding programs (Kang et al. 2010).
Pst collections in different countries shared most of the virulences, but their
frequencies and virulence spectra were different. These differences may have resulted from
selection benefits for certain races with new virulences, higher fitness, or aggressiveness
against resistance genes commonly deployed in the regions (McIntosh and Brown 1997,
Singh et al. 2004). Recombination reshuffles virulence genes and creates more genotypes or
races (Stubbs 1985; Jin et al. 2010). Somatic hybridization has shown to result in new races
(Little and Manngers 1969a; Wright and Lennard 1980). Mixed infection of races under field
conditions may facilitate nuclear migration through urediniospore germ tubes and infection
hyphae within plant tissue, which can lead to the development of new races (Little and
Manners 1969b). Furthermore, sexual recombination, although not proven under natural
conditions for Pst, may play a role in generating new races in areas where the alternate host,
barberry, coexists with wheat (Jin et al. 2010). However, the deployment of the same
resistance genes across different continents is more likely to select similar virulences in large

156
regions. The presence of similar virulences in the international collections and U.S.
populations (Chen and Wan 2011) suggests that the Pst population at the international scale
mostly possesses the same genetic background of virulence (Stubbs 1985). We are currently
characterizing these Pst collections using molecular markers, which will help us understand
genetic structure of the pathogen. In addition, this study will further clarify whether similar
races from different countries were due to convergent evolution or migration. Migration of
Pst has been reported within and among continents (Wellings 1988, 2007; Pretorius et al.
1997; Brown and Hovmøller 2002; Singh et al. 2004).
Virulence to Yr5 and Yr15 were not detected in this study. This result is consistent
with previous reports of rare detection of the virulences throughout the world. Yr5 was
originally identified in hexaploid Triticum aestivum subsp. spelta cv. Album. The gene
confers resistance to nearly all Pst isolates worldwide. Virulence to Yr5 has been reported
only in India and Australia (Nagarajan et al. 1986; Wellings and McInthos 1990), but at a
very low frequency. Yr15 is from T. turgidum var. dicoccoides (wild emmer) (Gerechter-
Amitai and Stubbs 1970). Yr15 virulence was reported in Afghanistan and Denmark,
otherwise lines with Yr15 are resistant to diverse Pst isolates from different geographical
origins (Gerechter-Amitai and Stubbs 1970; McIntosh et al. 1995; Hovmøller et al. 2008).
Thus, Yr5 and Yr15 still can be used in wheat breeding programs. However, use of the race-
specific genes alone may not provide long-lasting resistance. Therefore, effective race-
specific genes like Yr5 and Yr15 and race non-specific genes should be used in combination to
achieve sustainable control of stripe rust.

157
ACKNOWLEDGMENTS
This research was supported by the US Department of Agriculture, Agricultural
Research Service (Project No. 5348-22000-014-00D) and Washington State University
(Project No. 11W-3061-7824 and 13C-3061-3925) PPNS No. 0???, Department of Plant
Pathology, College of Agricultural, Human, and Natural Resource Sciences, Agricultural
Research Center, Project Number WNP00823, Washington State University, Pullman, WA
99164-6430, USA. We would like to thank Drs. D. A. Johnson and T. D. Murray for critical
review of the manuscript.
LITERATURE CITED
1. BGRI. 2010. Serious Outbreaks of Wheat Stripe or Yellow Rust in Central and West Asia
and North Africa – March/April 2010. (Online:
http://globalrust.org/traction?type=single&proj=Pathogen&rec=206 accessed on
December 7, 2010).
2. Brown, J. K. M., and Hovmøller, M. 2002. Aerial dispersal of pathogens on the global and
continental scales and its impact on plant disease. Science 297:537-541.
3. Chen, X. M., and Line, R. F. 1995. Gene action in wheat cultivars for durable high-
temperature adult-plant resistance and interactions with race-specific, seedling resistance
to stripe rust caused by Puccinia striiformis. Phytopathology 85: 567-572.
4. Chen, X. M., Moore, M., Milus, E. A., Long, D. L., Line, R. F., Marshall, D., and
Jackson, L. 2002. Wheat stripe rust epidemics and races of Puccinia striiformis f. sp.
tritici in the United States in 2000. Plant Dis. 86:39-46.

158
5. Chen, X. M. 2005. Epidemiology and control of stripe rust [Puccinia striiformis f. sp.
tritici] on wheat. Can. J. Plant Pathol. 27:314-337.
6. Chen, X. M. 2007. Challenges and solutions for stripe rust control in the United States.
Aust. J. Agric. Res. 58:648-655.
7. Chen, W. Q., Wu, L. R., Liu, T. G., Xu, S. C., Jin, S. L., Peng, Y. L., and Wang, B. T.
2009. Race dynamics, diversity, and virulence evolution in Puccinia striiformis f. sp.
tritici, the causal agent of wheat stripe rust in China from 2003 to 2007. Plant Dis.
93:1093-1101.
8. Chen, X. M., Penman, L., Wan, A., and Cheng, P. 2010. Virulence races of Puccinia
striiformis f. sp. tritici in 2006 and 2007 and development of wheat stripe rust and
distributions, dynamics, and evolutionary relationships of races from 2000 to 2007 in the
United States. Can J. Plant Pathol. 32:315-333.
9. Chen, X. M., and Wan, A. 2011. Epidemics and Races of Puccinia striiformis in the United
States in 2010. North American Rust workers meeting June 12, 2011, Minneapolis. Page
26.
10. Chilosi, G., and Johnson, R. 1990. Resistance to races of Puccinia striiformis in seedlings
of Italian wheats and possible presence of the Yr6 gene in some durum cultivars. J. Genet.
Breed. 44:13-20.
11. CPC, 2005. Crop Protection Compendium. CAB International. UK.
12. Gerechter-Amitai, Z. K., and Stubbs, R. W. 1970. A valuable source of yellow rust
resistance in Israeli populations of wild emmer, Triticum dicoccoides Koern. Euphytica
19: 12-21.

159
13. Hakim, M. S., and Mamluk, O. F. 1996. Virulence of wheat yellow rust pathogen in Syria
and Lebanon. Proc. Eur. Mediterr. Cereal Rusts Powdery Mildew Conf. 9:141.
14. Hovmøller, M. S., Justesen, A. F., and Brown, J. K.M. 2002. Clonality and long distance
migration of Puccinia striiformis f. sp. tritici in north-west Europe. Plant Pathol. 51:24-
32.
15. Hovmøller, M. S., Yahyaoui, A. H., Miles, E. A., and Justesen, A. F. 2008. Rapid global
spread of two aggressive strains of a wheat rust fungus. Mol. Eco. 17:3818-3826.
16. Jin, Y., Szabo, L., and Carson, M. 2010. Century-old mystery of Puccinia striiformis life
history solved with the identification of Berberis as an alternate host. Phytopathology
100:432-435.
17. Johnson, R., Priesley, R. H., and Taylor, E. C. 1978. Occurrence of virulence in Puccinia
striiformis for Compair wheat in England. Cereal Rusts Bull. 3:4-6.
18. Kang, Z., Zhao, J., Han, D., Zhang, H., Wang, X., Wang, C., Han, Q., Guo, J., and Huang,
L. 2010. Status of wheat rust research and control in China. BGRI 2010 Technical
Workshop, May 30-31 2010, St Petersburg, Russia. (Online:
http://www.globalrust.org/db/attachments/bgriiwc/24/2/07-kang-ca-A4-embargo.pdf
accessed on December 14, 2010).
19. Kolmer, J. A. 2005. Tracking wheat rust on a continental scale. Curr. Opin. Plant Biol.
8:1-9.
20. Line, R. F. 2002. Stripe rust of wheat and barley in North America: a Retrospective
Historical Review. Annu. Rev. Phytopathol. 2002. 40:75-118.
21. Line, R. F., and Qayoum, A. 1992. Virulence, aggressiveness, evolution, and distribution
of races of Puccinia striiformis (the cause of stripe rust of wheat) in North America, 1968-

160
87. Technical Bulletin Number 1788. United States Department of Agriculture,
Agricultural Research Service.
22. Little, R., and Manners, J. G. 1969a. Somatic recombination in yellow rust of wheat
(Puccinia striiformis). I. The production and possible origin of two new physiologic races.
Trans. Br. Mycol. Soc. 53:251-258.
23. Little, R., and Manners, J.G. 1969b. Somatic recombination in yellow rust of wheat
(Puccinia striiformis). II. Germ tube fusions, nuclear number and nuclear size. Trans. Br.
Mycol. Soc. 53:259-67.
24. McIntosh, R. A., and Brown, G. N. 1997. Anticipatory breeding for resistance to rust
diseases in wheat. Annu. Rev. Phytopathol. 35:311-26.
25. McIntosh, R. A., Wellings, C. R., and Park, R. F. 1995. Wheat Rusts: An Atlas of
Resistance Genes. CSIRO Publications, Victoria, Australia. Page 157.
26. McIntosh, R. A., Luig, N. H., Johnson, R., and Hare, R. A. 1981. Cytogenetical studies in
wheat XI. Sr 9g for reaction to Puccinia graminis tritici. Z. Pflanzenzüecht. 87: 274-289.
27. Morgounov, A., Braun, H. J., Ketata, H., and Paroda, R. 2005. International cooperation
for winter wheat improvement in central Asia: results and perspectives. Turk. J. Agric.
For. 29:137-142.
28. Nagarajan, S., Nayar, S. K., and Bahadur, P. 1986. Race 13 (67 S8) virulent on Triticum
spelta var. album in India. Plant Dis. 70: 173.
29. Nazari, K., and Torabi, M. 2000. Distribution of yellow rust (Yr) resistance genes in Iran.
Acta Phytopathol. Entomol. Hung. 35:121-131.

161
30. Nelson, R. J., Baraoidan, M. R., Vera Cruz, C. M., Yap, I. V., Leach, J. E., Mew, T. W.
and Leung, H. 1994. Relationship between phylogeny and pathotype for the bacterial
blight pathogen of rice. Appl. Environ. Microbiol. 60:3275-3283.
31. Park, R. F., Fetch, T., Jin, Y., Prashar, M., and Pretorius, Z. 2009. Using race survey
outputs to protect wheat from rust. Pages 25-32. In: R. McIntosh, ed. Proceedings Oral
Papers and Posters, 2009 Technical Workshop, BGRI. Obregón, Sonora, Mexico.
32. Qayoum, A., and Line, R.F. 1985. High-temperature, adult-plant resistance to stripe rust
of wheat. Phytopathology 75: 1121-1125.
33. Pretorius, Z. A., Boshoff, W. H. P., and Kema, G. H. J. 1997. First report of Puccinia
striiformis f. sp. tritici on wheat in south Africa. Plant Dis. 81:424.
34. Rabinovich, S. V. 1998. Importance of wheat-rye translocations for breeding modern
cultivars of Triticum aestivum L. Euphytica 100:323-340.
35. Rohlf, F. J. 2000. NTSYS-pc: numerical taxonomy and multivariate analysis system,
version 2.1. Exeter Software: Setauket, NY.
36. Saari, E. E., and Prescott, J. M. 1985. World distribution in relation to economic losses.
Pages 259-298. In: The Cereal Rusts II: Diseases, distribution, epidemiology and control.
A. P. Roelfs and W. R. Bushnell (Eds.). Academic Press, Orlando, USA.
37. Singh, R. P., Huerta-Espino, J., Rajaram, S., Barna, B., and Kiraly, Z. 2000. Achieving
near-immunity to leaf and stripe rusts in wheat by combining slow rusting resistance
genes. In Proceedings of the 10th Cereal Rusts and Powdery Mildews Conference,
Budapest, Hungary, 28 August-1 September 2000. 35:133-139.
38. Singh, R. P., William, H. M., Huerta-Espino, J., and Rosewarne, G. 2004. Wheat rust in
Asia: Meeting the challenges with old and new technologies New Directions for a Diverse

162
Planet: Proceedings of the 4th International Crop Science Congress, September 26-
October 1, 2004, Brisbane, Australia (2004) (Online:
http://www.pngg.org/pp590_790/Singh-4thIntCSCong2004.pdf accessed on December 7,
2010).
39. Stubbs R. W., and Yang, H. A. 1988. Pathogenicity of Puccinia striiformis for wheat
cultivars with resistance derived from rye. Proc. Eur. Mediterr. Cereal Rusts Conf. 7:110-
112.
40. Stubbs, R. W. 1968. Artificial mutation in the study of the relationship between races of
yellow rust of wheat. Proc.-Eur. Mediterr. Cereal Rusts Conf., 2nd, 1968, pp. 60-62.
41. Stubbs, R. W. 1985. Stripe rust. Page 61-101. In: The Cereal Rusts II. Diseases,
Distribution, Epidemiology and Control. A. P. Roelfs and W. R. Bushnell (Eds.).
Academic Press, New York.
42. Stubbs, R. W. 1988. Pathogenicity analysis of yellow (stripe) rust of wheat and its
significance in a global context. Pages 23-38. In: Breeding Strategies for Resistance to the
Rusts of Wheat. N. W. Simmonds, S. Rajaram (Eds). Mexico DF, Mexico.
43. Stubbs, R. W., Fuchs, E., Vecht, H., and Basset, E. J. W. 1974. The international survey of
factors of virulence of Puccinia striiformis Westend. in 1969, 1970 and 1971. Technische
Bericht Nr.21, Nederlands Graan-Centrum, Wageningen, The Netherlands.
44. Stubbs, R. W., Slovencikova, V., and Bartos, P. 1977. Yellow rust resistance of some
European wheat cultivars derived from rye. Cereal Rusts Bull. 5:45-47.
45. Wan, A., Zhao, Z., Chen, X., He, Z., Jin, S., Jia, Q., Yao, G., Yang, J., Wang, B., Li, G.,
Bi, Y., and Yuan, Z. 2004. Wheat stripe rust epidemic and virulence of Puccinia
striiformis f. sp. tritici in China in 2002. Plant Dis. 88:896-904.

163
46. Wang, K. N., Hong, X. W., Wu, L. R., Xie, S. X., Meng, Q. Y., and Chen, S. M. 1986.
The analysis of the resistance of varieties in the wheat stripe rust nurseries in 1951-1983.
Acta Phytophylacica Sin. 13:112-123.
47. Wellings, C. R. 1988. Pathotype evolution of Puccinia striiformis f. sp. tritici in Eastern
Australia and New Zealand. Proc. Eur. Mediterr. Cereal Rusts Conf. 7:135-136.
48. Wellings, C. R. 2007. Puccinia striiformis in Australia: a review of the incursion,
evolution, and adaptation of stripe rust in the period 1979-2006. Aust. J. Agri. Res.
58:567-575.
49. Wellings, C. R. 2011. Global status of stripe rust: a review of historical and current
threats. Euphytica 179:129-141.
50. Wellings, C. R., and Burdon, J. J. 1992. Variability in Puccinia striiformis f. sp. tritici in
Australasia. Proc. Eur. Mediterr. Cereal Rusts Powdery Mildews Conf. 8:114.
51. Wright, R. G., and Lennard, J. H. 1980. Origin of a new race of Puccinia striiformis.
Trans. Br. Mycol. Soc. 74:283-7.

164
Supplemental Table 1A. Virulence patterns of Puccinia striiformis f. sp. tritici identified in
235 isolates collected from 13 countries tested on single Yr-gene line wheat differentials
Virulence pattern
no.a Virulence/avirulence formulab Countryc (No. of isolates)
1 A,1,2,6,9,17,25,Ukn,28,31/5,7,8,10,15,24,27,32,SP,Exp2 AU(1), UZ(1) 2 1,2,17,27,28,31/A,5,6,7,8,9,10,15,24,25,Ukn,32,SP,Exp2 AU(1)
3 A,2,17,Ukn,27,31/1,5,6,7,8,9,10,15,24,25,28,32,SP,Exp2 AU(1)
4 A,2,6,7,8,9,17,24,Ukn,27,28,31,Exp2/1,5,10,15,25,32,SP AU(1), PK(1) 5 A,2,6,7,17,Ukn,28,31,Exp2/1,5,8,9,10,15,24,25,27,32,SP AU(1)
6 A,2,6,7,8,9,17,Ukn,27,28,31,Exp2/1,5,10,15,24,25,32,SP CA(3), CN(2), DZ(1), ES(1), PK(5), TR(14)
7 A,2,6,7,17,25,27,28,31,Exp2/1,5,8,9,10,15,24,Ukn,32,SP CA(1) 8 A,2,6,7,17,Ukn,27,28,31,Exp2/1,5,8,9,10,15,24,25,32,SP CA(1)
9 A,1,2,6,7,8,9,17,Ukn,27,31,32,Exp2/5,10,15,24,25,28,SP CL(1)
10 A,1,2,6,7,8,9,17,Ukn,27,28,31,Exp2/5,10,15,24,25,32,SP
CL(2), CN(1), KE(1), NP(2), PK(3), RU(1),
TR(2), UZ(2)
11 A,2,7,17,25,28,31,Exp2/1,5,6,8,9,10,15,24,Ukn,27,32,SP CL(1)
12 2,7,17,25,27,28,31,Exp2/A,1,5,6,8,9,10,15,24,Ukn,32,SP CL(1) 13 A,2,6,7,8,17,Ukn,27,28,31,Exp2/1,5,9,10,15,24,25,32,SP CL(1), CN(9), TR(5)
14 2,10,17,24,Ukn,28,31,32/A,1,5,6,7,8,9,15,25,27,SP,Exp2 CL(2)
15 A,1,2,6,7,8,9,10,17,25,Ukn,28,31,32,Exp2/5,15,24,27,SP CL(1) 16 A,2,6,7,17,25,28,31,Exp2/1,5,8,9,10,15,24,Ukn,27,32,SP CL(1)
17 A,2,6,7,17,25,Ukn,28,31,Exp2/1,5,8,9,10,15,24,27,32,SP CL(1) 18 A,2,6,7,8,9,10,17,24,Ukn,28,31,32,Exp2/1,5,15,25,27,SP CL(1), UZ(1)
19 2,6,7,17,25,28,31,Exp2/A,1,5,8,9,10,15,24,Ukn,27,32,SP CL(1)
20 2,7,17,24,Ukn,28,31,Exp2/A,1,5,6,8,9,10,15,25,27,32,SP CL(1) 21 2,10,31,32/A,1,5,6,7,8,9,15,17,24,25,Ukn,27,28,SP,Exp2 CL(1)
22 A,2,6,7,8,31,Exp2/1,5,9,10,15,17,24,25,Ukn,27,28,32,SP CN(3)
23 A,2,6,7,8,Ukn,31,Exp2/1,5,9,10,15,17,24,25,27,28,32,SP CN(2) 24 A,1,2,6,7,8,9,25,31,Exp2/5,10,15,17,24,Ukn,27,28,32,SP CN(1)
25 A,1,2,7,9,25,31,Exp2/5,6,8,10,15,17,24,Ukn,27,28,32,SP CN(1)
26 A,2,6,7,8,17,Ukn,28,31,Exp2/1,5,9,10,15,24,25,27,32,SP CN(2) 27 A,1,2,6,7,8,9,17,25,Ukn,27,28,31,SP,Exp2/5,10,15,24,32 CN(7), TR(1), UZ(1)
28 A,1,2,6,9,25,Ukn,27,28,31,SP,Exp2/5,7,8,10,15,17,24,32 CN(1)
29 A,1,2,7,8,9,25,28,31,Exp2/5,6,10,15,17,24,Ukn,27,32,SP CN(1), TR(1) 30 A,1,6,7,9,31/2,5,8,10,15,17,24,25,Ukn,27,28,32,SP,Exp2 CN(1)
31 A,2,6,7,8,17,Ukn,31,Exp2/1,5,9,10,15,24,25,27,28,32,SP CN(1)
32 A,6,7,8,17,Ukn,28,31,Exp2/1,2,5,9,10,15,24,25,27,32,SP CN(1), TR(1) 33 A,2,6,7,8,Ukn,Exp2/1,5,9,10,15,17,24,25,27,28,31,32,SP CN(1)
34 A,1,2,6,7,8,9,10,17,25,Ukn,27,28,31,32,SP,Exp2/5,15,24 CN(1)
35 A,2,6,7,8,9,10,17,Ukn,27,28,31,Exp2/1,5,15,24,25,32,SP CN(1), NP(1) 36 A,2,6,7,8,17,Ukn,27,31,Exp2/1,5,9,10,15,24,25,28,32,SP CN(1)
37 A,2,6,7,8,9,17,Ukn,27,31,Exp2/1,5,10,15,24,25,28,32,SP CN(1), UZ(1)
38 A,1,2,6,7,8,17,27,31,Exp2/5,9,10,15,24,25,Ukn,28,32,SP CN(1) 39 A,1,2,6,7,8,9,10,25,Ukn,27,28,31,Exp2/5,15,17,24,32,SP CN(1)
40 A,2,6,7,8,9,10,17,Ukn,27,31,Exp2/1,5,15,24,25,28,32,SP CN(1)
41 A,1,2,6,7,8,9,10,17,25,Ukn,27,28,31,Exp2/5,15,24,32,SP CN(1), NP(1) 42 A,2,6,7,8,Ukn,27,31,Exp2/1,5,9,10,15,17,24,25,28,32,SP CN(2), NP(1)
43 A,7,8,Ukn,31,Exp2/1,2,5,6,9,10,15,17,24,25,27,28,32,SP CN(1)
44 A,1,2,6,7,9,17,25,Ukn,27,28,31,Exp2/5,8,10,15,24,32,SP CN(1), TR(1) 45 A,1,2,6,7,9,17,25,Ukn,27,28,31/5,8,10,15,24,32,SP,Exp2 CN(1)
46 A,1,2,6,7,8,9,31,Exp2/5,10,15,17,24,25,Ukn,27,28,32,SP CN(1)
47 A,1,2,6,7,8,9,27,31,Exp2/5,10,15,17,24,25,Ukn,28,32,SP CN(1)
48 A,2,6,7,8,17,25,Ukn,27,28,31,Exp2/1,5,9,10,15,24,32,SP CN(1)
49 A,1,2,6,8,9,17,25,Ukn,27,28,31,SP/5,7,10,15,24,32,Exp2 CN(1)
50 A,2,6,7,8,17,Ukn,27,28,31,SP,Exp2/1,5,9,10,15,24,25,32 CN(2) 51 A,1,2,6,7,8,9,25,Ukn,27,31,SP,Exp2/5,10,15,17,24,28,32 CN(1)
52 A,1,2,7,9,17,27,28,31,SP,Exp2/5,6,8,10,15,24,25,Ukn,32 CN(1)
53 A,2,6,7,8,9,17,Ukn,31,Exp2/1,5,10,15,24,25,27,28,32,SP CN(1), PK(2) 54 A,1,2,6,9,17,25,Ukn,27,28,31,SP/5,7,8,10,15,24,32,Exp2 CN(1), TR(1), UZ(1)
55 A,6,7,8,Ukn,31,Exp2/1,2,5,9,10,15,17,24,25,27,28,32,SP CN(1)
56 A,2,6,7,8,17,Ukn,27,28,Exp2/1,5,9,10,15,24,25,31,32,SP CN(1) 57 A,6,7,8,17,Ukn,31,Exp2/1,2,5,9,10,15,24,25,27,28,32,SP CN(1)

165
58 A,1,2,6,7,8,9,17,25,Ukn,27,28,31,Exp2/5,10,15,24,32,SP HU(1), NP(3), PK(4), TR(8), UZ(4) 59 A,2,6,7,17,28,31,Exp2/1,5,8,9,10,15,24,25,Ukn,27,32,SP HU(1)
60 A,2,6,7,8,9,10,17,25,27,28,31,32,Exp2/1,5,15,24,Ukn,SP HU(1)
61 A,1,2,6,7,8,9,10,17,24,25,Ukn,27,28,31,32,Exp2/5,15,SP HU(1), PK(1) 62 A,1,2,7,8,9,17,25,Ukn,31,Exp2/5,6,10,15,24,27,28,32,SP KE(1)
63 1,2,6,7,9,17,31,Exp2/A,5,8,10,15,24,25,Ukn,27,28,32,SP KE(1)
64 A,1,2,6,7,8,9,10,17,25,Ukn,27,31,32,Exp2/5,15,24,28,SP KE(1) 65 A,1,2,6,7,8,17,Ukn,27,28,31,Exp2/5,9,10,15,24,25,32,SP NP(3)
66 A,1,2,6,7,8,17,Ukn,27,31,Exp2/5,9,10,15,24,25,28,32,SP NP(1)
67 A,1,2,6,7,8,9,10,17,24,Ukn,27,28,31,Exp2/5,15,25,32,SP NP(1) 68 A,1,2,6,7,8,9,25,Ukn,27,28,31,Exp2/5,10,15,17,24,32,SP NP(1)
69 A,2,6,7,9,17,Ukn,28,31,Exp2/1,5,8,10,15,24,25,27,32,SP NP(1)
70 A,2,6,7,17,25,Ukn,27,28,31,Exp2/1,5,8,9,10,15,24,32,SP NP(2) 71 A,1,2,6,7,8,9,10,17,Ukn,27,28,31,Exp2/5,15,24,25,32,SP NP(1)
72 A,2,6,7,8,9,10,17,Ukn,28,31,Exp2/1,5,15,24,25,27,32,SP NP(1)
73 A,1,2,6,7,8,17,25,Ukn,28,31/5,9,10,15,24,27,32,SP,Exp2 NP(1) 74 A,1,2,6,7,8,17,Ukn,28,31,Exp2/5,9,10,15,24,25,27,32,SP NP(1)
75 2,6,17,Ukn,31/A,1,5,7,8,9,10,15,24,25,27,28,32,Sp,Exp2 PK(1)
76 2,6,17,Ukn,31,Exp2/A,1,5,7,8,9,10,15,24,25,27,28,32,SP PK(1) 77 A,1,6,7,9,17,25,Ukn,27,28,31,Exp2/2,5,8,10,15,24,32,SP PK(1)
78 2,6,7,9,17,Ukn,27,31,Exp2/A,1,5,8,10,15,24,25,28,32,SP PK(1)
79 1,2,6,7,17,Ukn,27,28,31,Exp2/A,5,8,9,10,15,24,25,32,SP PK(1) 80 A,1,6,7,8,9,17,25,Ukn,27,28,31,Exp2/2,5,10,15,24,32,SP PK(3)
81 1,2,6,7,8,9,17,24,Ukn,27,28,31,Exp2/A,5,10,15,25,32,SP PK(1)
82 1,2,6,7,8,9,17,Ukn,27,28,31,Exp2/A,5,10,15,24,25,32,SP PK(2), RU(1) 83 A,1,2,6,7,8,9,17,24,25,Ukn,27,28,31,32,Exp2/5,10,15,SP PK(4), TR(1)
84 A,1,2,6,7,8,9,17,25,Ukn,27,28,31,32,Exp2/5,10,15,24,SP PK(3)
85 1,2,6,7,9,17,Ukn,27,28,31,Exp2/A,5,8,10,15,24,25,32,SP PK(1) 86 1,2,6,7,8,17,Ukn,27,31,Exp2/A,5,9,10,15,24,25,28,32,SP PK(1)
87 A,1,2,6,7,8,9,17,24,25,Ukn,27,28,31,Exp2/5,10,15,32,SP PK(1)
88 2,6,7,17,24,Ukn,28,31,Exp2/A,1,5,8,9,10,15,25,27,32,SP PK(1) 89 A,2,6,7,8,9,10,17,24,Ukn,27,28,31,32,Exp2/1,5,15,25,SP PK(2)
90 1,2,6,7,8,9,17,25,Ukn,27,28,31,Exp2/A,5,10,15,24,32,SP PK(1)
91 2,6,7,9,17,25,Ukn,27,28,31,Exp2/A,1,5,8,10,15,24,32,SP PK(1) 92 A,2,6,7,8,9,10,17,Ukn,27,28,31,32,Exp2/1,5,15,24,25,SP PK(1)
93 A,2,6,7,9,17,24,Ukn,31,32,Exp2/1,5,8,10,15,25,27,28,SP PK(1)
94 A,2,6,7,9,17,Ukn,27,31,Exp2/1,5,8,10,15,24,25,28,32,SP PK(1)
95 2,10,17,24,Ukn,31,32/A,1,5,6,7,8,9,15,25,27,28,SP,Exp2 PK(1)
96 A,2,6,7,8,25,Ukn,27,28,31,Exp2/1,5,9,10,15,17,24,32,SP TR(1)
97 A,2,6,7,8,9,17,Ukn,28,31,Exp2/1,5,10,15,24,25,27,32,SP TR(3) 98 A,2,6,7,8,17,24,25,Ukn,27,28,31,32,Exp2/1,5,9,10,15,SP TR(2)
99 A,2,6,17,24,25,Ukn,27,28,31,32,Exp2/1,5,7,8,9,10,15,SP TR(1)
100 A,6,7,8,Ukn,27,31,Exp2/1,2,5,9,10,15,17,24,25,28,32,SP TR(1) 101 A,6,7,8,17,Ukn,27,28,31,Exp2/1,2,5,9,10,15,24,25,32,SP TR(1)
102 A,2,6,7,8,9,17,Ukn,27,28,31/1,5,10,15,24,25,32,SP,Exp2 TR(1)
103 2,7,8,Ukn,31,Exp2/A,1,5,6,9,10,15,17,24,25,27,28,32,SP TR(1) 104 A,1,2,6,7,8,9,17,25,28,31/5,10,15,24,Ukn,27,32,SP,Exp2 TR(1)
105 A,1,2,6,7,8,9,17,Ukn,27,28,31,SP,Exp2/5,10,15,24,25,32 TR(1)
106 A,1,2,6,7,8,9,17,25,Ukn,27,28,31/5,10,15,24,32,SP,Exp2 TR(1) 107 A,2,6,7,8,9,17,Ukn,27,31/1,5,10,15,24,25,28,32,SP,Exp2 TR(1)
108 A,1,2,6,7,8,9,17,25,Ukn,28,31,Exp2/5,10,15,24,27,32,SP TR(1), UZ(1) 109 A,1,6,7,8,9,17,25,Ukn,31,Exp2/2,5,10,15,24,27,28,32,SP TR(1)
110 A,1,2,6,8,9,17,25,Ukn,27,28,31,Exp2/5,7,10,15,24,32,SP TR(1)
111 A,6,7,8,17,Ukn,27,28,31,SP,Exp2/1,2,5,9,10,15,24,25,32 TR(1) 112 A,1,2,6,9,17,25,Ukn,27,28,31/5,7,8,10,15,24,32,SP,Exp2 UZ(3)
113 A,1,2,6,9,25,Ukn,28,31/5,7,8,10,15,17,24,27,32,SP,Exp2 UZ(1)
114 A,1,2,6,7,8,9,17,25,Ukn,27,28,31,SP/5,10,15,24,32,Exp2 ES(1) a The virulence pattern numbers based on the single Yr-gene lines and the U.S. differentials do
not represent the same isolate.
b Virulence/avirulence formulae correspond to Yr genes.
c AU= Australia, CA= Canada, CL = Chile, CN = China, DZ= Algeria, ES = Spain, HU =
Hungary, KE = Kenya, NP = Nepal, PK = Pakistan, RU = Russia, TR = Turkey, and UZ =
Uzbekistan.

166
Supplemental Table 1B. Virulence patterns of Puccinia striiformis f. sp. tritici identified in
235 isolates collected from 13 countries tested on the U.S. wheat differentials
Virulence
pattern
no.a
Virulence patternb Country (No. of isolates) US racec
1 1,2,3,5,6,8,9,10,12,13,15,18 AU(1)
2 1,2,3,5,6,10 AU(1)
3 1,3,5,6,10,15 AU(1) 4 1,3,5,8,10,11,12,14,16,17,18,19,20 AU(1), TR(4)
5 1,3,5,6,8,10,11,12,16 AU(1)
6 1,3,8,10,11,12,13,14,15,16,17,18,19,20 CA(1), PK (1) 7 1,3,8,10,11,12,14,16,17,18,19,20 CA(2),TR(1)
8 1,6,9,10,11,13,15 CA(1)
9 1,5,8,10,11,12,14,16 CA(1) 10 1,2,8,10,11,12,13,16,17,18,20 CL(1)
11 1,2,3,8,9,10,11,12,14,16,17,18,19,20 CL(1) PST-113
12 1,6,9,10,11 CL(1), NP(1) 13 1,3,6,9,10,11 CL(1) PST-46
14 1,5,8,10,11,12,14,16,17,20 CL(1), CN(14), NP(1), TR(1)
15 1,2,3,8,10,11,12,16,17,18,19,20 CL(1) PST-129 16 1,4,5,14 CL(2)
17 1,2,4,6,8,9,10,11,12,16,17,18,19 CL(1) 18 1,6,8,10,11,12,16 CL(1)
19 1,6,9,10,11,12 CL(1)
20 1,3,4,5,8,10,12,14,17,18,19,20 CL(1) 21 1,6,9,10,11,12,16 CL(1)
22 1,6,10 CL(1) PST-53
23 1,5,14 CL(1) 24 1,8,10,11,16,17,20 CN(4), TR(1)
25 1,2,3,6,8,9,10,11,12,13,14,15,17,18,19,20 CN(1)
26 1,2,3,6,8,9,10,13,14,18,19 CN(1)
27 1,2,3,5,6,8,9,10,11,12,13,15,16,17,18,19,20 CN(3), HU(1), PK(2), TR(2) PST-127
28 1,2,3,5,6,8,9,10,12,13,15,18,19 CN(1), UZ(5)
29 1,2,3,5,6,8,9,10,11,12,13,14,15,16,17,18,19,20 CN(3), NP(1), TR(1), UZ(1) 30 1,2,3,5,6,8,9,10,11,13,15,17,18,19,20 CN(1)
31 1,2,5,8,12,13,18,19 CN(1)
32 1,8,11,16,17,20 CN(2) 33 1,5,8,11,12,14,16,17,20 CN(1)
34 1,5,8,10,11,16,17,20 CN(1)
35 1,5,8,10,11,14,16,17,20 CN(1) 36 1,5,8,10,11,12,16,17,20 CN(1), TR(1)
37 1,3,5,8,11,12,14,16,17,18,20 CN(1)
38 1,5,8,10,11,12,14,16,17,18,20 CN(2) 39 1,2,5,6,8,10,11,12,16,17,20 CN(1), NP(1)
40 1,2,3,5,6,8,10,11,12,13,14,17,18,19,20 CN(1)
41 1,5,8,10,11,12,13,14,16,17,18,20 CN(1) 42 1,2,3,5,6,8,9,10,11,12,13,14,15,17,18,19,20 CN(2), TR(1)
43 1,5,10,11,12,14,16,17,20 CN(2)
44 1,5,8,10,11,14,17,20 CN(1) 45 1,8,10,11,17 CN(1)
46 1,2,3,5,6,8,9,10,11,12,13,15,16,18,19 CN(1)
47 1,2,3,5,6,8,9,10,13,14,15,18,19 CN(1) 48 1,2,3,5,6,8,9,10,13,15,17,18,19,20 CN(1)
49 1,2,3,5,6,9,10,13,14,15,17,18,19,20 CN(1)
50 1,2,3,5,6,8,9,10,11,12,13,14,16,17,18,19,20 CN(1), NP(1), TR(1) 51 1,3,8,10,11,12,16,17,18,19,20 CN(1), PK(1) PST-98
52 1,2,3,5,6,8,9,10,12,13,15,17,18,19 CN(1)
53 1,2,3,5,6,9,10,11,13,14,15,17,18,19 CN(1) 54 1,2,5,6,9,10,11,12,13,14,15,16,17,18,19,20 CN(1)
55 1,2,5,6,8,10,11,13,15,18 CN(1)

167
56 1,5,8,10,11,14,16,17,18,20 CN(1) 57 1,2,3,5,6,8,9,10,12,13,14,15,18,19 CN(1), TR(1)
58 1,8,10,11,17,20 CN(1)
59 1,3,5,6,8,9,10,11,12,16 HU(1) 60 1,3,4,8,10,11,12,13,14,16,17,18,19,20 HU(1)
61 1,2,3,4,5,8,10,11,12,13,14,15,16,17,18,19,20 HU(1)
62 1,2,3,6,11,12,13,16,17,18,19,20 KE(1) 63 1,2,10,11,12,16,17,18,19,20 KE(1)
64 1,2,5,8,10,12,16,18 KE(1)
65 1,2,5,6,10,11,12,13,14,15,16,17,18,19,20 KE(1) 66 1,2,3,5,6,8,10,11,12,13,16,17,20 NP(1)
67 1,2,5,8,10,11,12,14,16,17,20 NP(1)
68 1,2,5,6,8,10,11,12,13,14,16,17,18,19,20 NP(1), UZ(1) 69 1,2,5,8,10,11,12,13,16,17,18,20 NP(1)
70 1,2,3,5,6,8,9,10,11,12,13,15,16,17,18,19 NP(1), TR(1)
71 1,2,3,5,6,9,10,11,12,13,16,17,18,19 NP(1) 72 1,8,10,12,13,16,18 NP(1)
73 1,3,5,6,8,9,10,12,16 NP(1)
74 1,2,5,8,11,12,14,16,17,20 NP(1) 75 1,2,3,4,5,8,10,11,12,14,16,17,18,19,20 NP(1)
76 1,3,4,8,10,11,12,16,17,18,19,20 NP(1), PK(1) PST-130
77 1,3,4,10,11,12,14,16,17,18,19,20 NP(1) 78 1,2,5,8,10,11,12,16,17,20 NP(2)
79 1,2,3,4,5,6,8,10,12,13,14,16,17,18,19,20 NP(1)
80 1,2,5,8,10,11,12,16,17,18 NP(1), PK(1), RU(1) 81 1,3,12,13,15 PK(2) PST-45
82 1,2,3,5,6,10,11,12,13,14,15,18,19 PK(1)
83 1,5,8,10,11,12,14,16,18 PK(1) 84 1,2,5,8,10,11,12,14,16 PK(1)
85 1,2,3,5,6,8,9,10,11,12,13,15,17,18,19,20 PK(1) PST-137
86 2,5,6,8,10,12,13,14,16,17,18,20 PK(1) 87 1,2,5,8,10,11,12,14,16,17,18,20 PK(1)
88 1,2,3,5,8,10,11,12,13,14,15,16,17,18,20 PK(1)
89 1,2,3,6,8,9,10,11,12,13,14,15,16,17,18,19,20 PK(1) 90 1,2,5,8,10,11,12,15,16,17,18,20 PK(1)
91 1,2,5,6,8,10,11,12,16,18 PK(1)
92 1,2,3,5,8,10,11,12,16,17,18,20 PK(1)
93 2,5,8,10,11,12,14,16,17,20 PK(1)
94 2,3,5,8,10,11,12,13,15,16,17,18,20 PK(1)
95 1,2,3,5,6,8,9,10,11,12,14,16,17,18,19,20 PK(1) PST-133 96 1,2,3,5,6,9,10,11,12,13,14,15,16,17,18,19 PK(1)
97 1,3,8,10,11,12,16,17,18,20 PK(1)
98 1,11,12,16 PK(1) PST-58 99 1,4,5,8,10,11,12,14,16,17,18,19,20 PK(1)
100 1,2,3,5,6,8,10,11,12,13,16,17,18,19,20 PK(1), UZ(1)
101 2,3,5,8,10,11,12,14,16,17,18,20 PK(1) 102 1,2,3,5,8,11,12,16,17,18,19,20 PK(1)
103 1,3,5,6,9,10,11,14,16,18,19 PK(1)
104 1,2,3,5,6,8,10,11,12,13,15,17,18,19,20 PK(1) 105 1,2,3,4,5,6,8,10,11,12,13,14,15,16,17,18,19,20 PK(1)
106 1,2,3,5,6,9,10,11,12,13,15,16,17,18,19,20 PK(1) PST-138 107 1,3,8,10,11,12,14,16,17,18,20 PK(2)
108 1,5,8,12,14,16,18,19 PK(1)
109 1,2,3,5,6,9,10,11,12,13,15,17,18,19 PK(1) 110 1,3,5,8,10,11,12,13,14,15,16,17,18,19,20 PK(1)
111 1,2,3,5,6,8,9,10,11,12,13,15,17,18,19 PK(2), TR(1), UZ(2) PST-139
112 1,3,8,10,11,12,16,18,19,20 PK(1) 113 1,10,11,12,16,17,18,20 PK(1)
114 1,3,8,10,11,12,13,17,18,19,20 PK(1)
115 1,3,4,8,10,11,12,13,14,15,16,17,18,19,20 PK(1) 116 1,3,4,5,14 PK(1) PST-50
117 1,2,3,5,10,12,13,15,17,18 PK(1)
118 1,3,5,8,10,11,12,16,17,18,19,20 TR(1) PST-111 119 1,8,10,11,12,14,16,17,20 TR(1)
120 1,8,10,11,12,16,17,20 TR(2) PST-105
121 1,2,3,5,6,8,10,11,12,13,14,15,16,17,18,20 TR(1)

168
122 1,2,5,6,8,9,10,11,12,13,15,16,17,18,19,20 TR(1) 123 1,3,5,8,9,10,11,12,14,15,16,17,18,19,20 TR(1)
124 1,3,5,6,8,9,10,11,12,14,15,16,17,18,19,20 TR(1)
125 1,3,10,11,12,14,16,17,18,19,20 TR(1) 126 1,10,11,12,16,17,20 TR(1)
127 1,10,11,12,16,17 TR(1)
128 1,5,10,12,16 TR(1) 129 1,10,11,12,17 TR(1)
130 1,3,5,8,11,12,14,16,17,18,19,20 TR(1)
131 1,9,10,11,12,14,16,17,20 TR(1) 132 1,8,10,11,12,16,17,18,19,20 TR(2)
133 1,5,8,10,11,12,17,20 TR(1)
134 1,8,11,12,16,17,20 TR(1) 135 1,3,5,8,9,10,11,12,16,17,18,19,20 TR(1)
136 1,3,8,9,10,11,12,16,17,18,19,20 TR(1) PST-100
137 1,2,3,8,9,10,11,12,13,14,16,17,18,19,20 TR(1) 138 1,3,5,8,9,10,11,12,14,16,17,18,19,20 TR(2) PST-115
139 1,3,6,8,9,10,11,12,14,16,17,18,19,20 TR(1) PST-117
140 1,3,5,6,8,9,10,11,12,13,14,15,16,17,18,19,20 TR(1) 141 1,2,3,8,9,10,11,12,16,17,18,19,20 TR(1) PST-101
142 1,2,3,5,6,8,9,10,11,12,13,16,17,18,19,20 TR(1), UZ(1)
143 1,2,5,6,8,9,10,11,12,13,17,18,19,20 TR(1) 144 1,3,6,8,10,11,12,14,16,17,18,19,20 TR(1)
145 1,2,3,5,6,8,10,11,12,13,15,18,19 TR(1)
146 1,8,10,11,12,17,20 TR(1) 147 1,2,3,5,8,9,10,11,12,13,15,17,18,19 TR(2)
148 1,2,3,5,10,13,15,17,18,19,20 TR(1)
149 1,2,3,5,8,10,11,12,13,15,16,17,18,19 TR(1) 150 1,2,5,8,9,10,11,12,13,17,18,19 TR(1)
151 1,2,3,8,10,12,13,15,17,18,20 TR(1)
152 1,3,4,5,10,11,12,14,16,17,18,20 UZ(1) 153 1,2,3,5,6,9,10,12,13,15,18,19 UZ(1)
154 1,2,3,5,6,8,9,10,11,12,16,17,18,19,20 UZ(1)
155 1,2,3,5,6,8,10,11,12,13,14,16,17,18,19 UZ(1) 156 1,5,8,10,11,12,14,16,17,18,19,20 UZ(1)
157 1,3,10,11,12,16,17,18,19,20 DZ(1), ES(1) PST-97
159 1,2,3,5,6,8,9,10,13,14,17,18,20 ES(1)
160 1,2,3,5,8,10,11,12,13,14,16,17,18,20 RU(1)
a The virulence pattern numbers based on the single Yr-gene lines and the U.S. differentials do
not represent the same isolate.
b Virulence formulae correspond to the U.S. differential numbers.
c Based on virulence patterns of the U.S. differentials.

169
Simple matching coefficient
0.50 0.60 0.70 0.80 0.90 1.00
AU06-1
UZ10-14
UZ10-15
CN06-53
CN07-42
UZ10-31
CN07-53
TR10-10
UZ10-5
UZ10-13
UZ10-21
CN07-29
PK09-33
TR10-48
CN07-31
CN07-49
PK06-19
NP07-8
CN06-52
CN06-57
CN07-48
CN06-54
CN07-43
HU09-1
PK09-7
TR10-22
TR10-27
TR09-30
NP07-6
UZ10-22
CN07-36
NP07-2
TR10-2
CN07-22
TR10-5
TR10-17
UZ10-30
TR10-24
PK07-6
UZ10-16
PK07-10
CN07-13
PK06-29
CN07-28
NP07-7
TR10-29
PK09-6
PK09-16
TR10-43
UZ10-4
TR10-51
UZ10-10
TR10-35
TR10-39
PK06-24
PK08-1
PK09-3
PK07-5
PK08-3
PK08-5
TR10-44
PK06-28
TR09-28
NP07-1
UZ10-26
UZ10-17
PK07-4
TR10-45
CN07-19
NP08-12
NP07-4
UZ10-24
CN07-50
KE06-4
TR09-80
CN06-45
CN06-44
CN07-33
CN06-68
CN07-30
TR10-42
KE06-1
CN07-51
55
81
31
31
45
30
62
32
34
30
63
39
52
VG 1
VG 2
ES08-1

170
Supplemental Fig. 1A. Dendrogram of group 1 and 2 based on virulence phenotypes of
Puccinia striiformis f. sp. tritici on 20 single Yr-gene lines and 20 U.S. wheat differentials
using the unweighted pair group arithmetic mean (UPGMA) method. Numbers along the
nodes are bootstrap values ≥30%. VG = Virulence group, AU = Australia, CA = Canada, CL
= Chile, CN = China, HU = Hungary, KE = Kenya, NP = Nepal, PK = Pakistan, TR = Turkey,
and UZ = Uzbekistan. Two digits after country abbreviation represents the isolate collected
year, for example 07 = 2007, from respective countries.

171
VG 3
AU06-4 TR09-55 TR09-3 TR09-4 TR09-11 TR09-56 TR09-5 TR09-82 TR09-83 TR09-37 CA07-2 CA07-3 TR09-23 CN07-39
57
Simple matching coefficient0.50 0.60 0.70 0.80 0.90 1.00
TR09-84 TR10-34 NP08-4 NP08-5 PK08-6 NP08-7 TR09-40 PK09-1 PK09-14 CA07-5 PK06-23 PK06-21 PK06-32 CL07-5 CN07-10 CN07-14 CN07-26 CN07-37 CN07-40 CN07-57 CN07-56 CN07-58 CN06-49 CN07-21 CN07-25 CN07-32 CN07-45 CN07-46 TR10-53 CN07-3 NP07-11 CN07-38 TR09-26 NP08-9 NP08-14 TR09-21 TR10-36 TR10-37 CN07-16 CN07-17 NP07-3 UZ10-20 CN07-23 NP07-12
NP07-5NP08-19 PK06-9
PK07-2 PK06-26
PK06-31 CN07-15 CN07-20 PK07-11 PK07-3 CN07-18 NP08-8 CL07-1 CN06-33 CN06-34 CN06-36 CN07-1 CN07-11 TR09-75 CN07-4 CN07-52 CN07-12 CN07-24 TR09-61 CN07-27 CN07-55 TR09-57 CN07-8 CN07-59 TR09-62 TR09-48 TR09-47 TR09-41 TR09-51 TR09-24
PK09-13 PK07-7 PK09-27 CL07-2 TR10-6 CL07-6 TR09-74 TR09-64
KE06-2 TR09-60 TR10-32 PK09-9 CA07-1 PK09-15 PK09-5 PK09-23 TR09-85 TR09-38
31
35
71
30
45
72
37
63
58
34
5434
41
43
41
79
DZ09-1 ES09-1
RU06-1
RU06-2

172
Supplemental Fig. 1B. Dendrogram of group 3 based on virulence phenotypes of Puccinia
striiformis f. sp. tritici on 20 single Yr-gene lines and 20 U.S. wheat differentials using
unweighted pair group arithmetic mean (UPGMA) method.

173
Supplemental Fig 1C. Dendrogram of group 4-10 based on virulence phenotypes of Puccinia
striiformis f. sp. tritici on 20 single Yr-gene lines and 20 U.S. wheat differentials using
unweighted pair group arithmetic mean method.
VG 4
VG 5
VG 6
VG 7
VG 8
VG 9
VG 10
Simple matching coefficient
0.50 0.60 0.70 0.80 0.90 1.00
KE06-3
NP07-9
PK09-2
PK06-25
CL07-8
CL07-11
PK07-9
UZ09-24
HU09-4
HU09-5
PK08-2
PK09-28
PK07-12
AU06-5
HU09-3
NP07-10
CA07-4
CL07-10
NP08-1
CL07-3
CL07-4
CL07-9
CL07-13
CL07-14
PK07-8
PK07-13
CN06-72
TR10-50
AU06-2
AU06-3
PK06-3
PK06-7
CL07-7
CL07-12
PK09-30
CL07-15
65
34
37
64
69
10082
86
100

174
CHAPTER FIVE
Molecular characterization of international collections of the wheat stripe rust pathogen
ABSTRACT
Puccinia striiformis f. sp. tritici causes stripe rust, which is one of the most important
wheat diseases worldwide. A total of 292 isolates of the pathogen collected from Algeria,
Australia, Canada, Chile, China, Hungary, Kenya, Kyrgyzstan, Mexico, Nepal, Pakistan,
Russia, Spain, Tajikistan, Turkey, Turkmenistan, the United States, and Uzbekistan were
characterized using 17 co-dominant simple sequence repeat (SSR) markers to understand the
population structure and distribution of Pst genotypes. Bayesian analysis discriminated the
stripe rust pathogen isolates into two genetic clusters and an admix group. Genetic cluster 1
consisted of 55% of the isolates from all of the countries. Cluster 2 consisted of 35% of the
isolates, mostly from China and Uzbekistan. The admix group consisted of 10% of the
isolates, mostly from Asian countries. Cluster 2 and the admix group were mostly from Asia.
In general, results obtained from Bayesian statistics, principal component analysis, and cluster
analysis consistently revealed the lack of geographical differentiation among country-wise
collections. Identical SSR genotypes were observed between nearby countries as well as
isolates collected from countries from different continents. Partition of molecular variance
suggested that most variation occurred within countries (89% based on FST and 96% based on
RST) followed by among international regions (6% based on FST and 4% based on RST).
Genetic variation among countries within regions was significantly differed only based on FST
statistics (6%). Collections from China and Central Asia had a significant but low level of

175
genetic differentiation with collections from North America and South America. Either low
or non-significant genetic differentiation between other regions may explain the minimum
geographical structuring of the wheat stripe rust pathogen worldwide.
Additional keywords: Triticum aestivum, yellow rust
INTRODUCTION
Stripe rust (yellow rust), caused by Puccinia striiformis f. sp. tritici (Pst), is one of the
major and common diseases of wheat (Triticum aestivum L.) in many wheat growing
countries throughout the world. The disease is a serious problem particularly in wheat
growing regions with cool climate conditions during most of the wheat growth season (Line
2002; Chen 2005). Major stripe rust vulnerable regions include the U.S. Pacific Northwest,
the Arabian Peninsula (Yemen), Middle East (Turkey, Syria, and Iran), Central Asia
(Kazakhstan, Kyrgyzstan, Tajikistan, Turkmenistan, and Uzbekistan), the Caucasus (Armenia,
Azerbaijan, and Georgia), South Asia (India, Pakistan, and Nepal), East Asia (China: north-
west, and south-west), Oceania (Australia, and New Zealand), East Africa (Ethiopia and
Kenya), and Northwest Europe (England, the Netherlands, Belgium, northern France, and
northern Germany) (Stubbs 1985; Wellings 2011). Stubbs (1988) classified potential stripe
rust regions into different epidemiological zones at an international scale based on the
similarity of virulences or races in combination with geographical features and potentials of
urediniospore dissemination. Similarly, stripe rust epidemiological regions have been defined
at a national level, for example in the U.S. (Line and Qayoum 1992; Chen et al 2010) and
China (Zeng and Luo 2006).

176
Conventionally, virulence and race variation have been used to study the diversity and
relationship of the stripe rust pathogen (Line 2002). These studies were mostly conducted in
European countries, the U.S., China, and Australia. Different levels of virulence diversity
have been observed in these countries (Stubbs 1985, 1988; Wan et al. 2004, 2007; Wellings
2007; Chen et al. 2009; Chen et al. 2010). Diversity of races results primarily from different
combinations of virulence factors either through mutation and/or recombination (Stubbs 1985;
Wellings and McIntosh 1990; Line 2002; Chen 2005; Jin et al. 2010). Spontaneous single
gene mutation followed by selection on the target resistance source has mainly been attributed
for increased virulence in Pst (Wellings and McIntosh 1990; Steele et al. 2001). Therefore,
the virulence phenotypes and its diversity are influenced by resistant cultivars deployed in the
regions (Wellings and McIntosh 1990).
Information generated with neutral molecular markers is important to study genetic
diversity and population structure of a pathogen (McDonald and Linde 2002). Several
molecular marker techniques have been used for genetic characterization of Pst populations
(Chen et al 1993; Shan et al. 1998; Steele et al. 2001; Hovmøller et al. 2002; Enjalbert et al.
2005). Chen et al. (1993) showed random amplified polymorphic DNA (RAPD)
polymorphism among races and among isolates within some U.S. Pst races. Races with the
Yr1 virulence were separated from those without the virulence based on RAPD markers (Chen
et al. 1993). Similarly, the evolution of several new races from previously identified races
was reported based on amplified fragment length polymorphism (AFLP) markers in China
(Zheng et al. 2001). Most previous studies reported low levels of association between
virulence and DNA polymorphism (Chen et al. 1993; Shan et al. 1998; Steele et al. 2001;
Zheng et al. 2001; Enjalbert et al. 2005). In general, very low molecular variation occurs in
177
areas where the Pst population is either a recent introduction or often goes through seasonal
bottlenecks (Steele et al. 2001; Hovmøller et al. 2002; Enjalbert et al. 2005). For example, no
polymorphisms were observed among races collected between 1979 and 1991 using RAPD
and AFLP markers in Australia and New Zealand (Steele et al. 2001). However, high
polymorphisms were found in Pst populations collected from conventional stripe rust regions,
such as the United Kingdom and Denmark, using the same markers. Genetic recombination
among Pst isolates has been considered under natural conditions in Gansu province, China
based on AFLP and simple sequence repeat (SSR) markers (Mboup et al. 2009; Duan et al.
2010) and from Pakistan using SSR marker (Bahri et al. 2011).
Migration of Pst between regions occurs often through wind and occasionally through
human activities (Hodson 2011). Gene flow changes the genetic composition of the pathogen
populations and often have serious consequences on the disease epidemics and management
(McDonald and Linde 2002; Kolmer 2005). Such changes in Pst populations have been
detected using molecular markers in several countries, especially in the U.S. (Markell and
Milus 2008), Denmark (Hovmøller et al. 2002; Hovmøller et al. 2008), and China (Shan et al.
1998). Gene flow reduced genetic differentiation in the Pst populations between and within
regions in China (Shan et al. 1998). The more aggressive strains since 2000 in the eastern
U.S. had distinct AFLP patterns as compared to pre-2000 Pst populations. The post-2000
population was more likely due to introduction of exotic populations rather than from a
mutation in the old population (Chen et al. 2002; Chen 2005; Markell and Milus 2008).
Regional aerial dispersal of Pst was reported in Northwest Europe including Denmark using
AFLP markers (Hovmøller et al. 2002; Justesen et al. 2002). Global spread of high

178
temperature adaptive more aggressive strains of Pst have been reported in North America,
Australia and Europe using AFLP markers (Hovmøller et al. 2008).
Molecular studies of the worldwide collections of rust pathogens allow discriminating
genotypes, population structure, and genetic diversity among populations in different
countries; and also allow understanding genetic and evolutionary relationships of the
populations. Understanding the genetic variability of a rust pathogen is crucial for the
development of effective management strategies (Ordoñez and Kolmer 2007). Rust
urediniospores are dikaryotic. Homozygous and heterozygous states of alleles can be
differentiated by codominant SSR markers. In addition, SSR markers have been found highly
polymorphic and widely used to characterize Pst collections in different parts of the world
(Enjalbert et al. 2005; Ordoñez and Kolmer 2007; Bahri et al. 2009a; Mboup et al. 2009;
Duan et al. 2010; Bahri et al. 2011). Most previous studies with Pst were either focused on
collections of a single country or relatively small regions with a country or among countries,
and few made connections between molecular and virulence characterizations. In the last
several years, we have obtained Pst isolates from 13 countries and DNA from 4 additional
countries. In our previous studies, we have characterized the isolates for their virulence
phenotypes and determined virulence relationships of the collections from different countries
(Sharma-Poudyal and Chen 2011). The objective of the present study was to determine the
molecular genotypes, population structures, and genetic similarities of the international
collections using SSR markers, mostly developed in our program recently.

179
MATERIALS AND METHODS
Stripe rust pathogen samples. A total of 292 Pst isolates were obtained from
different countries, 1 from Algeria, 5 from Australia, 5 from Canada, 15 from Chile, 63 from
China, 4 from Hungary, 4 from Kenya, 4 from Kyrgyzstan, 4 from Mexico, 24 from Nepal, 26
from Pakistan, 2 from Spain, 9 from Russia, 1 from Tajikistan, 4 from Turkmenistan, 56 from
Turkey, 28 from United States, and 17 from Uzbekistan were used in this study.
Urediniospores for each isolate were increased on seedlings of stripe rust susceptible wheat
cultivar ‘Nugaines’ following the standard procedures as previously described (Chen et al.
2002; Chen et al. 2010). Increased urediniospores were dried and stored in a desiccator at 4oC
for later use.
DNA extraction. About 20 mg of urediniospores was used to extract genomic DNA
for each isolate. Twenty mg sterilized silica sand and 800 μl DNA extraction lysis buffer (10
g of CTAB, 40.908 g of 1.4 M NaCl (MW. 58.44), 50 ml of 100 mM Tris (pH 8.0), 20 ml of
20 mM EDTA (pH 8.0), 0.3% β-mercaptoethanol, and 435 ml of sterilized ddH2O for 500 ml)
were added to a 1.5 ml centrifuge tube containing urediniospores. The mixture was shaken
for 3 min in a mini beater and incubated at 65oC for 1 h. The incubating tubes were inverted
10 times at every 15 min interval. After incubation, 500 µL 24:1(v/v) chloroform/ isoamyl
alcohol was added into mixture and centrifuged for 15 min at 13,000 rpm. Clean supernatant
of about 700 µL was transferred into another 1.5 ml centrifuge tubes. Cold isopropyl alcohol
ca. 500 µL kept at -20oC was added into the tube and incubated at -20
oC for at least 20 min.
Nucleic acid was precipitated as a pellet by centrifuging at 12,000 rpm for 15 min. Nucleic
acid was rinsed with 700 µl 75% ethanol (stored at -20oC) by centrifuging at 13,000 rpm for 5
min. After centrifugation, ethanol supernatant was discarded and the DNA pellets in the tubes

180
were dried at room temperature. The air dried nucleic acid was dissolved with 100 µl TE
buffer (10 mM Tris-HCL and 1 mM EDTA, pH 8.0) containing RNase A (20 μg/ml) and
incubated at 4oC overnight. About 60 µl of cold isopropyl alcohol was added into the tube
and kept at -20oC for at least 20 min. DNA was precipitated as a pellet through centrifugation
at 12,000 rpm for 15 min. The DNA pellet was washed with 700 µl of 75% cold ethanol three
times, air dried, and dissolved with 100 µl TE buffer. The DNA concentration and quality
were determined through electronphoresis and also a spectrophotometer (Nano drop ND-
1000, Bio-Rad, Hercules, CA, USA). Stock DNA was stored at -20oC. The working solution
of DNA was diluted to 1 ng/µl in sterilized deionized distilled water (ddH2O) for each isolates
and stored at 4oC.
PCR amplification. Seventeen co-dominant SSR markers were used for genotyping
the Pst isolates (Table 1). A 12-µl PCR mix consisted of 5.56 µl of sterilized ddH2O, 1.2 µl
of 10x standard Taq polymerase buffer (BioLabs, MA, USA), 1.2 µl of 25mM MgCl2
(BioLabs), 0.96 µl of 2.5 mM of the dATP, dCTP, dGTP, and dTTP mixture (Sigma
Chemical, MO, USA), 0.12 µl of 5 µM forward primer, 0.24 µl of 10 µM M13 universal
primer, 0.6 µl of 5 µM reverse primer, 0.12 µ of 5 unit Taq polymerase (Promega, WI, USA),
and 2 µl of DNA (1 ng/µl). Each forward primer had M13 tail
(CACGACGTTGTAAAACGAC) at the 5’ end. The M13 universal primer was labeled with
one of fluorescent reporter dyes, FAM for blue, VIC for green, NED for yellow, and PET for
red (Applied Biosystems, CA, USA). Amplification of DNA was done with a Peltier Thermal
Cycler (BIO-RAD, CA, USA) with a temperature profile of 94ºC for 5 min for initial
denaturation; 40 cycles of 94ºC for 30 s, 45-54ºC for 30 s depending upon primer, and 72ºC
for 1 min; and 7 min of final extension at 72ºC. Four PCR products with four different

181
Table 1. Sequences, repeat motifs, and annealing temperature of simple sequence repeat (SSR) primers used for characterization
of Puccinia striiformis f. sp. tritici collections
Markers
Primers (5’-3’)a
Repeat motif
Annealing
temp. (oC) Forward
b Reserve
CPS02 GTTGGCTACGAGTGGTCATC TAACACTACACAAAAGGGGTC (TC)9 50
CPS04 GGGAAGCACAAGAACGGTC AGGGTGGTGTCAGCTAGTTGG (TC)8 53
CPS08 GATAAGAAACAAGGGACAGC CAGTGAACCCAATTACTCAG (CAG)14 50
CPS10 TCTACTGGGCAGACTGGTC CGGTTTGTTTTGTCGTTTC (TAG)8 47
CPS13 TCCAGGCAGTAAATCAGACGC ATCAGCAGGTGTAGCCCCATC (GAC)6 54
PstP001 ACCATCGGATTCCTGC ACGGTAGGCGAACGAC (CTA)6 49
PstP002 CTGACCATCGGATTCCTGC TGAACGGTAGGCGAACGAC (ACT)6 53
PstP003 TAACCCCACGGCAACTCA ATCGTTGGCAGCCTTACC (AATA)5 50
PstP004 TCTCGCCTCGCTTGAATG TCGCTGGAGTTGGATGGA
(TCA)6
+(CTTT)6
50
PstP005 CCAACAGGCTCAAACTACCA TCCGCTTCGATCATAGCAC (ACC)6 52
PstP006 GTTTGATTTTCCCTATGC AACTGAACGGAAGATGC (TGT)6 45
PstP007 GATTTGCGAGGTCACTTT TGGTTGTGATAACGATGA (GAA)9 46
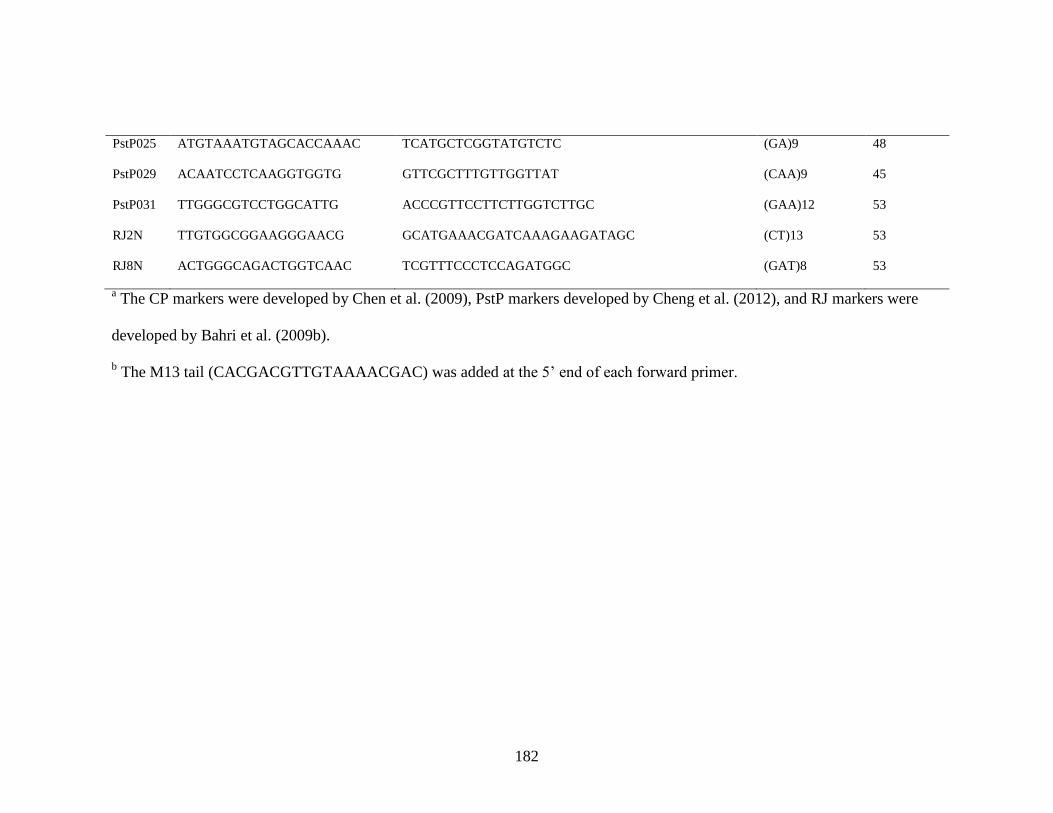
182
PstP025 ATGTAAATGTAGCACCAAAC TCATGCTCGGTATGTCTC (GA)9 48
PstP029 ACAATCCTCAAGGTGGTG GTTCGCTTTGTTGGTTAT (CAA)9 45
PstP031 TTGGGCGTCCTGGCATTG ACCCGTTCCTTCTTGGTCTTGC (GAA)12 53
RJ2N TTGTGGCGGAAGGGAACG GCATGAAACGATCAAAGAAGATAGC (CT)13 53
RJ8N ACTGGGCAGACTGGTCAAC TCGTTTCCCTCCAGATGGC (GAT)8 53
a The CP markers were developed by Chen et al. (2009), PstP markers developed by Cheng et al. (2012), and RJ markers were
developed by Bahri et al. (2009b).
b The M13 tail (CACGACGTTGTAAAACGAC) was added at the 5’ end of each forward primer.

183
fluorescent reporter dyes were pooled together. A pooled final volume was 25 µl. This PCR
dilution was prepared consisting of 3 µl of PCR products with FAM, 3 µl of PCR products
with VIC, 4 µl of PCR products with NED, 6 µl of PCR products with PET and 9 µl of
ddH2O using Biomek® NXP Laboratory Automation Workstation (BECKMAN COULTER,
Fullerton, CA, USA). Prior to capillary electrophoresis, 3 µl of pooled PCR products were
diluted with 9 µl of Hi-Di™ Formamide (Applied Biosystems) and 1 µl of 445 bp Cassul
DNA ladder (Applied Biosystems) with a final volume of 13 µl. Thus prepared samples were
denatured for 5 min at 95ºC. The quadrupled PCR products were subject to capillary
electrophoresis using an ABI37xl DNA Analyzer (Applied Biosystems). Since Pst is a
dikaryotic fungus, each isolate was scored to determine homozygous or heterozygous for each
SSR locus using program GeneMarkerV1.5 (Softgenetics, PA, USA).
Data analyses. GenAlEx v6.411 software was used to compute percentage of
polymorphic loci and number of private alleles by country of Pst isolates (Peakall and
Smouse 2006). STRUCTURE v2.3.3 was used to determine the population subdivisions of
the Pst isolates (Pritchard et al. 2000). STRUCTURE is based on Bayesian algorithm and it
allows selecting different population models to cluster isolates into distinct populations, K.
An admixture model was selected assuming unknown ancestry of Pst collections. This model
gives estimation on what fraction of an isolate’s genome is from ancestors in population K
and also allows identifying admix genotypes. An initial burn-in period of 100,000 with
100,000 repetitions per run was performed for K ranging from 1 to 12 with 10 runs with
independent allele frequency set. This test was done twice to get the robust results. The
number of population clusters was determined based on the rate of change in the log
probability of data between successive K values, DeltaK (ΔK) as described by Evanno et al.

184
(2005). Mean ΔK was estimated using STRUCTURE HARVESTER v0.6.8 (Earl et al.
2011). A membership probability of ≥0.80 in Q-matrices obtained in STRUCTURE was used
to assign Pst isolates into sub-populations, where Q is the proportion of individual i’s genome
that originated from population K.
STRUCUTRE analysis assumes panmixia in subpopulations. Assumptions made to
determine Pst population subdivisions under STRUCUTRE could be violated in the Pst
pathosystem. Although alternate hosts for Pst have been identified under greenhouse
conditions (Jin et al. 2010), Pst has strongly clonal reproduction in nature (Ali et al. 2010).
Therefore, relative pairwise distance and groupings of isolates were analyzed using non-
parametric multivariate analysis i.e. principal co-ordinate analysis (PCA) in NTSYSpc v2.21
(Rohlf 2008). PCA has the important advantage over STRUCUTRE because PCA does not
require underlying prior assumptions about a genetic model. SSR alleles were coded
according to the NTSYSpc v2.21 for diploid population. Each column corresponding to an
allele and each row corresponding to an individual isolate were assigned. Absent of an allele
was coded as 0, each allele was presented as 1 and the homozygous condition as 2. A
similarity matrix (SM) based on simple matching coefficient was computed using the
SIMQUAL module. The SM matrix was transformed with DCENTER module and the
resulting double-centered matrix was used to compute eigenvectors using the EIGEN module
in NTSYS. A PC plot was generated from eigenvector. Normalize Mantel test was done
between the double-center similarity matrix and a distance matrix derived from the
eigenvectors in SIMINT module to test the extent to which the PCA showed the pattern of
relative distances among the isolates. Cluster analysis of the isolates based on similarity
coefficient was also performed by constructing a dendrogram using the unweighted pair group

185
method with arithmetic means (UPGMA) clustering method in NTSYS. A UPGMA tree was
generated with SM matrix in the SAHN module. The dendrogram with the best fit to the
similarity matrix was selected based on the highest matrix correlation value obtained through
normalized Mantel test. The correlation value between a similarity matrix and a cophenetic
matrix was computed using the MXCOMP module of the NTSYS program.
Mean genetic variations across the SSR loci based on the number of observed alleles
(na), the number of effective alleles (ne), Shannon’s information index (I), observed
heterozygosity (Ho), Nei’s expected heterozygosity (He), unbiased expected heterozygosity
(UHe) (Nei 1978), and fixation index (F) were computed using GenAlEx. Collections of Pst
isolates were defined based on country of origin and grouped into eight regions based on
country proximity and epidemiological regions for analysis of molecular variance (AMOVA).
These regions were: East Asia, with isolates from China; West and South Asia, isolates from
Nepal, Pakistan and Turkey; Central Asia, isolates from Kyrgyzstan, Turkmenistan, and
Uzbekistan; Europe, with isolates from Hungary, Russia, and Spain; North America, with
isolates from Canada, Mexico, and the United States; South America, isolates from Chile.
Collections from Algeria, Kenya, Australia and Tajikistan were not assigned to any regions
due to limited number of isolates. AMOVA allows the hierarchical partitioning of genetic
variation within and between the regions (Excoffier et al. 1992). AMOVA was computed
separately based on FST and RST statistics as described in GenAlEx. FST statistics assumes an
infinite allele model (Wright 1965) and RST statistics is based on a stepwise mutation model
(Slatkin 1995). AMOVA was performed with 999 permutations following suppress within
individual option for co-dominant data with regional data structure format.

186
Pairwise comparisons among regional collections of Pst were conducted based on FST,
RST, and Nei’s genetic distance (Nei 1972). Different RST values suggest different levels of
population differentiations. An RST = 0 indicates panmictic populations; an RST < 0.05
implies populations that are negligibly differentiated; 0.05 < RST > 0.25 denotes that
populations are moderately differentiated; an RST > 0.25 indicates populations that are highly
differentiated; and an RST = 1 shows populations that are completely differentiated and do not
share migrants (Slatkin 1995). FST ranges from 0 to 0.05 indicates little genetic
differentiation, 0.05 to 0.15 implies moderate genetic differentiation, 0.15 to 0.25 indicates
great genetic differentiation, and >0.25 denotes very great genetic differentiation (Wright
1978). Multiple comparisons between the regions (n = 15) increase in Type I statistical error,
therefore the level of significance α was corrected by Bonferroni correction method (Rice
1989). Hence, the calculated significance level used for FST and RST comparisons between
regions was α = 0.003 (0.05/15). FST and RST between regions were calculated in AMOVA
option of GenAlEx.
RESULTS
SSR loci and genotypes. The number of alleles per locus ranged from 2 to 6, with
average of 3.76 per locus (Table 2). A total of 64 alleles were observed among the 17 SSR
loci. The numbers of alleles ranged from 3 to 12 among the SSR loci with average of 6
alleles per locus. The amplified fragment sizes ranged from 120 to 507 bp. The 292 isolates
were discriminated into 231 unique SSR genotypes (Table 3). Polymorphism of the SSR loci
at a country level ranged from 64 to 100% with a mean of 86% per locus. A total of 14
private alleles were observed at 10 SSR loci. These private alleles were in isolates from

187
Table 2. Number of alleles per locus, allele size, and number of genotypes for the 17 simple
sequence repeat primers identified in the international Puccinia striiformis f. sp. tritici
collections
Primer pair Number of alleles Size of alleles (bp) No of genotypes
CPS02 6 120, 122, 125, 128, 130, 134 10
CPS04 6 270, 272, 274, 276, 278, 280 11
CPS08 6 205, 212, 216, 222, 224, 228 11
CPS10 4 347, 350, 353, 359 6
CPS13 4 134, 146, 149, 158 4
PstP001 5 348, 350, 356, 362, 366 6
PstP002 4 352, 358, 362, 368 6
PstP003 2 226, 241 3
PstP004 2 502, 507 3
PstP005 4 309, 318, 322, 330 4
PstP006 2 245, 248 3
PstP007 3 303, 310, 314 6
PstP025 4 368, 380, 389, 396 7
PstP029 2 195, 198 3
PstP031 3 274, 279, 284 4
RJ2N 5 193, 199, 202, 206, 214 12
RJ8N 2 329, 332 3
Total 64

188
Table 3. Number of isolates, percentage of polymorphic loci, private alleles, and number of
genotypes identified from isolates of Puccinia striiformis f. sp. tritici from various countries
Countries No. of
isolates
Polymorphic
loci (%)
Private alleles
No. of
genotypes
No.
of
loci
No. of
alleles
No. of
individuals (%)
Algeria 1 64 0 1
Australia 5 94 0 5
Canada 5 76 0 4
Chile 15 100 1 1 1 (6) 14
China 63 94 2 3 22 (34) 54
Hungary 4 82 0 4
Kenya 4 70 0 3
Kyrgyzstan 4 76 0 4
Mexico 4 82 0 3
Nepal 24 100 2 3 7 (29) 24
Pakistan 46 100 2 3 6 (13) 43
Russia 9 94 1 2 2 (22) 9
Spain 2 82 0 2
Tajikistan 1 64 0 1
Turkmenistan 4 82 0 4
Turkey 56 94 2 2 2 (3) 43
USA 28 100 0 23
Uzbekistan 17 94 0 16
Total 292 Mean 86 231

189
China (3), Nepal (3), Pakistan (3), Russia (2), Turkey (2), and Chile (1). These private alleles
may be useful for tagging the distinct genotypes.
Genetic clustering and geographical differentiation. The log likelihood of the data
was drawn against K runs using STRUCTURE HARVESTER to identify the rate of change in
the log probability of data between successive, DeltaK (ΔK). Both independent runs of
STRUCUTRE analysis yielded the highest DeltaK value at K = 2. Therefore, the two
population subdivisions of Pst were determined. The membership probability threshold level
was assigned at ≥ 0.80. Clustering of all isolates to their respective genetic clusters is
presented in Supplement Fig. 1. Genetic cluster 1 (GC1) was the largest group and contained
55% of isolates; GC2 contained 35% of isolates; and the remaining 10% of isolates formed an
admix group, which appeared to be recombinant isolates between GC1 and GC2. Isolates
belonging to GC1 were present in all countries. All isolates from Australia, Canada, Kenya,
Kyrgyzstan, Mexico, Russia, Tajikistan, and Turkmenistan belonged to GC1 (Fig. 1). Other
members of GC1 were 93% isolates from Chile, 86% from the U.S., 75% from Hungary, 72%
from Pakistan, 61% from Turkey, 42% from Nepal, 12% from Uzbekistan, and 3% from
China. None of the countries had all isolates in either GC2 or the admix group. The isolates
of GC2 and the admix group were mostly from Asian countries. The majority of the isolates
from China (87%) and Uzbekistan (82%) belonged to GC2. Some of the isolates from Turkey
(30%), Nepal (29%), Pakistan (15%), Chile (7%), and the U.S. (7%) were also members of
GC2. Admix isolates were from Nepal (29%), Hungary (25%), Pakistan (13%), China (10%),
Turkey (9%), the U.S. (7%), and Uzbekistan (6%). The PCA analysis revealed two major
groups of isolates, which was consistent with the results obtained from the STRUCUTRE
analysis. Admix isolates were found to be between the two PCA groups (Fig. 2). The first

190
two and three axes of the PCA accounted for 48.8% and 52.5% of the total genetic variation,
respectively. The correlation between the double-center similarity matrix and a distance
matrix derived from the eigenvectors was high (r = -0.81).
The UPGMA analysis discriminated the 292 isolates into 15 molecular groups (MGs)
at a 0.79 similarity cutoff point, the mean value of the similarity range (Fig. 3). The isolates
belonging to different MGs are given in Supplemental Figures 2 - 5. Super group 1,
consisting of MG1 to MG10, represented 78% of the total isolates and super group 2,
consisting of MG11 to MG15, counted for 22% of the isolates. These two super groups had a
0.58 similarity coefficient. In general, relative large individual MGs, such as MGs 1, 7, 10,
and 11 had isolates from different countries. MGs 2, 4, and 6 each had two isolates, all from
Nepal. Another country-specific MG was MG14 with two isolates from Pakistan.
The clustering of isolates based on MGs corresponded to the genetic clusters, GC1 and
GC2, based on the STRUCTURE and PCA analyses. None of the MGs had isolates in both
GC1 and GC2. MGs 1, 6, 8, 14 and 15 contained isolates of GC1. Isolates grouped in MGs
12 and 13 had all isolates of GC2. Only MG2 had all isolates from the admix group. The
remaining of MGs contained isolates of either GC1 and admix or GC2 and admix. MG3 had
one isolate from GC1 and 4 from the admix group. MG7 had 90% of its isolates from GC1
and 10% from the admix group. Molecular groups with majority of the isolates from GC2
were MG10 (98%) and MG12 (95%). Other relatively small MGs with collections from GC2
and the admix group were MGs 4, 5, and 9. Of the 292 isolates, 6 isolates from Asia did not
cluster into any MG. Among these isolates, PK07-3 and NP08-8 had private alleles and these
isolates belonged to GC1 and the admix group, respectively. PK07-11 and KG08-1 were of
GC1. PK07-10 and PK09-7 belonged to the admix group. The correlation between the

191
Fig. 1. Genetic clusters of international collections of Puccinia striiformis f. sp. tritici. The
circle size represents the relative number of isolates from each country.

192
Fig. 2. Three-dimensional principal coordinate plot of Puccinia striiformis f. sp. tritici isolates
based on 17 SSR marker data. Isolates are represented by their genetic clusters as identified
by Bayesian analysis in STRUCUTRE.

193
Fig. 3. Dendrogram of 15 molecular groups (MG) based on 17 SSR markers of Puccinia
striiformis f. sp. tritici collections using unweighted pair group arithmetic mean method. AU
= Australia, CA = Canada, CL = Chile, CN = China, DZ = Algeria, ES = Spain, HU =
Hungary, KE = Kenya, KG = Kyrgyzstan, MX = Mexico, NP = Nepal, PK = Pakistan, RU =
Russia, TJ = Tajikistan, TM = Turkmenistan, TR = Turkey, US = the United States, and UZ =
Uzbekistan.
194
similarity matrix and the matrix of ultrametric distances was 0.91, indicating a very good fit
of the UPGMA tree.
Genetic diversity. The single-locus statistics averaged over 17 SSR loci for each Pst
isolate by country and grand mean are presented in Table 4. Countries, Algeria, Spain, and
Tajikistan, with limited number of isolates (<4), were not included for the country-wise
collection comparisons as well as for calculating the grand mean. The highest number of
observed alleles per locus with collections from Nepal (2.88) indicates allelic richness in the
Nepal Pst collection. Whereas, the lowest number of alleles was observed for Kenya at 1.70
per locus. The average number of alleles per locus across all isolates was 2.22. Isolates from
Nepal had the highest effective alleles per locus (2.01) and the lowest with the collection from
Mexico (1.52). Shannon’s information index indicated isolates from Nepal had the highest
gene diversity on a locus basis (0.775) and isolates from Mexico had the lowest gene diversity
(0.448). The average of observed heterozygosity per locus across all isolates was higher than
Nei’s expected heterozygosity and unbiased expected heterozygosity. The collection from
Canada had the most deviated Nei’s expected heterozygosity and unbiased expected
heterozygosity. The value of fixation index ranged from 0.18 (Pakistan collections) to -0.81
(Kenya collections).
Partitions of genetic variation and genetic differentiation. Analysis of molecular
variance (AMOVA) revealed that the difference in genetic variation mostly was governed by
within-country or among-isolate variation rather than by among regions or among countries
within regions. The genetic variation within countries was 89% (P = 0.001) based on FST and
96% (P = 0.038) based on RST statistics. The regional difference in genetic variation was
significant but low (6%, P = 0.001 based on FST and 4%, P = 0.001 based on RST) (Table 5).
195
The difference in genetic variation among countries within regions was found significant only
based on FST statistics (6%, P = 0.001).
Regional pairwise comparisons of genetic differentiation based on FST and RST are
given in Table 6. The level of significance was α = 0.003 (0.05/15) after Bonferroni
correction for 15 pairwise comparisons. Insignificant genetic differentiation was observed
between West and South Asia - Europe, North America - Europe, North America - South
America, and Europe - South America. Among the significant genetic differentiations, FST
values ranged from 0.042 (West and South Asia - North America) to 0.211 (East Asia -
Europe). Since all FST values obtained were < 0.25, there was no very high genetic
differentiation among the regions; however, great genetic differentiation (0.15 < FST >0.25)
was observed between East Asia - Europe, East Asia - North America, East Asia - South
America, and Central Asia - South America. The remaining regions had little genetic
differentiation. Of the 15 regional comparisons, 9 had no significant genetic differentiation
based on RST statistics. All above mentioned insignificant genetic differentiation region
comparisons based on FST also had non-significant genetic differentiation based on RST. In
addition, East Asia - Central Asia, West and South Asia - Central Asia, West and South Asia -
North America, East Asia - Europe, and East Asia - South America had no significant genetic
differentiation based on RST. Significant RST values ranged from 0.028 (East Asia - West and
South Asia) to 0.158 (Central Asia - North America). None of the regions were highly
differentiated (RST > 0.25) from another region. Nei’s genetic distances ranged from 0.033
(North America - South America) to 0.246 (East Asia - South America). Higher Nei’s genetic
distances were found between East Asia and other regions outside Asia than within Asia.
Higher correlation coefficient between FST and Nei’s genetic distances (r = 0.99) indicates

196
close association between genetic differentiation based on FST and Nei’s genetic distance as
compared to correlation between RST and Nei’s genetic distances (r = 0.24).

197
Table 4. Mean values of observed alleles (na), effective alleles (ne), Shannon’s information index (I), observed heterozygosity
(Ho), expected heterozygosity (He), Unbiased expected heterozygosity (UHe), and fixation index (F) identified for collections of
Puccinia striiformis f. sp. tritici from various countries a
Countries na ne b I
c Ho
d He
e UHe
f F
g
Australia 2.00 1.55 0.48 0.35 0.31 0.34 -0.08
Canada 1.76 1.66 0.48 0.64 0.34 0.38 -0.81
Chile 2.35 1.70 0.59 0.45 0.38 0.39 -0.07
China 2.82 1.75 0.62 0.46 0.39 0.39 -0.15
Hungary 2.05 1.78 0.58 0.55 0.38 0.43 -0.46
Kenya 1.70 1.65 0.46 0.63 0.33 0.38 -0.86
Kyrgyzstan 1.76 1.68 0.50 0.55 0.35 0.40 -0.54
Mexico 1.88 1.52 0.44 0.44 0.29 0.33 -0.37
Nepal 2.88 2.01 0.77 0.49 0.47 0.48 -0.05
Pakistan 2.76 2.00 0.75 0.37 0.47 0.47 0.18
Russia 2.23 1.75 0.60 0.44 0.40 0.42 -0.00
Turkmenistan 1.82 1.63 0.50 0.55 0.34 0.39 -0.52
Turkey 2.70 1.90 0.67 0.47 0.43 0.43 -0.06
USA 2.17 1.75 0.61 0.50 0.40 0.41 -0.11
Uzbekistan 2.35 1.72 0.62 0.37 0.39 0.41 0.03
Grand meanh 2.22 1.74 0.58 0.48 0.38 0.40 -0.26
a A mean is across the 17 SSR loci
b Number of effective alleles = 1/1-Ha.

198
c Shannon’s information index = - ∑pi (lnpi), where ln is the natural logarithm and pi is the frequency of the ith allele.
d Observed heterozygosity = number of heterozygotes/n.
e Expected heterozygosity = 1- ∑ pi
2.
f Unbiased expected heterozygosity = 2n (1- ∑ pi
2)/ 2n-1.
g Fixation index = He-Ho/He.
h A grant mean is across the 17 SSR loci and 14 countries.

199
Table 5. Analysis of molecular variance based on FST and RST within and between collections of Puccinia striiformis f. sp. tritici
from different countries and international regions
Source of variation df Sum of
squares
Mean
squares
Estimated
variance
Variation
(%) Type
a Value P
Among Regions 5 171.12 34.22 0.22 6 FRT 0.05 0.001
Among countries within
regions 8 84.24 10.53 0.24 6 FSR
0.06 0.001
Within countries 548 1999.49 3.64 3.64 89 FST 0.11 0.001
Among Regions 5 43338.84 8667.76 92.89 4 RRT 0.03 0.003
Among countries within
regions 8 13704.63 1713.07 0.00 0 RSR
0.00 0.527
Within countries 548 1330027.95 2427.05 2427.05 96 RST 0.02 0.038
a FRT = VAR/(VWP + VAP + VAR), where VAR = variance among regions, VAP = variance among populations within regions, and VWP =
variance within populations.
FSR = VAP/(VAP + VWP).
FST = VAP/(VAP + VWP).
RRT = VAR/(VWP + VAP + VAR)
RSR = VAP/(VAP + VWP)
RST = VAP/(VAP + VWP)

200
Table 6. Genetic differentiation and Nei’s genetic distance between collections of Puccinia
striiformis f. sp. tritici by international regions
Regionsa FST
b RST
b
Nei’s genetic
distance
East Asia - West and South Asia 0.096 (0.001) 0.028 (0.001) 0.090
East Asia - Central Asia 0.059 (0.002) 0.004 (0.075) 0.056
West and South Asia - Central Asia 0.046 (0.001) 0.010 (0.059) 0.054
East Asia – Europe 0.211 (0.001) 0.021 (0.040) 0.222
West and South Asia - Europe 0.036 (0.018) 0.000 (0.372) 0.049
Central Asia – Europe 0.083 (0.001) 0.149 (0.001) 0.100
East Asia - North America 0.192 (0.001) 0.036 (0.001) 0.180
West and South Asia - North America 0.042 (0.001) 0.004 (0.118) 0.041
Central Asia - North America 0.116 (0.001) 0.158 (0.001) 0.115
Europe - North America 0.031 (0.050) 0.000 (0.371) 0.040
East Asia - South America 0.241 (0.001) 0.070 (0.030) 0.246
West and South Asia - South America 0.087 (0.001) 0.078 (0.002) 0.094
Central Asia - South America 0.152 (0.001) 0.082 (0.001) 0.164
Europe - South America 0.076 (0.009) 0.033 (0.192) 0.084
North America - South America 0.026 (0.075) 0.084 (0.016) 0.033
a Regions were defined as in the text.
b values within parenthesis are probability value based on 999 permutations. Significance
level used for comparisons between regions was α = 0.003 (0.05/15) as corrected by the
Bonferroni method (Rice 1989).

201
DISCUSSION
This worldwide collection of Puccinia striiformis f. sp. tritici were found to contain
two major genetic groups with some isolates in an admix group. All isolates of Pst from
Australia, Canada, Kenya, Kyrgyzstan, Mexico, Russia, Tajikistan, and Turkmenistan; and
majority of isolates from Hungary, Nepal, Pakistan, the United States, and Turkey; and some
isolates from China and Uzbekistan formed the biggest genetic group, GC1. Therefore, the
Pst population was not highly differentiated among most countries and international regions,
except for the majority of isolates from China and Uzbekistan. Significant pairwise genetic
differentiation of collections from East Asia (China) with other regions further supports that
China has a mostly distinct population. The worldwide dominance and wide distribution of
isolates in GC1 may be explained by multiple introductions of isolates in GC1 as compared to
GC2. Therefore, genetic variation among isolates within countries was higher.
The widespread and predominance of GC1 isolates worldwide indicate that the
majority of Pst isolates have the same genetic background. The majority of the Chinese
isolates belonging a different genetic group, GC2, indicates that Pst in China may have been
maintained in some isolation from the rest of Asia and world (Stubbs 1988), except
Uzbekistan. Geographical barriers such as the Gobi Desert and Mongolian highlands on the
north; Tianshan Mountains, Karakoram Mountains, Himalaya Mountains, and Takla-Makan
Desert on the west; Hengduan Mountains and South China Sea on the south; and Pacific
ocean and Changbai Mountains on the east, may limit rust exchange between China and the
rest of the Asia. Exchange of Pst inoculum between China and its southwestern neighbors
Pakistan and Nepal is less likely than between China and Central Asian countries, such as
Uzbekistan. Although the Tianshan Mountains and Takla-Makan Desert may create barriers

202
for inoculum exchange between Central Asian countries and China, but these barriers may be
not as great as Himalayas, which is much taller. Most of isolates from Uzbekistan (82%)
belonging to CG2 suggests the possible inoculum exchange between China and central Asian
countries.
Co-dominant SSR markers used in this study revealed the presence of 10% isolates in
an admix group. Admix genotypes have been reported from Turkey and Lebanon (Bahri et al.
2009a), Pakistan (Ali et al. 2010, Bahri et al. 2011), and China and Nepal (Ali et al. 2010). In
addition, recombinants between Pst and P. striiformis f. sp. hordei, the barley stripe rust
pathogen, have been reported for isolates collected from grasses (Cheng and Chen 2009).
Such recombinant isolates may have been resulted from somatic recombination (Little and
Manngers 1969; Wright and Lennard 1980). Somatic hybridization under field conditions
may happen in mixed infection of genetically distinct isolates. In addition, Berberis spp. may
play a role in sexual recombination of Pst in some regions of the world as Berberis spp. are
widely distributed in Asia (Wahl et al. 1984; Perveen and Qaiser 2010; Zhao et al. 2011).
Aecial stage of rust on Berberis spp. were found in stripe rust epidemic regions in China
(Zhao et al. 2011) and Nepal (Sharma-Poudyal unpublished). The high number of admix
genotypes in these Berberis spp. distributed regions in Asia demands further study to
determine the possible role of Berberis spp. for genetic recombination in these areas.
In general, Pst isolates were not grouped by country. The lack of geographical
differentiation based on Bayesian statistics, principal component analysis, and cluster analysis
suggest migration or introduction of isolates among the regions. Identical SSR genotypes
were identified among Chile, Mexico, and U.S.; Mexico and U.S.; Canada, Chile, Kenya,
Mexico, Nepal, Pakistan, U.S., and Turkey; Turkey and U.S.; Turkey and China; Canada and

203
China; Kenya and Pakistan; and China, Nepal, Turkey, and Uzbekistan. Identical SSR
genotypes between the collections from different countries could be explained by large
distance movement of Pst across the countries and continents. Long distance migrations of
rust urediniospores through wind or human activities led introductions have been well
documented (Wellings and McIntosh 1990; Kolmer 2005; Wellings 2007; Hodson 2011).
Stripe rust of wheat in Australia in 1979 is believed to be caused by spores carried on clothing
from a source in Europe (Wellings and McIntosh 1990; Wellings 2007). Single clonal
migration of P. striiformis through urediniospores was reported between the United Kingdom,
France, Germany, and Denmark (Hovmøller et al. 2002). Similar strains of Pst have been
rapidly spread globally in North America, Australia, and Europe (Hovmøller et al. 2008).
Recently, Bahri et al. (2011) reported Pst isolates in Pakistan representing lineages from
Western Mediterranean, Northern Europe, and Central Asia from the same area in Pakistan.
These exotic incursions of wheat rusts in distant countries are in close association with
exponential growth in air travel and international trade. Therefore, even if there is no
plausible explanation of gene flow from wind-borne urediniospores between countries, exotic
incursions of wheat rusts are more likely in many countries mostly due to human activities
(Hodson 2011).
Analysis of molecular variance with FST and RST statistics consistently showed
significant levels of genetic differentiation among regions and within countries. Most of the
variation was present among isolates from individual countries. Similar pairwise regional
relationships based on FST and Nei’s genetic distances are explained by high correlation (r =
0.99, P < 0.0001) between FST and Nei’s genetic distances. However, non-significant and low
correlation coefficient was found between RST and Nei’s genetic distance (r = 0.24), and

204
between FST and RST (r = 0.22). This is because FST and Nei are based on the allele
frequencies and RST is based on the allele size (Ordoñez and Kolmer 2007). Differences in the
genetic differentiation between regions based on FST and RST are due to the different bases for
calculation of FST and RST. RST assumes evolution of SSR loci in accordance with a stepwise
mutation model. SSR alleles with similar length have less variation as compared to alleles
that are very different in length (Valdes et al. 1993). In addition, possible presence of
homoplasy at one or more loci may influence RST statistics (Ordoñez and Kolmer 2007). Pst
isolates from East Asia and Central Asia were significantly different mostly from those of
North America and South America based on FST and RST statistics. However, the higher
proportion of genetic variations within countries than between countries or between
international regions indicates that isolates within countries are highly variable. High genetic
variability within populations were also observed in other Puccinia spp., such as P. triticina
(Ordoñez and Kolmer 2007), P. graminis f. sp. tritici (Admassu et al. 2010), and P.
melanocephala (Pocovi et al. 2010).
The presence of private alleles in some collections indicates the genetic distinction of
those isolates. Private alleles were found in isolates from China, Pakistan, Nepal, Turkey,
Russia, and Chile. The presence of private alleles in these countries indicates that some of the
isolates are different from the rest of the collections. These alleles are likely resulted from
mutations, which might have occurred recently and have not migrated outside the country.
Collections from these countries may have more genetic diversity than others, although
Shannon’s information index showed that collections from different countries had similar
levels of genetic diversity. Among the countries, collections from Nepal had the highest
number of alleles, highest number of effective alleles per locus, and Shannon’s information

205
index. This indicates that the Pst population in Nepal possesses a higher genotypic diversity
than other countries. The mean observed heterozygosity of SSR alleles across all collections
was higher than Nei’s and unbiased expected heterozygosity. Heterosis selection may favor
the selection of such heterozygous Pst individuals in nature and help to maintain
heterozygosity. A high level of heterozygosity has been reported in other rust pathogens, P.
triticina (Ordoñez and Kolmer 2007), P. graminis f. sp. tritici (Burdon and Roelfs 1985),
Uromyces appendiculatus (Groth et al. 1995), and Melampsora lini (Barrett et al. 2008). The
negative grand mean of fixation index further indicates that Pst has excess of heterozygosity.
The Pst collections from the 18 countries varied in sample number. Irrespective of
sample size from different countries, all collections were used in Bayesian analysis in
STRUCUTRE, PCA, and UPGMA in NYSYS. The results from these analyses were used to
make general conclusions about the overall collections but country-wise interpretation should
be made cautiously. Only collections with ≥10 were included in region for AMOVA. In
general, estimates based on sample sizes of ≥30 are considered reliable to infer the population
characteristic of fungal pathogens (McDonald 1997). However, sample number as minimum
as 1 (Hovmøller et al. 2008), 2 (Ordoñez and Kolmer 2007), and 4 (Ali et al. 2010) has been
used in analyzing worldwide collections of the rust pathogens. In the present study, countries
with <4 isolates were not included for comparisons of genotypic variation and heterozygosity
collections between countries. Although several population statistics have been estimated
with sample size ≥4, further studies with adequate samples are needed to get the population
structures in individual countries.
This study determined that the worldwide collections of the wheat stripe rust pathogen
have two genetic groups and some admix genotypes. The majority of admix isolates were

206
from Asian countries. The Admix group may have been originated from recombination
between the two genetic groups. Aecial hosts, Berberis spp. are widely distributed in Asia.
Berberis spp. may have a role in the origin of recombinant isolates. Somatic recombination
may also have contributed to the formation of this genetic group. The low level of genetic
variations between the international regions may be due to inter-regional or inter-country
exchange of Pst urediniospores through long-distance migration via winds and human
activities. The high genetic variations among isolates within countries show that the Pst
population within a country is highly variable.
ACKNOWLEDGMENTS
We would like to thank Dr. E. T. McDowell for technical assistance. We would like
to thank Drs. D. A. Johnson and T. D. Murray for critical review of the manuscript.
LITERATURE CITED
1. Admassu, B., Wolfgang, F., and Frank, O. 2010. Genetic characterization of Puccinia
graminis f. sp. tritici populations from Ethiopia by SSRs. J. Phytopathol. 158:806-812.
2. Ali, S., Leconte, M.,Walker, A. S., Enjalbert, J., and de Vallavieille-Pope, C. 2010.
Reduction in the sex ability of worldwide clonal populations of Puccinia striiformis f. sp.
tritici. Fungal Genet. Biol. 47:828-38.
3. Bahri, B., Leconte, M., de Vallavieille-Pope, C., and Enjalbert J. 2009b. Isolation of ten
microsatellite loci in an EST library of the phytopathogenic fungus Puccinia striiformis f.
sp. tritici. Conservation Genetics 10:1425-1428.

207
4. Bahri, B., Leconte, M., Ouffroukh, A., de Vallavieille-Pope, C., and Enjalbert, J. 2009a.
Geographic limits of a clonal population of wheat yellow rust in the Mediterranean region.
Mol. Ecol.18:4165-4179.
5. Bahri, B., Shah, S. J. A., Hussain, S., Leconte, M., Enjalbert, J., and de Vallavieille-Pope,
C. 2011. Genetic diversity of the wheat yellow rust population in Pakistan and its
relationship with host resistance. Plant Pathol. 60:649-660.
6. Barrett, L. G., Thrall, P. H., Burdon, J. J., Nicotra, A. B., and Linde, C. C. 2008.
Population structure and diversity in sexual and asexual populations of the pathogenic
fungus Melampsora lini. Mol. Ecol. 17:3401-3415.
7. Burdon, J. J., and Roelfs, A. P. 1985. Isozyme and virulence variation in asexually
reproducing populations of Puccinia graminis and P. recondita on wheat. Phytopathology
75:907-913.
8. Chen, C. Q., Zheng, W. M., Buchenauer, H., Huang, L. L., Lu, N. H., and Kang, Z. S.,
2009. Isolation of microsatellite loci from expressed sequence tag library of Puccinia
striiformis f. sp. tritici. Mol. Ecol. Resour. 9:236-238.
9. Chen, S., Nelson, M. N., Ghamkhar, K., Fu, T., and Cowling, W. A. 2008. Divergent
patterns of allelic diversity from similar origins: the case of oilseed rape (Brassica napus
L.) in China and Australia. Genome 51:1-10.
10. Chen, W. Q., Wu, L. R., Liu, T. G., Xu, S. C., Jin, S. L., Peng, Y. L., and Wang, B. T.
2009. Race dynamics, diversity, and virulence evolution in Puccinia striiformis f. sp.
tritici, the causal agent of wheat stripe rust in China from 2003 to 2007. Plant Dis.
93:1093-1101.

208
11. Chen, X. M. 2005. Epidemiology and control of stripe rust [Puccinia striiformis f. sp.
tritici] on wheat. Can. J. Plant Pathol. 27:314-337.
12. Chen, X. M., Line, R. F., and Leung, H. 1993. Relationship between virulence variation
and DNA polymorphism in Puccinia striiformis. Phytopathology 83:1489-1497.
13. Chen, X. M., Moore, M., Milus, E. A., Long, D. L., Line, R. F., Marshall, D., and
Jackson, L. 2002. Wheat stripe rust epidemics and races of Puccinia striiformis f. sp.
tritici in the United States in 2000. Plant Dis. 86:39-46.
14. Chen, X. M., Penman, L., Wan, A. M., and Cheng, P. 2010. Virulence races of Puccinia
striiformis f. sp. tritici in 2006 and 2007 and development of wheat stripe rust and
distributions, dynamics, and evolutionary relationships of races from 2000 to 2007 in the
United States. Can. J. Plant Pathol. 35:315-333.
15. Cheng, P., and Chen, X. M. 2009. Somatic hybridization in Puccinia striiformis revealed
by virulence patterns and microsatellite markers. Phytopathology 99:S23.
16. Cheng, P., and Chen, X. M. 2011. Development of expressed sequence tag-derived SSR
markers for Puccinia striiformis, the stripe rust pathogen. Phytopathology 101:S35.
17. Duan, X., Tellier, A., Wan, A., Leconte, M., de Vallavieille-Pope, G., and Enjalbert, J.
2010. Puccinia striiformins f. sp. tritici presents high diversity and recombination in the
over-summering zone of Gansu, China. Mycologia 102:44-53.
18. Earl, D, A., and vonHoldt, B. M. 2011. STRUCTURE HARVESTER: a website and
program for visualizing STRUCTURE output and implementing the Evanno method.
Conserv. Genet. Resour. DOI: 10.1007/s12686-011-9548-7.

209
19. Enjalbert, J., Duan, X., Giraud, T., Vautrin, D., De Vallavieille-Pope, C., and Solignac, M.
2002. Isolation of twelve microsatellite loci, using an enrichment protocol, in the
phytopathogenic fungus Puccinia striiformis f. sp. tritici. Mol. Ecol. Notes 2:563-565.
20. Enjalbert, J., Duan, X., Leconte, M., Hovmøller, M. S., and de Vallavieille-Pope, C. 2005.
Genetic evidence of local adaptation of wheat yellow rust (Puccinia striiformis f. sp.
tritici) within France. Mol. Ecol. 14:2065-2073.
21. Evanno, G., Regnaut, S., and Goudet, J. 2005. Detecting the number of clusters of
individuals using the software Structure: a simulation study. Mol. Ecol. 14:2611-2620.
22. Excoffier, L., Smouse, P. W., and Quattro, J. M. 1992. Analysis of molecular variance
inferred from metric distances among DNA haplotypes: applicant to human mitochondrial
DNA restriction data. Genetics 131:479-491.
23. Groth, J. V., McCain, J. W., and Roelfs, A. P. 1995. Virulence and isozyme diversity of
sexual versus asexual collections of Uromyces appendiculatus (bean rust fungus).
Heredity 75:234-242.
24. Hodson, D. P. 2011. Shifting boundaries: challenges for rust monitoring. Euphytica
179:93-104.
Hovmøller, M. S., Justesen, A. F., and Brown, J. K. M. 2002. Clonality and long-distance
migration of Puccinia striiformis f. sp. tritici in north-west Europe. Plant Pathol. 51:24-
32.
25. Hovmøller, M. S, Yahyaoui, A. H., Milus, E. A., and Justesen, A. F. 2008. Rapid global
spread of two aggressive strains of a wheat rust fungus. Mol. Ecol. 17:3818-3826.

210
26. Jin, Y., Szabo, L., and Carson, M. 2010. Century-old mystery of Puccinia striiformis life
history solved with the identification of Berberis spp. as an alternate host. Phytopathology
100:432-435.
27. Justesen, A. F., Ridout, C. J., and Hovmøller, M. S. 2002. The recent history of Puccinia
striiformis f. sp. tritici in Denmark as revealed by disease incidence and AFLP markers.
Plant Pathol. 51:13-23.
28. Kolmer, J. A. 2005. Tracking wheat rust on a continental scale. Curr. Opin. Plant Biol.
8:1-9.
29. Line, R. F. 2002. Stripe rust of wheat and barley in North America: a Retrospective
Historical Review. Annu. Rev. Phytopathol. 40:75-118.
30. Line, R. F., and Qayoum, A. 1992. Virulence, aggressiveness, evolution, and distribution
of races of Puccinia striiformis (the cause of stripe rust of wheat) in North America, 1968-
87. Technical Bulletin Number 1788. United States Department of Agriculture,
Agricultural Research Service.
31. Little, R., and Manners, J. G. 1969. Somatic recombination in yellow rust of wheat
(Puccinia striiformis). I. The production and possible origin of two new physiologic races.
Trans. Brit. Mycol. Soc. 53:251-258.
32. Markell, S. G., and Milus, E. A. 2008. Emergence of a novel population of Puccinia
striiformis f. sp. tritici in eastern United States. Phytopathology 98:632-639.
33. Mboup, M., Leconte, M., Gautier, A., Wan, A. M., Chen, W., de Vallavieille-Pope, C.,
and Enjalbert, J. 2009. Evidence of genetic recombination in wheat yellow rust
populations of a Chinese oversummering area. Fungal Genet. Biol. 46:299-307.

211
34. McDonald, B. A. 1997. The population genetics of fungi: tools and techniques.
Phytopathology 87:448-53.
35. McDonald, B. A., and Linde, C. 2002. Pathogen population genetics, evolutionary
potential, and durable resistance. Annu. Rev. Phytopathol. 40:349-379.
36. Michelmore, R. W., and Hulbert, S. H. 1987. Molecular markers for genetic analysis of
phytopathogenic fungi. Annu. Rev. Phytopathol. 25:383-404.
37. Nei, M. 1972. Genetic distance between populations. Am. Nat. 106:283-292.
38. Nei, M. 1978. Estimation of average heterozygosities and genetic distance from a small
number of individuals. Genetics 89:583-590.
39. Ordoñez, M. E., and Kolmer, J. A. 2007. Simple sequence repeat diversity of a worldwide
collection of Puccinia triticina from durum wheat. Phytopathology 97:574-583.
40. Peakall, R., and Smouse, P.E. 2006. GENALEX 6: genetic analysis in Excel. Population
genetic software for teaching and research. Mol. Ecol. Notes. 6:288-295.
41. Perveen, A., and Qaiser, M. 2010. Pollen flora of Pakistan–LXV. Berberidaceae. Pakis. J.
Bot. 42:1-6.
42. Pocovi, M. I., Rech, G. E., Collavino, N. G., Caruso, G. B., Ríos, R., and Mariott, J. A.
2010. Molecular diversity of Puccinia melanocephala populations. J. Phytopathol.
158:769-775.
43. Pritchard, J. K., Stephens, M., and Donnelly, P: 2000. Inference of population
structureusing multilocus genotype data. Genetics 155:945-959.
44. Rice, W. R. 1989. Analyzing tables of statistical tests. Evolution 43:223-225.
45. Rohlf, F. J. 2008. NTSYSpc: Numerical Taxonomy System, ver. 2.20. Exeter Publishing,
Ltd.: Setauket, NY.

212
46. Shan, W. X., Chen, S. Y., Kang, Z. S., Wu L. R., and Li., Z. Q. 1998. Genetic diversity in
Puccinia striiformis Westend. f. sp. tritici revealed by pathogen genome-specific
repetitive sequence. Can. J. Bot. 76:587-595.
47. Sharma-Poudyal D. and Chen X. 2011. Virulence diversity of international collections of
the wheat stripe rust pathogen, Puccinia striiformis f. sp. tritici. Phytopathology
101:S164.
48. Slatkin, M. 1995. A measure of population subdivision based on microsatellite allele
frequencies. Genetics 139:1463.
49. Steele, K. A., Humphreys, E., Wellings, C. R., and Dickinson, M. J. 2001. Support for a
stepwise mutation model for pathogen evolution in Australasian Puccinia striiformis f. sp.
tritici by use of molecular markers. Plant Pathol. 50:174-180.
50. Stubbs, R. W. 1985. Stripe rust. Pages 61-101. In: The Cereal Rusts, Vol. II. A. P. Roelfs
and W. R. Bushnell (Eds.). Academic Press, Orlando, FL.
51. Stubbs, R. W. 1988. Pathogenicity analysis of yellow (stripe) rust of wheat and its
significance in a global context. Pages 23-38. In: Breeding Strategies for Resistance to the
Rusts of Wheat. N. W. Simmonds, and S. Rajaram (Eds.). CIMMYT, Mexico DF,
Mexico.
52. Valdes, A. M., Slatkin, M., and Freimer, N. B. 1993. Allele frequencies at microsatellite
loci - the stepwise mutation model revisited. Genetics 133:737-749.
53. Wahl, I., Anikster, Y., Manisterski, J., and Segal, A. 1984. Evolution at the center of
origin. Pages 39-77. In: The Cereal Rusts Vol. 1: Origins, Specificity, Structure, and
Physiology. W. R. Bushnell and A. P. Roelfs (Eds.). Academic Press, Orlando, FL.

213
54. Wan, A. M., Chen, X. M., and He, Z. H. 2007. Wheat stripe rust in China. Aust.J. Agric.
Res. 58:605-619.
55. Wan, A. M., Zhao, Z. H., Chen, X. M., He, Z. H., Jin, S. L., Jia, Q. Z., Yao, G., Yang, J.
X., Wang, B. T., Li, G. B., Bi, Y. Q., and Yuan, Z. Y. 2004. Wheat stripe rust epidemics
and virulence of Puccinia striiformis f. sp. tritici in China in 2002. Plant Dis. 88:896-904.
56. Wellings, C. R. 2007. Puccinia striiformis in Australia: a review of the incursion,
evolution, and adaptation of stripe rust in the period 1979-2006. Aust. J.Agric. Res.
58:567-575.
57. Wellings, C. R. 2011. Global status of stripe rust: a review of historical and current
threats. Euphytica 179:1-13.
58. Wellings, C. R., and McIntosh, R. A. 1990. Puccinia striiformis f. sp. tritici in
Australasia: pathogenic changes during the first 10 years. Plant Pathol. 39:316-325.
59. Wright, R. G., and Lennard, J. H. 1980. Origin of a new race of Puccinia striiformis.
Trans. Brit. Mycol. Soc. 74:283-287.
60. Wright, S. 1965. The interpretation of population structure by F-statistics with special
regard to systems of mating. Evolution 19:395-420.
61. Wright, S. 1978. Evolution and the genetics of populations. Vol. 4. Variability within and
among Natural Populations. Univ. of Chicago Press, Chicago.
62. Zeng, S. M., and Luo, Y. 2006. Long-distance spread and interregional epidemics of
wheat stripe rust in China. Plant Dis. 90:980-988.
63. Zhao, J., Zhang, H. C., Yao, J. N., Chen, X. M., and Kang, Z. S. 2011. Identification of
Berberis spp. as alternate hosts of Puccinia striiformis f. sp. tritici in China. Page 167. In:

214
R. McIntosh (Ed.), Proceedings Borlaug Global Rust Initiative 2011 Technical Workshop.
June 13-16 Saint Paul, Minnesota, U.S.A.
64. Zheng, W. M., Liu, F., Kang, Z. S., Chen, S. Y., Li, Z. Q., and Wu, L. R. 2001. AFLP
fingerprinting of Chinese epidemic strains of Puccinia striiformis f. sp. tritici. Progr. Nat.
Sci. 11:587-593.
215

216
Supplemental Fig. 1. Genetic clusters of 292 Puccinia striiformis f. sp. tritici isolates
represented by country of origin of at two number of clusters from STRUCUTRE program
with a membership probability of ≥ 0.80 in Q-matrices. Standard country abbreviation
represents isolates country of origin: AU = Australia, CA = Canada, CL = Chile, CN = China,
DZ = Algeria, ES = Spain, HU = Hungary, KE = Kenya, KG = Kyrgyzstan, MX = Mexico,
NP = Nepal, PK = Pakistan, RU = Russia, TJ = Tajikistan, TM = Turkmenistan, TR = Turkey,
PST = United States and UZ = Uzbekistan. Two digits after country abbreviation represents
the isolate collected year, for example 07 = 2007, from respective countries.

217

218
Supplemental Fig. 2A. Dendrogram of molecular groups (MG) 1-6 based on 17 SSR markers
data of Puccinia striiformis f. sp. tritici collections using unweighted pair group arithmetic
mean method. AU = Australia, CA = Canada, CL = Chile, CN = China, DZ = Algeria, ES =
Spain, HU = Hungary, KE = Kenya, KG = Kyrgyzstan, MX = Mexico, NP = Nepal, PK =
Pakistan, RU = Russia, TJ = Tajikistan, TM = Turkmenistan, TR = Turkey, PST = United
States and UZ = Uzbekistan. Two digits after country abbreviation represents the isolate
collected year, for example 07 = 2007, from respective countries.

219

220
Supplemental Fig. 2B. Dendrogram of molecular group (MG) 7-I based on 17 SSR markers
data of Puccinia striiformis f. sp. tritici collections using unweighted pair group arithmetic
mean method.

221

222
Supplemental Fig. 2C. Dendrogram of molecular groups (MG) 7-II, and 8-10 based on 17
SSR markers data of Puccinia striiformis f. sp. tritici collections using unweighted pair group
arithmetic mean method.

223
Supplemental Fig. 2D. Dendrogram of molecular groups (MG) 11-15 based on 17 SSR
markers data of Puccinia striiformis f. sp. tritici collections using unweighted pair group
arithmetic mean method.