a machine learning model for the prediction of survival
TRANSCRIPT

ORIGINAL ARTICLE Open Access
A machine learning model for theprediction of survival and tumor subtype inpancreatic ductal adenocarcinoma frompreoperative diffusion-weighted imagingGeorgios Kaissis1, Sebastian Ziegelmayer1, Fabian Lohöfer1, Hana Algül2, Matthias Eiber3, Wilko Weichert4,Roland Schmid2, Helmut Friess5, Ernst Rummeny1, Donna Ankerst6, Jens Siveke7 and Rickmer Braren1*
Abstract
Background: To develop a supervised machine learning (ML) algorithm predicting above- versus below-medianoverall survival (OS) from diffusion-weighted imaging-derived radiomic features in patients with pancreatic ductaladenocarcinoma (PDAC).
Methods: One hundred two patients with histopathologically proven PDAC were retrospectively assessed as trainingcohort, and 30 prospectively accrued and retrospectively enrolled patients served as independent validation cohort (IVC).Tumors were segmented on preoperative apparent diffusion coefficient (ADC) maps, and radiomic features were extracted.A random forest ML algorithm was fit to the training cohort and tested in the IVC. Histopathological subtypeof tumor samples was assessed by immunohistochemistry in 21 IVC patients. Individual radiomic featureimportance was evaluated by assessment of tree node Gini impurity decrease and recursive feature elimination. Fisher’sexact test, 95% confidence intervals (CI), and receiver operating characteristic area under the curve (ROC-AUC) were used.
Results: The ML algorithm achieved 87% sensitivity (95% IC 67.3–92.7), 80% specificity (95% CI 74.0–86.7), and ROC-AUC90% for the prediction of above- versus below-median OS in the IVC. Heterogeneity-related features were highly rankedby the model. Of the 21 patients with determined histopathological subtype, 8/9 patients predicted to experience below-median OS exhibited the quasi-mesenchymal subtype, whilst 11/12 patients predicted to experience above-median OSexhibited a non-quasi-mesenchymal subtype (p < 0.001).
Conclusion: ML application to ADC radiomics allowed OS prediction with a high diagnostic accuracy in an IVC. The highoverlap of clinically relevant histopathological subtypes with model predictions underlines the potential of quantitativeimaging in PDAC pre-operative subtyping and prognosis.
Keywords: Machine learning, Diffusion magnetic resonance imaging, Pancreatic carcinoma, Radiomics, Survival analysis
Key points
� Pancreatic cancer is a morphologically andgenetically heterogeneous tumor entity.
� Histopathological subtypes of pancreatic cancerdisplay different therapy response and survival.
� Whole-tumor radiomic analyses can capture andassess heterogeneity and its impact.
� This study applies machine learning to radiomicfeatures derived from diffusion-weighted magneticresonance imaging.
� The algorithm developed allowed the prediction ofoverall survival and tumor subtype with highdiagnostic accuracy in an independent validationcohort.
© The Author(s). 2019 Open Access This article is distributed under the terms of the Creative Commons Attribution 4.0International License (http://creativecommons.org/licenses/by/4.0/), which permits unrestricted use, distribution, andreproduction in any medium, provided you give appropriate credit to the original author(s) and the source, provide a link tothe Creative Commons license, and indicate if changes were made.
* Correspondence: [email protected] of Diagnostic and Interventional Radiology, Faculty ofMedicine, Klinikum rechts der Isar, Technical University of Munich, IsmaningerStr. 22, DE-81675 Munich, GermanyFull list of author information is available at the end of the article
European RadiologyExperimental
Kaissis et al. European Radiology Experimental (2019) 3:41 https://doi.org/10.1186/s41747-019-0119-0

BackgroundPancreatic ductal adenocarcinoma (PDAC) carries amongstthe poorest prognoses of all cancers. Tumors exhibit het-erogeneity on a genetic, transcriptomic, and proteomiclevel, which manifests itself in a complex tissue architectureincluding tumor cells, various fibroblast, and immune cellpopulations embedded in a poorly vascularized, densestroma [1]. Despite its overall dismal prognosis, recentresearch has identified specific molecular subtypes withdistinct therapy response and outcome. Amongst these, theso-called classical phenotype shows improved chemother-apy response and survival compared to the so-called quasi-mesenchymal or basal-like subtype underlining the urgentrequirement for advanced techniques for precise pre-treatment patient stratification [2, 3]. This is crucial for ad-equate patient management, based on informed decisionprocesses, clinical trial design, and outcome interpretation.In heterogeneous tumors such as PDAC, biopsies carry
a risk of tissue undersampling. In contrast, imaging in-habits a unique niche in precision medicine in that it canprovide volumetric information non-invasively. Radiomics,the process of derivation of quantitative analytics frommedical imaging data [4], represents a substantial advanceover traditional image analysis workflows. In fact, it lever-ages data science and machine learning (ML) techniquesto exploit non-intuitive image content and integrate itwith clinical information to create a generalizable modelcapable of predicting biological features or the course ofdisease [5].Since PDAC is a relatively rare tumor entity, typically
only treated in specialized interdisciplinary centers, thereis still a paucity of radiomic studies aiming to assess per-tinent metrics such as patient survival or histopathologicalsubtypes. Our aim was to apply a standardized, reprodu-cible radiomic workflow to diffusion-weighted imaging(DWI)-derived apparent diffusion coefficient (ADC) maps,pipelined to a ML model capable of predicting overallsurvival and histopathological subtypes, trained and inde-pendently validated on two cohorts of PDAC patients.
MethodsStudy designData collection, processing, and analysis were approvedby the institutional ethics committee Ethikkommissionder Medizinischen Fakultät der Technischen UniversitätMünchen, protocol number 180/17S and 5573/12. Thestudy was designed as a retrospective cohort study with aprospectively accrued, retrospectively enrolled independ-ent validation cohort. The study endpoint was defined asoverall survival. The requirement for written consent waswaived for the retrospective cohort whilst written consentwas obtained for the independent validation cohort forimage acquisition and analysis of the imaging data. Thetwo cohorts were accrued by the department of radiology
(training cohort) and the clinic for nuclear medicine (inde-pendent validation cohort) at the same university hospital.All procedures were carried out in accordance with per-tinent laws and regulations.We considered patients with final histopathological
diagnosis of PDAC of the head and body for inclusion inthe study. Patients who did not have a final diagnosis ofPDAC, had undergone treatment such as chemotherapyor resection prior to enrolment, refused treatment orstudy inclusion, died within the first 2 months of follow-up (to limit bias from postoperative complications), didnot undergo the full imaging protocol, or did not havetechnically sufficient imaging available due to motionartefacts precluding imaging analysis were excluded. Forinclusion in the training cohort, we retrospectively con-sidered 206 consecutive patients, who presented at ourinstitution between 2008 and 2013 and underwentimaging at the department of radiology with a suspectedfinding of PDAC. The median time between imagingand final histopathological diagnosis was 8 days (range5–11). The follow-up interval was defined as 5 yearspost-imaging. Follow-up was handled by the depart-ments of surgery and internal medicine. After exclu-sions, a total of 102 patients were included in the studyas the training cohort.Prospective patients were accrued from 2013 onwards
as part of an effort to evaluate imaging performance andprognostic value of 3-T magnetic resonance imaging(MRI). Participants underwent 3-T MRI evaluation forsuspected finding of PDAC. Of 62 consecutive patientswho were considered for inclusion, 30 patients fulfilledthe enrolment criteria and designated as the independ-ent validation cohort. The median time between imagingand final histopathological diagnosis was 7 days (range5–12).Clinical data was sourced from the clinical information
system. Radiomics data was generated during data ana-lysis. For exclusion of bias, data analysis was performed inpesudonomyzed form and handled by separate individuals(G.K. and S.Z.). Data analysis was performed starting inJune 2018. Patient flowcharts and the complete STROBE(Strengthening the reporting of observational studies in epi-demiology) [6] checklist can be found in Additional file 1.
Clinical variablesThe following clinical data was collected for patients inthe training and independent validation cohorts: age atdiagnosis, sex, p/cTNM, resection status, grading, tumorvolume in millilitres (as supplied in the final histopatho-logical report), ECOG (Eastern Cooperative OncologyGroup) performance status [7], and chemotherapy regi-men. Where applicable and available, pre-operativeCA19-9 levels and lymph-node ratios, i.e., the ratio ofthe number of metastatic lymph nodes to the number of
Kaissis et al. European Radiology Experimental (2019) 3:41 Page 2 of 9

dissected lymph nodes, were noted. Overall survival wasdefined as the time from diagnosis to death.
Imaging data acquisitionThe 102 training cohort patients underwent MRI at 1.5T(Magnetom Avanto, release VB17, Siemens Healthineers,Erlangen, Germany). The protocol included the followingsequences: axial and coronal T2-weighted (slice thickness,5mm); axial T1-weighted (slice thickness, 3mm) beforecontrast injection (2 mL/kg body mass Gd-DTPA (Magne-vist, Bayer HealthCare, Whippany, USA)) and during thearterial, pancreatic parenchymal, portal-venous, systemicvenous, and delayed phases (as determined by testing bolusinjection); axial unidirectional DWI at b values of 0, 50,300, and 600 s/mm2 with echo-planar imaging readout andADC map calculation. ADC map reconstructions had aspatial resolution of 5.5 × 5.5 × 5mm (x, y, z) to a 192 ×192 matrix. Furthermore, single-shot T2-weighted mag-netic resonance cholangiopancreatography was performedand reconstructed as a radial maximum intensity projectionseries. The independent validation cohort included 30 pa-tients who underwent MRI on a 3-T clinical positron emis-sion tomography MRI scanner (Biograph mMR, releaseVB18, Siemens Healthineers, Erlangen, Germany) at thenuclear medicine department. The protocol was performedas above with the following alterations: ADC-map recon-structions were 5.1 × 5.1 × 5.1mm (x, y, z) to a 192 × 192matrix; furthermore, an axial spectral adiabatic inversionrecovery fat-suppressed post-contrast sequence at 5mmand a whole-body positron emission tomography scan afterapplication of 18F-fluorodeoxyglucose were included. Theimaging protocols used and the technical hardware specifi-cations of the MRI machines remained unaltered duringthe data acquisition period. Sequence parameters can befound in Table 1.
Data segmentationPseudonomyzed datasets were exported from the hospitalpicture archiving system onto a radiological workstation andsegmentation was performed under standardized lightingconditions by consensus reading of two experienced ob-servers (G.K. and S.Z.) and quality-controlled by an abdom-inal radiologist with more than 10 years of experience inpancreatic MRI (RB segmentation was performed manuallyon the b = 600 s/mm2 images and transferred to the ADCmaps). An exemplary case is shown in Fig. 1. All sequenceswere available to observers for anatomical correlation.
Inferential statistical modellingFor assessing potential clinical confounding parametersintroducing bias to the survival prediction, survival timewas modelled in both cohorts using a multivariate Coxproportional hazards model. 95% confidence intervalswere calculated by bootstrap resampling. The distributions
of clinical variables were compared between groups usingFisher’s exact test. For subsequent ML modelling, the twocohorts were dichotomized by median overall survival toyield two sub-cohorts of equal size. Receiver operatorcharacteristic (ROC) thresholds were evaluated with theKolmogorov-Smirnov statistics. Biostatistical modellingwas performed in SPSS version 25 (IBM, Armonk, USA).For all inferential statistical procedures, a p value lowerthan 0.05 was considered significant.
Image postprocessing, radiomic feature extraction, andML modellingAll steps of image postprocessing, feature extraction, fea-ture preprocessing, feature engineering, and ML modellingare detailed in the Additional file 1. In brief, radiomic fea-tures were derived after intensity discretization to 32 binsusing PyRadiomics version 2.1 [8] yielding a total of 1.688features 19 first-order statistics, 16 three-dimensionalshape-based, 10 two-dimensional shape-based, 24 gray-level co-occurrence matrix, 16 gray-level run-lengthmatrix, 16 gray-level size zone matrix, 5 neighbouring graytone difference matrix, and 14 gray-level dependencematrix features as well as Laplacian of Gaussian-filtered,wavelet-decomposition-based (using the coiflet 1 function),square, exponential, gradient, square-root, logarithm, andlocal binary-pattern filtered versions of these features.Feature preprocessing was applied to eliminate non-reproducible and unstable features, leading to the exclusionof 1184 features as detailed in Additional file 1, section 2(Feature preprocessing) and previously described in [8]. Inbrief, features with segmentation-resegmentation instabil-ity, features unstable in reference tissues between the twoMRI systems, and features yielding constant, nil, or missingvalues were removed. In total, 504 features were retained.Feature values were normalized to the (0,1) interval. A ran-dom forest [9] classifier was fit in a supervised fashion withsurvival above versus below median serving as label to thetraining cohort radiomic features. Hyperparameter tuningand algorithm development were performed by tenfoldnested cross-validation on the training set with an internalloop used for automated hyperparameter optimization byrandomized grid searching and the independent loop usedfor algorithm validation. Feature importance was assessedby the inbuilt feature importance metrics of the algorithmbased on the decrease of node Gini impurity (a metric ofmisclassification rate and thus of the quality of the split ateach decision tree node, compare Section 9.2.3, Classifica-tion Trees as explained by Hastie et al [10] and by recursivefeature elimination. The algorithm was then tested for pre-dictive sensitivity, specificity, and ROC area under thecurve (ROC-AUC) in an independent validation cohort byusing Fisher’s exact test on the contingency table of thecorrectly and incorrectly classified cases. To assess theprognostic significance of large-area low gray-level
Kaissis et al. European Radiology Experimental (2019) 3:41 Page 3 of 9

Table 1 Acquisition parameters for the training and independent validation cohorts
Training cohort Independent validation cohort
System Siemens Magnetom Avanto Siemens Biograph mMR
Software version VB17 VB18
Anatomic sequences Axial and coronal T2-weightedHASTE, 5-mm thickness
Axial and coronal T2-weightedHASTE, 5-mm thickness
Axial T1-weighted VIBE, 3-mmthickness
Axial T1-weighted VIBE, 3-mmthickness
Dynamic study Axial T1-weighted SPAIR Axial T1-weighted T1 SPAIR
DWI acquisition Axial low-resolution EPI, b = 0,50, 300, 600 s/mm2
Axial low-resolution EPI, b = 0,50, 300, 600 s/mm2
ADC fit Linear, b = 50, 300, 600 Linear b = 50, 300, 600
Acquisition voxel size (x, y, z) 5.5 × 5.5 × 5.5 mm 5.1 × 5.1 × 5.1 mm
ADC reconstruction matrix 192 × 192 192 × 192
ADC field of view 360 × 360 360 × 360
ADC Apparent diffusion coefficient, DWI Diffusion-weighted imaging, HASTE Half-Fourier acquisition single-shot turbo spin-echo, SPAIR Spectral attenuatedinversion recovery, VIBE Volume interpolated breath-hold examination
Fig. 1 Exemplary case showing a ductal adenocarcinoma of the pancreatic head on T2-weighted images (a), b = 600 s/mm2 (b), the segmentationimage including a three-dimensional rendering (inset) and a region-of interest (T) of the tumor (c), and the apparent diffusion coefficient map (d)
Kaissis et al. European Radiology Experimental (2019) 3:41 Page 4 of 9

emphasis, the algorithm was refit to the training datausing only this feature and tested on the independentvalidation cohort. All analyses were carried out usingthe Python programming language.
Histopathological workup of tumor samplesHistopathological staining and immunohistochemicalworkup were performed as described by Muckenhuberet al. [11]. In brief, staining for the markers HNF1a andKRT81 was carried out and tumors categorized into threesubtypes: classical, exocrine, and quasi-mesenchymal.Tumors not positive for either marker were designated asunclassifiable. Classical, exocrine, and unclassifiable tumorsare onwards referred to as “non-quasi-mesenchymal”.
ResultsThe distribution of clinical parameters did not differsignificantly between the training and the independentvalidation cohorts. Amongst the clinical parameters, thechoice of chemotherapy regimen (gemcitabine versusFolfirinox) was significantly associated with overall sur-vival in the training cohort but not in the testing cohort,and the percentage of patients receiving each regimenwas identical (with ~ 70% of patients receiving gemcita-bine in each cohort (p = 1.000, Fisher’s exact test). Meta-static status at baseline was significantly associated withdiminished survival in both cohorts and was also identi-cally distributed (~ 25% of patients, p = 0.812, Fisher’sexact test) in both cohorts.
Using cross-validation for algorithm assessment on thetraining set, the model achieved a sensitivity of 88 ± 13%(mean ± standard deviation), a specificity of 88 ± 10%,and a ROC-AUC of 93 ± 7% (p < 0.001, Fisher’s exacttest) over the ten cross-validation folds. On the unseendata of the independent validation set, the random forestalgorithm achieved a sensitivity of 86.7%, a specificity of80.0%, a positive predictive value of 81.2%, and a nega-tive predictive value of 85.7%. The area under the ROCcurve calculated on the independent validation cohortdata was 0.90 (Fig. 2). Results of model evaluation (gaincurves and training curves), feature importance metrics,and results from recursive feature elimination as well asKaplan-Meier modelling of large-area low gray-level em-phasis as a singular predictive feature and the results ofmultivariate Cox analysis and cross-tabulations can befound in Additional file 1.Furthermore, the algorithm predictions enabled sig-
nificant stratification of above- versus below-medianoverall survival in the independent validation cohort (p≤ 0.001, log-rank test, predicted median survival for thebelow-median 17.0 months versus 31.3 months for theabove-median group) with the resulting predicted sur-vival curves showing near-perfect overlap with the actualsurvival times of the patients (Fig. 3).The histopathologic subtype of the tumor samples could
be determined for 21 of the 30 patients in the independentvalidation cohort. The quasi-mesenchymal histopathologicalsubtype was greatly overrepresented in the patient collective
Fig. 2 Receiver operator characteristic curve of model performance of the ML algorithm for the independent validation cohort. The classificationthreshold was 0.5, resulting in an area under the curve of 0.9 (cross) (n = 30 patients)
Kaissis et al. European Radiology Experimental (2019) 3:41 Page 5 of 9

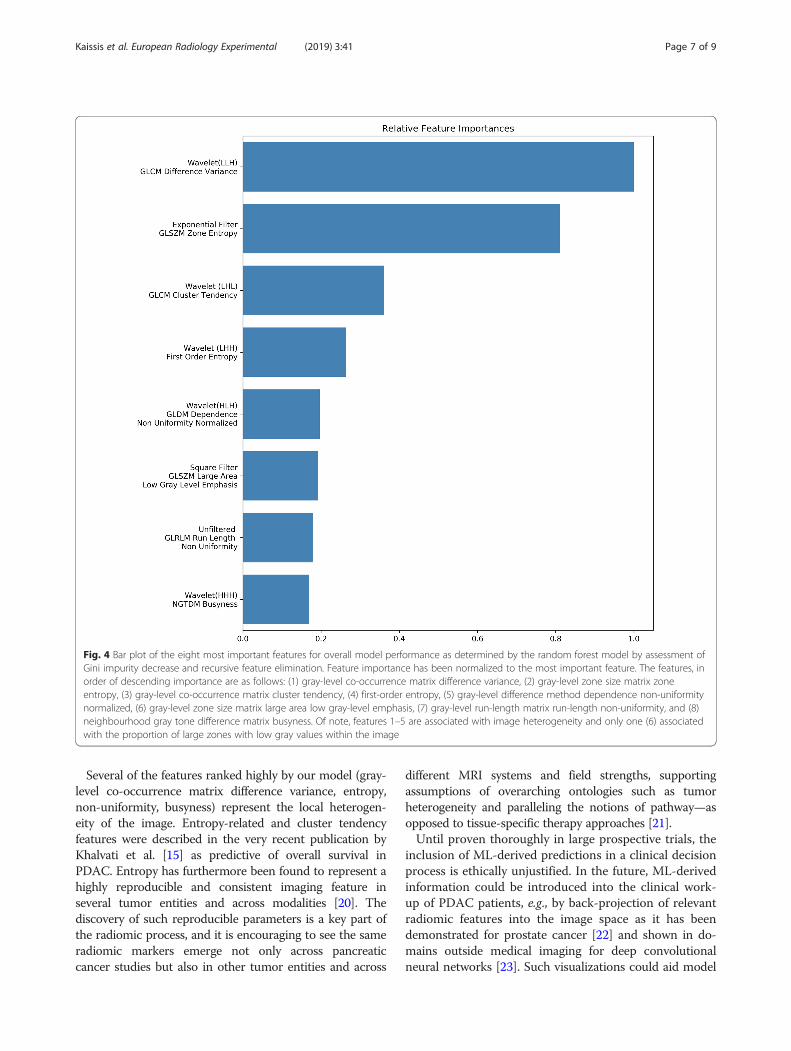
predicted by the algorithm to experience below-mediansurvival with 8 out of 9 patients having quasi-mesenchymalsubtype tumors. The inverse also held true, with 11 out of12 patients predicted by the algorithm to experience above-median survival having non-quasi-mesenchymal subtypetumors (p < 0.001, Fisher’s exact test, Table 2).Feature importance evaluation based on node Gini im-
purity decrease and recursive feature elimination yieldedeight highly important features, seven of them associatedwith image heterogeneity and only one associated withthe proportion of large zones with low gray valueswithin the image [12, 13] (Fig. 4).
DiscussionIn this work, we present an independently validated MLalgorithm, which enables the prediction of overall survivaland shows strong association with histopathologicallydefined molecular subtypes recently identified in PDACfrom preoperative DWI. Several of the most importantimaging features belong to a class of heterogeneity-relatedfeatures, offering explainable insights into the algorithm.The potential of radiomics in non-invasive prediction of
clinically relevant parameters, such as response to a spe-cific therapy or expected overall survival, has been shownin recent literature: For example, computed tomography-derived radiomic signatures were shown to enable
prediction of local disease control and overall survival inPDAC [14, 15] or tumor grading in pancreatic neuroendo-crine tumors [16]. The large-scale implementation of suchtools thus has the potential to become a game changer inmedical image interpretation and individualized patientcare.Post-mortem analyses of terminal stage PDAC speci-
mens have shown higher tumor cellularity compared toresectable PDAC specimens, which likely represent earliertumor development stages [17]. In line with this observa-tion, we previously demonstrated that higher regionaltumor cellularity identified in PDAC resection specimenswas associated with a significantly worse overall survivaland that the pre-operative DWI-derived ADC parametercould serve as a non-invasive marker thereof [18, 19]. Up-holding these findings, the current analysis identified theradiomic feature large-area low gray-level emphasis, repre-sentative of cohesive zones exhibiting low ADC values, asone of the eight most important features for survival clas-sification. Using only this single feature to train the modeland predict the survival in the independent validationcohort did, however, not yield statistical significance, withsurvival curves crossing at early and late time points andonly visual separation present at the time interval between15 and 30months (see Kaplan-Meier plot and associatedmetrics in Additional file 1).
Fig. 3 Kaplan-Meier curves showing the predicted survival (blue and green curves) and the true survival (dotted curves) for patients in theindependent validation cohort. Log-rank test between predicted survival curves: p < 0.001 (n = 30 patients)
Table 2 Overlap between predicted survival groups and histopathological subtypes. The quasi-mesenchymal subtype was highlyoverrepresented in the group with predicted below-median survival, the non-quasi-mesenchymal subtypes in the group withpredicted above-median survival (n = 30 patients, p < 0.001, Fisher’s exact test)
Quasi-mesenchymal subtype Non-quasi-mesenchymal subtype
Predicted survival > median 1/12 (9%) 11/12 (91%)
Predicted survival ≤ median 8/9 (89%) 1/9 (11%)
Kaissis et al. European Radiology Experimental (2019) 3:41 Page 6 of 9
Several of the features ranked highly by our model (gray-level co-occurrence matrix difference variance, entropy,non-uniformity, busyness) represent the local heterogen-eity of the image. Entropy-related and cluster tendencyfeatures were described in the very recent publication byKhalvati et al. [15] as predictive of overall survival inPDAC. Entropy has furthermore been found to represent ahighly reproducible and consistent imaging feature inseveral tumor entities and across modalities [20]. Thediscovery of such reproducible parameters is a key part ofthe radiomic process, and it is encouraging to see the sameradiomic markers emerge not only across pancreaticcancer studies but also in other tumor entities and across
different MRI systems and field strengths, supportingassumptions of overarching ontologies such as tumorheterogeneity and paralleling the notions of pathway—asopposed to tissue-specific therapy approaches [21].Until proven thoroughly in large prospective trials, the
inclusion of ML-derived predictions in a clinical decisionprocess is ethically unjustified. In the future, ML-derivedinformation could be introduced into the clinical work-up of PDAC patients, e.g., by back-projection of relevantradiomic features into the image space as it has beendemonstrated for prostate cancer [22] and shown in do-mains outside medical imaging for deep convolutionalneural networks [23]. Such visualizations could aid model
Fig. 4 Bar plot of the eight most important features for overall model performance as determined by the random forest model by assessment ofGini impurity decrease and recursive feature elimination. Feature importance has been normalized to the most important feature. The features, inorder of descending importance are as follows: (1) gray-level co-occurrence matrix difference variance, (2) gray-level zone size matrix zoneentropy, (3) gray-level co-occurrence matrix cluster tendency, (4) first-order entropy, (5) gray-level difference method dependence non-uniformitynormalized, (6) gray-level zone size matrix large area low gray-level emphasis, (7) gray-level run-length matrix run-length non-uniformity, and (8)neighbourhood gray tone difference matrix busyness. Of note, features 1–5 are associated with image heterogeneity and only one (6) associatedwith the proportion of large zones with low gray values within the image
Kaissis et al. European Radiology Experimental (2019) 3:41 Page 7 of 9

explainability or offer guidance for invasive tumorsampling in PDAC. The introduction of ML as a clinicaldecision support tool would also profit from the ability ofML algorithms to predict molecular signatures such asKRAS amplification status [24] that may then help stratifypatients in clinical routine. Such radiogenomic approachescould complement histomorphology-derived tumor sub-type prediction demonstrated here and advance the roleof radiomics in precision medicine.We selected the random forest model over the fre-
quently used linear models such as logistic regressionfor its capability of modelling both linear and non-linear relationships between features and outcomes,robustness to overfitting by design, and inbuilt in-sights into feature importance aiding model parsi-mony and explainability. Random forests have alsobeen shown to yield excellent results in previouslypublished radiomic studies [25].As part of any radiomic study, feature preprocessing
and stability checking is required to obtain reproducibleresults, resulting in the majority of derived features beingdiscarded before modelling begins [26]. These discardedfeatures are therefore rendered useless for the modellingprocess. To obtain more usable features, standardizedacquisition and feature extraction is necessary. Recentinitiatives aim to homogenise acquisition protocols be-tween sites to enable further sequences to be included inanalyses [27]. We adhered to (and strongly support) thestandards set by the Image biomarker standardization ini-tiative and implemented by PyRadiomics [8, 13], whichprovide a robust post-processing platform entirely basedon open-source tools, thus laying the foundation for openand reproducible radiomic science.Our work is a proof of concept contribution to the fast-
developing field of ML in medical imaging. Notable limita-tions include training cohort size, due to which the modelcould not reach its full potential performance (see thetraining curve in Additional file 1) and the consensus seg-mentation approach, which we partially mitigated byexcluding features unstable to repeated segmentation in asubcohort of patients. However, Dice-Sørensen overlapscores were not calculated, so no direct data about inter-reader variability is available for the entire cohort, whichmay limit generalizability. The age of the imaging materialin the retrospective training cohort also impacted resultswith several patients being excluded due to technical imagequality. The quality of MRI acquisitions has since consider-ably improved, and our results could benefit from the appli-cation of state-of-the art abdominal imaging including highresolution protocols, such as reduced field-of-view DWI[28–30]. We eliminated all features that were classified un-stable between the two MRI systems, and recent researchhas provided evidence that the quantitative nature of ADCmaps results in large numbers of stable features in different
tumor entities and across different field strengths and MRIsystems [31]. In agreement with these findings, ouralgorithm maintained high classification performance onindependent validation data from a different MRI system,with sensitivity and specificity figures on average 1 to 8%lower than cross-validated performance and with a ROC-AUC reduced by about 3%, indicating that thorough pre-processing, feature engineering and applications usingquantitative imaging data can facilitate the deployment ofradiomic analyses across systems and institutions.Further studies on larger cohorts are required to conclu-
sively resolve the impact of switching MRI systems on al-gorithm generalizability and performance. Lastly, althoughrigorously quality-controlled, our approach still relies onmanual tumor segmentation, since recent fully automatedsegmentation algorithms fail to match human observers inpancreatic tumors [32]. We believe that future work willresult in optimized algorithms that enable a higher level ofautomation—and thus standardization—of this task.In conclusion, we showed the promise of ML-based
radiomic analyses in PDAC. We encourage the validationof the identified radiomic parameters in larger, prospect-ively accrued cohorts to lay the foundation for therapeuticinterventions based on quantitative imaging biomarkers.
Additional file
Additional file 1: Supplementary material. (DOCX 403 kb)
AbbreviationsADC: Apparent diffusion coefficient; AUC: Area under the curve;DWI: Diffusion-weighted imaging; ML: Machine learning; MRI: Magneticresonance imaging; OS: Overall survival; PDAC: Pancreatic ductaladenocarcinoma; ROC: Receiver operator characteristic
AcknowledgementsThe authors wish to thank Irina Heid, Alexander Muckenhuber, Katja Steiger,Hsi-Yu Yen, and Marcus Schwaiger for their contributions to the conceptionand implementation of the techniques as well as their ongoing support.
Authors’ contributionsGK and RB contributed to the conceptualization. GK, SZ, FL, and MEcontributed to the data curation. GK and SZ contributed to the formalanalysis. RB and WW contributed to the funding acquisition. GK, SZ, JS, andWW contributed to the investigation. GK, DA, and WW contributed to themethodology. RB, HA, WW, HF, and EJR contributed to the projectadministration. RS, WW, HF, DA, and EJR contributed to the resources. GKcontributed to the software. RB, DA, JS, and WW contributed to thesupervision. RB and DA contributed to the validation. GK and RB contributedto the visualization. GK and RB wrote the original draft, GK, RB, DA, WW, JS,HA, and ME contributed to the writing of the review and editing. All authorsread and approved the final manuscript.
FundingThis work was supported by funding of the German Research Foundation(DFG) within the SFB-Initiative 824 (collaborative research center), “Imagingfor Selection, Monitoring and Individualization of Cancer Therapies” to RB(SFB824, project C6) and WW (project Z2).
Availability of data and materialsThe data generated during the study is available from the correspondingauthor on reasonable request by a qualified individual or third party.
Kaissis et al. European Radiology Experimental (2019) 3:41 Page 8 of 9

Ethics approval and consent to participateData collection, processing, and analysis were approved by the institutionalethics committee (Ethics Commission of the Faculty of Medicine of theTechnical University of Munich, protocol numbers 180/17 and 5573/12). Thestudy was designed as a retrospective cohort study with a prospectivevalidation cohort. The requirement for written consent was waived for theretrospective cohort and written consent was obtained for the prospectivecohort. All procedures were carried out in accordance to pertinent laws andregulations.
Consent for publicationInformed consent was obtained from the patients in the prospective cohort.
Competing interestsThe authors declare that they have no competing interests.
Author details1Department of Diagnostic and Interventional Radiology, Faculty ofMedicine, Klinikum rechts der Isar, Technical University of Munich, IsmaningerStr. 22, DE-81675 Munich, Germany. 2Department of Internal Medicine II,Faculty of Medicine, Technical University of Munich, Munich, Germany.3Department of Nuclear Medicine, Faculty of Medicine, Technical Universityof Munich, Munich, Germany. 4Department of Pathology, Faculty ofMedicine, Technical University of Munich, Munich, Germany. 5Department ofSurgery, Faculty of Medicine, Technical University of Munich, Munich,Germany. 6Department of Mathematics, Technical University of Munich,Garching, Germany. 7West German Cancer Center, University of Essen, Essen,Germany.
Received: 16 May 2019 Accepted: 21 August 2019
References1. Torphy RJ, Wang Z, True-Yasaki A et al (2018) Stromal content is correlated
with tissue site, contrast retention, and survival in pancreatic adenocarcinoma.JCO Precis Oncol:1–12. https://doi.org/10.1200/PO.17.00121
2. Collisson EA, Sadanandam A, Olson P et al (2011) Subtypes of pancreaticductal adenocarcinoma and their differing responses to therapy. Nat Med17:500–503. https://doi.org/10.1038/nm.2344
3. Aung KL, Fischer SE, Denroche RE et al (2018) Genomics-driven precisionmedicine for advanced pancreatic cancer: early results from the COMPASSTrial. Clin Cancer Res 24:1344–1354. https://doi.org/10.1158/1078-0432.CCR-17-2994
4. Gillies RJ, Kinahan PE, Hricak H (2016) Radiomics: images are more thanpictures, they are data. Radiology 278:563–577. https://doi.org/10.1148/radiol.2015151169
5. Aerts HJ, Velazquez ER, Leijenaar RT et al (2014) Decoding tumor phenotypeby noninvasive imaging using a quantitative radiomics approach. NatCommun 5:4006. https://doi.org/10.1038/ncomms5006
6. STROBE Checklist. https://www.strobe-statement.org/index.php?id=available-checklists
7. ECOG-ACRIN cancer research group. https://ecog-acrin.org/resources/ecog-performance-status.
8. van Griethuysen JJM, Fedorov A, Parmar C et al (2017) Computationalradiomics system to decode the radiographic phenotype. Cancer Res 77:e104–e107. https://doi.org/10.1158/0008-5472.CAN-17-0339
9. Breiman L (2001) Random forests. Mach Learn 45:5–32. https://doi.org/10.1023/A:1010933404324
10. Hastie T, Tibshirani R, Friedman J (2009) The elements of statistical learning.Springer New York, New York, NY
11. Muckenhuber A, Berger AK, Schlitter AM et al (2018) Pancreatic ductaladenocarcinoma subtyping using the biomarkers hepatocyte nuclear factor-1A and cytokeratin-81 correlates with outcome and treatment response.Clin Cancer Res 24:351–359. https://doi.org/10.1158/1078-0432.CCR-17-2180
12. van Griethuysen JJM, Fedorov A, Parmar C et al (2017) Computationalradiomics system to decode the radiographic phenotype. Cancer Res 77:e104–e107. https://doi.org/10.1158/0008-5472.CAN-17-0339
13. Zwanenburg A, Leger S, Vallières M, Löck S (2016) Image biomarker standardisationinitiative. CoRR abs/1612.0: https://doi.org/10.17195/candat.2016.08.1
14. Cozzi L, Comito T, Fogliata A et al (2019) Computed tomography basedradiomic signature as predictive of survival and local control after
stereotactic body radiation therapy in pancreatic carcinoma. PLoS One 14:e0210758. https://doi.org/10.1371/journal.pone.0210758
15. Eilaghi A, Baig S, Zhang Y et al (2017) CT texture features are associated withoverall survival in pancreatic ductal adenocarcinoma - a quantitative analysis.BMC Med Imaging 17:1–7. https://doi.org/10.1186/s12880-017-0209-5
16. Liang W, Yang P, Huang R et al (2019) A combined nomogram model topreoperatively predict histologic grade in pancreatic neuroendocrine tumors.Clin Cancer Res 25:584–594. https://doi.org/10.1158/1078-0432.CCR-18-1305
17. Winter JM, Ting AH, Vilardell F et al (2008) Absence of E-cadherin expressiondistinguishes noncohesive from cohesive pancreatic cancer. Clin Cancer Res14:412–418. https://doi.org/10.1158/1078-0432.CCR-07-0487
18. Trajkovic-Arsic M, Heid I, Steiger K et al (2017) Apparent diffusion coefficient(ADC) predicts therapy response in pancreatic ductal adenocarcinoma. SciRep 7:17038. https://doi.org/10.1038/s41598-017-16826-z
19. Heid I, Steiger K, Trajkovic-Arsic M et al (2017) Co-clinical assessment oftumor cellularity in pancreatic cancer. Clin Cancer Res 23:1461–1470. https://doi.org/10.1158/1078-0432.CCR-15-2432
20. Traverso A, Wee L, Dekker A, Gillies R (2018) Repeatability andreproducibility of radiomic features: a systematic review. Int J Radiat OncolBiol Phys 15;102:1143–1158. https://doi.org/10.1016/j.ijrobp.2018.05.053
21. Schneider G, Schmidt-Supprian M, Rad R, Saur D (2017) Tissue-specifictumorigenesis: context matters. Nat Rev Cancer 17:239–253. https://doi.org/10.1038/nrc.2017.5
22. Chatterjee A, Bourne RM, Wang S et al (2018) Diagnosis of prostate cancerwith noninvasive estimation of prostate tissue composition by using hybridmultidimensional MR imaging: a feasibility study. Radiology 287:864–873.https://doi.org/10.1148/radiol.2018171130
23. Carter S, Armstrong Z, Schubert L et al (2019) Activation Atlas. Distill 4.https://doi.org/10.23915/distill.00015
24. Mueller S, Engleitner T, Maresch R et al (2018) Evolutionary routes and KRASdosage define pancreatic cancer phenotypes. Nature 554:62–68. https://doi.org/10.1038/nature25459
25. Parmar C, Grossmann P, Rietveld D, Rietbergen MM, Lambin P, Aerts HJ (2015)Radiomic machine-learning classifiers for prognostic biomarkers of head andneck cancer. Front Oncol 5. https://doi.org/10.3389/fonc.2015.00272
26. Kumar V, Gu Y, Basu S et al (2012) Radiomics: the process and the challenges.Magn Reson Imaging 30:1234–1248. https://doi.org/10.1016/j.mri.2012.06.010
27. Bach M, Röthke M, Henzler T, Kreft M, Amler BSH (2019) Standardized andquality assured prostate diffusion MRI. ECR 2019. https://doi.org/10.26044/ecr2019/C-2163
28. Ma C, Li YJ, Pan CS et al (2014) High resolution diffusion weightedmagnetic resonance imaging of the pancreas using reduced field of viewsingle-shot echo-planar imaging at 3 T. Magn Reson Imaging 32:125–131.https://doi.org/10.1016/j.mri.2013.10.005
29. Riffel P, Michaely HJ, Morelli JN et al (2014) Zoomed EPI-DWI of thepancreas using two-dimensional spatially-selective radiofrequency excitationpulses. PLoS One 9:e89468. https://doi.org/10.1371/journal.pone.0089468
30. Kim H, Lee JM, Yoon JH et al (2015) Reduced field-of-view diffusion-weighted magnetic resonance imaging of the pancreas: comparison withconventional single-shot echo-planar imaging. Korean J Radiol 16:1216.https://doi.org/10.3348/kjr.2015.16.6.1216
31. Peerlings J, Woodruff HC, Winfield JM et al (2019) Stability of radiomicsfeatures in apparent diffusion coefficient maps from a multi-centre test-retest trial. Sci Rep 9:4800. https://doi.org/10.1038/s41598-019-41344-5
32. Zhou Y, Xie L, Shen W, Fishman E, Yuille A (2016) Pancreas segmentation inabdominal CT scan: a coarse-to-fine approach. ArXiv abs/162.08230.
Publisher’s NoteSpringer Nature remains neutral with regard to jurisdictional claims inpublished maps and institutional affiliations.
Kaissis et al. European Radiology Experimental (2019) 3:41 Page 9 of 9