prataap snacks buystatic-news.moneycontrol.com/static-mcnews/2018/01/...prataap snacks, best known...
TRANSCRIPT

JM Financial Institutional Securities Limited
JM Financial Research is also available on: Bloomberg - JMFR <GO>,
Thomson Publisher & Reuters S&P Capital IQ and FactSet
Please see Appendix I at the end of this
Thomson Publisher & Reuters
S&P Capital IQ and FactSet Please see Appendix I at the end of this report for Important Disclosures and
Disclaimers and Research Analyst
Prataap Snacks, owner of the ‘Yellow Diamond’ brand, has established a sizeable presence in
the Indian Snacks industry over the past few years by capturing a reasonable share in the
Extruded Snacks space through its product innovations, intelligent marketing campaign and
focus on distribution which has helped quadruple its market share over a 6-year period. This
drove 27% revenue CAGR over FY13-17 but the company’s current scale is still way too
small at INR9bn p.a. when compared to the size of the opportunity; the organised snacks
market is a c.INR220bn (c.$3.5bn) one. We believe Prataap can easily sustain high-teens
revenue growth rate over next few years – its high exposure to faster-growing sub-segments
and market-share gain opportunities being some of the tailwinds in this regard. Efforts on
improving margin-profile of the Namkeens portfolio and efficiency gains from GST should
also help the company maintain its operating margin at 8.5-9.5% over the coming years.
Strong growth prospects, improving margin-profile and healthy balance sheet drive our liking
for the stock - our DCF-based target price works out to INR1,390/share. BUY.
A clear high-teens revenue growth opportunity: The attractiveness of Prataap’s business
model is premised on its strong revenue growth traction - its growth rate of 27% p.a.
over FY13-17 is 2x that of the industry’s (organised segment); our analysis suggests that
Prataap has still quite a few levers available that would help drive high-teen revenue
CAGR over the coming few years: 1) Increasing penetration in North and West regions
while enhancing footprints in Southern markets which presently contributes a mere 9-
10% to overall revenues – its ‘Rings’ product being the key growth and market share
driver in this regard. 2) Scaling-up its recent foray into newer segments like sweet-
snacking and the healthier salty-snacks space. 3) Entry into hitherto untapped modern-
trade channel using the newly-launched healthier snacks portfolio. 4) Further market
share gains in core categories through innovative marketing and distribution expansion.
We are building 18.6% revenue CAGR over FY17-22E (lower in FY18E due to a few
disruptions, 19-20% over FY18-22E); this would imply a 150bps market share gains in
Extruded Snacks – Prataap’s 600bps share-gain over 2010-16 makes this forecast look
quite an achievable one, in our view.
Double-digit operating margin an achievable target over the medium-term; Cash-
generation potential is healthy as well: Prataap’s EBITDA margin has been volatile in the
past largely on account of high input-costs inflation; margin has now recovered back to
near double-digit level in 1HFY18 aided by a more benign input-costs environment,
improvement in Namkeen segment’s margin-profile, grammage changes and efficiency
gains from GST implementation which has also equalised tax-incidence vis-a-vis regional
players who hitherto benefitted from lower tax rates in some of their respective states of
operations. These factors together with scale benefit would help the company sustain its
operating margin at the higher band in the coming years, we believe. In our view, as
Prataap’s manufacturing gets more distributed once it achieves scale across regions,
savings in distribution costs would also accrue and contribute to margin. We believe
higher margin plus strict control on working capital (down from 13% to 7% over FY12-
17) would help Prataap generate healthy FCF and grow ROIC to high-teens level over the
coming 3-4 years.
Vicky Punjabi [email protected] | Tel: (91 22) 66303065
Richard Liu [email protected] | Tel: (91 22) 66303064
Recommendation and Price Target
Current Reco. BUY
Previous Reco. NR
Current Price Target (12M) 1,390
Upside/(Downside) 19.0%
Previous Price Target NA
Change NA
Key Data – DIAMOND IN
Current Market Price INR1,168
Market cap (bn) INR27.4/US$0.4
Free Float 21%
Shares in issue (mn) 22.45
Diluted share (mn) 22.45
3-mon avg daily val (mn) INR47.0/US$0.7
52-week range 1,404/1,102
Sensex/Nifty 34,771/10,700
Rs/US$ 64.3
Price Performance % 1M 6M 12M
Absolute -13.4 -2.8 NA
Relative* -17.3 -9.3 NA
* To the BSE Sensex
Prataap Snacks | BUY
17 January 2018 India | Consumer | Initiating Coverage
A shining star in the snacking space
Financial Summary (INR mn) Y/E March FY16A FY17A FY18E FY19E FY20E
Net Sales 7,572 9,039 10,407 12,557 14,997
Sales growth (%) 35.5% 19.4% 15.1% 20.7% 19.4%
EBITDA 565 409 898 1,097 1,373
EBITDA (%) 7.5% 4.5% 8.6% 8.7% 9.2%
Adjusted net profit 317 85 440 602 748
EPS (INR) 21.1 5.6 18.8 25.7 31.9
EPS growth (%) 238.1% -73.6% 236.8% 36.8% 24.3%
ROIC (%) 15.5% 4.3% 13.1% 14.5% 16.9%
ROE (%) 15.7% 3.7% 11.7% 11.2% 12.7%
PE (x) 55.3 209.6 62.2 45.5 36.6
Price/Book Value (x) 8.1 7.5 5.3 4.9 4.4
EV/EBITDA (x) 31.9 45.3 28.6 23.2 18.4
Dividend Yield (%) 0.0% 0.0% 0.1% 0.4% 0.6%
Source: Company data, JM Financial. Note: Valuations as of 16/Jan/2018

Prataap Snacks 17 January 2018
JM Financial Institutional Securities Limited Page 2
Key Snapshot Charts
Indian snacks market presents US$8bn opportunity Exhibit 1.
Source: Company, JM Financial
Organised snacks segment expected to grow in mid-teens Exhibit 2.
Source: Company, JM Financial
Top 5 players constitute mere 65% of organised snacks Exhibit 3.market.
Source: Company, JM Financial
High-growth extruded snacks segment constitutes 63% of Exhibit 4.Prataap’s turnover.
Source: Company, JM Financial
Expecting revenue CAGR of 19% over FY17-20… Exhibit 5.
Source: Company, JM Financial
…which should help achieve healthy profits Exhibit 6.
Source: Company, JM Financial
Indian Snacks Market
(US$8bn)
Organized Snacks Market
(US$3bn)
Prataap Snacks
220
430
0
100
200
300
400
500
600
2016 2021E
Indian Snacks market - Rs bn
Org
anis
ed
Total Snacks market in India pegged at Rs550bn
Market share of Top 5 players,
67%
Others, 33%
Indian Organised Snacks Market share - 2016
Potato Chips24%
Namkeen13%
Others0%
Random Extrusions (Chulbule)
13%
Rings & Puff47%
Wheels and Scoops3%
Extruded Snacks63%
Gross Sales break-up
3,431
4,450
5,546
7,457
8,927
10,329
12,462
14,884
0
2,000
4,000
6,000
8,000
10,000
12,000
14,000
16,000
FY13 FY14 FY15 FY16 FY17 FY18E FY19E FY20E
Revenue - INR mn
137
40
92
317
85
440
602
748
0
100
200
300
400
500
600
700
800
FY13 FY14 FY15 FY16 FY17 FY18E FY19E FY20E
Adjusted net profit - INR mn

Prataap Snacks 17 January 2018
JM Financial Institutional Securities Limited Page 3
EBITDA margin to be maintained at 8-10% range Exhibit 7.
Source: Company, JM Financial
GPM gains to be the key driver for operating margin Exhibit 8.
Source: Company, JM Financial
Achieved consistent reduction in net working capital Exhibit 9.
Source: Company, JM Financial
Expect ROIC to touch 17% by FY20 Exhibit 10.
Source: Company, JM Financial
275
202
339
565
409
898
1,097
1,373
8.0%
4.5%
6.1%
7.6%
4.6%
8.7% 8.8% 9.2%
0.0%
2.0%
4.0%
6.0%
8.0%
10.0%
0
280
560
840
1,120
1,400
FY13 FY14 FY15 FY16 FY17 FY18E FY19E FY20E
EBITDA - INR mn EBITDA margin - %
4.6%
9.2%
+432bps+43bps -10bps
2%
4%
6%
8%
10%
EBITDA Margin FY17 Gross Margin Other expenses A&P EBITDA Margin FY20
10.5%
11.4%
9.8% 9.7%
7.1%
4%
6%
8%
10%
12%
FY13 FY14 FY15 FY16 FY17
Net Working Capital - % of Net Sales
4.8%
1.5% 2.7%
3.7%
1.3%
4.2%4.3%
4.5%
13.1%
3.6%
6.8%
11.0%
4.0%
12.9%
14.6%
17.0%
2.7
2.4
2.5
2.9
3.0
3.1
3.4
3.7
1.8
2.4
3.0
3.6
4.2
0%
6%
12%
18%
FY13 FY14 FY15 FY16 FY17 FY18 FY19 FY20
NOPAT margin ROIC Invested Capital turns

Prataap Snacks 17 January 2018
JM Financial Institutional Securities Limited Page 4
Value-based play to leverage the larger packaged snacks opportunity; profitability turnaround on the back of enhanced scale would be a major value driver
Prataap Snacks, best known for its brand, Yellow Diamond Chips, has, over the past decade
and a half, scaled-up its revenue base to INR9bn by expanding its presence in savoury snacks
category. Interestingly, the revenue build-up has happened through constant product
innovation and geographic expansion – evident from the fact that potato chips which
constituted c.56% of its turnover in FY12 now contributes less than one-fourth of its
revenues. These measures have helped achieve 39% revenue CAGR over FY12-17, though
profitability has remained volatile in the past. Continued thrust on product innovation and
growth opportunities within the industry should ensure healthy growth for the company, in
our view.
However, the level of optimum margin that Prataap can earn would be the key driver of value
and, as per our analysis, once Prataap reaches a reasonable scale, a double-digit margin
appears quite sustainable. There is a possibility of a healthy increase in operating margin (as
witnessed in the case of Britannia but the quantum is expected to be much lower) as the
company enhances scale of operations and resorts to distributed manufacturing which could
help drive efficiencies across supply-chain and distribution costs. Given the focus on product
innovation, intelligent marketing, delivery of higher value to consumers and cost efficiencies,
we remain confident of the company achieving a much better level of profitability. We initiate
with a BUY.
High-teens revenue CAGR quite possible over next 3 years given high scope for penetration and market share gains
Large industry size but remains characterised by under-penetration: The Indian Packaged
snacks market is pegged at INR550bn in size overall, and is characterised by a large
number of unorganised players across all product segments. Snack preferences in India
differ across regions - this trend has led to mushrooming of several companies in different
regions. The smaller players typically have a slim portfolio of products and usually operate
in a single category.
Of the INR550bn total market, the unorganised segment is pegged at INR330bn
representing 60%. The unorganised market largely caters to snacks that can be easily
prepared. At present, there is a gradual shift in favour of the organised segment in the
backdrop of increased competitive activities, cost pressures and shift in consumer
preferences. With the implementation of GST from July’17, tax-evasion in business
operations has become more difficult; this will, over time, reduce the advantage that
unorganised players hitherto enjoyed. It is estimated that the market share between
organised and unorganised players will be nearly equal in the next 5-7 years, presenting a
huge growth opportunity for players in the organised segment.

Prataap Snacks 17 January 2018
JM Financial Institutional Securities Limited Page 5
Indian Snacks Market remains largely unorganised Exhibit 11.
Source: Company, JM Financial
Organised snacks market presents an attractive mid-teens growth opportunity driven by
increasing penetration and conversion: Indian organised snacks market size is estimated
at INR220bn in 2016. It is expected to post a 14-15% CAGR over the next 5 years and
touch INR430bn by 2020. Growth is expected to be led by conversion from unorganised
to organised segment and increasing penetration in Southern and Eastern markets which
currently contribute only 38% of the total snacks market. All three major segments viz.
Chips, Extruded snacks and Namkeen are expected to grow at healthy rates.
Organised snacks market expected to post 14-15% CAGR over next 5 years Exhibit 12.
Source: Company, JM Financial
Organised, INR220bn, 40%
UnOrganised, INR330bn, 60%
Indian Snacks Market - Rs bn
220
430
0
100
200
300
400
500
600
2016 2021E
Indian Snacks market - Rs bn
Org
anis
ed
Total Snacks market in India pegged at Rs550bn

Prataap Snacks 17 January 2018
JM Financial Institutional Securities Limited Page 6
Even within organised market top 5 players have a mere 67% share; remaining Exhibit 13.market remains quite fragmented with each player having <2% market share
Source: Company, JM Financial
South and East India constitute only 38% of the total snacks market Exhibit 14.
Source: Company, JM Financial
Prataap’s presence in high growth categories and track-record of market share gains
should help maintain healthy revenue growth rates: While industry growth rates are
attractive, the snacks segment is also characterised by high competitive intensity given
presence of large competitors such as PepsiCo and ITC. However, Prataap’s historical
track-record of consistent gains in market share, commitment to new launches (new
variants in existing products and entering new segments), innovative marketing
campaigns and focus on expanding and leveraging its existing distribution network drive
our confidence on healthy revenue growth sustaining over the medium term. Our
confidence stems from:
- Strong 27% revenue CAGR over FY13-17; growth driven by Namkeen and Extruded
Snacks: Prataap Snacks’ revenue has nearly trebled over FY13-17 to INR9bn reflecting
a CAGR of 27%. The growth was achieved despite a subdued performance from
Potato Chips segment which constituted 42% of its sales in FY13 and posted a mere
10% CAGR during the period. However, this was compensated by Extruded Snacks
segment which posted a 37% CAGR in sales and now accounts for c.63% of its
revenue (vs c.47% in FY13). Sales of Namkeen posted a 41.5% CAGR though from a
relatively smaller base and accounted for 12% of gross sales in FY17. Both Namkeen
and Extruded Snacks are high growth categories and expected to outperform growth
of the Chips segment. Increased presence in Extruded Snacks and Namkeen augurs
well for Prataap Snacks we believe.
Market share of Top 5 players,
67%
Others, 33%
Indian Organised Snacks Market share - 2016
North, 32%
South , 19%East, 19%
West, 30%
Indian Organized Snacks Market break-up

Prataap Snacks 17 January 2018
JM Financial Institutional Securities Limited Page 7
Prataap posted 27% revenue CAGR over FY13-17 Exhibit 15.…
Source: Company, JM Financial
…aided by healthy growth in extruded snacks and Exhibit 16.Namkeens
Source: Company, JM Financial
- Prataap’s revenues have grown at c.2x the industry pace aided by innovative
marketing and share gains in extruded snacks: Over 2012-16, the snacks industry has
registered a 14.7% CAGR while Prataap Snacks has grown at nearly double the pace
i.e. 27% CAGR. As per our analysis, this implies a market share gain of nearly 200bps
in the overall organised snacks industry. A similar analysis for extruded snacks sub-
category implies a near c.500bps market share gain over the period of 4 years. As per
the company, expansion of its Rings product in the Eastern market aided in driving
this share gain - share of eastern region in total revenues have increased from 24% in
FY14 to 33.3% in FY17.
Scaling-up presence in Eatern region… Exhibit 17.
Source: Company, JM Financial
…has partially aided in driving market share gains Exhibit 18.
Source: Company, JM Financial
3,431
4,450
5,546
7,457
8,927
0
1,000
2,000
3,000
4,000
5,000
6,000
7,000
8,000
9,000
10,000
FY13 FY14 FY15 FY16 FY17
Net Sales - INR bn
37.0%
41.5%
20%
25%
30%
35%
40%
45%
Extruded Snacks Namkeens
Prataap Revenue CAGR - FY13-17 - %
24%
33%
10%
15%
20%
25%
30%
35%
FY14 FY17
Eastern region share of Prataap's revenue
27.0%
14.7%
5%
10%
15%
20%
25%
30%
Prataap Organised snacks indusry
Sales CAGR - FY13-17 - %

Prataap Snacks 17 January 2018
JM Financial Institutional Securities Limited Page 8
Prataap launched the corn rings variant (which drove market share gains) of shaped
extruded snacks in FY12 under the sub-brand Rings. The product was primarily
targeted at children and hence a toy was included in the pack as a key product
proposition. The company tied up with popular children's TV channels and
pragrammes to promote this product through select cartoons, programmes and movie
marketing. These strategies worked well and helped the company gain market
leadership in the corn rings segment despite it being a relatively late entrant in the
segment. This product was the primary driver of revenues over past 5 years and has
aided in enhancing the share of extruded snacks from 38.5% to 63.5% over FY12-17.
Extruded snacks has been instrumental in driving Prataap’s revenue growth over Exhibit 19.past few years
Source: Company, JM Financial l
- Higher salience of faster growth sub-categories and new launches should help
Prataap outpace industry growth: Indian organised snacks industry is expected to
register a healthy 14-15% CAGR over next 5 years aided by a shift from unorganised
to organised segment on increased penetration and accessibility. Prataap, given its
smaller scale of operations and thrust on innovations, can outpace these growth rates
significantly as done in the past, we believe. We cite the following drivers:
Market share gains in existing portfolio: Prataap has, over the past 6 years, enhanced
its market share in the overall snacks category from mere 1% in 2010 to 4% in 2016.
However, it still remains a small player in the overall context which provides large
headroom for growth – less than one-seventh the size of PepsiCo and just about one-
fifth the size of Haldiram (taking the three Haldiram together). Interestingly, >75% of
Prataap’s portfolio consists of fast-growing extruded snacks and namkeen segments
while chips segment which is expected to have a relatively lower growth potential
constitutes <25% of revenues. Presently, portfolio concentration towards products
with relatively higher growth potential should itself help the company outpace
industry growth, we believe. Coupled with this, Prataap’s focus on driving higher
value for customers and consistent delivery of new product launches should help drive
share gains within existing sub-segments as well.
38.7%
57.6%
63.8%
20%
40%
60%
80%
FY12 FY15 FY17
Extruded Snacks - % of revenue

Prataap Snacks 17 January 2018
JM Financial Institutional Securities Limited Page 9
Extruded snacks and namkeens now constitute >75% of portfolio Exhibit 20.
Source: Company, JM Financial
Entry in healthy snacks and sweet snacks sub-segments help build future growth
drivers: For sustaining its existing high growth trajectory in future as well, Prataap is
now focussing on two important areas, viz. driving presence in channels like Modern
Trade and entering the sweet snacks category by leveraging its existing distribution
network.
So far, Prataap has focussed on its core-set of value-conscious customers and hence
derived >80% of its sales from the INR5 price point. The company is now looking to
also enter new age channels like Modern Trade by leveraging the health and wellness
trend. Given growing demand for healthier snacking options, Prataap has put in place
a plan to grow in the healthier snack segment through the introduction of Chips
made from healthier ingredients like hummus and lentils. It is stepping-up research
and development efforts on the product attributes that are most valued by
consumers, including taste, nutrition, food-safety and convenience. This would allow
the company to better serve the increasing demand from consumers for healthier,
tastier and higher quality food products and gain market share in the process.
Enhancing geographical penetration: Prataap Snacks' current focus is on increasing
penetration in the markets where it currently operates viz. North and West zones
particularly in Rajasthan, Punjab and Uttar Pradesh by replicating its product
proposition that has historically helped its brand growth. It is also planning to increase
presence in the relatively newer Southern market, by using its Ring product to gain
market share. Southern region contributed merely 9-10% of sales in FY17 and
presents huge scope for expansion. The company also intends to appoint more super
stockists to strengthen its existing sales infrastructure and increase its advertising
activities to build brand awareness in key geographies.
Projecting high-teens revenue CAGR over next 5 years; market share gains of 150bps in
extruded snacks: We are building in c.19% revenue CAGR over FY17-20 which is quite
in-line with growth rate witnessed in FY17 (impacted by demonetisation) and much lower
relative to 27% CAGR witnessed over FY13-17. Extention of its extruded snacks portfolio
to southern markets and scaling-up its Namkeen category are expected to be the key
driver for growth. We are also projecting a successful launch of choco-pie though
contribution would still be limited at the end of three years (<3% in FY20).
Our estimates imply c.150bps share gain by Prataap Snacks over the next 5 years relative
to nearly 6ppt gain in share that the company has achieved over past 6 years.
Interestingly, the company is still in process of gaining scale in the Southern region which
is a larger market relative to Eastern region for Extruded snacks category. Coupled with
Potato Chips24%
Namkeen13%
Others0%
Random Extrusions (Chulbule)
13%
Rings & Puff47%
Wheels and Scoops3%
Extruded Snacks63%
Gross Sales break-up

Prataap Snacks 17 January 2018
JM Financial Institutional Securities Limited Page 10
this, entry in the modern trade channel, launch of new variants and focus on distribution
expansion should help drive market share gains in our view. It is also important to note
that top 5 players constitute 67% of the market and balance 30% remains quite
fragmented with none of the individual players having a market share in excess of 2%.
Gradual market share gains from these smaller players seems quite achievable, in our
view, especially given the huge scope for distribution led expansion. Despite the 150bps
gain, it would still remain below ITC’s market share.
Prataap Snacks has 8% market share in extruded snacks category and is the third Exhibit 21.largest player.
Source: Company, JM Financial
Our estimates imply a 150bps market share gain over next 5 years relative to Exhibit 22.600bps achieved over past 6 years in Extruded snacks
INR mn FY17 FY22 Cagr
Prataap - Sales at Company level (Extruded Snacks) 5,694 13,561 19.0%
Prataap - Sales at MRP level 8,134 19,373 19.0%
Estd CAGR for the Industry
15.0%
Market share for Prataap 8.0% 9.5%
Mkt size based on Prataaps' data 101,670 204,169
Source: Company, JM Financial
Double-digit margin highly probable over the medium term.
Operating margin volatility in the past has raised investor concerns….: Historically,
Prataap had high volatility in its earnings performance largely driven by sharp inflation in
its key raw materials – potato (c.14% of RM cost base in FY17) and edible palm oil (30%
of its RM cost base in FY17). Its EBITDA margin has swung in the 4-8% band over past 4
years with sharp expansion or contraction seen every year.
Operating margin fell to trough levels of c.4.5% in two out of the past four years - FY14
and FY17. Interestingly the reasons for the nose-dive in margin are quite different – FY14
was purely on account of inflation in input costs viz. potato and edible oils while FY17
operating margin was also impacted by other factors (in addition to RM cost inflation)
viz.,
- High inflation in employee costs.
- Sharp increase in freight costs on enhanced turnover in the Southern region which
had to be serviced from Indore facility on account of capacity constraints.
- Increase in contractual labour costs on wage settlement in Guwahati factory.
The sharp contraction was also partially attributable to deceleration in revenue growth
post demonetisation. Lower throughput adversely impacted absorption of fixed cost
which was built up to support a higher revenue base.
PepsiCo, 44%
ITC, 12%DFM Foods, 4%
Prataap Snacks, 8%
Parle, 2%
Others, 30%
Indian Extruded Snacks market - 2016 Market Share %

Prataap Snacks 17 January 2018
JM Financial Institutional Securities Limited Page 11
Operating margin has been sensitive to cost inflation in the past given limited Exhibit 23.pricing power.
Source: Company, JM Financial
….however, its efforts that drove savings in other expenses were overshadowed by
incremental investments in A&P spends: Over FY13-17, Prataap’s EBITDA margin has
been quite volatile on steep changes in raw material costs and higher personnel costs. Its
interesting to note, however, during this period Prataap’s investments behind A&P spends
grew 14x and increased by c.340bps as a percentage of sales. Excluding the investments
behind A&P spends, EBITDA margin was near flattish despite 113bps contraction in gross
margin and 123bps increase in staff costs (as % of sales) – largely on 120bps reduction in
other expenses (aided by positive operating leverage) and higher other operating income.
In our view, the opportunities for scale-led efficiencies could be higher over a longer term
once revenue growth rates normalises.
Higher revenue growth rates have aided Prataap’s cost absorption historically Exhibit 24.
Source: Company, JM Financial
8.0%
4.5%
6.1%
7.6%
4.6%
0%
1%
2%
3%
4%
5%
6%
7%
8%
9%
FY13 FY14 FY15 FY16 FY17
EBITDA margin - %
Decline on sharp input cost inflation.
Employee cost inflation, higher freight costs and RM cost inflationimpacted margin.
19.6%
19.0%
17.1%17.4%
18.4%
99%
30%25%
34%
20%
0%
20%
40%
60%
80%
100%
120%
15%
16%
17%
18%
19%
20%
FY13 FY14 FY15 FY16 FY17
Other expenses - % of revenue YoY Revenue growth - %
Higher frieght costs and deceleration in revenue growth impacted cost absorption
Prataap Snacks 17 January 2018
JM Financial Institutional Securities Limited Page 12
GPM compression was largely negated by savings in other overheads; Investment Exhibit 25.behind A&P spends impacted operating margin over FY13-17
Source: Company, JM Financial
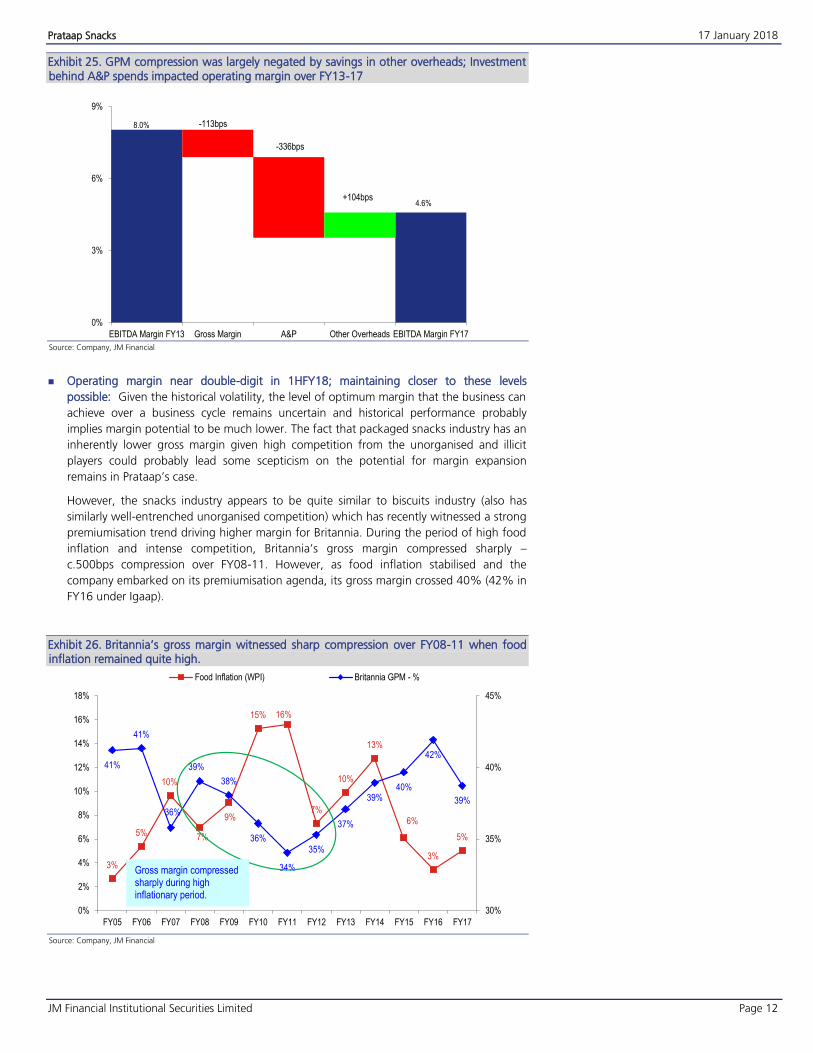
Operating margin near double-digit in 1HFY18; maintaining closer to these levels
possible: Given the historical volatility, the level of optimum margin that the business can
achieve over a business cycle remains uncertain and historical performance probably
implies margin potential to be much lower. The fact that packaged snacks industry has an
inherently lower gross margin given high competition from the unorganised and illicit
players could probably lead some scepticism on the potential for margin expansion
remains in Prataap’s case.
However, the snacks industry appears to be quite similar to biscuits industry (also has
similarly well-entrenched unorganised competition) which has recently witnessed a strong
premiumisation trend driving higher margin for Britannia. During the period of high food
inflation and intense competition, Britannia’s gross margin compressed sharply –
c.500bps compression over FY08-11. However, as food inflation stabilised and the
company embarked on its premiumisation agenda, its gross margin crossed 40% (42% in
FY16 under Igaap).
Britannia’s gross margin witnessed sharp compression over FY08-11 when food Exhibit 26.inflation remained quite high.
Source: Company, JM Financial
8.0%
4.6%
-113bps
-336bps
+104bps
0%
3%
6%
9%
EBITDA Margin FY13 Gross Margin A&P Other Overheads EBITDA Margin FY17
3%
5%
10%
7%
9%
15% 16%
7%
10%
13%
6%
3%
5%
41%
41%
36%
39%
38%
36%
34%
35%
37%
39%40%
42%
39%
30%
35%
40%
45%
0%
2%
4%
6%
8%
10%
12%
14%
16%
18%
FY05 FY06 FY07 FY08 FY09 FY10 FY11 FY12 FY13 FY14 FY15 FY16 FY17
Food Inflation (WPI) Britannia GPM - %
Gross margin compressed sharply during high inflationary period.

Prataap Snacks 17 January 2018
JM Financial Institutional Securities Limited Page 13
In our view, a similar trend can also play our for Prataap Snacks and as edible oil prices
stabilise, the company could post sustained margin expansion. It is interesting to note
here that Prataap’s immediate competitor viz. DFM Foods has clocked gross margin in the
range of 35-40% over FY13 to FY16 while Prataap’s GPM has been around 26-30% over
the same period. The reasons for the differences were,
- Prataap snacks derive revenues across regions with north/east/west accounting for
30%/33%/30% of turnover. It has scaled-up its revenues in a quick span of time and
given manufacturing presence largely in central India, it had to appoint super-stockists
across regions. DFM Foods’ presence is largely in Northern region (c.80% of its
turnover) and hence direct distribution is quite feasible for the company which helps
save some channel margin.
- DFM Foods, with its operations largely in Northern region, was subjected to a much
lower VAT rate (5%) while the average VAT rate for Prataap Snacks stood at 8-9%.
- Prataap Snacks has a higher proportion of Namkeens in its portfolio which is a
voloume-led lower gross margin segment while DFM Foods portfolio largely consisted
of Rings (Extruded Snacks).
Prataap’s gross margin differential vs DFM has nearly-halved in 1HFY18 vs peak Exhibit 27.level seen in FY15
Source: Company, JM Financial
The GPM differential has fallen to 580bps in 2QFY18 as GST implementation has now
equalised the tax incidence across regions. Interestingly, the company has clocked a 9.4%
EBITDA margin in 1HFY18 and expects the margin to be largely in the range of 8-10%
henceforth. The sharp increase in EBITDA margin was a result of benign raw material cost
environment, cost efficiencies in GST regime and some grammage adjustments which
should aid margin in future as well.
With GST now equalising tax incidence across regions, it creates a level playing field for
national players like Prataap and is expected to be detrimental for some of the regional
players hitherto enjoying lower tax incidences. Coupled with improved margin in
Namkeens portfolio and price increases, we expect Prataap Snacks to sustain EBITDA
margin in the 8-10% range in near future.
6.8%
11.0%
12.1%
8.9%
10.9%
6.5%
30%
26%27%
30%29%
33%37% 37%
39% 39%40% 39%
15.0%
25.0%
35.0%
45.0%
3%
5%
7%
9%
11%
13%
FY13 FY14 FY15 FY16 FY17 1HFY18
Gross Margin differential Prataap GPM DFM Foods GPM
GPM differnetialcatching up in
1HFY18 partially adided by unified
tax rate under GST

Prataap Snacks 17 January 2018
JM Financial Institutional Securities Limited Page 14
Increased contribution from Namkeens had adversely impacted gross margin Exhibit 28.historically
Source: Company, JM Financial
Double-digit margin on a sustainable basis quite possible as scale increases: While we
expect operating margin to be in the 8-10% range over medium-term, the possibility of
company achieving a double-digit margin on a sustainable basis also remains high in our
view. The scale-up in margin could follow a somewhat similar pattern that we have
witnessed in Britannia. As the scale of operation increases, the company would be
looking at establishing distributed manufacturing facilities which would help gain a larger
share of the retail price by eliminating the incremental middle-men in the supply chain as
well as reduce freight costs. Furthermore, the possibility of premiumisation of product
portfolio also remains high given new launches are now on the health and wellness
platform which command higher operating margin; its sweet snacks venture is also
expected to have a higher gross margin.
Possibility of mid-teens ROIC and strong cash generation would help sustain the premium valuation multiple.
Investments in enhancing scale of operations / distribution reach and one-off events
impacted profitability in FY17: Investments on capacity, brand-building, product portfolio
diversification, scaling-up presence in Namkeen segment, RM cost inflation and
distribution expansion have adversely impacted Prataap’s profitability in FY17. In addition
to this, revenue growth rate also sharply decelerated towards the end of FY17 on account
of demonetisation exercise which led to sub-optimal absorption of overheads and staff
costs. While the company scaled-up RoE to a healthy level of 15.6% in FY16, ROE fell
sharply in FY17 to a mere 3.7% on account of high RM costs (resulting in 129bps GPM
compression) and increased overheads relating to a new facility in Guwahati.
Profitability now back to healthy levels: After a sharp dip in profitability in FY17, EBITDA
margin has now touched near double-digit level in 1HFY18 aided by improved realisations
and a benign raw material cost environment. As discussed earlier, given tax incidence
now being similar across regions, a more well-diversified portfolio and capacities ramped
up in Southern region, we expect Prataap to maintain EBITDA margin in 8-10% range
over the medium term. Benefits of higher scale of operation and efforts on portfolio
premiumisation should also help drive EBITDA margin in the future.
We expect ROIC to cross 15% by FY20: Volatility in profitability has evidently impacted
the return ratios for Prataap and ROIC has fluctuated between 4-14% over FY12-17. The
lower ROIC has, however, overshadowed the efficiencies achieved in asset utilisation
during this period. The company’s total asset turns increased from 1.7x in FY12 to 3.0x in
FY17 despite high investments in capital expenditure – gross fixed assets increased 4x
during the period. This was largely driven by enhanced throughput (sales grew 5.2x) and
by efficiency in working capital management – net working capital declined from 13.2%
of sales to 7.1% by FY17. Decline in NWC was largely led by better inventory
3.4%
10.8%
12.3%
0%
2%
4%
6%
8%
10%
12%
14%
FY12 FY15 FY17
Namkeens - % of revenue

Prataap Snacks 17 January 2018
JM Financial Institutional Securities Limited Page 15
management which led to a steep decline in inventory days - fell from 54 days of sales in
FY12 to 32 days in FY17.
Prataap has, in fact, achieved 15% ROIC in 1HFY18 itself (based on opening invested
capital) on the back of improvement in profitability with EBITDA margin touching near
double-digit levels. However, we are building in operating margin in the range of 8.5-
9.5% over the next two years given volatility in raw material costs and limited pricing
power in core value portfolio. In our view, the improvement in return ratio would be
completely driven by better utilisation of fixed assets (through enhanced scale of
operations) and further improvement in working capital.
At NOPAT margin of 4.5% (clocked 4.8% in FY13 and 3.7% in FY16), gross fixed asset
turns of 3.2x and net working capital of c.6% of sales, Prataap can clock a 17% ROIC in
FY20, on our estimates. ROE is expected to remain lower at 12%, though, given high net
cash on balance sheet.
ROIC to touch 17% by FY20 Exhibit 29.
Source: Company, JM Financial
Higher operating margin to aid cash generation as well: Prataap has recorded positive
operating cash flows in each of the past 6 years though free cash flows have been
negative on account of investment in capital employed and volatile margin. With margin
volatility now largely addressed and limited requirement of capital expenditures, we see
inherently healthy free cash flow generation potential for the company. On our estimates,
Prataap can generate free cash flow of in excess of INR100mn in each year over next
three years.
4.8%
1.5% 2.7%
3.7%
1.3%
4.2%4.3%
4.5%
13.1%
3.6%
6.8%
11.0%
4.0%
12.9%
14.6%
17.0%
2.7
2.4
2.5
2.9
3.0
3.1
3.4
3.7
1.8
2.4
3.0
3.6
4.2
0%
6%
12%
18%
FY13 FY14 FY15 FY16 FY17 FY18 FY19 FY20
NOPAT margin ROIC Invested Capital turns

Prataap Snacks 17 January 2018
JM Financial Institutional Securities Limited Page 16
Operating margin to sustain above 8% levels Exhibit 30.
Source: Company, JM Financial
Gross margin gains to aid operating margin Exhibit 31.
Source: Company, JM Financial
Our DCF based price target at INR1,390 provides c.19% upside
At current market price of INR1,168, Prataap is trading at c.24x on NTM EV/EBITDA and
48x NTM earnings. Near-term financials, in our view, do not entirely capture the high
revenue growth opportunity and the huge potential for improvement in Prataap’s
profitability metrics.
We resort to DCF methodology for valuation as it not only captures the long-term
revenue growth potential and hence the higher scale that Prataap can achieve over a
period of time, but also the possibility of driving higher margin in the future as well as
improvement in asset-turns. Our DCF based target price works out to INR1,390/share.
Our DCF based methodology is divided in three phases:
- Explicit period of 10 years where we are forecasting c.31% FCFF CAGR over FY19-
29E.
- Fade period where we forecast free cash flow growth to slowly fade to 7% levels over
a 10-year period.
- Terminal value based on 6% terminal growth rate.
Our DCF is based on Prataap delivering 11-12% EBITDA margin by the end of explicit
period on a sustainable basis. As discussed earlier, we believe there is a higher probability
of operating margin being in double-digit levels once scale of operations increases and
efficiencies are delivered.
WACC for the business is estimated at 12%.
275
202
339
565
409
898
1,097
1,373
8.0%
4.5%
6.1%
7.6%
4.6%
8.7% 8.8% 9.2%
0.0%
2.0%
4.0%
6.0%
8.0%
10.0%
0
280
560
840
1,120
1,400
FY13 FY14 FY15 FY16 FY17 FY18E FY19E FY20E
EBITDA - INR mn EBITDA margin - %
4.6%
9.2%
+432bps+43bps -10bps
2%
4%
6%
8%
10%
EBITDA Margin FY17 Gross Margin Other expenses A&P EBITDA Margin FY20

Prataap Snacks 17 January 2018
JM Financial Institutional Securities Limited Page 17
With estimates of c.31% free cash flow CAGR over FY19-FY29, we arrive at a DCF based price target of INR1390 Exhibit 32.
Source: Company, JM Financial
Year for fade period 11 12 13 14 15 16 17 18 19 20
Year for explicit period 0 0 1 2 3 4 5 6 7 8 9 10
FY16 FY17 FY18E FY19E FY20E FY21E FY22E FY23E FY24E FY25E FY26E FY27E FY28E FY29E CAGR
Explic it Forecas t
EBIT 385 159 572 728 939 1,178 1,472 1,793 2,134 2,531 2,967 3,517 4,093 4,761
Tax Rate 0.7% 23.5% 26.3% 29.7% 30.8% 31.9% 31.9% 31.9% 31.9% 31.9% 31.9% 31.9% 31.9% 31.9%
NOPAT 383 121 422 512 650 803 1,003 1,221 1,453 1,724 2,020 2,395 2,787 3,243 20.3%
Depreciation 180 250 326 369 434 509 593 686 788 899 1,018 1,143 1,285 1,443
Change in net working capital -181 91 -119 -77 -116 -108 -115 -171 -185 -210 -208 -234 -263 -297
Capex -323 -786 -516 -623 -670 -797 -843 -987 -1,006 -1,173 -1,151 -1,314 -1,465 -1,635
Free Cas h Flow 59 -324 112 180 298 407 638 749 1,050 1,240 1,679 1,991 2,344 2,754 31.3%
Discount Factor 0.89 0.80 0.71 0.64 0.57 0.51 0.45 0.40 0.36 0.32
Dis counted FCFF 266 324 454 476 596 628 759 804 845 887
Fade Period FY30 FY31 FY32 FY33 FY34 FY35 FY36 FY37 FY38 FY39
FCFF 3,206 3,700 4,231 4,793 5,380 5,983 6,590 7,189 7,768 8,312
% growth 16.4% 15.4% 14.3% 13.3% 12.2% 11.2% 10.1% 9.1% 8.0% 7.0%
Discount factor 0.3 0.3 0.2 0.2 0.2 0.2 0.1 0.1 0.1 0.1
Dis counted FCFF 922 950 970 981 983 976 960 935 902 862
Va luation
PV of explicit forecast 6,039
PV of Fade period 9,439
PV of terminal value 15,222
Enterpris e Va lue 30,701
Les s :
Net Debt -1,918
Minority interest
Va lue attributable to equity s hareholders32,619
No. of shares - mn 23
Share price - Rs 1391
WACC 11.0%
Termina l growth rate 6.0%
EPS - 1 yr fwd 31.9
P/E 43.6
EBITDA - 1 yr fwd 1,373
EV/EBITDA 22.4

Prataap Snacks 17 January 2018
JM Financial Institutional Securities Limited Page 18
Indian packaged foods industry overview
Snacks constitute 10% of the Indian organised Packaged Foods market: Indian packaged
foods market includes ready-to-eat / cook foods aimed at providing convenience to
consumers. They have a higher shelf-life as they usually undergo certain degree of
processing to increase taste, stability etc. It includes bakery products, canned / dried
processed food, frozen processed food, meal replacement products, dairy products,
snacks, confectioneries, beverages, etc. Prataap Snacks mainly operates in snacks
segment which constitutes 10% of the organised Indian packaged foods market.
The Indian organised packaged snack and savouries market is pegged at INR550bn. The
market is characterised by large number of unorganised players operating across product
segments. Snack preferences differ across regions and many small players operate in each
market catering to particular type of snack with a slim portfolio of product on that
account. On account of these reasons, only 40% of the snacks market is organised and
this also presents a huge growth opportunity for organised players.
Snacks constituted 10% of organised packaged foods Exhibit 33.
segment
Source: Company, JM Financial
Unorganised segment still constitutes 60% of the total Exhibit 34.
market
Source: Company, JM Financial
Indian organised snacks market growing at 16.4% CAGR: The Indian organised snacks
market stood at INR220bn as at the end of 2016 and has grown at 16.4% CAGR over
past 6 years. High growth has been aided by overall growth in processed foods segment
and a trend towards consolidation. Aided by better infrastructure and technology,
organised players have been able to re-create traditional Indian snacks and products
which has aided in increasing their market share. Large FMCG companies characterized
by large portfolio of products, aggressive advertisements and active R&D have been able
to drive leadership position in several product categories. They have been able to better
navigate cost pressures and increased competition which has aided gradual shift towards
organised players across segments.
Dairy Products, 38%
Baked Products, 27%
Confectioneries, 6%
Snacks, 10%
Sauces, 4%
RTE, 7%
Others, 8%
Indian Organized Packaged Food Market - %
Organised, Rs220bn, 40%
UnOrganised, Rs330bn, 60%
Indian Snacks Market - Rs bn

Prataap Snacks 17 January 2018
JM Financial Institutional Securities Limited Page 19
Indian organised snacks market pegged at INR220bn, expected to grow at 16.4% Exhibit 35.CAGR
Source: Company, JM Financial
Traditional Snacks and Namkeen market still have the largest share of the Indian Snacks
market: Traditional Snacks and Namkeen still account for the highest share in the Indian
organized snacks market- 36% in 2016. Chips now accounts for 30% while Extruded
Snacks constitute 32%. Higher availability and easy accessibility have aided in driving
growth. PepsiCo India, with Lays’ Chips and Kurkure (Extruded Snacks) in its portfolio, is
the market leader with c.30% market share. Medium-sized companies like Balaji Wafers
and Prataap Snacks are also gaining visibility across India.
Independent grocers account for 75% of Snack sales in India: Due to the structure of the
Indian retail market, there is a large presence of unorganised small grocery stores and
petty shops that cater to the daily demands of consumers. These shops are present in
residential areas, and stock essential products and are targeted by companies to attain
maximum consumer-reach. These independent grocery stores account for c.75% of the
total snacks sales and typically stock the most popular products and SKUs of each
category. Petty shops usually stock the smallest SKU size product which is more popular in
the rural markets.
There is an increasing trend towards modern retail trade in urban markets. Consumers are
attracted by factors such as size of the outlets, multiple options and varieties, presence of
imported products, offers and discounts and the option to purchase all products under
one roof. Hence, snack companies are also increasingly offloading their products through
hypermarkets and supermarkets. This provides opportunities to display larger varieties and
get more SKUs, launch new products and flavours, sell multi-packs through offers, etc.
Snack companies typically stock medium-sized and large sized packets to cater to this
segment of consumers.
However, the domination of small grocery stores is expected to continue for the next five
to ten years. E-tailing of snacks is still in a nascent stage and snack companies may not
look at this in a big way since snacks are typically impulse purchases.
87
220
0
50
100
150
200
250
2010 2016
Indian Organised Snacks market - Rs bn
33% 40% Share of organised
players

Prataap Snacks 17 January 2018
JM Financial Institutional Securities Limited Page 20
As the purchases are impulse driven, Independent small grocers dominate the Exhibit 36.sales channel for snacks
Source: Company, JM Financial
Organised Snacks market estimated to grow at a CAGR of c.14.6% over the next 5 years:
The market for Organised Snacks in India is estimated to grow at about 14.6% CAGR,
between 2016 and 2021. Some of the traditional segments such as chips, nuts and
popcorn are expected to witness only moderate growth of about 10% as these categories
have reached near maturity with limited scope for new offerings. The market for
Namkeen is expected to witness the highest growth, at 17.8% over 2016-2021 driven by
shift from unorganised sector to the organised sector, and also by higher penetration in
Southern and Eastern markets.
Organised snacks market is expected to maintain a healthy growth rate over next Exhibit 37.5 years
Source: Company, JM Financial
PepsiCo is the largest player in the Organised Indian Snacking space: PepsiCo, driven by
its brands Lays (Chips) and Kurkure (Extruded Snacks) has a strong 30% market share in
the Indian organized snacks market. Its brands are present in all the 3 segments viz.
Chips, Extruded Snacks and Namkeen with >40% market share in Chips and Extruded
Snacks. A large portfolio of products, innovative flavours, extensive distribution network,
regular new product launches, aggressive advertisement and promotion and celebrity
endorsements have helped PepsiCo gain dominance in these categories.
In addition to PepsiCo, strong growth has also been witnessed by players like Balaji
Wafers and Prataap Snacks. These companies account for 7% and 4% market share in
organised snacks market respectively. Balaji Wafers was started in Western India and
despite its marketing spending being much lesser than PepsiCo, it has been able to
Independent Small Grocers, 75%
Other Retailers, 5%
Convenience Stores, 3%
Hypermarkets, 7%
Supermarkets, 10%
Indian Organized Snacks Market break-up
220
430
0
50
100
150
200
250
300
350
400
450
500
2016 2021E
Organised Snacks market - Rs bn

Prataap Snacks 17 January 2018
JM Financial Institutional Securities Limited Page 21
dominate the market for Chips in this regions with c.60% market share. Prataap Snacks
has established presence in Western and North Indian markets and is currently increasing
penetration in Southern markets as well. Prataap Snacks is the market leader in the Rings
part of Extruded Snacks segment.
At an overall level, the products of Prataap Snacks at the INR5 price point contained up to
25% more grammage than that of the market leader. This is critical for the price
conscious middle-class Indian consumer and has been one of the key factors that led the
growth of medium-sized companies, especially in semi-urban and rural markets.
Extruded Snacks
Extruded snacks have become one of the preferred snacking choice of consumers:
Extrusion technologies have an important role in the food industry as an efficient
manufacturing process. The products developed by this process are known as Extruded
Snacks and they differ in colour, shape, and texture. Extruded food products are mainly
corn flour and potato-based but a combination of flours can also be used. Fast-paced
lifestyle, high disposable income, rising urbanisation, and transforming food culture have
attributed to the growth and demand of the Indian snacks market, including Extruded
Snacks.
Extruded Snacks market has grown at 14.4% CAGR: Extruded Snacks market is valued at
INR174.6bn and has registered c.14.4% CAGR over past 6 years. Only 40% of the overall
extruded snacks market is organized pegging the organized market at INR69.6bn and
implying high scope for penetration led growth.
Unorganised segment accounts for 60% of Extruded snacks Exhibit 38.
Source: Company, JM Financial
Northern and Western India are the largest markets for Extruded Snacks. Both these
regions also witnessed the fiercest competitive action in both the organised and
unorganised segments. Small pack size is imperative to push sales volumes, especially in
the rural markets, where penetration is minimal. Even in extruded snacks, the products
that are sold across the various regions vary depending on what is native to the region
and the typical flavours enjoyed in that region.
Organised, 40%
UnOrganised, 60%
Indian Extruded Snacks Market

Prataap Snacks 17 January 2018
JM Financial Institutional Securities Limited Page 22
Region-wise split of extruded snacks market Exhibit 39.
Source: Company, JM Financial
Rings is one of the key varieties of Extruded Snacks segment and including corn rings, it
accounts for about 8-10% of the total Extruded Snacks market. This segment is entirely
targeted at children. There are various types of Corn-based Extruded Snacks but the most
common one is the puffed variety. Variants such as cheese balls, cheese puffs, and spicy
corn puffs are popular. Fryums are also a popular category in the market, with a large
presence of unorganised players.
Brief snapshot of the Extruded Snacks market Exhibit 40.
Source: Company, JM Financial
Organised Extruded Snacks is expected to grow at c.15% CAGR (2016-21) over next five
years driven by market growth and share gains from the unorganized sector.
PepsiCo is the overall market leader; Prataap Snacks leads in Corn-rings category: PepsiCo
is the market leader with a 44% value share in 2016 with their 15-year-old brand
Kurkure. Medium-sized companies like Prataap Snacks, Balaji Wafers and DFM Foods are
strong in certain regional pockets and offer better prices than the major companies to
help increase penetration across the country. The presence of such players is high in
Western India indicating the intensity in level of competition in that region. By expanding
their product portfolio and penetrating newer markets, these companies have been
garnering market shares over the last two to three years and clocking high growth rate.
Prataap Snacks is the market leader in corn-rings with Rings, followed by DFM Foods with
‘Crax’. Medium-sized companies, including Prataap Snacks and SM Foods, have been
moving towards expanding across the entire country and challenging the large
companies. Smaller companies have thus far been typically confined to a city or a few
cities in a region.
North, 33%
South, 22%
East, 17%
West, 28%
Indian Extruded Snacks market Regionwise break-up
Corn-based - % of
Extruded Snacks
Potato- based - % of
Extruded Snacks
Share of independent
grocers in Extruded
Snacks
65% 13% 75%

Prataap Snacks 17 January 2018
JM Financial Institutional Securities Limited Page 23
Extruded Snacks: Market share 2010 Exhibit 41.
Source: Company, JM Financial
Extruded Snacks: Market share 2016 Exhibit 42.
Source: Company, JM Financial
Chips
Chips market in India is a sizeable one; Valued at INR137.6bn: There are a large number
of players in the market operating at national level as well as regional level. In addition to
potato chips, tapioca chips and banana chips are the top varieties consumed in the
country. Potato is the most popular variety and accounts for more than 90% of the total
chips market. Indian chips market has grown at 10% p.a. over past 6 years. A large
variety of SKUs, new and innovative tastes targeting traditional as well as global flavours,
ease of availability across all shops, multi-pack sales and aggressive promotions through
celebrities are some of the prime reasons for the success of the chips segment in India.
Indian Chips market: Organised segment constitutes 47% Exhibit 43.of the total market.
Source: Company, JM Financial
Organised Chips market is expected to grow at 10% Exhibit 44.CAGR
Source: Company, JM Financial
Indian organised chips market is pegged at INR65.5bn and constitutes 48% of the total
chips market. North and West account for 63% of the total organized market while
South and East constitute merely 37%. A large number of chips manufacturers are based
in Madhya Pradesh, from where they serve Northern and Western markets, while some
companies cater to Eastern market as well.
Potato chips are very popular in Northern and Western India, while South India sees a
mixed demand for potato chips, tapioca chips and banana chips, with banana chips being
particularly popular in Kerala. As taste is the major factor that determines success of a
product, companies prefer to experiment with local tastes in addition to standard
flavours. Organized Chips market is estimated to register c.10% CAGR over the next 5
years. Growth rates are expected to be relatively lower in this category as Chips is a
relatively more matured market compared to the other sub-segments.
PepsiCo is the leader in the Chips market as well: The market share of market leader
PepisoCo (‘Lays’) has declined over the past few years with mid-sized companies such as
PepsiCo, 40%
ITC, 9%DFM Foods, 3%
Prataap Snacks, 2%
Balaji, 1%
Others, 45%
Indian Extruded Snacks market - 2010 Market Share %
PepsiCo, 44%
ITC, 12%DFM Foods, 4%
Prataap Snacks, 8%
Parle, 2%
Others, 30%
Indian Extruded Snacks market - 2016 Market Share %
Organised, 48%Unorganised,
52%
Indian Chips market break-up
66
106
0
20
40
60
80
100
120
2016 2021E
Organised Chips market - Rs bn

Prataap Snacks 17 January 2018
JM Financial Institutional Securities Limited Page 24
Balaji Wafers and Prataap Snacks chipping away market share from PepsiCo. Aggressive
pricing and increasing availability across various types of outlets have aided growth in
these companies.
Chips market: Market share 2010 Exhibit 45.
Source: Company, JM Financial
Chips market: Market share 2016 Exhibit 46.
Source: Company, JM Financial
Namkeen
Expected to register highest growth rate amongst Snacks sub-segments at 17.8% CAGR:
Namkeen (traditional Indian savoury snacks) covers a broad range of products that are
traditionally consumed in India and most of these products were hitherto cooked at
home. However, on account of changes in lifestyles, consumers are now opting for
convenience and are choosing to purchase these products instead. This has resulted in the
Indian market experiencing high growth over the last few years. Moong Dal and Aloo
Bhujia are the most popular products in the segments. Due to the varied eating habits
across India, the preference for traditional snacks varies across the country. Namkeen
market has grown at 14% CAGR over the past 6 years and it is pegged at c.INR224bn at
present. Organised penetration is very low at 35% as most of these products can be
prepared at home as well as by local condiment shops. North and West India are the
major consumers of Namkeen accounting for 61% of organised market.
Organised Namkeen market is expected to register 17.8% CAGR over next 5 years and
would be the fastest growing sub-segment. Presence of huge number of unorganised
players, attractive packaging and flexible price points are expected to fuel the growth of
the Namkeen market.
Namkeen expected to be the fastest growing sub-segment Exhibit 47.in the Snacks space
Source: Company, JM Financial
Unorganised segment accounts for 65% of the namkeen Exhibit 48.market
Source: Company, JM Financial
PepsiCo, 65%
Balaji, 9%
ITC, 8%
Parle, 4%
Haldirams, 3%
Prataap Snacks, 3% Others, 8%
Indian Chips market - Market share 2010 - %
PepsiCo, 50%
Balaji, 12%
ITC, 9%
Parle, 6%
Haldirams, 4%
Prataap Snacks, 3%
Others, 16%
Indian Chips market - Market share 2016 - %
78
178
0
20
40
60
80
100
120
140
160
180
200
2016 2021E
Organised Namkeen market - Rs bn
Organised, 35%
Unorganised, 65%
Indian Namkeen market break-up

Prataap Snacks 17 January 2018
JM Financial Institutional Securities Limited Page 25
Haldirams is the undisputed market leader in Namkeen market with 48% market share
and has always been associated with packaged traditional snacks and sweets in India and
abroad. Bikaji Food, Balaji Wafers and Bikanervala Foods are other companies in the
Namkeen market with market share of 10%, 7% and 6% respectively. Prataap Snacks
has a strong presence in Eastern and Western markets. Since the traditional snacks in
Southern India are quite different from the other regions, certain players such as MTR and
Maiyas have a strong presence in that part of the country.
Namkeen market: Market share in 2010 Exhibit 49.
Source: Company, JM Financial
Namkeen market: Market share in 2016 Exhibit 50.
Source: Company, JM Financial
Haldirams, 53%
Bikaji Foods, 6%
Balaji Wafers, 5%
Bikanervala Foods, 4%
PepsiCo, 5%
Others, 27%
Indian Namkeen market -- 2010 Market Share %
Haldirams, 48%
Bikaji Foods, 10%
Balaji Wafers, 7%
Bikanervala Foods, 7%
PepsiCo, 3%
Prataap Snacks, 1%
Others, 24%
Indian Namkeen market -- 2016 Market Share %

Prataap Snacks 17 January 2018
JM Financial Institutional Securities Limited Page 26
Business overview:
6th largest Indian snack food company: Prataap Snacks is the 6th largest snack-food
company in India in terms of revenues in 2016 and is also amongst the fastest growing
companies in the Indian organised snack market over 2010 to 2016. Prataap Snacks is
present in 3 major savoury snacks categories in India; the products are sold under the
‘Yellow Diamond’ brand.
In FY12, it acquired the manufacturing business of its group company, Prakash Snacks
Private Limited, pursuant to a business transfer agreement dated September 28, 2011.
Pursuant to such arrangement, the company acquired the ‘Yellow Diamond’ brand and
the snack-foods business under such brand for an aggregate consideration of INR320mn
as a going concern in an outright slump sale on an “as-is-where-is” basis. The purchase
of the business included contracts, goodwill, licences and approvals, IP rights, immoveable
and moveable assets rights relating to the business, all records pertaining to the business
and certain agreed upon liabilities.
The company has, over the years, leveraged its understanding of target markets and
consumer segments, product innovation capabilities, extensive distribution network,
strategically located manufacturing facilities, and has focused its marketing and
promotional activities to establish and scale-up the ‘Yellow Diamond’ brand across India.
The company’s product portfolio includes three categories:
- Extruded Snacks - c.63% of revenues: These are processed, reconstituted and shaped
potato or cereal based snacks and may be flavoured or unflavoured. The Extruded
Snacks portfolio includes two sub-categories: 1) Shaped Extruded Snacks - includes
Puffs, Rings and Pellets products; and 2) Random Extruded Snacks (sold under the
'Chulbule' brand).
- Chips - c.24% of revenues: Includes fried, sliced chips / crisps made from potatoes,
hummus, lentils etc. It includes flavoured and unflavoured chips, and may be standard
chips, thick-cut and / or crinkle-cut. Potato Chips under the 'Yellow Diamond' brand
were introduced in FY05.
- Namkeen - c.13% of revenues: These are a type of traditional savoury Indian snack
which includes products such as moong dal, masala or fried nuts, sev and chaklis.
Prataap Snacks: Gross sales break-up Exhibit 51.
Source: Company, JM Financial
Potato Chips24%
Namkeen13%
Others0%
Random Extrusions (Chulbule)
13%
Rings & Puff47%
Wheels and Scoops3%
Extruded Snacks63%
Gross Sales break-up

Prataap Snacks 17 January 2018
JM Financial Institutional Securities Limited Page 27
Prataap’s product portfolio Exhibit 52.
Product Category Launch year Flavours SKUs
Extruded Snacks
Chulbule
FY06 Tangy Tomato, Teekha Tadka, Noodle Masala, Taza Tomato, Achari
Chatka, Tango Mango and Cream ‘N’ Onion INR5, INR10, and INR20
Rings
FY12 Masala, Tomato, Mango Chutney, and Chilli Cheese INR5 and INR15
Puffs
FY10 Cocktail, Tomato, Pudina, and Punjabi Tadka INR5
Wheels
FY10 Chatpata Masala and Tomato Ketchup INR 5
Scoops
FY10 Masala and Tomato INR5
Potato Chips
Potato Chips
FY05
Plain Salted, Cream ‘n’ Onion, Tom-Chi, Nimbu Masala, Yummy
Masala, Tangy Tomato, Tasty Punch, Plain Upvas, Black Pepper and
Magic Masala
INR5, INR10, and INR20
Namkeen
Namkeen
FY12
Moong Dal, Chana Dal, Chana Masala – Heeng Jeera flavour, All-
in-One, Aloo Bhujia, Bhujia Sev, Punjabi Tadka, Ratlami Sev, Tasty
Shing Bhujia, Mixture, Falahari Chivda – Meetha and sweet and
salty flavours, Khatta Meetha, Banana Wafers –Black Pepper and
Salted flavours, Cornflake Mixture, Bhel, Plain Sev Mamra, Garlic
Sev Mamra, Masala Matar, Chana Choor and Peanuts – Classic and
Salt and Pepper flavours.
INR5, INR10, INR30 and INR70
Source: Company, JM Financial

Prataap Snacks 17 January 2018
JM Financial Institutional Securities Limited Page 28
Prataap Snacks evolution timeline Exhibit 53.
Calendar Year Particulars
2002 Incorporation of Prakash Snacks Private Limited.
2004 Set up a plant to manufacture potato chips in Indore.
2006 Installed a plant to manufacture Chulbule (random extruded snacks) in Indore.
2009 Incorporation of Prataap Snacks Pvt. Ltd.
2010 The plant at Indore for manufacturing extruded snacks received ISO 22000:2005 certification.
2011
Incorporation of wholly owned subsidiary Pure N Sure Food Bites Pvt. Ltd.
Prataap Snacks, by way of slump sale, took over the business of Prakash Snacks
Commissioned plants to manufacture Rings and Namkeen in Indore
Acquired brand Yellow Diamond from Prakash Snacks
Investment by Sequoia aggregating to INR620mn
2012
Setting-up of a new plant to manufacture Potato Chips in Indore.
Investment by Sequoia aggregating to INR120mn
2013 Investment by Sequoia aggregating to INR300mn.
2014 Commissioned a plant to manufacture Rings, Chulbule and Pellets at Guwahati.
Further INR250mn investment by Sequoia.
2015 Increased the capacity of Chulbule and Rings manufacturing plants in Indore
2016
Commissioned a new plant to manufacture rings at Guwahati.
The plants at Indore for manufacturing potato chips and namkeen received ISO 22000:2005 certification.
Conversion into a public limited company and change of name to Prataap Snacks Limited.
Source: Company, JM Financial
Prataap Snacks' diversified portfolio helps cater to wide-range of consumers segments:
Prataap Snacks seeks to differentiate from competitors through launch of new products,
introducing new flavours targeted at addressing consumer taste, market trends and
maximising value to consumers. Diversified product portfolio enables the company to
cater to a wide range of taste preferences and consumer segments, including adults,
youth and children - Extruded Snacks category are primarily targeted at the youth and
children while Potato Chips and Namkeen category are for all consumer segments. This
lowers the risk of volatility in revenues on shifts in consumer preferences and market
trends. Its brand philosophy is based on delivering higher value to consumers, as reflected
by the regular introduction of new flavours, relatively high grammage, and inclusion of
promotional items such as toys to offer more value in products.
Pan-India distribution network supported by strategically located manufacturing facilities:
The company's wide spread and integrated sales and distribution network enables it to
reach a wide range of consumers and ensure effective market penetration. As of March
31, 2017, its distribution network included 205 super stockists across 26 States and one
Union Territory in India and approximately 3,400 distributors. Prataap Snacks owns and
operates three manufacturing facilities - one located at Indore (Madhya Pradesh) and the
other two located at Guwahati (Assam). These facilities have access to cost efficient
transportation to major markets and help the company benefit from transportation cost
efficiencies from reverse logistics arrangements. The company has also engaged two
facilities on contract manufacturing basis, located at Bengaluru (Karnataka) and at

Prataap Snacks 17 January 2018
JM Financial Institutional Securities Limited Page 29
Kolkata (West Bengal). In FY17, revenue from traded goods contributed 2.83% of
revenue from operations.
Packaging material is the largest component in COGS: Prataap's raw material
requirements include ingredients required for production of snack foods including oil,
potatoes, corn, rice and gram as well as packaging and labelling materials. Various kinds
of toys are also procured (as part of Rings packaging) from various suppliers.
Packaging Material: Film accounts for the largest part of raw material costs and are used
as packaging material. Snack foods are sold in film packaging and cardboard boxes are
used for bulk shipments. Products are sourced from local suppliers. Packaging materials
accounted for c.15.8% of revenuein FY17.
Rings Toys: Toys are offered as part of the promotional campaign for Rings. The variety of
toys to be included in the packaging is determined on the basis of festivals and
promotional schemes undertaken at that point in time. Toys are generally sourced
through local suppliers.
Other key raw materials: Potatoes, oil and corn are the other key raw materials and are
sourced domestically from local suppliers. Potatoes are sourced through short term or
spot purchase arrangements at variable prices from Indore and nearby areas which are
known for their quality potatoes and are stored in cold storage facilities leased by the
company. Potatoes are also procured from Maharashtra and Gujarat largely for
immediate consumption. Oil and corn are also purchased from local suppliers.
Owns three manufacturing facilities with total annual capacity of 80,500 MT: As of the
date of prospectus, Prataap owned and operated three manufacturing facilities in India -
one at Indore (Madhya Pradesh), and two other facilities at Guwahati (Assam). The
second facility at Guwahati started commercial operations from April 1, 2016. The
aggregate estimated annual installed capacity for these owned and operated
manufacturing facilities was 80,500 MT. In addition, it also engages two facilities on a
contract manufacturing basis in Bengaluru (Karnataka) and Kolkata (West Bengal). The
entire capacity of the Bengaluru facility is now exclusively dedicated towards the
manufacture of Prataap's products with effect from August 1, 2016 while the Kolkata
facility is non-exclusive. As of March 31, 2017, the estimated installed production capacity
of the Bengaluru contract manufacturing facility was 2,760 MT.
Innovative marketing initiatives have helped drive growth: The company intends to
increase its marketing and advertising activities to further strengthen brand awareness
and achieve higher recall for its brands, especially in semi-urban and rural markets. It has
carried out several successful campaigns in the past like using "Chhota Bheem" (a
popular Indian cartoon) and related characters on Rings packaging, using characters of
"Ben 10", and "Roll No. 21", popular animated series amongst children, for promotion
of its products on Cartoon Network etc. The company currently has a tie-up with Viacom
18 Media Private Limited, the entity that operates the popular children's entertainment
channel 'Nickelodeon', to use the cartoon characters 'Motu Patlu' on its Rings packaging.
Further, the company also sells Potato Chips, Chulbule (Extruded Snacks) and Namkeen,
to both adults and youth with the 'Dildaar Hai Hum' campaign through television. It
intends to use some part of the net proceeds for advertising and marketing activities to
increase brand awareness of Yellow Diamond by engaging in direct promotional
initiatives and advertising products through hoardings in key geographies as well as
through television and radio advertisements.

Prataap Snacks 17 January 2018
JM Financial Institutional Securities Limited Page 30
Key Financials Summary
Revenue trends: Prataap has delivered a net sales CAGR of 27% over FY13-17 aided by
consistent innovation and scaling-up of extruded snacks segment. The extruded snacks
segment which contributed 64% of revenues in FY17 achieved 37% revenue CAGR over
the same period. The Namkeens segment also grew quite well at 41% CAGR though
partly aided by a lower base. Potato chips segment lagged with a mere 10% CAGR.
We are expecting the company to report a revenue CAGR of c.19% over FY17-20 –
expecting FY18 revenue growth to be lower at 15.7% as the trajectory got impacted by
GST implementation led disruption in the wholesale channel. We expect the company’s
revenue growth trajectory to pick-up in FY19 and FY20 to 20% CAGR but would still
remain lower relative to 27% CAGR seen historically.
Revenue growth trends expected to remain healthy Exhibit 54.
Source: Company, JM Financial
EBITDA trend: EBITDA has, though, clocked a mere 10.4% CAGR over FY13-17 and
stood at INR409mn in FY17. EBITDA margin contracted by 345bps to 4.6% over FY13-17
(EBITDA margin stood at 8% in FY13). EBITDA margin was impacted by high RM cost
inflation and some constraints in capacity in Southern region leading to higher freight
costs.
We expect EBITDA to post a c.50% CAGR over FY17-20 aided by sharp margin expansion
– EBITDA margin to expand by 465bps to 9.2%. This would be largely attributable to
positive operating leverage.
3,431
4,450
5,546
7,457
8,927
10,329
12,462
14,884
0
2,000
4,000
6,000
8,000
10,000
12,000
14,000
16,000
FY13 FY14 FY15 FY16 FY17 FY18E FY19E FY20E
Revenue - INR mn

Prataap Snacks 17 January 2018
JM Financial Institutional Securities Limited Page 31
Sharp rebound in EBITDA margin in FY18 expected Exhibit 55....
Source: Company, JM Financial
…aided by pricing actions, more stable input-costs Exhibit 56.environment and level-playing field under the GST regime
Source: Company, JM Financial
Adjusted net profit trend: Adjusted profit has posted a 28.4% CAGR over FY12-17 from
INR117mn in FY12 to INR317mn in FY17. However, net profit fell to a mere INR85mn in
FY17 on sharp margin compression (as explained earlier).
As operating margin has now reached near double-digit levels in 1HFY18, we expect
Prataap to post a profit CAGR of 107% over FY17-20 partially on lower base (net profit
CAGR at 30% over FY18-20)
Adjusted net profit trends Exhibit 57.
Source: Company, JM Financial
275
202
339
565
409
898
1,097
1,373
8.0%
4.5%
6.1%
7.6%
4.6%
8.7% 8.8% 9.2%
0.0%
2.0%
4.0%
6.0%
8.0%
10.0%
0
280
560
840
1,120
1,400
FY13 FY14 FY15 FY16 FY17 FY18E FY19E FY20E
EBITDA - INR mn EBITDA margin - %
4.6%
9.2%
+432bps+43bps -10bps
2%
4%
6%
8%
10%
EBITDA Margin FY17 Gross Margin Other expenses A&P EBITDA Margin FY20
137
40
92
317
85
440
602
748
0
100
200
300
400
500
600
700
800
FY13 FY14 FY15 FY16 FY17 FY18E FY19E FY20E
Adjusted net profit - INR mn

Prataap Snacks 17 January 2018
JM Financial Institutional Securities Limited Page 32
Prataap has consistently driven efficiencies in net working capital which we expect Exhibit 58.to continue in future as well.
Source: Company, JM Financial
Forecasting ROIC to improve to mid-teens level by FY20 Exhibit 59.
Source: Company, JM Financial
10.5%
11.4%
9.8% 9.7%
7.1% 7.3%
6.7%6.4%
0%
2%
4%
6%
8%
10%
12%
FY13 FY14 FY15 FY16 FY17 FY18E FY19E FY20E
Net Working Capital - % of sales
4.8%
1.5% 2.7%
3.7%
1.3%
4.2%4.3%
4.5%
13.1%
3.6%
6.8%
11.0%
4.0%
12.9%
14.6%
17.0%
2.7
2.4
2.5
2.9
3.0
3.1
3.4
3.7
1.8
2.4
3.0
3.6
4.2
0%
6%
12%
18%
FY13 FY14 FY15 FY16 FY17 FY18 FY19 FY20
NOPAT margin ROIC Invested Capital turns

Prataap Snacks 17 January 2018
JM Financial Institutional Securities Limited Page 33
Key PNL snapshot (INR mn) Exhibit 60.
Source: Company, JM Financial
F Y13 F Y14 F Y15 F Y16 F Y17 F Y18 F Y19 F Y20
Net Sales 3,431 4,450 5,546 7,457 8,927 10,329 12,462 14,884
Other Operational Income 7 7 42 115 112 78 95 113
Net Rev enue 3,438 4,456 5,588 7,572 9,039 10,407 12,557 14,997
YoY growth 99.1% 29.6% 25.4% 35.5% 19.4% 15.1% 20.7% 19.4%
COGS 2,408 3,284 4,040 5,222 6,366 6,955 8,384 9,972
Gross Prof it 1,030 1,172 1,548 2,350 2,673 3,452 4,173 5,025
Gross margin % - excl op other income 29.8% 26.2% 27.2% 30.0% 28.7% 32.7% 32.7% 33.0%
bps change -239 bps -363 bps 97 bps 282 bps -129 bps 398 bps 6 bps 28 bps
Staff Costs 55 89 137 187 253 331 399 476
% of sales 1.6% 2.0% 2.5% 2.5% 2.8% 3.2% 3.2% 3.2%
Advertisement & Promotions 26 36 122 303 368 426 520 629
% of sales 0.8% 0.8% 2.2% 4.1% 4.1% 4.1% 4.2% 4.2%
Other Expenditure 673 845 950 1,295 1,644 1,798 2,157 2,547
% of sales 19.6% 19.0% 17.1% 17.4% 18.4% 17.4% 17.3% 17.1%
EBITDA 275 202 339 565 409 898 1,097 1,373
YoY growth 51.5% -26.8% 68.0% 66.9% -27.7% 119.7% 22.2% 25.2%
% margin 8.0% 4.5% 6.1% 7.6% 4.6% 8.7% 8.8% 9.2%
bps change -253 bps -349 bps 158 bps 147 bps -300 bps 411 bps 11 bps 43 bps
Depreciation 68 117 153 180 250 326 369 434
EBIT 207 85 185 385 159 572 728 939
YoY growth 34.6% -59.0% 118.5% 108.0% -58.8% 260.2% 27.3% 29.0%
Interest 36 47 63 59 45 40 0 0
Other Income 7 12 18 7 15 65 128 143
PBT before except ional items 178 50 140 334 129 597 856 1,082
Exceptional Income / (Expense) 0 0 -10 -58 0 0 0 0
PBT after exceptional items 178 50 130 276 129 597 856 1,082
Tax 30 -4 31 2 30 157 254 333
Tax rate % 16.6% -8.3% 23.8% 0.7% 23.5% 26.3% 29.7% 30.8%
Prof it A f ter Tax 149 54 99 274 99 440 602 748
YoY growth 17.8% -63.7% 83.3% 176.4% -63.9% 345.0% 36.8% 24.3%
Less: Preference Div idend 12 14 14 14 14 0 0 0
Net Prof it 137 40 85 260 85 440 602 748
YoY growth 17.1% -70.8% 112.5% 205.5% -67.3% 418.4% 36.8% 24.3%
Prof it adjusted for except ional items 137 40 92 317 85 440 602 748
YoY growth 17.1% -70.7% 130.8% 243.6% -73.2% 418.4% 36.8% 24.3%

Prataap Snacks 17 January 2018
JM Financial Institutional Securities Limited Page 34
Key risks
A swift shift in consumer preferences towards healthier food products: Prataap’s portfolio
of products consists of Indian and western snacks that are characterized by higher
convenience and is customised to suit Indian palate. These snacks are, however,
consumed in smaller quantities or completely avoided by people with increased health
consciousness given the higher fat content in these food products. Increased instances of
lifestyle diseases especially related to unhealthy food habits is also leading to increased
health consciousness amongst consumers. Acceleration in this pace of shifting of
consumers towards healthy products could adversely impact revenue growth for the
industry. However, given the high presence of unorganised segment, there appears to be
lower risk of such an eventuality happening in the near term. Furthermore, the snacks
companies would, in our view, innovate and adapt their portfolio as consumer
preferences change in order to stay relevant.
Incremental taxes being levied on packaged foods with higher fat content: Indian
regulatory authorities have, in recent times, displayed intentions of enhancing taxes on
food products which are unhealthy and are witnessing increased consumption.
Carbonated soft drinks is one such example which is taxed at higher rates relative to
other packaged foods and beverages. While such a tax does not appear to be under
contemplation at present, the possibility of higher taxes cannot ignored in future and
could adversely impact revenues for this industry.
Sharp rise in competitive intensity: Given Prataap’s limited presence in categories like
potato chips, random extruded snacks (Kurkure) excluding rings and Namkeens which are
competing directly with the larger players like PepsiCo, ITC and Haldirams and its higher
focus on value segment, it has not yet witnessed aggressive competition from the larger
players (though, it has been facing tough competition from regional players like Balaji and
unorganised segment). However, as the company gains scale, it will have to directly
compete with the larger players and its quest for market share gains could impact the
overall industry profitability, in our view. However, such an event has a lower probability
in our view given the industry is already characterised by lower profitability and Prataap’s
focus remains on creating more innovative products rather than competing in the existing
segments with incumbents.
Risks related to contamination of products or negative publicity with respect to products:
Prataap Snacks is subjected to normal risks relating to food and beverage industry
including contamination of raw materials, consumer product liability claims, product
tampering, labelling errors, product recalls etc. These issues could adversely impact the
reputation and could result in high legal liabilities for the company.
Loss of business or potential adverse publicity from spurious or imitation products: Within
India, there also remains a risk of other companies passing off their products as products
as products of Prataap Snacks and also includes risks of spurious or imitation products.
These issues could take time to resolve and will have a negative impact on the company's
revenues in the interim period. Low quality of spurious products could also adversely
impact the reputation of the company.
Stringent food safety, consumer goods, health and safety laws and regulations: Prataap
Snacks’ operations are subject to stringent health and safety laws as its products are
meant for human consumption and are therefore subject to various industry specific
regulations. There may also be additional regulatory requirements due to changes in
governmental policies. Any changes in these laws could entail additional costs and
liabilities related to compliance and could negatively impact profitability of the company.

Prataap Snacks 17 January 2018
JM Financial Institutional Securities Limited Page 35
Financial Tables (Consolidated)
Profi t & Loss Sta te me nt (INR mn) Ba la nce She e t (INR mn)
Y/E Ma rch FY16A FY17A FY18E FY19E FY20E Y/E Ma rch FY16A FY17A FY18E FY19E FY20E
Sa le s 7 ,457 8,927 10,329 12,462 14,884 Shareholders' Fund 2,161 2,372 5,125 5,606 6,168
Sales Growth 34.4% 19.7% 15.7% 20.7% 19.4% Share capital 3 19 117 117 117
Other Operating Income 115 112 78 95 113 Reserves & Surplus 2,158 2,353 5,007 5,489 6,050
Tota l Re ve nue 7,572 9,039 10,407 12,557 14,997 Preference Share Capital 12 12 0 0 0
Cost of Goods Sold/Op. Exp. 5,222 6,366 6,955 8,384 9,972 Minority Interest 0 0 0 0 0
Personnel cost 187 253 331 399 476 Total Loans 544 804 0 0 0
Other expenses 1,598 2,012 2,224 2,678 3,176 Def. Tax Liab / Assets (-) 55 85 93 116 146
EBITDA 565 409 898 1,097 1,373 Tota l - Equi ty & Lia b 2,772 3,272 5,217 5,722 6,314
EBITDA margin (%) 7.6% 4.6% 8.7% 8.8% 9.2% Net Fixed Assets 1,985 2,526 2,717 2,972 3,207
EBITDA Growth (%) 66.9% -27.7% 119.7% 22.2% 25.2% Gross Fixed Assets 2,214 2,785 3,301 3,925 4,594
Depn & Amort 180 250 326 369 434 Intangible Assets 0 0 0 0 0
EBIT 385 159 572 728 939 Less: Depn. & Amort. 532 777 1,102 1,471 1,905
Other Income 7 15 65 128 143 Capital WIP 303 518 518 518 518
Finance Cost 59 45 40 0 0 Investments 0 0 0 0 0
PBT before Excep & Forex 334 129 597 856 1,082 Current Assets 1,429 1,745 3,568 4,037 4,636
Excep & forex Inc/Loss(-) -58 0 0 0 0 Inventories 685 789 877 1,024 1,183
PBT 276 129 597 856 1,082 Sundry Debtors 183 197 255 273 326
Taxes 2 30 157 254 333 Cash & Bank Balances 61 111 1,745 1,918 2,158
Extraordinary Inc/Loss(-) 0 0 0 0 0 Loans & Advances 482 575 613 740 884
Assoc. Profit/Min. Int.(-) -14 -14 0 0 0 Other Current Assets 18 74 78 82 86
Reported Net profit 260 85 440 602 748 Current Liab. & Prov. 642 999 1,068 1,287 1,530
Adjuste d Ne t Profi t 317 85 440 602 748 Current Liabilities 630 979 1,042 1,256 1,493
Net Margin (%) 4.3% 1.0% 4.3% 4.8% 5.0% Provisions & Others 12 20 26 31 37
Diluted share capital (mn) 15.0 15.2 23.5 23.5 23.5 Net Current Assets 786 746 2,500 2,750 3,106
Di lute d EPS (INR) 21.1 5 .6 18.8 25.7 31.9 Appl ic a tion of Funds 2,771 3,272 5,217 5,722 6,314
Diluted EPS Growth 238.1% -73.6% 236.8% 36.8% 24.3% Source: Company, JM Financial
Total Dividend + Tax 0 0 44 120 187
Dividend Per Share (Rs) 0.0 0.0 1.6 4.3 6.6
Source: Company, JM Financial
Ca sh Flow sta te me nt (INR mn) Dupont Ana lys i s
Y/E Ma rch FY16A FY17A FY18E FY19E FY20E Y/E Ma rch FY16A FY17A FY18E FY19E FY20E
Profit before Tax 334 129 597 856 1,082 Net Margin 4.3% 1.0% 4.3% 4.8% 5.0%
Depn. & Amort. 180 250 326 369 434 Asset Turnover (x) 2.9 3.0 2.4 2.3 2.5
Net Interest Exp. / Inc. (-) 52 29 -25 -128 -143 Leverage Factor (x) 1.3 1.3 1.1 1.0 1.0
Inc (-) / Dec in WCap. -60 50 -119 -77 -116 RoE 15.7% 3.7% 11.7% 11.2% 12.7%
Others 0 14 0 0 0 Ke y Ra tios
Taxes Paid -72 -46 -149 -231 -303 Y/E Ma rch FY16A FY17A FY18E FY19E FY20E
Ope ra ting Ca sh Flow 433 426 629 788 954 BV/Share (INR) 143.8 155.6 218.5 239.0 263.0
Capex -463 -586 -516 -623 -670 ROIC (%) 15.5% 4.3% 13.1% 14.5% 16.9%
Free Cash Flow -30 -160 113 165 285 ROE (%) 15.7% 3.7% 11.7% 11.2% 12.7%
-Inc/dec in investments -6 -10 0 0 0 Net Debt-equity ratio (x) 0.2 0.3 -0.3 -0.3 -0.3
Others 3 -102 65 128 143 PER 55.3 209.6 62.2 45.5 36.6
Inve sting Ca sh Flow -466 -698 -451 -495 -527 PBV 8.1 7.5 5.3 4.9 4.4
Inc/(dec) in capital 0 112 2,345 0 0 EV/EBITDA 31.9 45.3 28.6 23.2 18.4
Dividend+Tax Thereon 0 0 -44 -120 -187 EV/Net Sales 2.4 2.1 2.5 2.0 1.7
Inc/dec in loans 93 261 -804 0 0 Debtor days 9 8 9 8 8
Others -42 -50 -40 0 0 Inventory days 34 32 31 30 29
Fina nc ing Ca sh Flow 51 323 1,457 -120 -187 Creditor days 33 41 40 40 40
Inc / De c (-) in Ca sh 18 51 1,634 173 240 Source: Company, JM Financial
Opening cash balance 43 61 111 1,745 1,918
Closing cash balance 61 111 1,745 1,918 2,158
Source: Company, JM Financial

Prataap Snacks 17 January 2018
JM Financial Institutional Securities Limited Page 36
APPENDIX I
JM Financial Inst itut ional Secur it ies Limited
Corporate Identity Number: U65192MH1995PLC092522 Member of BSE Ltd. and National Stock Exchange of India Ltd. and Metropolitan Stock Exchange of India Ltd.
SEBI Registration Nos.: BSE - INZ010012532, NSE - INZ230012536 and MSEI - INZ260012539, Research Analyst – INH000000610 Registered Office: 7th Floor, Cnergy, Appasaheb Marathe Marg, Prabhadevi, Mumbai 400 025, India.
Board: +9122 6630 3030 | Fax: +91 22 6630 3488 | Email: [email protected] | www.jmfl.com
Compliance Officer: Mr. Sunny Shah | Tel: +91 22 6630 3383 | Email: [email protected]
Definition of ratings
Rating Meaning
Buy Total expected returns of more than 15%. Total expected return includes dividend yields.
Hold Price expected to move in the range of 10% downside to 15% upside from the current market price.
Sell Price expected to move downwards by more than 10%
Research Analyst(s) Certification The Research Analyst(s), with respect to each issuer and its securities covered by them in this research report, certify that: All of the views expressed in this research report accurately reflect his or her or their personal views about all of the issuers and their securities; and No part of his or her or their compensation was, is, or will be directly or indirectly related to the specific recommendations or views expressed in this research report. Important Disclosures This research report has been prepared by JM Financial Institutional Securities Limited (JM Financial Institutional Securities) to provide information about the company(ies) and sector(s), if any, covered in the report and may be distributed by it and/or its associates solely for the purpose of information of the select recipient of this report. This report and/or any part thereof, may not be duplicated in any form and/or reproduced or redistributed without the prior written consent of JM Financial Institutional Securities. This report has been prepared independent of the companies covered herein.
JM Financial Institutional Securities is registered with the Securities and Exchange Board of India (SEBI) as a Research Analyst, Merchant Banker and a Stock Broker having trading memberships of the BSE Ltd. (BSE), National Stock Exchange of India Ltd. (NSE) and Metropolitan Stock Exchange of India Ltd. (MSEI). No material disciplinary action has been taken by SEBI against JM Financial Institutional Securities in the past two financial years which may impact the investment decision making of the investor.
JM Financial Institutional Securities provides a wide range of investment banking services to a diversified client base of corporates in the domestic and international markets. It also renders stock broking services primarily to institutional investors and provides the research services to its institutional clients/investors. JM Financial Institutional Securities and its associates are part of a multi-service, integrated investment banking, investment management, brokerage and financing group. JM Financial Institutional Securities and/or its associates might have provided or may provide services in respect of managing offerings of securities, corporate finance, investment banking, mergers & acquisitions, broking, financing or any other advisory services to the company(ies) covered herein. JM Financial Institutional Securities and/or its associates might have received during the past twelve months or may receive compensation from the company(ies) mentioned in this report for rendering any of the above services.
JM Financial Institutional Securities and/or its associates, their directors and employees may; (a) from time to time, have a long or short position in, and buy or sell the securities of the company(ies) mentioned herein or (b) be engaged in any other transaction involving such securities and earn brokerage or other compensation or act as a market maker in the financial instruments of the company(ies) covered under this report or (c) act as an advisor or lender/borrower to, or may have any financial interest in, such company(ies) or (d) considering the nature of business/activities that JM Financial Institutional Securities is engaged in, it may have potential conflict of interest at the time of publication of this report on the subject company(ies).
Neither JM Financial Institutional Securities nor its associates or the Research Analyst(s) named in this report or his/her relatives individually own one per cent or more securities of the company(ies) covered under this report, at the relevant date as specified in the SEBI (Research Analysts) Regulations, 2014.
The Research Analyst(s) principally responsible for the preparation of this research report and members of their household are prohibited from buying or selling debt or equity securities, including but not limited to any option, right, warrant, future, long or short position issued by company(ies) covered under this report. The Research Analyst(s) principally responsible for the preparation of this research report or their relatives (as defined under SEBI (Research Analysts) Regulations, 2014); (a) do not have any financial interest in the company(ies) covered under this report or (b) did not receive any compensation from the company(ies) covered under this report, or from any third party, in connection with this report or (c) do not have any other material conflict of interest at the time of publication of this report. Research Analyst(s) are not serving as an officer, director or employee of the company(ies) covered under this report.
While reasonable care has been taken in the preparation of this report, it does not purport to be a complete description of the securities, markets or developments referred to herein, and JM Financial Institutional Securities does not warrant its accuracy or completeness. JM Financial Institutional Securities may not be in any way responsible for any loss or damage that may arise to any person from any inadvertent error in the information contained in this report. This report is provided for information only and is not an investment advice and must not alone be taken as the basis for an investment decision. The investment discussed or views expressed or recommendations/opinions given herein may not be suitable for all investors. The user assumes the entire risk of any use made of this information. The information contained herein may be changed without notice and JM Financial Institutional Securities reserves the right
to make modifications and alterations to this statement as they may deem fit from time to time.

Prataap Snacks 17 January 2018
JM Financial Institutional Securities Limited Page 37
This report is neither an offer nor solicitation of an offer to buy and/or sell any securities mentioned herein and/or not an official confirmation of any transaction.
This report is not directed or intended for distribution to, or use by any person or entity who is a citizen or resident of or located in any locality, state, country or other jurisdiction, where such distribution, publication, availability or use would be contrary to law, regulation or which would subject JM Financial Institutional Securities and/or its affiliated company(ies) to any registration or licensing requirement within such jurisdiction. The securities described herein may or may not be eligible for sale in all jurisdictions or to a certain category of investors. Persons in whose possession this report may come, are required to inform themselves of and to observe such restrictions.
Persons who receive this report from JM Financial Singapore Pte Ltd may contact Mr. Ruchir Jhunjhunwala ([email protected]) on +65 6422 1888 in respect of any matters arising from, or in connection with, this report. Additional disclosure only for U.S. persons: JM Financial Institutional Securities has entered into an agreement with JM Financial Securities, Inc. ("JM Financial Securities"), a U.S. registered broker-dealer and member of the Financial Industry Regulatory Authority ("FINRA") in order to conduct certain business in the United States in reliance on the exemption from U.S. broker-dealer registration provided by Rule 15a-6, promulgated under the U.S. Securities Exchange Act of 1934 (the "Exchange Act"), as amended, and as interpreted by the staff of the U.S. Securities and Exchange Commission ("SEC") (together "Rule 15a-6").
This research report is distributed in the United States by JM Financial Securities in compliance with Rule 15a-6, and as a "third party research report" for purposes of FINRA Rule 2241. In compliance with Rule 15a-6(a)(3) this research report is distributed only to "major U.S. institutional investors" as defined in Rule 15a-6 and is not intended for use by any person or entity that is not a major U.S. institutional investor. If you have received a copy of this research report and are not a major U.S. institutional investor, you are instructed not to read, rely on, or reproduce the contents hereof, and to destroy this research or return it to JM Financial Institutional Securities or to JM Financial Securities.
This research report is a product of JM Financial Institutional Securities, which is the employer of the research analyst(s) solely responsible for its content. The research analyst(s) preparing this research report is/are resident outside the United States and are not associated persons or employees of any U.S. registered broker-dealer. Therefore, the analyst(s) are not subject to supervision by a U.S. broker-dealer, or otherwise required to satisfy the regulatory licensing requirements of FINRA and may not be subject to the Rule 2241 restrictions on communications with a subject company, public appearances and trading securities held by a research analyst account.
JM Financial Institutional Securities only accepts orders from major U.S. institutional investors. Pursuant to its agreement with JM Financial Institutional Securities, JM Financial Securities effects the transactions for major U.S. institutional investors. Major U.S. institutional investors may place orders with JM Financial Institutional Securities directly, or through JM Financial Securities, in the securities discussed in this research report.
Additional disclosure only for U.K. persons: Neither JM Financial Institutional Securities nor any of its affiliates is authorised in the United Kingdom (U.K.) by the Financial Conduct Authority. As a result, this report is for distribution only to persons who (i) have professional experience in matters relating to investments falling within Article 19(5) of the Financial Services and Markets Act 2000 (Financial Promotion) Order 2005 (as amended, the "Financial Promotion Order"), (ii) are persons falling within Article 49(2)(a) to (d) ("high net worth companies, unincorporated associations etc.") of the Financial Promotion Order, (iii) are outside the United Kingdom, or (iv) are persons to whom an invitation or inducement to engage in investment activity (within the meaning of section 21 of the Financial Services and Markets Act 2000) in connection with the matters to which this report relates may otherwise lawfully be communicated or caused to be communicated (all such persons together being referred to as "relevant persons"). This report is directed only at relevant persons and must not be acted on or relied on by persons who are not relevant persons. Any investment or investment activity to which this report relates is avai lable only to relevant persons and will be engaged in only with relevant persons.
Additional disclosure only for Canadian persons: This report is not, and under no circumstances is to be construed as, an advertisement or a public offering of the securities described herein in Canada or any province or territory thereof. Under no circumstances is this report to be construed as an offer to sell securities or as a solicitation of an offer to buy securities in any jurisdiction of Canada. Any offer or sale of the securities described herein in Canada will be made only under an exemption from the requirements to file a prospectus with the relevant Canadian securities regulators and only by a dealer properly registered under applicable securities laws or, alternatively, pursuant to an exemption from the registration requirement in the relevant province or territory of Canada in which such offer or sale is made. This report is not, and under no circumstances is it to be construed as, a prospectus or an offering memorandum. No securities commission or similar regulatory authority in Canada has reviewed or in any way passed upon these materials, the information contained herein or the merits of the securities described herein and any representation to the contrary is an offence. If you are located in Canada, this report has been made available to you based on your representation that you are an “accredited investor” as such term is defined in National Instrument 45-106 Prospectus Exemptions and a “permitted client” as such term is defined in National Instrument 31-103 Registration Requirements, Exemptions and Ongoing Registrant Obligations. Under no circumstances is the information contained herein to be construed as investment advice in any province or territory of Canada nor should it be construed as being tailored to the needs of the recipient. Canadian recipients are advised that JM Financial Securities, Inc., JM Financial Institutional Securities Limited, their affiliates and authorized agents are not responsible for, nor do they accept, any liability whatsoever for any direct or consequential loss arising from any use of this research report or the information contained herein.