pourthru master hil - north carolina cooperative extension
TRANSCRIPT

Horticulture Information Leaflet 590New 7/2000
Monitoring and Managing pH and EC Using thePourThru Extraction Method
Todd J. Cavins, Brian E. Whipker, William C. Fonteno,Beth Harden, Ingram McCall, and James L. Gibson
Distributed in furtheranceof the Acts of Congress
of May 8 and June 30, 1914.Employment and program
opportunities are offered toall people regardless of
race, color, national origin,sex, age, or handicap.
North Carolina State University,North Carolina A&T State
University, U.S. Departmentof Agriculture, and local
governments cooperating.
College of Agriculture & Life SciencesDepartment of HorticulturalScience
NC STATE UNIVERSITY
Providing a proper nutritional program isessential for growing top quality plants.Sampling the root substrate for pH andelectrical conductivity (EC) with thePourThru extraction method is a quickand simple check of the nutritional statusof a crop. The PourThru extraction methodallows rapid on-site determination of pHand EC values. The values provide cluesabout a crop’s performance beforedeficiency or toxicity symptoms appear.
SAMPLING PROCEDURES
Sampling results are only valid if theyrepresent the whole crop. How to set up asampling program, which crops, and thenumber of samples to collect are all factorsto consider. Below are guidelines for takingrepresentative PourThru samples for in-house testing.
Collecting Samples. The PourThruextraction method is a quick and simpleway to monitor a crop’s nutritional status.For routine analysis, collect and analyze aminimum of 5 individual pots (or forbedding plants a minimum of 5 cell packs).Results from each of the 5 samples canthen be averaged for a single “interpretationvalue”. (Do not combine the 5 samples fora single test. A sampling form is provided.)If the 5 values vary widely in pH or EC youmay need to increase your sample size.
Frequency of Testing. The speed of thismethod makes routine sampling possible.Ideally sampling should be done weeklyon all crops, but this may not be practical.Since time availability is a concern,consider selecting the “Top 10 Crops ofConcern”, based on economic value ornutritional problems. Divide the 10 cropsinto 2 groups and test each group everyother week.
The recommended frequency of testingdepends on the container size, as smallersubstrate volumes are more susceptible torapid changes in pH than larger, morebuffered substrate volumes. For plugs,test pH and EC 2 to 3 times per week.Weekly testing should be sufficient forcrops such as flats of bedding plants or 4”pots. For crops grown in large containers(such as 6” pots), monitoring every twoweeks should be sufficient.
Crop Factors. Consider taking separatesamples within a crop if there are largevariations in the substrate type (differentmanufacturers or ingredients), thefertilizer type or rates (acidic or basictypes), or planting dates.
Other Tips. If steps to correct pH or ECproblem have been taken, then resamplethe plants weekly. If needed, sample as
© 2000, North Carolina State University
2
frequently as every two days.• If results seem atypical, considerresampling before making drasticchanges, especially to the substrate pH.• For more information on PourThrutechniques, extra charts, graphs, andgeneral guidelines check out our WEBsites:http://www.ces.ncsu.edu/floriculture/http://www2.ncsu.edu/hortsublab/
HOW TO COLLECT THE LEACHATE
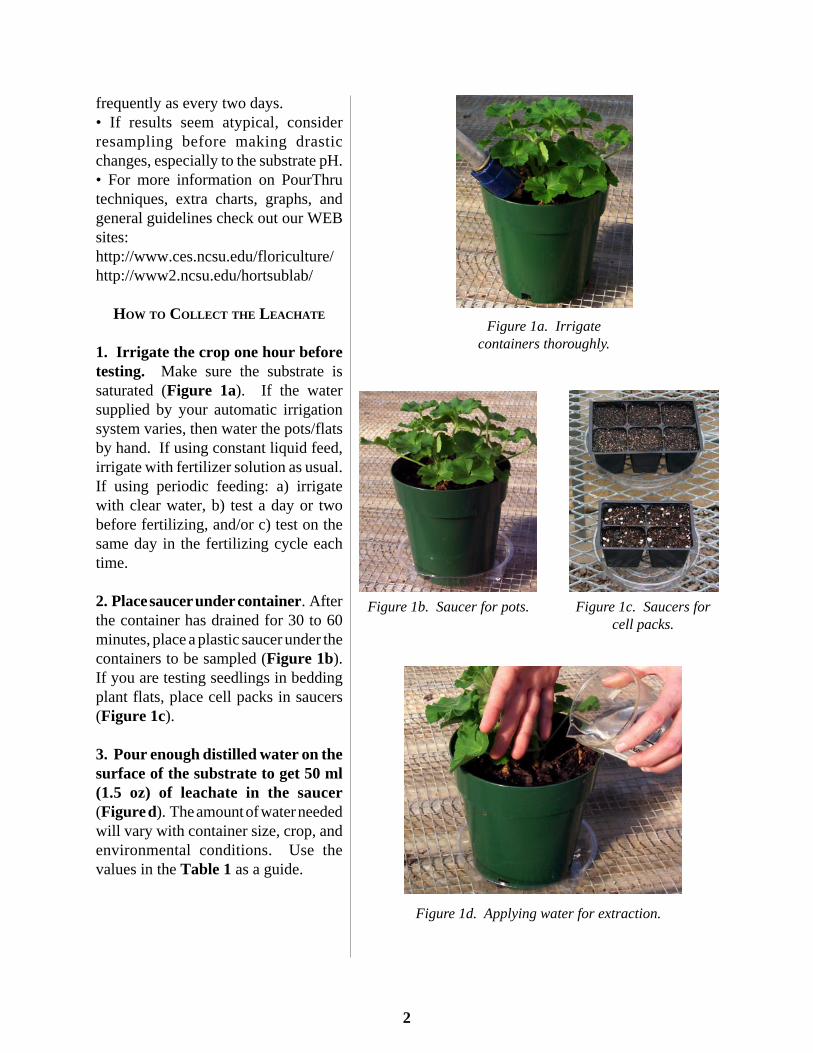
1. Irrigate the crop one hour beforetesting. Make sure the substrate issaturated (Figure 1a). If the watersupplied by your automatic irrigationsystem varies, then water the pots/flatsby hand. If using constant liquid feed,irrigate with fertilizer solution as usual.If using periodic feeding: a) irrigatewith clear water, b) test a day or twobefore fertilizing, and/or c) test on thesame day in the fertilizing cycle eachtime.
2. Place saucer under container. Afterthe container has drained for 30 to 60minutes, place a plastic saucer under thecontainers to be sampled (Figure 1b).If you are testing seedlings in beddingplant flats, place cell packs in saucers(Figure 1c).
3. Pour enough distilled water on thesurface of the substrate to get 50 ml(1.5 oz) of leachate in the saucer(Figure d). The amount of water neededwill vary with container size, crop, andenvironmental conditions. Use thevalues in the Table 1 as a guide.
Figure 1a. Irrigatecontainers thoroughly.
Figure 1b. Saucer for pots. Figure 1c. Saucers forcell packs.
Figure 1d. Applying water for extraction.

3
4. Collect leachate forpH and EC (Figure 1e).Make sure you get about50 ml (1.5 oz) of leachateeach time you test (Figure1f). Leachate volumesover 60 ml will begin todilute the sample and giveyou lower EC readings.
5. Calibrate your pHand EC meters prior totesting (Figure 1g). Thetest results are only as goodas the last calibrations.Calibrate the instrumentsevery day they are used.Always use fresh standardsolutions and never pourused solution back in theoriginal bottle.
6. Test your samples forpH and EC (Figure 1h).Test the leachate as soonas possible. Electricalconductivity will not varymuch over time if there isno evaporation of thesample. However, the pHcan change within twohours. Record the valueson the chart specific toeach crop.
suoiravotylppaotretawfotnuomA.1elbaT.*tcartxefo)secnuo5.1(lm05niatbootsreniatnoc
eziSreniatnoC**ddaotretaW
sretilillim secnuo
hcni4hcni5hcni6
57 5.2
hcni5.6aelaza
001 5.3
trauq1 57 5.2
trauq4 051 0.5
trauq21 053 0.21
stalF
)stnalp63(606)stnalp63(3021)stnalp84(4021
05 0.2
06ot03yticapacreniatnocotthguorbebdluohssreniatnoC*.stnuomaesehtgniylppaerofebsetunim
yravlliwstnuomalautcA.setamitseerastnuomaesehT**.snoitidnoclatnemnorivnedna,epytetartsbus,porcnognidneped
Figure 1e. Collected leachate fortesting.
Figure 1f. Collect 50 ml (1.5ounces) for testing.
Figure 1g. Calibrationstandards for testing.
Figure 1h. Testingleachate samples.

4
TESTING, INTERPRETING , AND MANAGING
SUBSTRATE PH
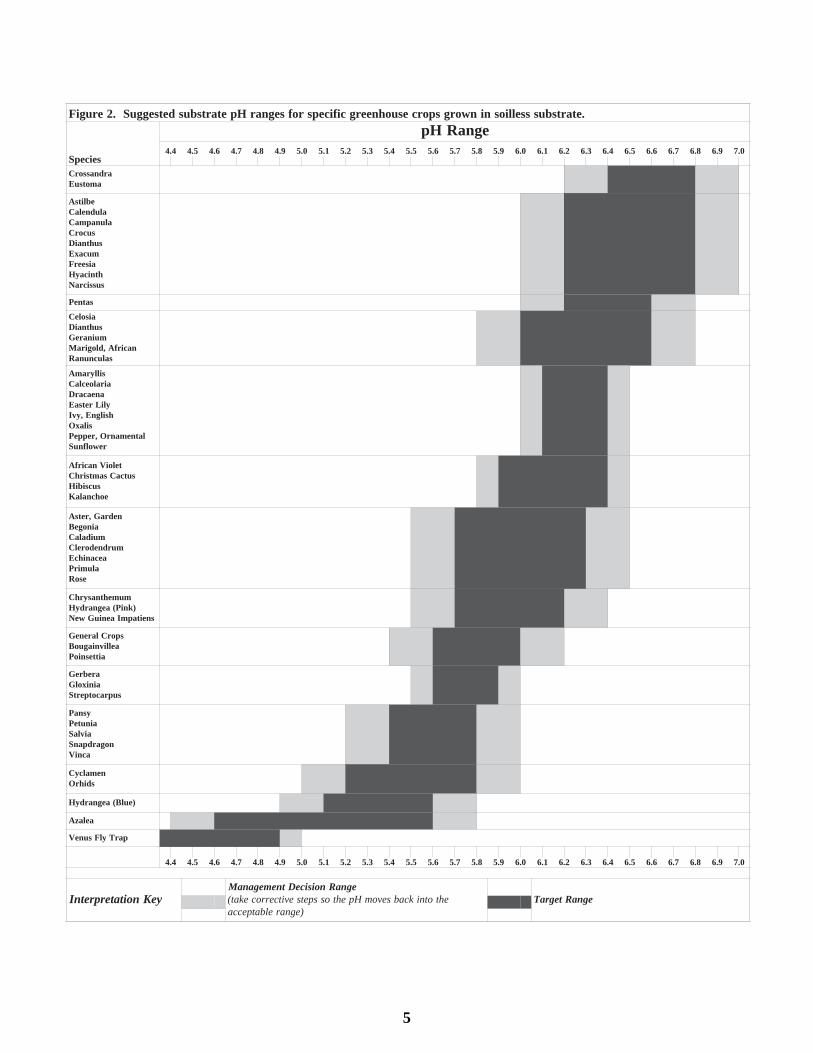
Substrate pH is very important to plant nutritionbecause it directly affects the availability of manynutrients, especially micronutrients. Low pH(below 5.8) can increase micronutrientavailability, such as iron and manganese, that canlead to phytotoxic responses. In contrast, a pHabove 6.8 can lead to micronutrient deficiencyproblems, especially with iron. Both excessivelylow and high pH’s should be avoided. OptimalpH ranges for many crops are listed in Figure 2.
Testing and Interpreting Substrate pHTest substrate pH substrate prior to use and on aroutine basis to assure proper levels. Charts forrecording pH has been included. The target pHrange, high, and low decision ranges should beestablished. If the substrate pH climbs into orabove the high pH decision range, action shouldbe taken to lower pH. If the substrate pH dropsinto or below the lower pH decision range, actionshould be taken to raise pH.
Adjusting Substrate pHSubstrate pH changes over time due to manyfactors. The four main factors affecting substratepH are ¶ the initial components and amendmentsin the substrate, including the liming charge; ·the alkalinity of the irrigation water; ̧ thefertilizer(s); and ¹ the species being grown.Obviously, during production, the species beinggrown or the substrate cannot change, butadjustments to the watering and fertilization can.
Lowering Substrate pH. Listed below (inpreferred order) are immediate steps to take tolower substrate pH:
¶ Switch from a basic (nitrate-based) to acidic(ammonium-based) fertilizer..
· Acidify the irrigation water to an endpoint pHof 5.8z
¸ Apply an iron sulfate (FeSO4·7H
2O) drench
using 3 lb per 100 gallons of water. Mist offthe foliage after application.
¹ Acidify the irrigation water to a pH of 5.1z.
If the substrate pH frequently increases, employthe following steps (listed in preferred order):
¶ Use an acidic (ammonium-based) fertilizerthroughout the cropping period.
· Acidify your irrigation water to pH 5.1.¸ Reduce the initial lime charge or change
substrates.
Increasing Substrate pH. Listed below (inpreferred order) are immediate steps to take toincrease substrate pH:
¶ Stop neutralizing the alkalinity of the irrigationwater (if currently acidifying your water).
· Switch from acidic (ammonium-based) tobasic (nitrate-based) fertilizers.
¸ Apply a flowable limestone drench. Start witha 1 quart per 100 gallons rate. Lightly mist offany solution on the foliage after application.
If the substrate pH frequently decrease, employthe following steps (listed in preferred order):
¶ Use a basic (nitrate-based) fertilizerthroughout the cropping period.
· Inject potassium bicarbonate (KHCO3) into
the irrigation water. Start with 13.4 oz per100 gallons. This supplies 1 meq/L ofalkalinity and 39 ppm K with everywatering (reduce potassium feedaccordingly).
❸ Increase the initial lime charge or changesubstrates.
TESTING, INTERPRETING, AND MANAGING
SUBSTRATE EC
Soluble salts are the total dissolved salts in theroot substrate (medium) and are measured in byelectrical conductivity (EC). A conductivity
5
.etartsbussselliosninworgsporcesuohneergcificepsrofsegnarHpetartsbusdetsegguS.2erugiF
seicepS
egnaRHp4.4 5.4 6.4 7.4 8.4 9.4 0.5 1.5 2.5 3.5 4.5 5.5 6.5 7.5 8.5 9.5 0.6 1.6 2.6 3.6 4.6 5.6 6.6 7.6 8.6 9.6 0.7
ardnassorCamotsuE
eblitsAaludnelaC
alunapmaCsucorC
suhtnaiDmucaxEaiseerF
htnicayHsussicraN
satneP
aisoleCsuhtnaiDmuinareG
nacirfA,dlogiraMsalucnunaR
sillyramAairaloeclaC
aneacarDyliLretsaEhsilgnE,yvI
silaxOlatnemanrO,reppeP
rewolfnuS
teloiVnacirfAsutcaCsamtsirhC
sucsibiHeohcnalaK
nedraG,retsAainogeBmuidalaC
murdnedorelCaecanihcE
alumirPesoR
mumehtnasyrhC)kniP(aegnardyH
sneitapmIaeniuGweN
sporClareneGaellivniaguoB
aittesnioP
arebreGainixolG
supracotpertS
ysnaPainuteP
aivlaSnogardpanS
acniV
nemalcyCsdihrO
)eulB(aegnardyH
aelazA
parTylFsuneV
4.4 5.4 6.4 7.4 8.4 9.4 0.5 1.5 2.5 3.5 4.5 5.5 6.5 7.5 8.5 9.5 0.6 1.6 2.6 3.6 4.6 5.6 6.6 7.6 8.6 9.6 0.7
yeKnoitaterpretnIegnaRnoisiceDtnemeganaM
ehtotnikcabsevomHpehtosspetsevitcerrocekat()egnarelbatpecca
egnaRtegraT
6
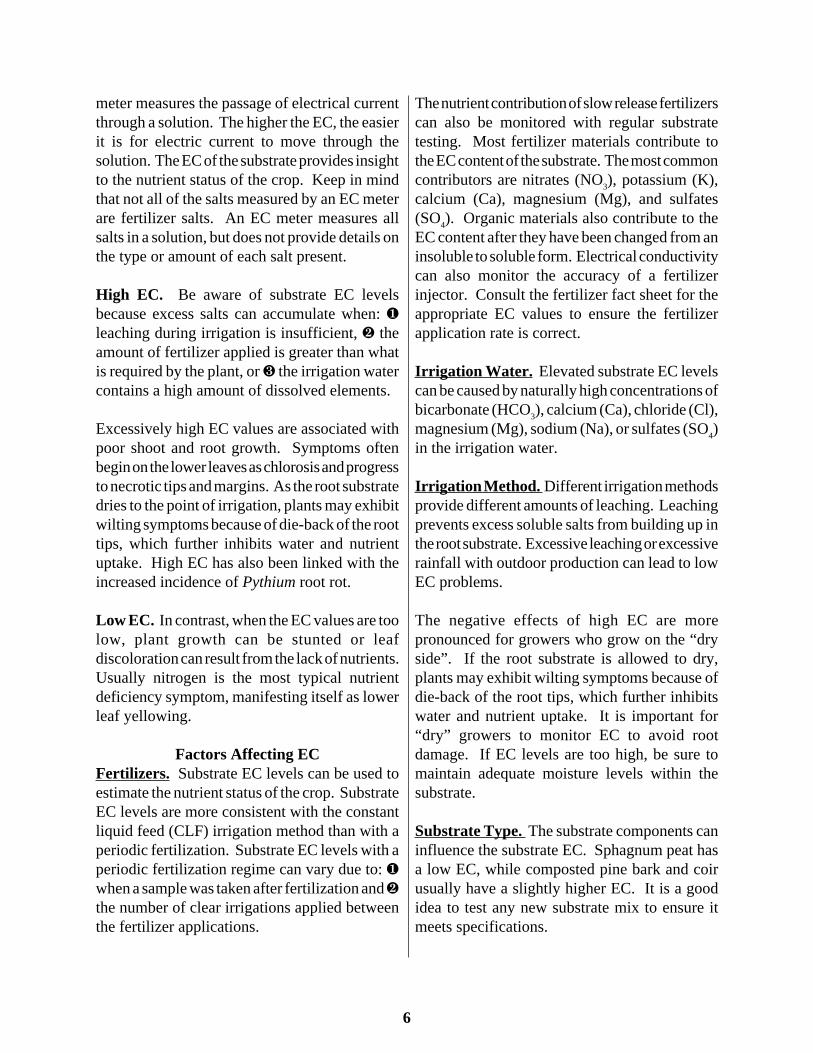
meter measures the passage of electrical currentthrough a solution. The higher the EC, the easierit is for electric current to move through thesolution. The EC of the substrate provides insightto the nutrient status of the crop. Keep in mindthat not all of the salts measured by an EC meterare fertilizer salts. An EC meter measures allsalts in a solution, but does not provide details onthe type or amount of each salt present.
High EC. Be aware of substrate EC levelsbecause excess salts can accumulate when: ¶leaching during irrigation is insufficient, · theamount of fertilizer applied is greater than whatis required by the plant, or ¸ the irrigation watercontains a high amount of dissolved elements.
Excessively high EC values are associated withpoor shoot and root growth. Symptoms oftenbegin on the lower leaves as chlorosis and progressto necrotic tips and margins. As the root substratedries to the point of irrigation, plants may exhibitwilting symptoms because of die-back of the roottips, which further inhibits water and nutrientuptake. High EC has also been linked with theincreased incidence of Pythium root rot.
Low EC. In contrast, when the EC values are toolow, plant growth can be stunted or leafdiscoloration can result from the lack of nutrients.Usually nitrogen is the most typical nutrientdeficiency symptom, manifesting itself as lowerleaf yellowing.
Factors Affecting ECFertilizers. Substrate EC levels can be used toestimate the nutrient status of the crop. SubstrateEC levels are more consistent with the constantliquid feed (CLF) irrigation method than with aperiodic fertilization. Substrate EC levels with aperiodic fertilization regime can vary due to: ¶when a sample was taken after fertilization and ·the number of clear irrigations applied betweenthe fertilizer applications.
The nutrient contribution of slow release fertilizerscan also be monitored with regular substratetesting. Most fertilizer materials contribute tothe EC content of the substrate. The most commoncontributors are nitrates (NO3), potassium (K),calcium (Ca), magnesium (Mg), and sulfates(SO4). Organic materials also contribute to theEC content after they have been changed from aninsoluble to soluble form. Electrical conductivitycan also monitor the accuracy of a fertilizerinjector. Consult the fertilizer fact sheet for theappropriate EC values to ensure the fertilizerapplication rate is correct.
Irrigation Water. Elevated substrate EC levelscan be caused by naturally high concentrations ofbicarbonate (HCO3), calcium (Ca), chloride (Cl),magnesium (Mg), sodium (Na), or sulfates (SO4)in the irrigation water.
Irrigation Method. Different irrigation methodsprovide different amounts of leaching. Leachingprevents excess soluble salts from building up inthe root substrate. Excessive leaching or excessiverainfall with outdoor production can lead to lowEC problems.
The negative effects of high EC are morepronounced for growers who grow on the “dryside”. If the root substrate is allowed to dry,plants may exhibit wilting symptoms because ofdie-back of the root tips, which further inhibitswater and nutrient uptake. It is important for“dry” growers to monitor EC to avoid rootdamage. If EC levels are too high, be sure tomaintain adequate moisture levels within thesubstrate.
Substrate Type. The substrate components caninfluence the substrate EC. Sphagnum peat hasa low EC, while composted pine bark and coirusually have a slightly higher EC. It is a goodidea to test any new substrate mix to ensure itmeets specifications.

7
Crop Factors. When establishing an ECmonitoring and management program, match thefertilizer rate with the nutrient demands of thecrop. There are two main parameters whichshould be considered:
¶ Nutrient Demands. Crops vary in theirfertility requirements for optimal growth. Somecrops such as poinsettias and chrysanthemumsare “heavy feeders” and require high fertilizer
rates. Others like geraniums are “moderatefeeders”, while “light feeders” like pansies andNew Guinea impatiens require low nutrient levels.Optimal EC levels are listed for many crops inTable 2.
· Crop Development Stage. The nutrientdemands of a crop vary by development stage.Plugs and rooting cuttings require low levels offertility and nutrient demands increase as plants
htobrofsegnarCEhtiw,sporcesuohneerggniworgylevitcafostnemeriuqertneirtunevitalerehT.2elbaTrof3erugiFnidedivorpselpmaxeehtdnametsysnoitacifissalcsihtesU.sdohtemurhTruoPdnaEMSeht
.elcycnoitcudorpporceritneehtrofsegnarCEtegratdetseggusehtenimretedotdohtemurhTruoPeht
deriuqeRrezilitreFlanoitiddAoNmuideM
)mc/Sm0.3ot5.1foCEEMS()mc/Sm5.3ot0.2foCEurhTruoP(
sillyramAsucorC
sussicraN
airemeortslAmussylA
aellivniaguoBaludnelaCalunapmaC
samtsirhC,sutcaCnoitanraC
rewolfiluaCaeruatneC
emoelCmurdnedorelC
ardnassorCailhaD
suhtnaiDrelliMytsuD
mucaxE)gnittuc(muinareG
sucsibiHaegnardyH
yrrehCmelasureJ
eohcnalaKrupskraL
latneirO&citaisA,yliLretsaE,yliL
aileboLyrolGgninroM
noinOelaKlatnemanrO
reppePlatnemanrOsilaxOreppePainuteP
xolhPnodocytalP
acalutroPsulucnunaR
esoR)dettop(rewolfnuS
otamoTanebreV
thgiL)mc/Sm0.2ot67.0foCEEMS(
)mc/Sm6.2ot0.1foCEurhTruoP(
mutinocAteloiVnacirfA
mutaregAenomenA
sohtnazoginAsaipelcsA
retsAeblitsAaelazAmaslaB
)suorbif(ainogeB)silameiH(ainogeB
)xeR(ainogeB)suorebuT(ainogeB
muidalaCairaloeclaC
yliLallaCaisoleC
airareniC
sueloCsomsoC
)gnitoorgnirud(sgnittuCnemalcyC
aiseerF)dees(muinareG
arebreGainixolGsneitapmI
dlogiraMsneitapmIaeniuGweN
sdihcrOysnaPsgulP
alumirPaivlaS
supracotpertSnogardpanS
ainniZ
yvaeH)mc/Sm5.3ot0.2foCEEMS(
)mc/Sm6.4ot6.2foCEurhtruoP(
mumehtnasyrhCaittesnioP
:morfdetpadA.903.pp.sserPnamyHniwnU.stnalpnworg-reniatnocrofseximdnaaideM.8891.C.A,tnuB
.559-159:211.icS.troH.coS.remA.J.ytinilasotslaunnagnirewolffoesnopserlacigolohproM.7891.sirroM.L.Rdna.A.D,ttiveD.llaHecitnerP.seicepsdnaselpicnirperutlucirolF.9991.snikliW.Hdna.J,eloD
.71-41:tpeS.reworGesuohneerG?seisnapruoygnilkcipuoyerA.7891.hcsakuW.Rdna.G,artsfoH.LI,aivataB,.lbuPllaB.sporcesuohneergrofnoitirtundna,aidem,retaW.deeR.W.D:nI.071-141.p,smargorprezilitreftneirtunorcaM.6991.V.P,nosleN
.74-54,43-03.p.koobdnaHtnemeganaMesuohneerGsaxeT.HpdnaaidemgniworgssellioS.C.D,noarekliW

8
gniworg
ruoyno
desabeda
meb
dluohsstne
mtsujdadna
senilediugera
seulaveseh
T.etartsbus
sselliosni
nworg
sporclarutlucirolf
rofsegnar
CE
urhTruo
Petartsbus
detsegguS.3
erugiF
.secitcarp
yrogetaC
egatSht
worG
)mc/S
m(egna
RC
E5.0
6.07.0
8.09.0
0.11.1
2.13.1
4.15.1
6.17.1
8.19.1
0.21.2
2.23.2
4.25.2
6.27.2
8.29.2
0.31.3
2.33.3
4.35.3
6.37.3
8.39.3
0.41.4
2.43.4
4.45.4
6.4
thgiL
)stnalP
gniddeB(
)2&1
segats(sgul
P
)4&3
segats(sgul
P
gnihsilbatsE
gniwor
G
)mool
B(gnihsini
F
5.06.0
7.08.0
9.00.1
1.12.1
3.14.1
5.16.1
7.18.1
9.10.2
1.22.2
3.24.2
5.26.2
7.28.2
9.20.3
1.32.3
3.34.3
5.36.3
7.38.3
9.30.4
1.42.4
3.44.4
5.46.4
etaredoM
,muinare
G()lano
Z
gnihsilbatsE
gniwor
G
)mool
B(gnihsini
F
5.06.0
7.08.0
9.00.1
1.12.1
3.14.1
5.16.1
7.18.1
9.10.2
1.22.2
3.24.2
5.26.2
7.28.2
9.20.3
1.32.3
3.34.3
5.36.3
7.38.3
9.30.4
1.42.4
3.44.4
5.46.4
yvaeH
)aittesnioP(
gnihsilbatsE
gniwor
G
)mool
B(gnihsini
F
5.06.0
7.08.0
9.00.1
1.12.1
3.14.1
5.16.1
7.18.1
9.10.2
1.22.2
3.24.2
5.26.2
7.28.2
9.20.3
1.32.3
3.34.3
5.36.3
7.38.3
9.30.4
1.42.4
3.44.4
5.46.4
yeK
noitaterpretnIegna
Rnoisice
Dtne
meganaM
)egnartegrat
ehtotni
kcabC
Eeht
evom
otspets
evitcerrocekat(
egnaR
CE
tegraT

9
become established. Actively growing plantshave the highest nutrient demands, but demandsdecrease as a plants sets buds and flowers. Infact, research has shown that flower longevity isincreased when fertilizer rates are decreased orterminated at visible bud or just prior to floweringfor most crops.
An EC monitoring and managing plan should beadapted to account for the crop’s nutrient demandsand stage of development. Figure 3 contains thetarget EC levels for establishment, active growth,and bloom stages of growth for plants using thePourThru extraction method. Table 3 containsinterpretative EC values for the 1:5, 1:2, saturatedmedia extract (SME), and PourThru extractionprocedures.
Testing and Interpreting Substrate ECElectrical conductivity charts have beendeveloped for recording values obtained with thePourThru extraction method. The target ECrange for the active growth phase of the crop hasbeen added. During the first 2 weeks aftertransplanting, gradually increase the substrateEC to the target level. Use the EC values listed
in Figure 2 during the plant establishment phaseas a guideline. Also as the crop blooms, graduallydecrease the EC levels. EC values for the finishingstage are also listed in Figure 3.
If the substrate EC rises into or above the upperEC decision range, action should be taken toreduce EC. If the substrate EC drops into orbelow the lower EC decision range, action shouldbe taken to increase EC.
Adjusting Substrate ECThe substrate EC changes over time due to manyfactors. The four main factors are: ¶ the initialcomponents and amendments in the substrate,including the substrate type and initial nutrientcharge, · fertility regime, ̧ the crop’s nutrientdemands, and ¹ the crop’s development stage.During production the species being grown or thesubstrate composition cannot change, butadjustments to the fertilization program can.
Steps to Lower EC. Listed below (in preferredorder) are immediate steps to take to lowersubstrate EC:
sdohtemnoitcartxesuoiravrof)mc/Sm(seulavnoitaterpretniCE.3elbaT 1.
5:1 2:1 EMS urhTruoP 2 noitacidnI
11.0ot0 52.0ot0 57.0ot0 0.1ot0.woLyreV niatsusottneiciffusebtonyamsleveltneirtuN
.htworgdipar
53.0ot21.0 57.0ot62.0 0.2ot67.0 6.2ot0.1.woL tlasdnastnalpgniddeb,sgnildeesrofelbatiuS
.stnalpevitisnes
56.0ot63.0 52.1ot67.0 5.3ot0.2 6.4ot6.2.lamroN dehsilbatsetsomrofegnarenoztoordradnatS
.stnalpevitisnestlasrofegnarreppU.stnalp
98.0ot66.0 57.1ot62.1 0.5ot5.3 5.6ot6.4.hgiH ylralucitrap,tluseryamhtworgdnarogivdecudeR
.rehtaewtohgnirud
01.1ot9.0 52.2ot67.1 0.6ot0.5 8.7ot6.6.hgiHyreV retawdecuderoteudyrujnitlasnitluseryaM
edulcnismotpmyS.ylekilsetarhtworgdecudeR.ekatpu.gnitliwdnanrubfaellanigram
1.1> 52.2> 0.6> 8.7>.emertxE .slevelesehttayrujnitlasreffuslliwsporctsoM
.deriuqergnihcaeletaidemmI
1 .erutlucirgAfoyrtsiniMaibmuloChsitirB.6991.retawnoitagirridnaaidemgniworgfognitsetetis-nO:morfdetpadA2 hsilbatseotdohtemEMSehtotstluserriehterapmocsyawladluohssreworg,stlusereuqinhceturhTruoPehtfoytilibairavehtoteuD
.segnarelbatpecca
10
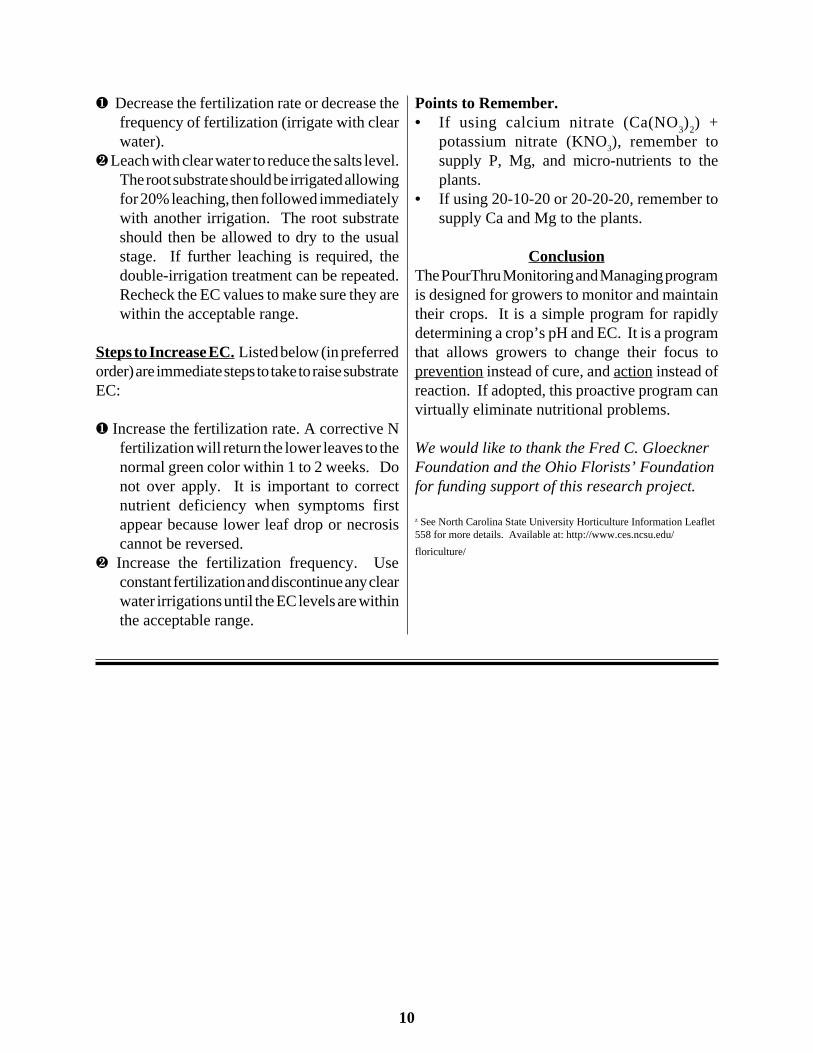
¶ Decrease the fertilization rate or decrease thefrequency of fertilization (irrigate with clearwater).
· Leach with clear water to reduce the salts level.The root substrate should be irrigated allowingfor 20% leaching, then followed immediatelywith another irrigation. The root substrateshould then be allowed to dry to the usualstage. If further leaching is required, thedouble-irrigation treatment can be repeated.Recheck the EC values to make sure they arewithin the acceptable range.
Steps to Increase EC. Listed below (in preferredorder) are immediate steps to take to raise substrateEC:
¶ Increase the fertilization rate. A corrective Nfertilization will return the lower leaves to thenormal green color within 1 to 2 weeks. Donot over apply. It is important to correctnutrient deficiency when symptoms firstappear because lower leaf drop or necrosiscannot be reversed.
· Increase the fertilization frequency. Useconstant fertilization and discontinue any clearwater irrigations until the EC levels are withinthe acceptable range.
Points to Remember.• If using calcium nitrate (Ca(NO
3)
2) +
potassium nitrate (KNO3), remember tosupply P, Mg, and micro-nutrients to theplants.
• If using 20-10-20 or 20-20-20, remember tosupply Ca and Mg to the plants.
ConclusionThe PourThru Monitoring and Managing programis designed for growers to monitor and maintaintheir crops. It is a simple program for rapidlydetermining a crop’s pH and EC. It is a programthat allows growers to change their focus toprevention instead of cure, and action instead ofreaction. If adopted, this proactive program canvirtually eliminate nutritional problems.
We would like to thank the Fred C. GloecknerFoundation and the Ohio Florists’ Foundationfor funding support of this research project.
z See North Carolina State University Horticulture Information Leaflet558 for more details. Available at: http://www.ces.ncsu.edu/
floriculture/

11
4.2
4.4
8.0
7.6
7.2
6.8
6.4
6.0
5.6
5.2
4.8
Wee
k
01
23
45
67
89
1011
1213
1415
1617
1819
2021
Cro
p _
____
____
____
____
____
____
____
Targ
et p
H R
ange
___
____
Sta
rtin
g D
ate
(wee
k 0)
___
____
_U
pper
pH
Dec
isio
n R
ange
____
_
End
ing
Dat
e __
____
____
_Lo
wer
pH
Dec
isio
n R
ange
____
_
4.6
5.8
5.0
5.4
6.2
6.6
7.0
7.4
7.8
4.0
pH
Pou
rThr
u pH
Cha
rt(2
1 W
eeks
)

12
Wee
k
12
34
56
78
910
Cro
p _
____
____
____
____
____
____
____
Targ
et p
H R
ange
___
____
Sta
rtin
g D
ate
(wee
k 0)
___
____
_U
pper
pH
Dec
isio
n R
ange
____
_
End
ing
Dat
e __
____
____
_Lo
wer
pH
Dec
isio
n R
ange
____
_
4.2
4.4
8.0
7.6
7.2
6.8
6.4
6.0
5.6
5.2
4.8
0
4.6
5.8
5.0
5.4
6.2
6.6
7.0
7.4
7.8
4.0
pH
Pou
rThr
u pH
Cha
rt(1
0 W
eeks
)

13
4.2
4.4
8.0
7.6
7.2
6.8
6.4
6.0
5.6
5.2
4.8
Day
03
69
1215
1821
2427
3033
3639
4248
5154
5760
63
Cro
p _
____
____
____
____
____
____
____
Targ
et p
H R
ange
___
____
Sta
rtin
g D
ate
(wee
k 0)
___
____
_U
pper
pH
Dec
isio
n R
ange
____
_
End
ing
Dat
e __
____
____
_Lo
wer
pH
Dec
isio
n R
ange
____
_
4.6
5.8
5.0
5.4
6.2
6.6
7.0
7.4
7.8
4.0
pH
45
Pou
rThr
u pH
Cha
rt(6
3 D
ays)

14
1.75
2.00
6.50
6.00
5.50
5.00
4.50
4.00
3.50
3.00
2.50
Wee
k
01
23
45
67
89
1011
1213
1415
1617
1819
2021
Cro
p _
____
____
____
____
____
____
____
Targ
et E
C R
ange
___
____
Sta
rtin
g D
ate
(wee
k 0)
___
____
_U
pper
EC
Dec
isio
n R
ange
____
_
End
ing
Dat
e __
____
____
_Lo
wer
EC
Dec
isio
n R
ange
____
_
2.25
3.75
2.75
3.25
4.25
4.75
5.25
5.75
6.25
1.50EC
(mS
/cm
)
Pou
rThr
u E
C C
hart
(21
Wee
ks)

15
Wee
k
12
34
56
78
910
Cro
p _
____
____
____
____
____
____
____
Targ
et E
C R
ange
___
____
Sta
rtin
g D
ate
(wee
k 0)
___
____
_U
pper
EC
Dec
isio
n R
ange
____
_
End
ing
Dat
e __
____
____
_Lo
wer
EC
Dec
isio
n R
ange
____
_
1.75
2.00
6.50
6.00
5.50
5.00
4.50
4.00
3.50
3.00
2.50
0
2.25
3.75
2.75
3.25
4.25
4.75
5.25
5.75
6.25
1.50EC
(mS
/cm
)
Pou
rThr
u E
C C
hart
(10
Wee
ks)

16
0.20
0.40
4.00
3.60
3.20
2.80
2.40
2.00
1.60
1.20
0.80
Day
03
69
1215
1821
2427
3033
3639
4248
5154
5760
63
Cro
p _
____
____
____
____
____
____
____
Targ
et E
C R
ange
___
____
Sta
rtin
g D
ate
(wee
k 0)
___
____
_U
pper
EC
Dec
isio
n R
ange
____
_
End
ing
Dat
e __
____
____
_Lo
wer
EC
Dec
isio
n R
ange
____
_
0.60
1.80
1.00
1.40
2.20
2.60
3.00
3.40
3.80
0.00EC
(mS
/cm
)
45
Pou
rThr
u E
C C
hart
(63
Day
s)

17
:porC _______________
:etaD _______________
:noitacoL ____________
selpmaSlmdedda tuolm Hp CE stnemmoC
1
2
3
4
5
6
7
8
9
01
egarevA
:porC _______________
:etaD _______________
:noitacoL ____________
selpmaSlmdedda tuolm Hp CE stnemmoC
1
2
3
4
5
6
7
8
9
01
egarevA
Sampling Form