portfolio optimization - salient management company management company 4 • again owing to its...
TRANSCRIPT

Portfolio OptimizationFrom Periodic Rationalization to Continuous Improvement
Salient Management Company 2
A significant portion of the average fast-moving consumer goods (FMCG) company’s product portfolio consists of low-performing products that contribute a negligible amount to total sales. Identifying and decommissioning these nonperforming and underperforming stock keeping units (SKUs) represents a clear opportunity to improve overall portfolio performance. Companies seeking to capitalize on this opportunity often turn to periodic SKU rationalization projects, led either by centralized staff or management consultants.
In this paper, we demonstrate the benefits of an alternate approach to the common practice of periodic, centralized SKU rationalization: continuous evaluation of SKU performance by managers at all levels of the organization. We address the apparent obstacles of integrating this continuous approach into a company’s standard operating procedures. Finally, to demonstrate the practicality and business impact of implementing our proposed approach, we illustrate the application of a technology platform purpose-built for continuous business process monitoring and improvement to this task.
Summary
Portfolio Optimization
Salient Management Company 3
Since 2005, the number of SKUs in the typical FMCG company's product portfolio has tripled. For some of these companies, up to 40% of their portfolio consists of low performing products whose cumulative contribution to total sales averages less than 3.0%.
These products strain distribution efforts, fragment the focus of the sales organization, consume operational resources, and tax relationships with suppliers and customers alike. These unproductive products consume margin both directly through the discounts required to keep them afloat in the market, and indirectly through the marketing and merchandising efforts expended in attempting to draw consumer attention to these failing products.
*Tamarron Consulting 2014 Malt Beverage Supply Chain Performance Survey http://www.tamarronconsulting.com/PerformanceSurveys/SupplyChain/
** Tata Consulting Services SKU Rationalization: A Technique for Inventory Optimization in the Retail Sector http://www.tcs.com/SiteCollectionDocuments/White%20Papers/Retail_Whitepaper_SKU-Rationalization-Technique-Inventory-Optimization-Retail-Sector_0312-1.pdf
The Problem SKU Rationalization: A flawed solution
The portfolio management technique known as SKU rationalization attempts to address the issue of non-performing SKUs and to optimize assortments by decommissioning some of the non-productive merchandise. SKU rationalization is well known and widely acknowledged as a best practice, as evidenced by the number of business consultancies offering it as a service. Many organizations undertake SKU rationalization on a periodic basis, led by portfolio managers at the corporate office level or by external consultants on a project engagement basis.
Its prevalence in the FMCG industry notwithstanding, SKU rationalization has several inherent flaws that limit its effectiveness as a portfolio management technique. In particular, SKU rationalization presents the following pitfalls:
• As a typically centralized process performed by corporate office staff or external consultants, SKU rationalization may not adequately account for conditions
“on the ground” familiar to the line management (category managers, route managers, account managers, etc.) who are closest to the customer. Without this information, the rationalization exercise may miss potential candidates for decommissioning or, alternately, mistakenly discontinue products that—while appearing at an aggregate level to warrant decommissioning—play a crucial role in particular markets or accounts.
Portfolio Optimization

Salient Management Company 4
• Again owing to its centralized nature, a typical SKU rationalization process represents a resource-intensive, high-overhead exercise. Not only must portfolio managers sort through voluminous data from the period of performance under examination, but once they have identified decommissioning candidates a ponderous change management process comes into play requiring buy-in from various stakeholders at all levels of the organization.
• The volumes of data involved in centrally examining the performance of every SKU in the organization may lead to rationalization decisions being taken on the basis of incomplete or inappropriate information. Many FMCG organizations, struggling to manage portfolios with tools no more sophisticated than top-line aggregate reports, actually use volume as the starting point for analysis despite the fact that volume does not equate to financial performance.
• Finally, a periodic SKU rationalization exercise cannot respond nimbly to the rapidly changing conditions of the marketplace. Since the impact of underperforming products is cumulative, deferring action on poor performers until the next periodic SKU rationalization presents a clear opportunity cost with a very real impact on the organization’s bottom line.
Continuous Portfolio Optimization: A superior solution
From the flaws we have identified in the typical SKU rationalization process, a picture emerges of a new and better way to manage portfolios. Rather than centralized and top-down, this new way would democratize decision making, pushing the task of SKU evaluation out to the largest possible community of decision makers—those closest to the customer and most conscious of market conditions. Rather than a high-overhead project repeated periodically, the new way would collapse the process to a minimum level of time and effort and embed it in daily business processes.
In short, we propose here a continuous approach to portfolio optimization that is embedded in FMCG’s daily business processes. Central to such an approach is the ability for decision makers at all levels of the organization to monitor the financial productivity (not just volume or gross sales revenue) of each SKU in their portfolio and to take appropriate action. While a sales representative or regional manager may not have the authority to decommission SKUs, such managers can optimize the assortments of products actually stocked on their shelves or trucks and thus offered to the customer—all based on reliable data that is highly relevant to their own discrete business environments. As a consequence of this
Portfolio Optimization

Salient Management Company 5
optimization at the level closest to the customer, a truer picture of SKU performance and decommissioning candidates will emerge for the higher level category and portfolio managers.
We acknowledge that the obstacles to such an approach are as obvious as the benefits. In order to induce decision makers at the customer-facing level to make portfolio decisions based on data, the data must be made available to them in a reliable, timely, and easy-to-use manner. They must be able to obtain SKU performance data at a glance and also dive deeper into the details so they can predict the results of making a change in their offerings. For FMCG companies that rely on infrequently generated static reports to monitor SKU performance, this embedded and continuous approach may be out of reach. But by embedding a technology platform that democratizes access to actual performance data, putting it within reach of those decision makers who have the greatest insight into consumer behavior and whose decisions can have immediate and measurable impact, FMCG companies can take their portfolio management approach from “good” to “great.”
Portfolio Optimization

Salient Management Company 6
From Periodic Rationalization to Continuous Improvement: A Framework
What would such a continuous portfolio optimization approach look like in practice? We conclude by outlining a suggested approach that begins with periodic rationalization—albeit a more sophisticated version that employs data more truly indicative of SKU productivity—and moves into the ideal state of continuous monitoring and optimization.
Portfolio rationalization begins by understanding the relationship of each SKU and its contribution to the overall performance of the portfolio. As noted earlier, many organizations use volume as the starting
This chart illustrates a simple ranking by the volume contribution of each product, ranked highest to lowest. Any metric can be selected to quickly rank product productivity and contribution.
point for analysis because of the common focus on growing market share. However, focusing solely on volume fails to provide a clear understanding of the impact any change will have on the financial performance of the organization. Therefore, an effective analytical platform will allow decision-makers to perform this analysis using any metric or combination of metrics--including margin--so that the impact can be understood from multiple perspectives and the approach to SKU rationalization can improve without changing the technology as the organization's approach matures.
Portfolio Optimization
Salient Management Company 7
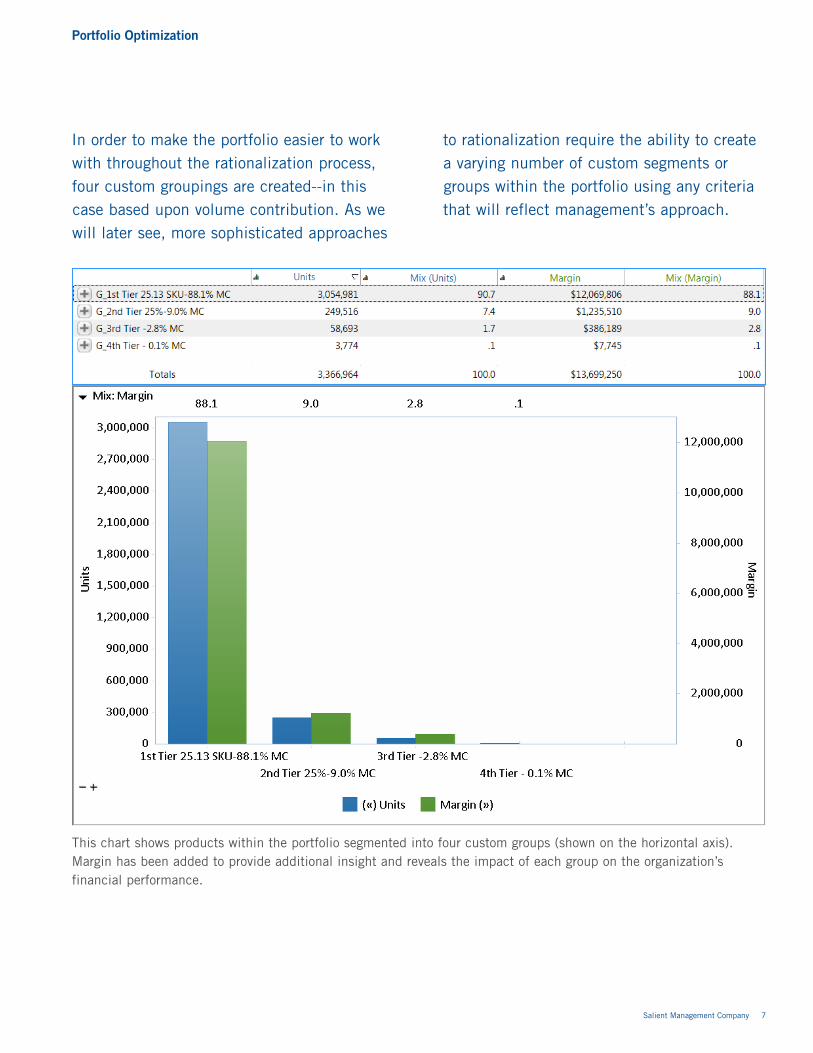
In order to make the portfolio easier to work with throughout the rationalization process, four custom groupings are created--in this case based upon volume contribution. As we will later see, more sophisticated approaches
This chart shows products within the portfolio segmented into four custom groups (shown on the horizontal axis). Margin has been added to provide additional insight and reveals the impact of each group on the organization’s financial performance.
to rationalization require the ability to create a varying number of custom segments or groups within the portfolio using any criteria that will reflect management’s approach.
Portfolio Optimization

Salient Management Company 8
This chart shows the cumulative contribution of each group, reinforcing that this is a portfolio in need of deeper analysis and rationalization.
A deeper analysis of margin reveals a pattern that is commonly seen when analyzing underperforming portfolios: few products are highly productive while most contribute little. The 3rd and 4th Groups — which account for
50% of all products — contribute only 2.1% of overall volume and 2.8% of total margin. Products within these groups are definite candidates for SKU rationalization.
Portfolio Optimization

Salient Management Company 9
This analysis further illustrates the exact negative impact of these products (often referred to as the ‘drag effect’ of unproductive products) and can be drilled into to show each individual product and all of its transactions. In this case, these two groups have reduced total margin by $45,000 during the past year.
This chart illustrates the marginal contribution percentage for each group. It reveals the marginal return for total sales and its relative contribution between each group. This means that four cases of a Group 4 product must be sold to generate the same marginal contribution that only one case of a Group 1 product will generate when sold. Overall margin can be dynamically increased by influencing product mix, shifting units sold from low margin products to those that generate significantly greater margin.
Portfolio Optimization

Salient Management Company 10
This chart illustrates the marginal contribution percentage for each group. It reveals the marginal return for total sales and its relative contribution between each group. This means that four cases of a Group 4 product must be sold to generate the same marginal contribution that only one case of a Group 1 product will generate when sold. Overall margin can be dynamically increased by influencing product mix, shifting units sold from low margin products to those that generate significantly greater margin.
Portfolio Optimization

Salient Management Company 11
This final tabular list shows which products should be rationalized based upon both their performance and their lack of adoption by consumers. A custom group can be made from these products to facilitate easy management of them in the future.
Prior to discontinuing any particular product it is important to clearly understand how many customers are currently purchasing these products. This requires more than summary information; it requires a count of the total market penetration of each product (often called its 'points of distribution') combined with the ability to drill down to transactional-level detail that reveals potential problems. This will allow management to consider additional factors, such as:
• Looking at product performance from the customer’s perspective
• Understanding which products support their banner strategy
• Identifying products that are mandated by key accounts, suppliers or distributors
• Blocking competitor products
The ability to seamlessly flow from one analysis to another while retaining custom groups allows the decision-maker to continue to winnow down products within Groups 3 and 4 to only valid candidates.
Once the final list of products to be decommissioned is decided upon it is necessary—and certainly most convenient—to create additional custom groupings of these products so that the final list of products for rationalization can be seen, acted upon and managed on a continuous basis.
Red Grapefruit is a flavor only bought by 2% of all
active customers.
Portfolio Optimization

Salient Management Company 12
The periodic analysis of a portfolio allows an organization to uncover likely products for rationalization, and to gather much needed insight into what is driving its volume, revenue and margin. However, this process of analysis can be automated by setting criteria that automatically identified underperforming products--defined by any number of criteria management chooses--to create a list of the most likely candidates for decommission.
The ideal analytical platform would allow users to define criteria that will create a custom
group of dynamically changing products. This allows the organization to reflect the way management thinks so that specific questions can be automated to identify potential problems or opportunities that can be used in many ways.
This automated short list of underperforming products can then be visualized to compare the original product portfolio to verify and quantify the impact that decommissioning some or all of these products would have on margin, volume or any other metric.
From $4.97 Unit Margin
Original Portfolio Rationalized Portfolio
To $5.32 Unit Margin (an increase of $.35 per case)
This chart shows the resulting increase in Unit Margin that would be realized if the selected products were decommissioned.
Portfolio Optimization

Salient Management Company 13
Continuous Portfolio Segmentation and Analysis
The ideal approach to managing a portfolio combines a strategic perspective on what role in the market each brand, product or package plays for a company, with an analytical process that creates actionable intelligence which, when acted upon, will create a positive financial impact. For this to be possible, the entire organization, from the portfolio managers who often reside in the corporate office to chain, chain or account managers that often improve distribution while out on the road, must be acting upon information delivered by technology that can meet these broad and diverse needs.
In order to accomplish this ideal approach, decision-makers must be provided with the ability to quickly review portfolio performance by product, brand, or package using any metrics, to expose under-performing SKUs, while also allowing for the creation of custom product groupings that can reflect consumer preferences, the market’s perspective or management’s strategic plan. This removes the traditional limits on how management can see, understand and act upon information by removing the reliance upon relationships that exist within the data itself. This information is then delivered to users via an interface that best meets their needs and level of analytical capabilities--from complex to simple dashboards.
CA
A. Products mandated by supplier or retailer restrictions
B. Core brands that must be sold
C. Products of significant strategic value
D. Poor performing products that must be retained for competitive reasons
B
D
Core Brands
Strategic Products
Competitive Products
Mandatory Products
All Others
This more sophisticated and continuous approach to portfolio management takes into account that not all products compete with each other—package, flavor and even brand attributes create sub-segments within the portfolio that compete for consumer attention based upon buying preferences, intended use and purchase occasion. Custom groupings of products within each of these sub-segments allows goals and action plans to be set that are based upon a more nuanced and finely tuned strategy on how management will penetrate the market and the role each product will play.
Portfolio Optimization
Salient Management Company 14
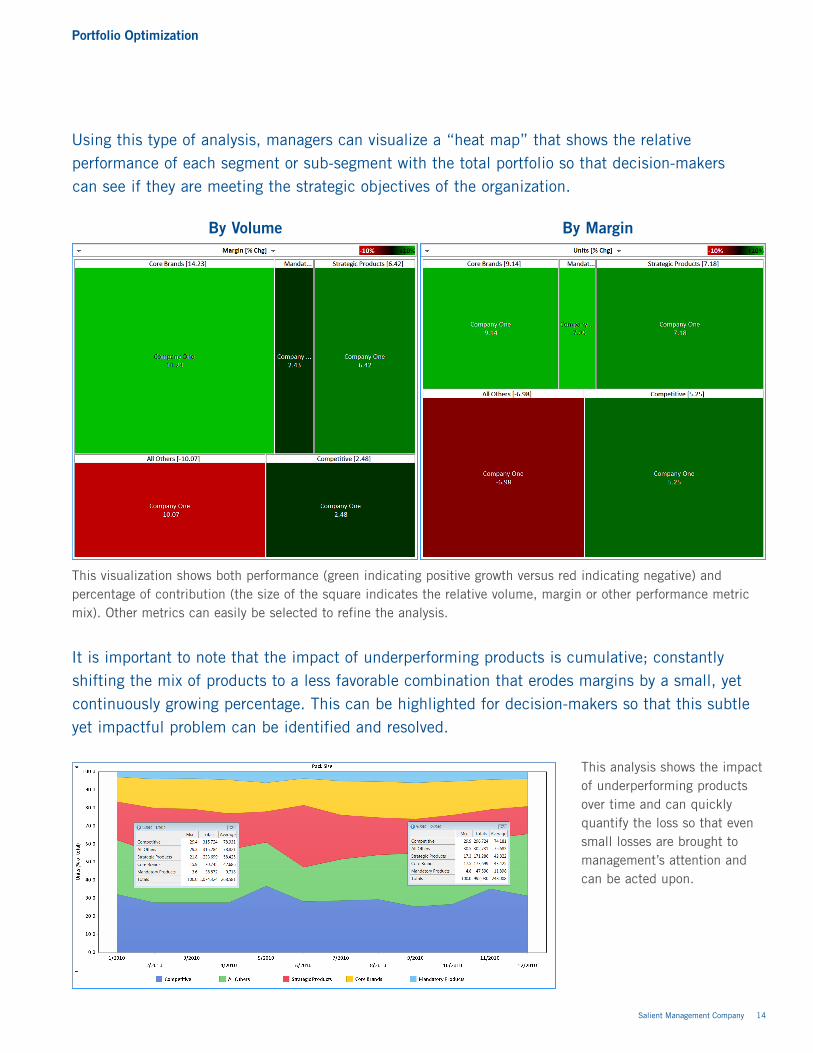
Using this type of analysis, managers can visualize a “heat map” that shows the relative performance of each segment or sub-segment with the total portfolio so that decision-makers can see if they are meeting the strategic objectives of the organization.
By Volume By Margin
This visualization shows both performance (green indicating positive growth versus red indicating negative) and percentage of contribution (the size of the square indicates the relative volume, margin or other performance metric mix). Other metrics can easily be selected to refine the analysis.
This analysis shows the impact of underperforming products over time and can quickly quantify the loss so that even small losses are brought to management’s attention and can be acted upon.
It is important to note that the impact of underperforming products is cumulative; constantly shifting the mix of products to a less favorable combination that erodes margins by a small, yet continuously growing percentage. This can be highlighted for decision-makers so that this subtle yet impactful problem can be identified and resolved.
Portfolio Optimization

Salient Management Company 15
Within each group, individual brands, products or packages can be selected and analyzed to determine if they are at the early stages in their lifecycle and require additional marketing or distribution support from channel, chain and account managers, or at the end, and should be rationalized. By allowing management to quickly see a product lifecycle analysis, makes knowing
when additional investment is warranted or would simply be wasted. Employees within the field can then be directed on which products to push and which to introduce substitutions for. This closes the loop and allows meaningful action to be taken that will result in a positive financial impact for the organization.
This test instantly illustrates buying behavior over a period of 12 months. In this graph, only 7.2% of customers are buying products from the Mandatory Group, but they are dropping them. This buying behavior could signal an erosion, or consolidation in a few customers.
Portfolio Optimization

Salient Management Company 16
Improvement Isn’t a One-time EventOnce this rationalization process takes hold, it will be used iteratively to monitor and maximize the performance of the portfolio over time. New products, some of them having sales and promotional support to penetrate the market, will influence the portfolio and require additional changes, eventually displacing other products or being rationalized themselves.
Portfolio management and the SKU rationalization process can be enhanced to further improve overall performance by using an even more sophisticated approach that factors consumer behavior and market demand into the rationalization process. This is called Occasion-based Segmentation and Rationalization.
Occasion-based Segmentation and RationalizationConsumer behavior—which brands and packages customers prefer to purchase for which occasions—influences the ideal mix of products sold through specific accounts, channels and chains, and even specific account locations. This change in mix will influence product performance and therefore the portfolio itself.
Products can be grouped into collections that reflect this consumer behavior. This allows management to marry portfolio management with their strategic efforts to more effectively penetrate the market by offering the right products through the right outlets. Without this analytical capability to create collections that mirror unusual groupings, such as consumer buying behaviors, management would be unable to see the impact of their strategic efforts on bottom-line results.
Portfolio Optimization

©2015 Salient CorporationSalient Management Company 203 Colonial Drive, Horseheads, NY 14845 USA phone 607.739.4511 / 800.447.1868 fax 607.739.4045 www.salient.com
SALIENT MANAGEMENT COMPANY
Want to learn more? Speak with our experts
Eduardo GamboaEduardo is a results-driven sales strategist with demonstrated success in revenue management performance and pricing optimization. A 21-year veteran in the PepsiCo system, he brings “business wise” solutions to boost profitable performance and empower managers to optimize results continuously.
David Giannetto David is a nationally respected thought-leader in the areas of business intelligence, enterprise performance management, information management and analytics. He is the author of Big Social Mobile and the award-winning The Performance Power Grid, which has become one of the leading EPM methodologies. He has been listed as a thought-leader by the AMA, Consumer Goods Technology and Business Finance Magazine and is widely acknowledged as one of today’s most experienced practitioners.