port authority ny nj master budget 2009
TRANSCRIPT

2009 Budget
December 17, 2008

2
TABLE OF CONTENTS MESSAGE FROM THE CHAIRMAN AND EXECUTIVE DIRECTOR………….. 3 BUDGET SUMMARY…………………………………….…………………...……. 5 BUDGET SUMMARY BY DEPARTMENT…………………………….………… 13 THE CHALLENGES AHEAD……………………….……………………………. 31
Downward Pressure on Revenue …………………………………………….. 31 Upward Pressure on Costs…………………………………………………….. 34 Infrastructure Challenge……………………………………………………….. 34
2009 BUDGET DOCUMENTS 2009 Operating Budget 2009 Capital Budget APPENDIX A: AGENCY OVERVIEW APPENDIX B: PLANNING PROCESS AND FINANCIAL POLICIES APPENDIX C: GOALS, OBJECTIVES, MEASURES APPENDIX D: GLOSSARY

2009Budget
Summary

3
MESSAGE FROM THE CHAIRMAN AND EXECUTIVE DIRECTOR Dear Governors, We respectfully present the 2009 Budget of The Port Authority of New York and New Jersey. The pages that follow describe a $6.7 billion budget that reflects three primary themes: First, robust investment on the capital side of the budget. To help buffer the economic crisis and address the region’s infrastructure challenges, our 2009 Budget includes the highest level of capital spending in the agency’s history – $3.3 billion, an increase of $725 million or 28% over last year. This spending is critical for the region. It will help create jobs, stimulate the region’s economy, and build the essential infrastructure for our region’s continued growth and economic competitiveness. Second, fiscal discipline on the operating side of the budget. In order to make way for record capital investment, the Port Authority has zeroed out growth in annual operating expenses and has kept its staff levels flat. Our logic in 0% growth is simple: The less we spend on the operating side of our budget, the more we can spend on the capital side, which is the kind of spending that will create jobs, stimulate the economy and meet our infrastructure needs. Third, the recognition to prioritize long-term capital investment in a very different economic environment from the one in which the original long-term capital plan was developed. While 2009 will be a record year for Port Authority capital investment, we must also recognize what the challenges in the broader economy mean for the agency’s financial capacity in the years ahead. While the Agency’s overall financial health remains strong and its ability to finance its 2009 capital budget remains certain, the economic crisis has led to significantly reduced revenues from our facilities and lower income from our financial portfolio. In turn, this will constrain the Port Authority’s financial capacity to deliver within the 2007-2016 window all of the projects in the agency’s updated 10-year capital plan adopted in January 2008. Over time, we must carefully monitor this impact and manage our long-term capital plan accordingly. This means, as noted above, making sure our operating budget is as lean as possible. But it also means that, going forward, we must manage our long-term capital plan in a way that reflects the new economic and fiscal realities. As we look ahead, the Port Authority, as directed by the Board of Commissioners, will continue to prioritize its spending and update the Port Authority’s 2007-2016 capital plan in recognition of a shifting economic landscape. Despite the need to adjust to changing economic realities, as the 2009 Budget indicates, the Port Authority remains committed to its priority projects, including: rebuilding the World Trade Center site; the ARC Tunnel project; modernization of the PATH system,

4
including the rollout of a new fleet of PATH railcars; continued modernization and expansion of the Port Authority’s airports, including Newark Liberty Terminal B modernization, Stewart Airport upgrades, investments at LaGuardia and JFK and the flight delay reduction programs; and expansion of ExpressRail at the Port Authority’s marine terminals to increase freight movement by rail rather than by truck. Finally, it is worth noting that despite the difficult economic conditions and significant infrastructure challenges, the Port Authority’s 2009 Budget calls for no increases in tolls and fares. We believe our 2009 Budget represents a balanced and responsible approach to the economic and infrastructure challenges before us. We look forward to working with you and the public to fulfill its promise.
Sincerely,
Anthony R. Coscia Christopher O. Ward Chairman Executive Director

5
2009 BUDGET Summary
As a financially self-sustaining agency, the Port Authority raises the necessary funds for the acquisition, operations and investment of its facilities generally upon the basis of its own credit. It is not dependent on state or local taxes from New York or New Jersey and has no power to levy its own taxes or assessments. The agency generally funds its operating and capital expenditures through revenues generated by its facilities, the issuance of bonds, notes and other obligations, receipt of grants, insurance proceeds and other contributions, financial income earned on its investments, and the collection of Passenger Facility Charges (PFCs) at its airports.
Sources of Funds: $6.7 Billion
Bonds, Notes and
Other
27%
Gross Operating
Revenues
56%
Grants and
Contributions
13%
Financial Income
1%
PFCs
3%
Rentals
41%
Parking
6%
Aviation
Fees
16%
Tolls and
Fares
29%
Other
8%

6
The 2009 Budget totals $6.7 billion and provides for $2.5 billion in expenses to operate the agency’s facilities, $3.3 billion in gross capital expenditures to build and improve upon the region’s transportation capacity and rebuild the World Trade Center site, $825 million for debt service on the agency’s outstanding bonds, notes and other obligations, and $87 million for other expenditures, which are deferred and amortized in future periods.
Uses of Funds: $6.7 Billion
Deferred Exp &
Other
1%
Debt Service -
Operations and
Reserves
12%
Operating
Expenditures
37%
Capital Expenses
50%
Management
Services
14%
Maintenance
17%
Operations
34%
Rent
13%
Security
18%
Debt
Expense
4%
Security
11%
Revenue
Producing
24%
System
Enhancing
17%
State of Good
Repair
18%
Regional
2%
Mandatory
28%

7
The agency’s 2009 projected net income is $167 million. The facilities that generate net income – such as its airports, tunnels, and bridges – help pay, along with financial income, for those facilities that operate at a loss – primarily the mass transit-oriented operations, such as PATH, regional ferry services, and the bus terminals. Notably, some sources of funds cannot be applied to Port Authority operating expenses. For instance, federal grants are generally dedicated to particular projects, and PFCs can only be used for approved airport projects. The graph below summarizes the agency’s net income from its major lines of business.
$330
$478
($328)
($107) ($57)
$7
($156)
$167
($600)
($450)
($300)
($150)
$0
$150
$300
$450
$600
Airports Bridges &
Tunnels
PATH Bus
Terminal/Station
Ports World Trade Regional,
Ferries & Other
TOTAL
Port Authority of New York & New Jersey
2009 Budget Net Income/(Loss)
From Operations (1)
2009 Operating Budget Highlights
• Zero growth in operating expenses. (The agency’s operating expenses have been relatively flat, or relatively flat, for several years with 0% growth in 2009, 0.9% in 2008, and 1.1% in 2007.)
• Authorized position levels for 2009 also remain flat and total 7,127, the same as in 2008, as the agency continues to reallocate resources to priority projects. Since 2004, the Port Authority has reduced non-represented/managerial positions by 383, or 7% of such positions.
• $460 million in security operating costs.
(1) Excludes grants, contributions and PFCs.

8
• $5.5 million for energy conservation and environmental programs, such as a new Clean Trucks Program to finance and retrofit trucks using the agency’s ports, and a carbon neutral program to offset the agency’s environmental footprint and promote regional investments in the green technology sector.
• Negative financial market impacts resulting in lower financial income and higher
debt service.
2009 Capital Budget Highlights
The 2009 capital budget increased by $725 million or 28%, over 2008, for a total of $3.3 billion. Of that total amount, $600 million is for state-of-good-repair projects that ensure the agency’s bridges, tunnels, and other facilities are maintained in safe working order. Other major expenditures in 2009 include:
• $1.4 billion – World Trade Center redevelopment
• $340 million – ARC Tunnel project • $127 million – New PATH rail car purchases
• $88 million – Dredging Program at Port Authority Ports • $64 million – Modernizing Terminal B at Newark Liberty International
Airport • $46 million – Developing the Auto Marine Terminal
• $30 million – Developing Stewart International Airport • $22 million – Expanding ExpressRail at Port Authority Marine Terminals
• $15 million – Advancing the JFK flight delay reduction program • $15 million – Holland Tunnel Rehabilitation Ventilation System
• $13 million – Continued planning efforts for the new Goethals Bridge The capital budget also includes $269 million for security projects to harden the agency’s facilities infrastructure and install state-of-the-art surveillance and detection equipment such as:
• $55 million – PATH tunnel mitigation project • $39 million – Airports perimeter intrusion detection system
Combined with the $460 million in security operating costs, the Port Authority will spend a total of $729 million on security-related expenditures in 2009, bringing the agency’s total investment in security to $4.4 billion since the terrorist attacks on September 11, 2001.

9
Staffing Staffing levels for 2009 remain flat and total 7,127, the same as in 2008. By continuing to restructure staff functions, streamline operations, and leverage technology, the Port Authority was able to reallocate positions to priority projects and agency-wide initiatives, including the WTC Site, ARC Tunnel, and PATH Modernization Program, as well as increase staff in key areas such as facility operations, environmental and energy conservation, and safety and security. Seventy percent of Port Authority staff, in the functional areas of operations, security and maintenance, are represented by unions through the collective bargaining process. The remaining non-represented staff consists of engineering, technical, and management workforce.
2009 Staffing
Staff
Services
13%
Operating
Line Depts
48%
Public Safety
25%
Engineering
8%
General
Services
6%
The following table shows staffing by major function:

10
DEPARTMENTS BY FUNCTION STAFFING
OPERATING LINE DEPARTMENTS
Aviation 981
Real Estate & Development 84
Port Commerce 181
Rail / PATH 1,089
Tunnels, Bridges & Terminals 938
WTC Construction 122
PUBLIC SAFETY
Office of Emergency Management 19
Public Safety 1,755
ENGINEERING
Chief Engineer/Engineering 572
GENERAL SERVICES
Operations Services (including Facility Construction Support) 444
STAFF SERVICES
Executive Offices 9
Audit 76
Business and Job Opportunity 14
Chief Administrative Officer 9
Chief Financial Officer 5
Chief Operating Officer 7
Chief Technology Officer/Technology Services 112
Chief, Capital Planning 7
Chief, Public & Government Affairs 2
Chief, Real Estate & Development 2
Comptroller's 105
Financial Analysis 8
General Counsel/Law 136
Government and Community Affairs 13
Human Resources (including Medical Services) 68
Inspector General 30
Labor Relations 12
Management and Budget 43
Media Relations 11
Office of Environmental Policy & Compliance 13
Office of the Secretary 16
Operations Standards 7
Planning 26
Procurement 96
Project Management Office 12
Public Affairs 30
Security Project Management 26
Treasury 47
TOTAL AUTHORIZED POSITIONS 7,127

11
Controlling Staffing Levels Since 2004, the Port Authority has implemented an aggressive belt-tightening effort to reduce expenses through cost management. As a result, the agency has been able to reduce the number of non-represented/managerial positions by 383 positions. These reductions resulted from process improvements such as streamlining operations, reducing administration through automation and leveraging technology, restructuring staff functions, and reducing professional and managerial positions. The agency has also reallocated resources to priority projects, such as World Trade Center redevelopment, the ARC Tunnel project, the PATH modernization program, Stewart International Airport and key operational and security needs. In addition, controlling staffing levels has allowed the agency to contain operating expense growth to below the rate of inflation.
The following chart shows the decline in non-police staffing levels since 2004:
5,863 5,840 5,839 5,8505,776
5,521 5,468 5,467 5,467
5,200
5,300
5,400
5,500
5,600
5,700
5,800
5,900
2001 2002 2003 2004 2005 2006 2007 2008 2009
Years
Non-Police Staffing

12
Security continues to be a top priority of the agency. Since the terrorist attacks of September 11, 2001, the Port Authority has added 330 police positions, a 25% increase to the size of its force. During 2009, the Port Authority plans to spend $729 million on operating and capital security initiatives, an annual increase of more than 154% than 2001 spending levels. This will bring the total amount that the agency has spent on security since the September 11 attacks to $4.4 billion. The following chart shows an increase in police staffing levels since 2001:
1,330
1,395 1,3951,417 1,418
1,660 1,660 1,660 1,660
1,000
1,100
1,200
1,300
1,400
1,500
1,600
1,700
2001 2002 2003 2004 2005 2006 2007 2008 2009
Years
Police Staffing

2009 BudgetDepartmental
Summary

13
Budgets by Department
AVIATION Facilities
• John F. Kennedy International Airport (JFK) • LaGuardia Airport (LGA) • Newark Liberty International Airport (EWR) • Stewart International Airport (SWF) • Teterboro Airport (TEB)
Passenger Traffic In 2009, an estimated 106 million people will utilize the Port Authority’s aviation facilities. As a result of higher fuel prices and the economic downturn that have adversely impacted the aviation industry at large, passenger levels are expected to decline by 1.8 million or 2% compared with 2008.
Aviation Activity Levels by Major Airport
(in thousands)
20,00025,00030,00035,00040,00045,00050,000
2000
2001
2002
2003
2004
2005
2006
2007
2008
est
2009
bud
Years
Pa
ss
en
ge
rs
JFK
LGA
EWR
Revenues and Expenses Aviation anticipates continued long-term growth in its business and projects 2009 revenues of $2.1 billion. Significant revenue sources include: fixed rentals from leases for airline terminals, consumer services, aircraft services, and hangars and cargo facilities; flight fees resulting from cost recovery agreements with the airlines; percentage and other rentals, such as revenues from the AirTrain, utilities and fuel fees; and other airport activity including public parking.

14
The Aviation operating budget for 2009 is $1.3 billion, which provides for on-going costs to maintain, operate and secure the airports.
Aviation - Operating & Maintenance Expenses
Security
17%
Management
Services
4%
Debt Expense
6%
Rent
17%
Operations
38%
Maintenance
17%
2009 Capital Budget Overview The 2009 Aviation capital budget provides for expenditures totaling $594 million, much of which is geared toward enhancing security and overall system capacity.
Aviation 2009 Capital Plan
State of Good
Repair
40%
Mandatory
11%
Security
14%
Revenue
Producing
25%
System
Enhancing
10%

15
2009 Capital Budget Highlights
• JFK Rehabilitation of Taxiways and Apron Areas – Modifications to accommodate new large aircraft operations.
• JFK Flight Delay Reduction Program – Extend airport taxiways.
• JFK Centralized De-Icing Facility – Demolition of Hangar 12 to make way for
construction of a centralized aircraft de-icing facility.
• LGA Central Terminal Building Modernization – Planning for the development of a new terminal that includes expanded concourses, passenger & baggage screening areas, concessions, larger aircraft gates, a new parking garage, and improved aircraft fueling services.
• LGA Police and Airfield Fire Rescue Facility – Construction of a new two-story
building on the west side of LaGuardia Airport.
• LGA Rehabilitation of Runway 4-22 – Provides for full-width milling and paving of Runway 4-22.
• EWR Flight Delay Reduction Initiatives – Development of improvements to the
navigational aid system to increase aircraft landing capability during inclement weather.
• EWR Modernization of Terminal B – Additional gates and terminal expansion to
meet expected growth in Newark Liberty’s air passenger traffic. • EWR Rehabilitation of Runways – Modifications to drainage, milling, pavement
depth and upgrade of lighting per FAA standards. • SWF Development – Terminal expansion at Stewart International Airport,
including a new Federal Inspection Services area. • Other Airport Improvements include: Perimeter Intrusion Detection System and
Engineering Material Runway Arresting System.

16
PATH Facilities
• PATH Rail Transit System
Stations in New York Stations in New Jersey 9th Street Exchange Place 14th Street Grove Street 23rd Street Harrison 33rd Street Hoboken Christopher Street Journal Square World Trade Center Newark Penn Station
Pavonia/Newport • Journal Square Transportation Center
Passenger Traffic PATH annual ridership is expected to reach 76.8 million passengers in 2009, an increase of 1.7 million passengers, or 2%, from 2008. PATH presently carries approximately 255,000 passengers every weekday. Volumes are expected to continue to increase as the new permanent World Trade Center Transportation Hub progresses and as residential, business, and significant commercial development continues along the New Jersey waterfront and other communities within the PATH service region.
PATH Activity Levels by Station
(in thousands)
0
5,000
10,000
15,000
20,000
2000
2001
2002
2003
2004
2005
2006
2007
2008
est
2009
bud
Years
Passen
gers
9th Street
14th Street
23rd Street
33rd Street
Christopher Street.
WTC
Exchange Place
Grove Street
Harrison
Hoboken
Journal Square
Newark
Pavonia
Revenues and Expenses PATH projects 2009 revenues of $117 million, which consists mostly of passenger fares from the PATH system, along with rentals from the Journal Square Transportation Center, advertising and parking revenues.

17
Rail Transportation - Revenue by Categories
Rentals
7%
Parking
1%Fares
92%
The PATH operating budget for 2009 is $295 million, allocated as follows:
Rail Transportation - Operating & Maintenance Expenses
Management
Services
7%
Operations
43%
Rent
1%
Security
22%
Maintenance
27%
2009 Capital Budget Overview The 2009 PATH capital budget provides for expenditures totaling $370 million, much of which is geared toward the PATH modernization program to replace rail cars and signal systems, and upgrade all stations.
PATH 2009 Capital Plan
System
Enhancing
5%
Mandatory
3%
Security
34%
State of Good
Repair
58%

18
2009 Capital Budget Highlights
• New Railcar Purchase Program – Replacement of aging railcar fleet. Program will also facilitate capacity expansion in conjunction with the new signal system. Initial production cars are anticipated for delivery during the first quarter of 2009.
• Signal System Program – Replacement of the existing antiquated signal system, providing up to a 20% increase in capacity when fully deployed with the new PATH railcars.
• Security Projects – PATH capital projects and comprehensive program planning designed for hardening the infrastructure.
• Duct Bank Rehabilitation Program – Replacement and upgrade of the entire tunnel’s high voltage wiring and housing (except Tunnels E&F), adding to the reliability of the PATH system.
• Station Modernization Program – This program will provide for short-term and long-term improvements within the PATH system that will enhance safety, expand capacity, and improve the quality of the stations. Some of the near-term improvements will included comprehensive signage and upgraded seating.

19
PORT COMMERCE Facilities
• Auto Marine Terminal • Howland Hook Marine Terminal • Greenville Yard Port Authority Marine Terminal • Elizabeth - Port Authority Marine Terminal • Brooklyn - Port Authority Marine Terminal • Port Newark • Red Hook Container Terminal
Cargo Volume Despite the economic downturn, the Port Authority’s port facilities have outperformed other major ports throughout the country, some of which declined or grew by less than 1% in the same period. In 2009, cargo volume at the agency’s port facilities is expected to remain strong at 2.8 million containers, a slight increase from estimated 2008 volume. However, the growth in cargo volumes is expected to slow (though still remain positive) in the coming years. Revenues and Expenses Port Commerce projects 2009 revenues of $220 million based on an estimated 36.2 million metric tons of cargo, consisting mainly of fixed rent and percentage and other rentals. Fixed rentals include base rents, as well as the repayment of infrastructure improvements under agreements with certain tenants. Percentage and other rentals are primarily derived from the Express Rail facilities and other waterborne, bulk and automotive cargo utilizing the dock and wharfs.
Port Activity Levels by Facilities
(in thousands)
0
500
1,000
1,500
2,000
2,500
2000 2001 2002 2003 2004 2005 2006 2007 2008
est
2009
bud
Years
Co
nta
ine
rs Port Elizabeth
Port Newark
Howland Hook
Red Hook

20
Port Commerce - Revenue by Categories
Fixed Rent
77%
Percentage & Other
Rentals
23%
The Port Commerce Department’s operating budget for 2009 is $136 million, allocated as follows:
2009 Capital Budget Overview The 2009 Port Commerce capital budget provides for expenditures totaling $246 million, much of which is geared toward improving and expanding the agency’s port facilities.
Port Commerce 2009 Capital Plan
Revenue
Producing
36%
Security
2%
Mandatory
36%
State of Good
Repair
16%
System
Enhancing
10%

21
2009 Capital Budget Highlights
• Harbor Deepening Program – Authorized by the Board in 2001, this program encompasses 17 contracts associated with completing the 50-foot deepening work. This work will allow for improved navigational safety and allow our port to accommodate the next generation of cargo vessels.
• Intermodal Program – Construction of a comprehensive ExpressRail system that will improve the capacity of the rail system and its overall effectiveness.
• Infrastructure Program – Ensures that Port Commerce assets are maintained in a state of good repair. Major projects include replacement of Berths 6, 8 and 10 at Port Newark and rehabilitation of piles at piers 7 and 8 in Brooklyn.
• Roadway Program – Series of projects intended to enhance the safety, efficiency and capacity of the New Jersey Marine Terminal roadway system.

22
TUNNELS, BRIDGES, AND TERMINALS (TB&T) Facilities
• Bayonne Bridge • Goethals Bridge • George Washington Bridge (GWB) • George Washington Bridge Bus Station (GWBBS) • Holland Tunnel • Lincoln Tunnel • Outerbridge Crossing • Port Authority Bus Terminal (PABT)
Motor Vehicle Traffic After record levels of traffic in recent years, it is expected that the agency’s facilities will handle 121.7 million eastbound cars, buses, and trucks in 2009, a decline of 2% from 2008 levels. This decrease is due to current economic and market conditions. Revenues and Expenses TB&T anticipates long-term growth in its business and projects 2009 revenues of $1 billion, consisting mostly of toll revenues from the bridge and tunnel crossings, along with rentals from the bus terminals, advertising and parking revenues.
TB&T Traffic Activity Levels by Facilities
(in thousands)
0
10,000
20,000
30,000
40,000
50,000
60,000
2000 2001 2002 2003 2004 2005 2006 2007 2008
est
2009
bud
Years
Tra
ffic
Holland Tunnel
Lincoln Tunnel
George
Washington Bridge
Bayonne Bridge
Goethals Bridge
Outerbridge
Crossing

23
TB&T’s total 2009 operating budget is $440 million, allocated as follows:
TB&T - Operating & Maintenance Expenses
Management
Services
8%
Operations
41%
Rent
1%
Security
28%
Maintenance
22%
2009 Capital Budget Overview The 2009 TB&T capital budget provides for expenditures totaling $209 million, much of which is geared toward rehabilitating and maintaining the facilities in a state of good repair.

24
2009 Capital Budget Highlights
• Holland Tunnel Rehabilitation of Electrical and Mechanical Ventilation System – This project provides for Rehabilitation of ventilation systems in all four ventilation buildings. In addition, the capital budget funds LED lighting replacements in the tunnel.
• All-Electronic Toll System – Advances a system replacement for E-ZPass that
will eliminate existing tollbooths and at the same time help reduce congestion, enhance safety and potentially reduce emissions of greenhouse gases and other priority pollutants.
• GWB Suspender Rope Replacement – As part of TB&T’s consistent efforts to
maintain its aging infrastructure, the bridge’s suspender ropes will be replaced. • GWB Upper Deck Replacement – Continue planning for replacement of the upper
deck, to relieve the stress of continuous heavy truck traffic and to ensure the safe and reliable movement of goods around the region.
• Goethals Bridge Modernization – Continue planning for a replacement structure
designed to accommodate future traffic demands and improve the efficiency of goods movement.
• Bayonne Bridge Air Draft Study – This project will provide for preliminary
planning and a cost-benefit analysis of options to increase the air draft of the Bayonne Bridge.
TB&T 2009 Capital Plan
Security
26%
Revenue
Producing
1%
System
Enhancing
3%
State of Good
Repair
58%
Mandatory
12%
25
DEVELOPMENT Facilities
• ARC Tunnel Project • Bathgate Industrial Park • Essex County Resource Recovery Facility • Ferry Transportation • Port Authority Industrial Park at Elizabeth • Newark Legal & Communications Center • The Teleport • Waterfront Development
o Queens West Waterfront Development o South Waterfront at Hoboken
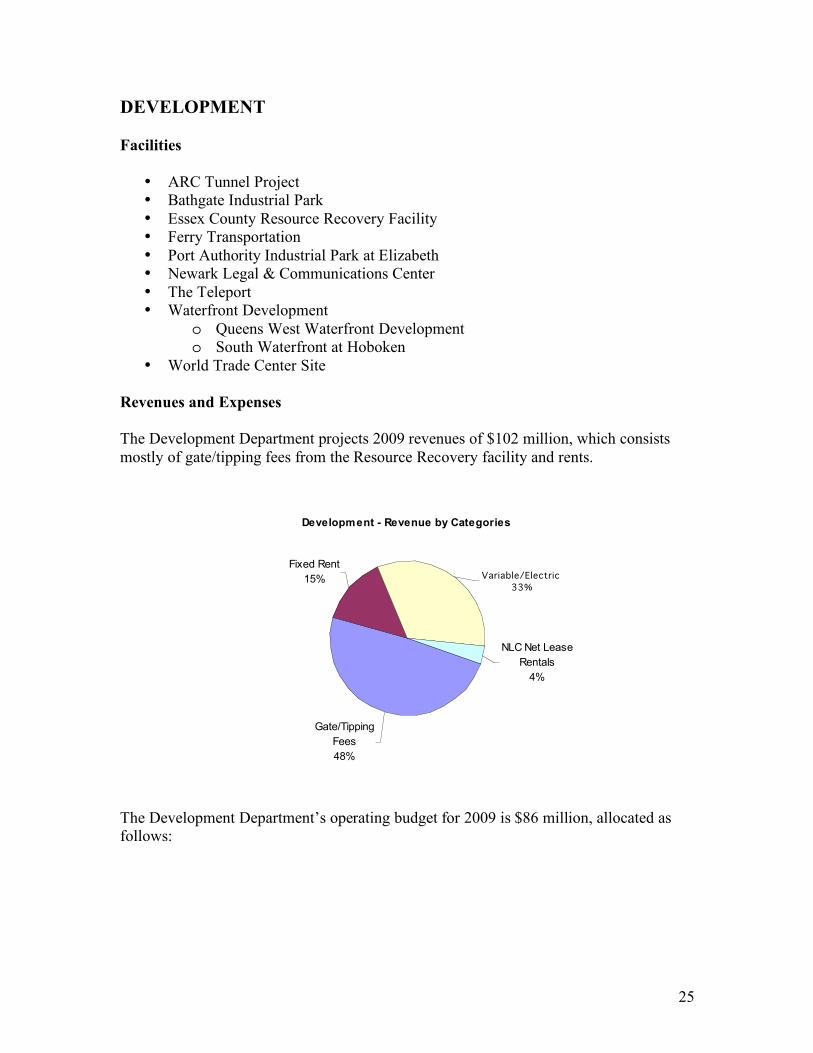
• World Trade Center Site Revenues and Expenses The Development Department projects 2009 revenues of $102 million, which consists mostly of gate/tipping fees from the Resource Recovery facility and rents.
Development - Revenue by Categories
Gate/Tipping
Fees
48%
Fixed Rent
15%
NLC Net Lease
Rentals
4%
Variable/Electricity
33%
The Development Department’s operating budget for 2009 is $86 million, allocated as follows:

26
Development - Operating & Maintenance Expenses
Operations
81%
Security
2%
Rent
9%
Management
Services
5%
Maintenance
3%
2009 Capital Budget Overview The Development Department’s 2009 capital budget provides for expenditures totaling $30 million, the majority of which is for system-enhancing projects.
2009 Capital Budget Highlights
• Access to the Region’s Core (ARC): The new ARC tunnel is a transformative project for mass transit in the New York/New Jersey Region. It will more than double the number of peak-hour trains that can pass under the Hudson River – from 23 trains to 48 trains – meeting a ridership demand that is expected to nearly double in the next 20 years to 45 million trips a year. The ARC project will bring shorter commutes, fewer delays and provide a transfer-free direct ride into New York City for passengers from Orange and Rockland Counties on the Pascack Valley and Port Jervis Lines in New York’s Hudson Valley and passengers from several New Jersey counties on the Main/Bergen line, among others. On an
Development 2009 Capital Plan
Mandatory
38%
System
Enhancing
55%State of Good
Repair
7%

27
annual basis, the ARC project will take 22,000 cars off the region’s highways and remove more than 125,000 tons of greenhouse gases and other pollution from the air. Nearly $6 billion of local funds have been committed and the project awaits $3 billion in federal funds.
• Queens West Waterfront Development – This 9.1 million square foot mixed-use project, a joint undertaking of the Port Authority, New York City Economic Development Corporation and the Empire State Development Corporation, is being developed in four stages with development of the first two stages well underway.
• The South Waterfront – A partnership between the Port Authority, City of Hoboken, and the private development community, this 2.3 million square foot mixed-use development currently includes two office towers, a residential building, a public-access waterfront esplanade and park, and a W hotel.
• Harbor Estuary Program – Acquisition of land to be preserved through conservation easements or deed restrictions. The Port Authority works with agencies in both states to identify and evaluate potential sites.
• Ferry Transportation – Ferry transportation is a critical component of the region’s transportation network and an important economic development tool. The Port Authority is committed to enhancing the regional ferry network, developing new services and partnering with the public and private sector to improve existing infrastructure. The 2009 capital budget includes spending on development of permanent ferry terminals in Hoboken and Lower Manhattan and a ferry landing at LaGuardia airport.
• Port Authority Bus Terminal (PABT) Air Rights Development –The agency is in negotiations with a private entity to develop the air rights above the PABT. The revenues from the sale of the development rights will be used for extensive improvements to the bus terminal facility, including renovation of approximately 55,000 square feet of retail space and an enhanced pedestrian and bus terminal circulation system.
• George Washington Bridge Bus Station (GWBBS) Redevelopment – The GWBBS serves 15,000 to 20,000 commuters and visitors daily, providing commuter and longer distance bus service, as well as connections to the NYC subways and buses. This 45-year-old facility will soon require additional capital improvements. To offset costs of these improvements and improve the atmosphere and level of service in and around the bus station, the Agency is entering into a public-private partnership to redevelop the space.

28
WORLD TRADE CENTER REBUILDING Revenues and Expenses World Trade Center projected revenues for 2009 are $144 million, which consists mostly of World Trade Center leases, inter-company rent and rentals.
The World Trade operating expenditures for 2009 total $162 million, which is geared toward inter-company rent, as well as, management services, maintenance, operations and security during the rebuilding of the WTC site.
World Trade Center - O&M Expenses
Operations
4%
Maintenance
5%Rent
48%
Security
11%Management
Services
32%
The 2009 WTC capital budget provides for expenditures totaling $1.42 billion geared toward the rebuilding effort in accordance with the WTC assessment.

29
Capital Plan Highlights In October 2008, the Port Authority released an assessment of the World Trade Center rebuilding effort. The assessment included resolutions to the major issues blocking construction progress as well as a set of realistic schedules and budgets for each of the major public projects. Given the recent assessments, we have not only indicated the 2009 capital spending for each of the capital projects at the World Trade Center site, which is included in the budget schedules that follow, but we also have listed below the estimated total project cost (representing the costs borne by the Port Authority and its project partners) for each of the projects. Together with our project partners, the Port Authority is committed to seeing these projects to completion.
• WTC Transportation Hub: The 800,000 square foot Transportation Hub will serve 200,000 commuters daily by providing access to 13 different subways, PATH, and ferries, and house 500,000 square feet of retail space. Estimated total project cost: $3.249 billion.
• One World Trade Center, The Freedom Tower (1WTC): Will be home to 2.6 million square feet of commercial office space, an observation deck, restaurants, retail opportunities, and parking. Estimated total project cost: $3.178 billion.
• WTC Vehicular Security Center and Tour Bus Parking Facility (VSC): Will constitute part of the comprehensive police and security plan for screening of buses, trucks, and cars entering the WTC site and its facilities. Estimated total project cost: $633 million.
• The National September 11 Memorial & Museum: Will reside within an eight-
acre memorial plaza containing reflecting pools that cover the footprints of the original WTC twin towers, surrounded by parapets with the names inscribed of the 2,981 people who lost their lives on September 11, 2001, and February 26, 1993, and a Visitor’s Center and Museum. Estimated cost of the Port Authority’s share: $195 million.
WTC 2009 Capital Plan
WTC Retail
8%
WTC Memorial
4%
Vehicular
Security
Center
5%
1 WTC
Freedom
Tow er
30%
WTC Site
Infrastructure
25%
WTC
Transportation
Hub
28%

30
• WTC Site Infrastructure: Besides the signature projects on the 16-acre World Trade Center site, substantial investment must be spent on the infrastructure that will support the massive development. Investments include: underground parking; the site-wide Chiller Plant and other site-wide mechanical, electric, plumbing and utilities; the construction of Greenwich and Fulton streets; restaging Route 9A; foundations for the rebuilt St. Nicholas Greek Orthodox Church; security infrastructure and contingencies; and foundation excavation. Estimated total project cost: $2.767 billion.
• WTC Retail Development: Approximately 500,000 square feet of first-class retail
and restaurant space to help revitalize the Lower Manhattan economy. In January 2008, the Port Authority entered into a term sheet with Westfield to undertake a joint venture for retail operations at the World Trade Center site. Estimated cost of the Port Authority’s share: $825 million (Westfield’s share is an additional $625 million).

ChallengesAhead

31
THE CHALLENGES AHEAD While 2009 will be a record year for capital spending, the Port Authority must also recognize the impacts of the troubled economy on the agency’s long-term financial capacity. Specifically, the agency must confront downward pressure on revenue from a deteriorating economy, upward pressure on costs from scope changes and refined cost estimates, and the growing needs of the region’s infrastructure. In order to fulfill the agency’s mission of building the infrastructure necessary for the region to thrive, the Port Authority will need to adjust its capital spending accordingly. This means, as discussed earlier, making sure the Port Authority’s operating budget is as lean as possible. But it also means that, going forward, the agency must manage its long-term capital plan in a way that reflects the new economic and fiscal realities. Detailed below are the challenges that the Port Authority will have to consider as it manages its long-term capital plan. As we look ahead, the Port Authority, as directed by the Board of Commissioners, will continue to prioritize its spending and update the Port Authority’s 2007-2016 capital plan in recognition of a shifting economic landscape. DOWNWARD PRESSURE ON REVENUE In recent months, a national and global economic downturn has battered the New York-New Jersey regional economy. Unemployment claims have risen to their highest levels since the days following September 11, 2001. Announced layoffs in the region’s financial sector have surpassed 60,000 and the region’s unemployment rate has climbed to 5.7 percent in September 2008, up from 4.4 percent in April. As a result of the current financial crisis and economic downturn, the region is expected to lose about 200,000 jobs between 2008 and early 2010. Public agencies have not been insulated from this economic downturn, and the Port Authority is no exception. While the Port Authority’s estimated 2008 revenues have in fact increased from the prior year (primarily as a result of the first toll and fare increase in seven years, implemented in March 2008), because of the current economic crisis, the agency’s projected net revenues for 2009 – the combination of net revenues from Port Authority operating facilities and income from the agency’s financial portfolio – has declined by $215 million, or 15% from last year’s capital plan projection. In turn, this will constrain the Port Authority’s financial capacity to deliver within the 2007-2016 window all of the projects in its updated 10-year capital plan adopted in January 2008. Decreasing Traffic at Port Authority Facilities When the Board of Commissioners approved the agency’s updated 2007-2016 Capital Investment Plan in January 2008, it did so based on certain levels of assumed activity growth – and thus revenue growth – at its facilities through 2016. Those projections supported capital spending of $29.5 billion for the ten-year period between 2007 and 2016. However, as a result of the current economic crisis, the Port Authority is now

32
projecting lower activity levels through the remainder of the capital plan period at the agency’s tunnels, bridges, airports, and ports, and fluctuation in growth of passengers on the PATH system. The following charts depict the projected growth rates of activity levels at the Port Authority’s major lines of business compared with last year’s projections:
TB&T Activity Levels
(in thousands)
120,000
125,000
130,000
135,000
140,000
145,000
2008
2009
2010
2011
2012
2013
2014
2015
2016
Years
Ve
hic
les
Prior Year
Forecast
Current Year
Forecast
Aviation Activity Levels
(in thousands)
100000
105000
110000
115000
120000
125000
130000
135000
2008
2009
2010
2011
2012
2013
2014
2015
2016
Years
Passen
gers
Prior Year
Forecast
Current Year
Forecast

33
Port Commerce Activity Levels
(in thousands)
2,500
3,000
3,500
4,000
4,500
2008
2009
2010
2011
2012
2013
2014
2015
2016
Years
Co
nta
ine
rs Prior Year
Forecast
Current Year
Forecast
PATH Activity Levels
(in thousands)
70,000
75,000
80,000
85,000
90,000
95,000
100,000
105,000
2008
2009
2010
2011
2012
2013
2014
2015
2016
Years
Passen
gers
Prior Year
Forecast
Current Year
Forecast
Decreasing Financial Income from the Port Authority’s Investment Portfolio In addition to reduced activity at Port Authority facilities, the agency’s projected revenues have also declined as a result of lower financial income. Historically, the Port Authority’s investment portfolio has been relatively insulated from wild swings in the market, thanks to a conservative, Board-established policy of investments primarily in U.S. Treasury Bonds, U.S. Treasury Notes and other secure investments. However, as the market meltdown continued throughout the year and became deeper and more widespread, the Port Authority’s investment portfolio was impacted in the form of significantly decreased earnings primarily on the agency’s U.S. Treasury securities. As the market spiraled downward, investors and money market funds moved their investments into U.S. Treasury securities – sending interest rates attached to those securities plunging. As a result, reinvestment rates for the agency’s holdings of U.S.

34
Treasury securities have dropped from nearly 5% to slightly under 2% on average over the past year, which has reduced forecasted financial income for 2009 by $103 million, or 59% compared with last year’s projection. UPWARD PRESSURE ON COSTS At the same time Port Authority revenues are declining, agency costs are climbing. Increasing costs fall into two primary categories: the cost of borrowing and the cost of goods, services and the unanticipated cost of certain projects. Increasing Cost of Borrowing The broader economic downturn has also caused an increase in the Port Authority’s borrowing costs (the issuance of debt is the main source of funding for the agency’s capital program), primarily because of the continuing volatility in the capital markets. The flight of capital to U.S. Treasury securities or securities guaranteed by programs offered through the Federal bailout has constrained the ability of municipalities and other governmental issuers of debt, including the Port Authority, which in turn has translated into higher borrowing costs and limited market access for such issuers. Increased interest rates on Port Authority short-term and variable-rate debt, together with the refunding of auction-rate and other variable-rate securities issued by the Port Authority with long-term fixed rate bonds will result in additional debt service costs to the Port Authority of an annual average of $100 million through the 10-year capital plan period. Increasing Costs of Capital Projects In the past year alone, construction costs and cost for materials have grown by 12 percent – more than four times the Consumer Price Index. These costs have been trending upward for several years and, despite the slowdown in the economy, the economic downturn is not expected to reverse these increases. As a result, along with scope changes and refined cost estimates and project timelines, the projected cost to complete the projects included in the updated 10-year capital plan adopted in January 2008 has increased significantly. INFRASTRUCTURE CHALLENGE Against the backdrop of the Port Authority’s fiscal challenge is an infrastructure challenge that must be addressed if the regional economy is to grow and remain globally competitive. The region’s transportation facilities form the backbone of an economy that, if measured on its own, would constitute the eighth largest economy in the world. For much of the past century, those facilities have underpinned the region’s extraordinary growth and prosperity. However, in recent years, a growing number of commuters and escalating volume of cargo has resulted in routine congestion throughout the region. Already,
35
regional commuters lose a total of 400 million hours each year sitting in traffic instead of at their desks – wasted time that costs the region $7 billion in lost productivity each year. The environmental impact of this congestion is also high, diminishing the region’s air quality and adding more greenhouse emissions into the atmosphere. Left unaddressed, these conditions will worsen in the years ahead as the region’s population continues to grow. By 2020:
• The New York-New Jersey region is projected to grow to 18 million residents, an increase of nearly 700,000 residents, or 4 percent, from 2007.
• The Port Authority’s bridges, tunnels and terminals will handle 12 million
additional vehicles, an increase of 9.2 percent.
• PATH ridership will increase by 41 million annual riders, an increase of 57 percent.
• The Port Authority’s airports will see an increase of 26 million passengers, a 24
percent increase over 2007 passenger levels.
• And at the Port of New York and New Jersey - the largest port on the east coast of North America - activity levels will increase by 3.4 million TEUs, an increase of 71%.
In order to ensure the region’s future growth and competitiveness, the Port Authority is committed to addressing the region’s infrastructure challenge and identifying ways to move people and goods faster, cheaper, and more sustainably. As a first step in addressing this challenge, in 2005, the Port Authority’s Board of Commissioners adopted a Strategic Plan, which set the following objectives for the agency’s capital investments:
• Support the service-based economy by building systems that move more people in and out of the region more efficiently and effectively;
• Create modern, efficient public transit that serves commuters in existing and
emerging population and job centers;
• Provide the freight industry with reliable, fast, and affordable ways to deliver their goods to the region;
• Upgrade and maintain existing infrastructure to state-of-the-art standards of
service, safety, and security, and;
• Develop systems to support seamless regional travel.
The agency’s ability to do each of these tasks efficiently and effectively will be critical to the region’s physical safety, economic vitality and environmental sustainability.

2009Operating
Budget

THE PORT AUTHORITY OF NEW YORK AND NEW JERSEY(Including its wholly owned entities)
Budget:Summary of 2009 Budget 22009 Summary of Sources and Uses Chart 32009 Budget 4
Sources:Summary 6Gross Operating Revenues by Facility 7Operating Revenues by Major Category 8
Uses:Summary 10Expenses by Facility 11Operating Expenses by Major Category 12General Administrative Expenses 13Development Expenses 14Capital Expenditures by Facility 15
Changes in Net Assets, Revenues & Reserves and Assets & Liabilities:Revenues, Expenses and Changes in Net Assets 17
Information on Port Authority Operations by Facility 18
Revenues and Reserves 19
Assets and Liabilities 20
Outstanding Obligations & Financings:Summary of Debt Type 22Debt Obligations and Limitations 23
Staffing 25
Activity Highlights 27
Page
2009 BUDGET
C O N T E N T S

SUMMARY OF 2009 BUDGET(In Millions)
2009 2008 %SOURCES: Budget Budget Variance ChangeGross Operating Revenues $3,715 $3,306 $409 12.4%Bonds, Notes and Other 1,830 1,318 512 38.8%Financial Income 81 202 (121) -59.9%Grants and Contributions, Insurance, Third Party
Recoveries and Miscellaneous Revenues 864 885 (21) -2.4%Allocated Passenger Facility Charges 216 200 16 8.0%
Total Sources $6,706 $5,911 $795 13.4%
Significant Highlights/Challenges:Gross Operating Revenues are expected to increase by 12%, mostly reflecting the full year impact of the tolls andfare increases. If you exclude the tolls and fare increases there is a moderate growth of 3% from our remaining core businesses.Bonds, Notes and Other increased by 39% due to increased debt issuance to finance additional capital spendingof $725 million.Current economic crisis has affected the Port Authority in several ways, including:
Lower projected activity levels at our tunnels, bridges and airports Financial Income is expected to be lower by 60% due to lower interest rates on investments based on the
monetary policy changes by the Federal Reserve Board in 2008.
2009 2008 %USES: Budget Budget Variance ChangeExpenses $2,442 $2,442 -$ 0.0%Incremental Expenses 47 - 47 n/aDebt Service 825 814 11 1.4%Deferred & Other Expenses 87 75 12 16.0%Gross Capital Expenditures 3,305 2,580 725 28.1%
Total Uses $6,706 $5,911 $795 13.4%
Significant Highlights/Challenges:Through our aggressive cost containment efforts, there has been no growth in operating spending throughout the2009 Budget. In fact the agency’s operating spending budget has been relatively flat for several years with 1.1% in2007 and 0.9% in 2008. Authorized position levels for 2009 also remain flat and total 7,127, the same as in 2008, as we continue to reallocateresources to priority projects. Since 2004 we have reduced non-represented/managerial positions by 383 or 7%.Committing $729 million in 2009 operating and capital expenses to provide safe and secure facilities. Overallsecurity expenses are $442 million higher, or 154%, than 2001.Incremental Expenses included in the 2009 budget are: the interim operation of the Ramada Plaza Hotel at JFKInternational Airport; and contingency for expenses related to the World Trade Center rebuilding effort.Providing $5.5 million for energy conservation and environmental programs, such as a new Clean Trucks Programto finance and retrofit trucks using our ports, and a Carbon Neutral Program to procure carbon offsets and promoteregional investment in carbon offsetting projects, in support of the agency’s goal to reduce greenhouse gasemissions.Capital spending for 2009 totals a historic $3.3 billion, for major capital projects which include: the World TradeCenter site ($1.4B), the ARC Tunnel project in partnership with New Jersey Transit ($340M), new PATH rail carpurchases ($127M), continuing the Dredging Program at our Ports ($88M), modernizing Terminal B at NewarkLiberty International Airport ($64M), developing the Auto Marine Terminal ($46M), developing Stewart InternationalAirport ($30M), continued planning efforts for the new Goethals Bridge ($13M), rehabilitation of Holland TunnelVentilation System ($15M), expanding ExpressRail at our Marine Terminals ($22M) and advancing the JFK flightreduction delay program ($15M).
2

Summary of Sources and Uses - 2009 Budget
Sources: $6.706 Billion
Uses: $6.706 Billion
PFCs3%
Gross Operating Revenues:
56%
Financial Income:1%
Bonds, Notes and Other: 27%
Grants and Contributions , Insurance, Third Party Recoveries and Miscellaneous Revenues: 13%
Operating Expenses37%
Capital Expenditures50%
Debt Service - Operations and
Reserves12%
Deferred & Other Expenses
1%
3

THE PORT AUTHORITY OF NEW YORK & NEW JERSEY(Including its wholly owned entities)2009 BUDGET(In Thousands)
Total Personal MaterialsItem Expenditures Services & ServicesAudit $12,355 $10,013 $2,342Aviation 716,334 143,505 572,829 Business and Job Opportunity 3,615 2,298 1,317 Chief Administrative Officer 1,017 862 155 Chief, Capital Planning 1,630 1,392 238 Chief Financial Officer 3,187 838 2,349 Chief Operating Officer 2,763 1,045 1,718 Security Project Management 44,752 4,820 39,932 Project Management Office 903 863 40 Chief of Public & Government Affairs 709 654 55 Chief, Real Estate & Development 2,127 1,758 369 Comptroller's 12,331 11,794 537 Engineering 290,922 92,622 198,300 Capital Construction Contracts 677,510 - 677,510 Executive Offices 2,830 2,442 388 Ferry Program 17,934 - 17,934 Financial Analysis 1,298 1,058 240 Government & Community Affairs 4,238 1,826 2,412 Human Resources 12,952 8,912 4,040 Medical Services 4,073 2,366 1,707 Inspector General 19,661 5,853 13,808 Labor Relations 2,504 1,890 614 Law 21,242 20,368 874 Management and Budget 8,085 6,833 1,252 Media Relations 1,741 1,479 262 Office of Emergency Management 8,921 3,636 5,285 Office of Environmental Policy & Compliance 7,989 2,315 5,674 Office of the Secretary 3,981 2,210 1,771 Operations Services 44,743 34,534 10,209 (1)
Facility Construction Support 33,962 24,809 9,153 Operations Standards 1,663 1,122 541 Planning 5,619 4,126 1,493 Port Commerce 198,285 25,858 172,427 Procurement 14,544 11,719 2,825 (1)
Public Affairs 13,336 4,070 9,266 Public Safety 382,391 346,011 36,380 Rail Transit 381,493 154,568 226,925 Real Estate & Development 306,230 13,672 292,558 (1)
Technology Services 85,560 17,625 67,935 (1)
Corporate Enterprise Systems 28,313 - 28,313 Treasury 31,498 6,083 25,415 Tunnels, Bridges & Terminals 223,935 119,648 104,287 WTC Construction 1,130,752 23,244 1,107,508 Other: Access to the Region's Core (Arc Tunnel) 340,000 - 340,000 Amounts in Connection with Operating Asset Obligations 38,590 - 38,590 Bi-state Dredging Program 4,300 - 4,300 Debt Service - Operations 825,000 - 825,000 Debt Service - Capital 160,000 - 160,000 Insurance 169,288 - 169,288 Municipal Rents and Amounts in Lieu of Taxes 226,839 - 226,839 Port Authority Insurance Captive Entity, LLC 424 - 424 Provision for Study and Development 25,000 - 25,000 Regional Programs - Operating 14,350 - 14,350 Regional Programs - Capital 59,900 - 59,900 Special Project Bonds Debt Service 72,171 - 72,171 Total Port Authority Budget $6,705,791 $1,120,741 $5,585,050
(1) Net after charges to other departments.
4

Sources

SOURCES(In Millions)
2009 2008 2008 2007Budget Estimate Budget Actual
Revenues: Gross Operating Revenues: Rentals $1,507 $1,446 $1,361 $1,379 Tolls and Fares 1,088 1,065 805 800 Aviation Fees 600 564 557 543 Parking 240 236 251 239 Other 280 292 291 300Total Gross Operating Revenues 3,715 3,604 3,265 3,261 Port Authority Insurance Captive Entity, LLC - - 41 - Total Revenues 3,715 3,604 3,306 3,261
Bonds, Notes and Other 1,830 731 1,318 1,160
Financial Income 81 26 202 236
Grants and Contributions, Insurance, Third Party Recoveries and Miscellaneous Revenues 864 1,282 885 629
Allocated Passenger Facility Charges 216 214 200 221
Total Sources $6,706 $5,857 $5,911 $5,507
$0
$500
$1,000
$1,500
$2,000
$2,500
$3,000
$3,500
$4,000
2009 Budget 2008 Estimate 2008 Budget 2007 Actual
TotalRevenues
Bonds, Notesand Other
FinancialIncome
PFCs, Grants and Contributions, Insurance, Third Party Recoveries
and Miscellaneous Rev.
6

GROSS OPERATING REVENUES BY FACILITY(In Thousands)
2009 2008 2008 2007Budget Estimate Budget Actual
AviationLaGuardia Airport $319,046 $305,116 $307,378 $295,229John F. Kennedy International Airport 988,557 933,715 889,114 872,814Newark Liberty International Airport 755,876 725,844 718,831 711,774Teterboro Airport 35,290 34,644 32,346 33,141 Stewart International Airport 8,961 10,647 9,900 1,822 Port Authority Heliport - 2,087 346 3,218
Total - Aviation 2,107,730 2,012,053 1,957,915 1,917,998
Tunnels, Bridges & TerminalsHolland Tunnel 119,273 116,662 86,735 87,179 Lincoln Tunnel 159,531 156,483 116,052 117,846 George Washington Bridge 449,976 442,904 327,786 324,777 George Washington Bridge Bus Station 1,266 1,474 1,555 1,594 Bayonne Bridge 30,371 30,047 22,864 22,182 Goethals Bridge 116,807 111,037 81,603 85,325 Outerbridge Crossing 111,280 110,387 81,264 79,911 Port Authority Bus Terminal 35,473 33,574 32,630 31,873
Total - Tunnels, Bridges & Terminals 1,023,977 1,002,568 750,489 750,686
RailPATH Rapid Transit 110,465 107,572 98,429 96,970 Journal Square Transportation Center 6,621 6,383 5,968 5,848
Total - Rail 117,086 113,955 104,397 102,818
Port CommercePort Newark 85,164 87,344 84,770 88,540 Elizabeth - PA Marine Terminal 108,518 92,800 87,359 101,617 Brooklyn - PA Marine Terminal 5,034 4,908 4,741 4,872 Red Hook Container Terminal 2,450 1,730 1,775 3,446 Howland Hook Marine Terminal 12,326 11,820 12,058 25,902 Greenville Yard 331 322 322 312 New York & New Jersey Rail, LLC 1,000 - - - PA Auto Marine Terminal 4,948 9,624 8,811 11,972
Total - Port Commerce 219,771 208,548 199,836 236,661
DevelopmentEssex County Resource Recovery Facility 73,931 76,912 72,912 73,210 PA Industrial Park at Elizabeth 998 996 996 933 Bathgate Industrial Park 4,758 4,483 4,440 4,240 Teleport 12,611 14,522 12,760 14,928 Newark Legal & Communications Center 3,706 3,706 3,618 3,691 Ferry Transportation Services 160 160 160 202 Hoboken Waterfront 5,741 6,186 6,132 6,492 Queens West Waterfront 240 2,100 226 1,126
Total Development 102,145 109,065 101,244 104,823
World TradeWorld Trade Center 143,369 148,299 150,572 146,998 WTC Site 550 6,105 383 616 WTC Retail LLC - 3,129 - - Total World Trade 143,919 157,533 150,955 147,614
Port Authority Insurance Captive Entity, LLC - 100 41,377 49
Total Gross Operating Revenues $3,714,628 $3,603,822 $3,306,213 $3,260,649
7

Operating Revenues by Major Category(In Thousands)
Tunnels,Bridges Rail Port World
Total Aviation & Terminals Transit Commerce Development Trade
Rentals $1,507,431 $1,195,146 $34,359 $4,105 $217,547 $47,724 $8,550Tolls and Fares 1,087,441 - 979,516 107,925 - - - Aviation Fees 600,184 600,184 - - - - - Parking 239,847 228,470 10,102 1,275 - - - Other 279,726 83,930 - 3,781 2,224 54,421 135,369
Total $3,714,628 $2,107,730 $1,023,977 $117,086 $219,771 $102,145 $143,919
Rentals - The Port Authority charges a rental fee for the use of its various facilities. There are primarily two types ofrentals, Fixed Rentals, which are generated from leases; and Percentage Rentals, which are generated by percentagefees.
Tolls and Fares - These revenues are a result of tolls imposed at tunnels and bridges and fares charged to passengersof the Port Authority Trans-Hudson railroad system.
Aviation Fees - These fees are based on cost recovery agreements with airlines and are calculated on the basis of directand allocated costs of operating and maintaining public aircraft facilities and the weight of aircraft using the runways.
Parking - The Port Authority charges an hourly or daily rate for the use of parking lots located at the airports andbus terminals.
Other - This includes World Trade Center rent, gate and tipping fees at the Essex County Resource RecoveryFacility and facility rentals related to Special Project Bonds.
Rentals41%
Tolls and Fares29%
Aviation Fees16%
Parking6%
Other8%
8

Uses

USES(In Millions)
2009 2008 2008 2007Budget Estimate Budget Actual
Expenses: Operating Expenses: Operations $827 $796 $776 $705 Security 451 447 453 325 Maintenance 423 449 406 391 Management Services 347 433 348 477 Rent 330 339 338 340 Debt Expense (special project bond interest and operating asset financings) 111 121 121 127 Total Expenses 2,489 2,584 2,442 2,365
Debt Service Charged to Operations & Reserves: Interest on Bonds and Other Obligations 522 441 469 453 Debt Maturities and Retirements 147 152 169 177 Repayment of Asset Financing Obligations 156 147 176 111 Total Debt Service 825 740 814 741
Deferred & Other Expenses 87 47 75 51
Capital Expenditures: Line Departments (including PFCs) 1,454 1,342 1,472 1,366 WTC Site 1,426 980 866 810 Access to the Region's Core (ARC Tunnel) 340 40 - - Regional and Other 85 150 243 173 Total Gross Capital Expenditures 3,305 2,512 2,580 2,349
Total Uses $6,706 $5,883 $5,911 $5,507
$0
$500
$1,000
$1,500
$2,000
$2,500
$3,000
$3,500
2009 Budget 2008 Estimate 2008 Budget 2007 Actual
TotalExpenses
Debt Service toOperations and Reserves
Deferred & Other Expenses
Gross CapitalExpenditures
10

EXPENSES BY FACILITY(In Thousands)
2009 2008 2008 2007Budget Estimate Budget Actual
AviationLaGuardia Airport $204,051 $217,742 $216,187 $210,163John F. Kennedy International Airport 612,114 619,923 583,303 564,007 Newark Liberty International Airport 384,587 389,969 379,158 372,824 Teterboro Airport 19,780 20,795 19,664 15,156 Stewart International Airport 16,006 11,848 8,968 2,616 Port Authority Heliport - 803 931 2,763
Total - Aviation 1,236,538 1,261,080 1,208,211 1,167,529
Tunnels, Bridges & TerminalsHolland Tunnel 61,366 65,117 65,228 62,174 Lincoln Tunnel 80,871 81,615 83,749 79,619 George Washington Bridge 92,866 92,313 90,336 93,711 George Washington Bridge Bus Station 8,428 8,396 8,386 8,067 Bayonne Bridge 15,289 16,031 15,518 16,568 Goethals Bridge 22,697 24,018 25,271 22,836 Outerbridge Crossing 20,539 22,374 22,175 19,392 Port Authority Bus Terminal 86,186 90,940 93,844 84,701
Total - Tunnels, Bridges & Terminals 388,242 400,804 404,507 387,067
RailPATH Rapid Transit 241,276 240,914 213,407 223,106 Journal Square Transportation Center 11,061 10,170 9,625 8,087
Total - Rail 252,337 251,084 223,032 231,194
Port CommercePort Newark 66,908 69,536 66,247 57,794 Elizabeth - PA Marine Terminal 25,840 21,116 23,997 24,696 Brooklyn - PA Marine Terminal 9,630 15,842 10,511 9,940 Red Hook Container Terminal 2,825 2,600 2,992 2,084 Howland Hook Marine Terminal 10,866 9,528 8,748 9,498 Greenville Yard 3 29 29 43 New York & New Jersey Rail, LLC 2,400 - - - PA Auto Marine Terminal 9,446 10,150 4,738 2,992 Total - Port Commerce 127,918 128,801 117,262 107,047
DevelopmentEssex County Resource Recovery Facility 65,767 64,200 64,651 63,255 PA Industrial Park at Elizabeth 122 117 113 110 Bathgate Industrial Park 1,749 2,259 1,840 1,607 Teleport 13,349 14,173 12,797 11,916 Newark Legal & Communications Center 1,375 1,108 1,479 1,369 Ferry Transportation Services 3,517 2,346 6,523 5,563 Hoboken Waterfront 45 26 26 23 Queens West Waterfront 6 16 10 10 Total Development 85,930 84,245 87,439 83,853
World TradeWorld Trade Center 13,490 14,951 14,168 14,676 WTC Site 133,731 172,780 95,096 111,330 WTC Retail LLC 9,647 16,185 16,145 22,202 Total World Trade 156,868 203,916 125,409 148,208
Regional & Other Programs 14,350 19,750 14,150 14,029 Port Authority Insurance Captive Entity, LLC 424 3,174 34,937 261 Total Operating & Maintenance Expenses 2,262,607 2,352,854 2,214,947 2,139,187
Allocated Expenses 187,049 185,654 182,003 180,451 Total Operating Expenses 2,449,656 2,538,508 2,396,950 2,319,638 Operating Asset Obligations 38,590 41,820 40,860 40,787 Net Expenses (Recoverables) related to 9-11-01 750 (443,519) 4,431 4,563 Total Expenses $2,488,996 $2,136,809 $2,442,240 $2,364,988
11

Operating Expenses by Major Category(In Thousands)
Tunnels,Bridges Rail Port World Allocated
Total Aviation & Terminals Transit Commerce Development Trade & Other (1)
Operations $826,978 $438,696 $147,822 $98,590 $33,886 $69,691 $5,998 $32,295Security 451,046 199,472 99,603 51,537 18,431 1,480 17,357 63,166Maintenance 422,839 204,690 78,883 61,463 29,546 2,982 7,744 37,532Management Services 347,123 62,571 29,001 17,065 19,173 4,279 48,773 166,261Rent 329,604 200,993 2,564 2,569 21,507 7,293 72,684 21,994Debt Expense 111,406 72,171 - - - - - 39,235Total $2,488,996 $1,178,593 $357,873 $231,225 $122,542 $85,725 $152,556 $360,483
Operations - Non-maintenance operations spending, including customer service, facility management, facility operations, leases, revenuecollection costs, and utilities.
Security - Providing safe and secure transportation services to the region and nation by vigilance over potential threats, investment ininfrastructure and new technology, and employment of best practices in security and emergency preparedness operations.
Maintenance - Costs incurred to keep property, facility structures and equipment operating at a high level of performance, includingconforming with applicable codes and regulations, thereby preventing injury to life and damage to property.Activities include Electrical, General Maintenance (Elevators and Escalators, Tunnel Subway Pump, Automotive Maintenance andServicing, etc.), Inspections, Mechanical, Janitorial/Grounds Keeping, Snow and Ice Removal, Structural (inspections)
Management Services - Reflects functions that support line business operations as well as agency-widemanagement and includes costs related to agency oversight, departmental management, audit, financial services, human resourcesmanagement, insurance, legal services, planning, public and government affairs, technology support, and training.
Rent - Payments made periodically to governmental agencies and other landlords in return for the use of land, buildings, offices, or otherproperty.
Debt Expense - Includes interest on special project bonds and operating asset acquisition.
(1) Allocated & Other is comprised of police headquarters, staff department and development expenses which are allocated to facilities.
Operations34%
Security18%
Maintenance17%
Management Services14%
Rent13%
Debt Expense4%
12

GENERAL ADMINISTRATIVE EXPENSES(In Thousands)
2009 2008 2008 2007Department / Office Budget Estimate Budget Actual
Audit $9,965 $9,860 $9,859 $9,727Business & Job Opportunity 3,614 3,331 3,195 2,221 Chief Administrative Officer 1,017 1,028 951 1,061 Chief, Capital Planning 2,615 2,076 1,695 2,213 Chief Engineer 3,067 2,776 2,481 2,554 Chief Financial Officer 3,187 2,958 2,958 2,759 Chief Operating Officer 1,630 2,312 2,755 1,556 Chief of Public & Government Affairs 709 468 457 439 Comptroller's 9,504 10,359 9,885 9,997 Chief, Real Estate & Development 1,666 1,517 1,401 1,491 Executive Offices 2,830 2,881 2,555 2,356 Financial Analysis 1,298 1,443 1,443 338 Government & Community Affairs 4,238 4,162 4,883 4,028 Human Resources 17,025 17,780 16,214 17,288 Inspector General 6,875 6,251 5,799 5,748 Labor Relations 2,030 2,556 2,520 2,297 Law 21,243 20,585 21,157 20,999 Management and Budget 8,085 7,722 7,723 5,878 Media Relations 1,741 1,575 1,590 1,257 Office of Environ. Policy, Prog and Comp. 4,239 3,614 3,806 3,429 Office of the Secretary 3,981 3,757 3,763 3,659 Operation Services 5,759 5,489 5,362 5,995 Planning 5,619 5,626 6,133 4,687 Procurement 11,140 10,914 11,687 9,991 Public Affairs 7,045 7,771 7,782 7,418 Real Estate & Development 6,816 6,987 7,526 6,342 Technology Services 47,004 41,869 45,138 45,120 Corporate Enterprise System 15,483 15,935 10,742 9,902 Treasury 10,828 10,208 11,780 19,099 WTC Construction 2,810 2,878 2,878 2,980 Other (Revenue, Reclassifications, etc.) (1,952) (2,283) (1,931) (1,932) Grand Total $221,110 $214,405 $214,185 $210,895
Allocation to Operations $179,983 $177,099 $176,917 $178,750 Allocation to Capital 41,126 37,306 37,268 32,145 Total Allocation $221,110 $214,405 $214,185 $210,895
13

DEVELOPMENT EXPENSES(In Thousands)
2009 2008 2008 2007Budget Estimate Budget Actual
Programs and Studies:
Study and Development Projects $1,651 $754 $1,178 $600 Overseas Operations 1,051 1,022 1,022 979 Other Programs & Studies 64 1,780 1,186 (106) Sub-Total 2,766 3,555 3,386 1,474
Bi-State Dredging Program 4,300 5,000 1,700 228
Total Development Expenses $7,066 $8,555 5,086 $1,701
14

CAPITAL EXPENDITURES BY FACILITY(In Thousands)
2009 2008 2008 2007Budget Estimate Budget Actual
Aviation (including PFCs)LaGuardia Airport $119,746 $135,885 $101,410 $95,078John F. Kennedy International Airport 207,453 248,056 356,601 386,374Newark Liberty International Airport 200,540 190,491 198,129 168,035Teterboro Airport 36,596 28,430 33,076 23,007Stewart International Airport 29,730 10,582 19,000 503 Total - Aviation 594,065 613,444 708,216 672,997
Tunnels, Bridges & TerminalsHolland Tunnel 44,595 12,544 29,734 18,201Lincoln Tunnel 22,375 13,347 21,336 28,215George Washington Bridge 52,810 44,075 44,811 47,652George Washington Bridge Bus Station 1,113 1,337 4,609 900Bayonne Bridge 14,641 10,107 12,224 4,112Goethals Bridge 23,239 20,814 20,464 11,541Outerbridge Crossing 1,421 2,966 5,253 4,011Port Authority Bus Terminal 49,121 47,420 58,863 40,001Total - Tunnels, Bridges & Terminals 209,315 152,610 197,294 154,632
RailPATH Rapid Transit 363,902 225,098 248,632 153,783Journal Square Transportation Center 6,442 9,192 6,381 4,462Total - Rail 370,344 234,290 255,013 158,244
Port CommercePort Newark 72,322 105,725 73,910 92,108Elizabeth - PA Marine Terminal 62,872 76,701 80,565 174,321Brooklyn - PA Marine Terminal 986 465 2,275 861Red Hook Container Terminal - - - 845Howland Hook Marine Terminal 47,882 16,091 28,448 16,493NJ Marine Development 750 251 1,925 - PA Auto Marine Terminal 61,353 96,525 54,353 841Total - Port Commerce 246,165 295,758 241,476 285,470
DevelopmentHoboken Waterfront Development 362 14,278 11,562 5,030Queens West Waterfront Development 11,280 12,121 8,459 9,397Ferry Transportation Services 16,545 12,475 20,455 31,978Teleport 1,803 632 1,117 165Bathgate Industrial Park 360 536 725 - Total - Development 30,350 40,042 42,318 46,571
World Trade CenterWTC Transportation Hub 391,050 386,543 271,528 300,979WTC Retail LLC 110,150 32,800 97,850 16,9811 WTC Freedom Tower 438,150 295,580 268,567 153,277WTC Site (including infrastructure, memorial and VSC) 480,678 259,636 222,010 327,784Total - World Trade Center 1,420,028 974,559 859,955 799,020
Net Capital Expenditures - Line Departments 2,870,267 2,310,703 2,304,272 2,116,934
Access to the Region's Core (ARC Tunnel) 340,000 40,000 40,000 -
Regional & Other Programs: Regional Development Facility 32,900 45,296 109,563 3,080 Other Regional Programs 10,000 64,685 16,546 74,581 New York Economic Development Program 10,000 - 10,000 10,000 Regional Transportation Initiatives 7,000 40,000 43,000 85,793 Total - Regional & Other Programs 59,900 149,981 179,109 173,454
Provision For Study & Development Projects 25,000 - 23,750 - Total Net Capital Expenditures 3,295,167 2,500,684 2,547,131 2,290,389
Add Back - Financial Income/Bond Premiums 9,248 11,477 32,916 59,009
Total Gross Capital Expenditures $3,304,415 $2,512,161 $2,580,047 $2,349,398
15

Revenues, Expenses and Changes in Net Assets Information on Port Authority Operations by Facility
Revenues and ReservesAssets and Liabilities

Revenues, Expenses and Changes in Net Assets(In Thousands)
2009 2008 2008 2007Budget Estimate Budget Actual
Gross Operating Revenues $3,714,628 $3,603,822 $3,306,213 $3,260,649
Expenses:Operating & Maintenance Expenses (2,215,291) (2,277,954) (2,214,947) (2,135,966) Incremental Expenses (47,000) (74,900) - - Total Operating & Maintenance Expenses (2,262,607) (2,352,854) (2,214,947) (2,135,966) Allocated Expenses (187,049) (185,654) (182,003) (180,451) Total Operating Expenses (2,449,656) (2,538,508) (2,396,950) (2,316,417) Operating Asset Obligations (38,590) (41,820) (40,860) (40,787) Net (Expenses) Recoverables related to 9-11-01 (750) 443,519 (4,430) (4,563) Total Expenses (2,488,996) (2,136,809) (2,442,240) (2,361,767)
Net Operating Revenues 1,225,632 1,467,013 863,973 898,882
Depreciation & Amortization (705,228) (632,007) (635,438) (691,869)
Financial Income 72,044 14,622 168,460 208,275
Interest and Other Expenses (425,453) (342,802) (381,059) (414,355)
Net Assets before Restricted Grants, Contributions and PFCs 166,995 506,826 15,936 934
Net PFC Program 149,780 146,867 137,852 221,380
Net Grants and Contributions in Aid of Construction 381,294 412,347 342,316 320,097
1 WTC / WTC Retail Insurance Proceeds 55,405 49,771 - 760,467
Third Party Contributions - WTC Site 72,192 - 90,000 -
Increase in Net Assets $825,666 $1,115,812 $586,104 $1,302,878
17

INFORMATION ON PORT AUTHORITY OPERATIONS BY FACILITY(In Thousands)
Net Income 2009Gross Depreciation Net Before Grants Grants Budget
Operating O&M Allocated & Interest Contributions Contributions Net Income/Revenues Expenses Expenses Amortization & Other Exp. & PFCs & PFCs (Loss)
Aviation LaGuardia Airport $319,046 $204,051 $18,221 $39,722 $19,900 $37,152 $31,129 $68,281 John F. Kennedy International Airport 988,557 612,114 31,678 132,703 78,300 133,762 29,702 163,464 Newark Liberty International Airport 755,876 384,587 27,839 105,818 69,500 168,132 20,668 188,800 Teterboro Airport 35,290 19,780 1,341 10,602 4,000 (433) 5,291 4,858 Stewart International Airport 8,961 16,006 221 490 900 (8,656) 1,100 (7,556) Total - Aviation 2,107,730 1,236,538 79,300 289,335 172,600 329,957 87,890 417,847
Tunnels, Bridges & Terminals Holland Tunnel 119,273 61,366 9,249 17,053 9,000 22,605 231 22,836 Lincoln Tunnel 159,531 80,871 11,267 31,651 14,800 20,942 544 21,486 George Washington Bridge 449,976 92,866 11,764 34,179 22,000 289,167 239 289,406 George Washington Bridge Bus Station 1,266 8,428 884 2,255 - (10,301) 21 (10,280) Bayonne Bridge 30,371 15,289 2,253 6,099 5,500 1,230 46 1,276 Goethals Bridge 116,807 22,697 3,376 13,884 6,000 70,850 67 70,917 Outerbridge Crossing 111,280 20,539 2,713 11,326 3,400 73,302 55 73,357 Port Authority Bus Terminal 35,473 86,186 9,950 22,279 14,000 (96,942) 10,631 (86,311) Total - Tunnels, Bridges & Terminals 1,023,977 388,242 51,456 138,726 74,700 370,853 11,834 382,687
Rail PATH Rapid Transit 110,465 241,276 42,232 90,243 51,000 (314,286) 211,941 (102,345) Journal Square Transportation Center 6,621 11,061 221 6,002 3,000 (13,663) - (13,663) Total - Rail 117,086 252,337 42,453 96,245 54,000 (327,949) 211,941 (116,008)
Port Commerce Port Newark 85,164 66,908 5,086 24,018 15,000 (25,848) 1,061 (24,787) Elizabeth - PA Marine Terminal 108,518 25,840 1,602 39,409 31,000 10,667 9,734 20,401 Brooklyn - PA Marine Terminal 5,034 9,630 663 373 900 (6,532) 34 (6,498) Red Hook Container Terminal 2,450 2,825 221 27 - (623) - (623) Howland Hook Marine Terminal 12,326 10,866 442 14,430 12,000 (25,412) - (25,412) Greenville Yard 331 3 - - - 328 - 328 New York & New Jersey Rail, LLC 1,000 2,400 - - - (1,400) 8,000 6,600 PA Auto Marine Terminal 4,948 9,446 221 2,121 1,600 (8,441) - (8,441) Total - Port Commerce 219,771 127,918 8,235 80,378 60,500 (57,261) 18,829 (38,432)
Development Essex County Resource Recovery Facility 73,931 65,767 42 1,412 (1,969) 8,679 - 8,679 PA Industrial Park at Elizabeth 998 122 7 237 400 232 - 232 Bathgate Industrial Park 4,758 1,749 7 1,439 500 1,063 - 1,063 Teleport 12,611 13,349 221 2,048 700 (3,707) - (3,707) Newark Legal & Communications Center 3,706 1,375 - 3,078 1,200 (1,947) - (1,947) Ferry Transportation Services 160 3,517 - 2,720 2,800 (8,877) - (8,877) Hoboken Waterfront 5,741 45 21 2,282 3,000 393 - 393 Queens West Waterfront 240 6 - 1,300 2,500 (3,566) - (3,566) Total Development 102,145 85,930 298 14,516 9,131 (7,730) - (7,730)
World Trade Center World Trade Center 143,369 13,490 - - (20,296) 150,175 44,069 194,244 WTC Site 550 133,731 5,086 3,303 - (141,570) 120,992 (20,578) WTC Retail LLC - 9,647 221 - (6,172) (3,696) 11,336 7,640 World Trade Center 143,919 156,868 5,307 3,303 (26,468) 4,909 176,397 181,306
Regional and Other - 14,350 - 82,725 52,545 (149,620) 2,000 (147,620) Port Authority Insurance Captive Entity, LLC - 424 (5,008) 4,584 - 4,584 Net Expenses (Recoverables) related to 9-11-01 - - - - 750 (750) - (750) Sub-totals 3,714,628 2,262,607 187,049 705,228 392,750 166,994 508,891 675,885 PFC Program - - - 66,660 - (66,660) 216,440 149,780 Totals $3,714,628 $2,262,607 $187,049 $771,887 $392,750 $100,335 $725,331 $825,666
18

Revenues and Reserves(In Thousands)
2009 2008 2008 2007Budget Estimate Budget Actual
Gross Operating Revenues $3,714,628 $3,603,822 $3,306,213 $3,260,649
Expenses:Operating & Maintenance Expenses 2,215,607 2,304,454 2,214,947 2,135,966Incremental Expenses 47,000 48,400 - - Total Operating & Maintenance Expenses 2,262,607 2,352,854 2,214,947 2,135,966
Allocated Expenses 187,049 185,654 182,003 180,451
Total Operating Expenses 2,449,656 2,538,508 2,396,950 2,316,417Operating Asset Obligations 38,590 41,820 40,860 40,787
Net Expenses (Recoverables) related to 9-11-01 750 (443,519) 4,431 4,563Total Expenses 2,488,996 2,136,809 2,442,240 2,361,767
Net Operating Revenues 1,225,632 1,467,013 863,973 898,882
Financial Income 72,044 14,622 168,460 208,274
Restricted Net Assets - Port Authority Insurance Captive Entity, LLC (3,576) (426) (6,440) (1,354)
Grants and Contributions in aid of Construction 381,294 412,347 343,316 320,097
1 WTC / WTC Retail Insurance Proceeds 387,500 420,300 450,000 305,532
Third Party Contributions - WTC Site 72,192 - 90,000 -
Allocated Passenger Facility Charges 216,440 214,000 200,000 220,583
Net Revenues Available for Debt Service and Reserves 2,351,526 2,527,856 2,109,309 1,952,014
Debt Service:Interest on bonds and other obligations 522,230 440,695 468,925 453,286 Debt maturities and retirements 147,370 152,275 157,275 177,160 Repayment of asset financing obligations 155,400 147,030 187,800 110,424
Total Debt Service 825,000 740,000 814,000 740,870
Increase in Reserves from Operations& Financial Income 1,526,526 1,787,856 1,295,309 1,211,144
Direct Investment in Facilities (1,540,000) (1,460,000) (1,050,000) (808,694)
Appropriation to / (from) Reserves for Self-Insurance - - - (3,220)
Net Increase / (Decrease) in Reserves for Year (13,474) 327,856 245,309 399,230
Reserves, beginning of year 2,500,781 2,172,924 2,157,324 1,773,694
Reserves, end of year $2,487,307 $2,500,781 $2,402,633 $2,172,924
19

ASSETS AND LIABILITIES(Pursuant to Port Authority Bond Resolutions)(In Thousands)
2009 2008 2008 2007Budget Estimate Budget Actual
Assets Invested In Facilities $32,037,182 $28,742,015 $28,510,341 $26,241,331 Cash and Investments 3,773,569 4,175,030 3,096,694 4,205,632 Other Assets 3,521,514 3,570,023 3,803,694 3,883,598
Total Assets 39,332,265 36,487,067 35,410,729 34,330,562
Liabilities Consolidated Bonds 12,045,774 10,793,144 9,424,134 9,495,419 and Notes Other Obligations 2,183,539 2,341,530 4,015,534 3,302,862 Accounts Payable and Other Liabilities 1,553,402 1,630,539 1,851,723 2,706,458
Total Liabilities 15,782,715 14,765,213 15,291,391 15,504,739
Net Assets $23,549,550 $21,721,854 $20,119,338 $18,825,822
Net Assets Are Composed Of:
Facility Infrastructure Investment $20,979,618 $19,138,448 $17,637,300 $16,570,273
Reserves: General Reserve Fund 1,384,223 1,273,612 1,304,081 1,238,915 Consolidated Bond Reserve Fund 1,103,084 1,227,169 1,098,552 934,009Total Reserve Funds 2,487,307 2,500,781 2,402,633 2,172,924
Appropriated Reserves for Self-insurance 82,625 82,625 79,405 82,625
Net Assets $23,549,550 $21,721,854 $20,119,338 $18,825,822
20

Outstanding Obligationsand Financing

SUMMARY OF DEBT TYPE(In Thousands)
2009 Issued/ Repaid/ 2008 Issued/ Repaid/ 2007Type: Budget Accreted Refunded Estimate Accreted Refunded Actual
Consolidated Bonds $12,045,774 $1,400,000 ($147,370) $10,793,144 $1,600,000 ($302,275) $9,495,419
Commercial Paper 274,699 200,000 (147,000) 221,699 112,749 (130,000) 238,950
Variable Rate Master Notes 90,990 - - 90,990 - - 90,990
Versatile Structure Obligations 245,900 - (153,800) 399,700 - (805,900) 1,205,600
PA Equipment Notes 120,485 10,000 (2,000) 112,485 46,900 (27,875) 93,460
Fund Buy-out Obligation 387,087 31,745 (43,211) 398,553 32,636 (43,211) 409,128
Sub-total 13,164,935 1,641,745 (493,381) 12,016,571 1,792,285 (1,309,261) 11,533,547
Special Project Bonds 1,064,378 - (53,725) 1,118,103 - (146,632) 1,264,735
Total Obligations $14,229,313 $1,641,745 ($547,106) $13,134,674 $1,792,285 ($1,455,893) $12,798,282
22


Staffing

BUDGETED POSITIONS 2009 2008 2007
DEPARTMENT Budget Estimate * Actual
EXECUTIVE OFFICES 9 9 9
GENERAL COUNSEL/LAW 136 136 137
INSPECTOR GENERAL 30 30 29 Audit 76 76 78
OFFICE OF THE SECRETARY 16 16 16
CHIEF, PUBLIC & GOVERNMENT AFFAIRS 2 2 2 Government and Community Affairs 13 13 15 Media Relations 11 11 14 Public Affairs 30 30 31
CHIEF ENGINEER/Engineering 572 573 604
PUBLIC SAFETY Office of Emergency Management 19 19 19 Public Safety 1,755 1,755 1,755
CHIEF TECHNOLOGY OFFICER/TECHNOLOGY SERVICES 112 112 123
OPERATING LINE DEPARTMENTS Aviation 981 978 921 Port Commerce 181 179 168 Rail / PATH 1,089 1,088 1,075 Tunnels, Bridges & Terminals 938 940 910
CHIEF, REAL ESTATE & DEVELOPMENT 2 2 2 Real Estate & Development 84 84 71
CHIEF ADMINISTRATIVE OFFICER 9 9 10 Human Resources (including Medical Services) 68 69 70 Labor Relations 12 12 12 Operations Services (including Facility Construction Support) 444 444 445 Operations Standards 7 7 7 Procurement 96 96 96
CHIEF FINANCIAL OFFICER 5 5 8 Comptroller's 105 105 115 Financial Analysis 8 9 -- Management and Budget 43 44 79 Treasury 47 47 51
CHIEF, CAPITAL PLANNING 7 8 6 Business and Job Opportunity 14 13 13 Office of Environmental Policy & Compliance 13 13 8 Planning 26 26 20 Project Management -- -- 162 WTC Construction 122 122 40
CHIEF OPERATING OFFICER 7 7 7 Project Management Office 12 12 -- Security Project Management 26 26 --
TOTAL AUTHORIZED POSITIONS 7,127 7,127 7,128
*Adjusted to reflect the decentralization of the Project Management Department and the reallocation of Engineering positions to support WTC Construction.
25

Activity Highlights
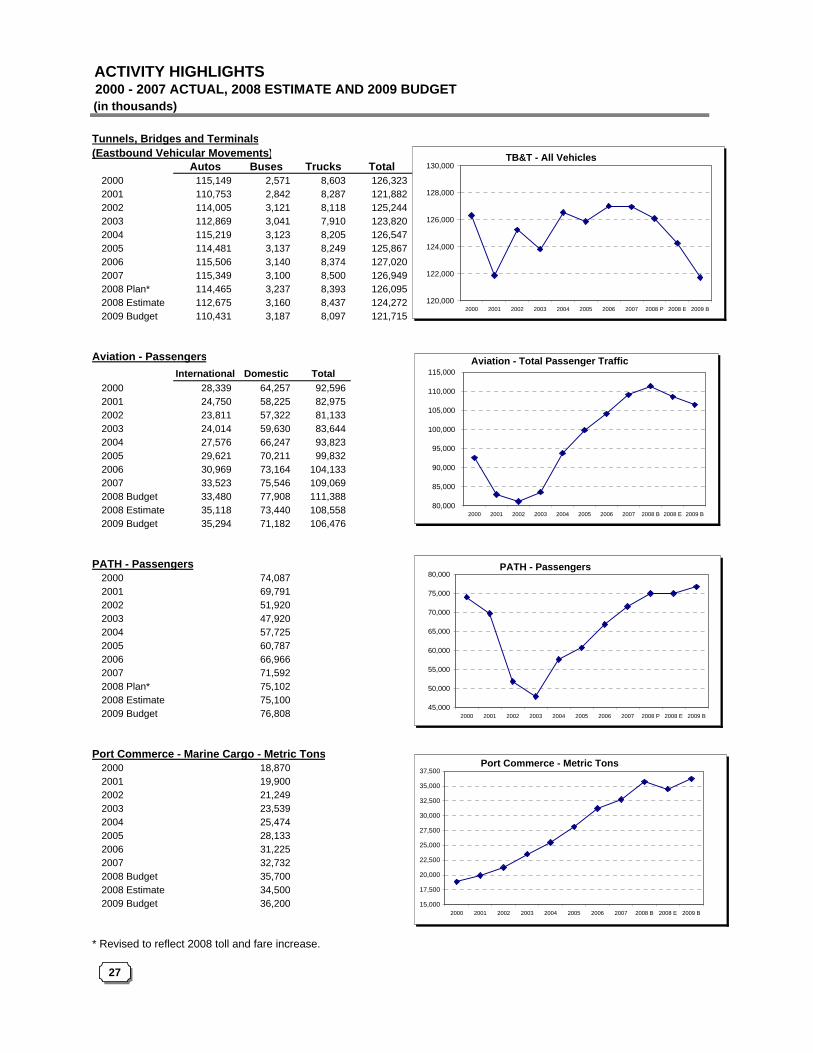
(in thousands)
Tunnels, Bridges and Terminals(Eastbound Vehicular Movements)
Autos Buses Trucks Total2000 115,149 2,571 8,603 126,323 2001 110,753 2,842 8,287 121,882 2002 114,005 3,121 8,118 125,244 2003 112,869 3,041 7,910 123,820 2004 115,219 3,123 8,205 126,547 2005 114,481 3,137 8,249 125,867 2006 115,506 3,140 8,374 127,020 2007 115,349 3,100 8,500 126,949 2008 Plan* 114,465 3,237 8,393 126,095 2008 Estimate 112,675 3,160 8,437 124,272 2009 Budget 110,431 3,187 8,097 121,715
Aviation - PassengersInternational Domestic Total
2000 28,339 64,257 92,596 2001 24,750 58,225 82,975 2002 23,811 57,322 81,133 2003 24,014 59,630 83,644 2004 27,576 66,247 93,823 2005 29,621 70,211 99,832 2006 30,969 73,164 104,133 2007 33,523 75,546 109,069 2008 Budget 33,480 77,908 111,388 2008 Estimate 35,118 73,440 108,558 2009 Budget 35,294 71,182 106,476
PATH - Passengers2000 74,087 2001 69,791 2002 51,920 2003 47,920 2004 57,725 2005 60,787 2006 66,966 2007 71,592 2008 Plan* 75,102 2008 Estimate 75,100 2009 Budget 76,808
Port Commerce - Marine Cargo - Metric Tons2000 18,870 2001 19,900 2002 21,249 2003 23,539 2004 25,474 2005 28,133 2006 31,225 2007 32,732 2008 Budget 35,700 2008 Estimate 34,500 2009 Budget 36,200
* Revised to reflect 2008 toll and fare increase.
ACTIVITY HIGHLIGHTS 2000 - 2007 ACTUAL, 2008 ESTIMATE AND 2009 BUDGET
80,000
85,000
90,000
95,000
100,000
105,000
110,000
115,000
2000 2001 2002 2003 2004 2005 2006 2007 2008 B 2008 E 2009 B
120,000
122,000
124,000
126,000
128,000
130,000
2000 2001 2002 2003 2004 2005 2006 2007 2008 P 2008 E 2009 B
45,000
50,000
55,000
60,000
65,000
70,000
75,000
80,000
2000 2001 2002 2003 2004 2005 2006 2007 2008 P 2008 E 2009 B
15,000
17,500
20,000
22,500
25,000
27,500
30,000
32,500
35,000
37,500
2000 2001 2002 2003 2004 2005 2006 2007 2008 B 2008 E 2009 B
27
TB&T - All Vehicles
Port Commerce - Metric Tons
Aviation - Total Passenger Traffic
PATH - Passengers

2009CapitalBudget

PORT AUTHORITY 2009 CAPITAL SPENDING
SUMMARY BY DEPARTMENTS ($ in thousands)
2009Page Budget
Aviation 2 - 8 594,065$ Development 8 30,350 PATH 9 - 11 370,343 Port Commerce 11 - 14 246,164 Access to the Region's Core 14 340,000 Regional Capital Programs 14 - 15 59,900 Tunnels, Bridges & Terminals 15 - 19 209,314 World Trade Center 19 1,420,028 Projects in Development 19 25,000
Total 3,295,164$

2009PROJECT ID TITLE CATEGORY BUDGET
AVIATIONCA02-LaGUARDIA AIRPORTAERONAUTICAL
CA02-083 AIRCRAFT RESCUE FF - BUILDING AND TECHNOLOGICAL SYSTEMS SEP 10,593$ CA02-138 RUNWAY 4-22 OVERLAY AND TAXIWAY REHAB SGR 13,000 CA02-340 RUNWAY DECK STRUCTURAL REHAB PHASE III SGR 1,940 CA02-341 TAXIWAY PAVEMENT & LIGHTING REHABILITATION SGR 496 CA02-342 AIRFIELD LIGHTING UPGRADE SGR 100 CA02-343 REHAB CTB CONCOURSE ALLEYWAY PAVEMENT SGR 285 CA02-351 INSTRUMENT LANDING SYSTEM PIERS SGR 93
26,506
INFRASTRUCTURECA02-053 SCHOOL SOUNDPROOFING - PHASE III MAND 15,000 CA02-063 REMOVAL OF LOW TO HIGH PRESSURE CROSSOVER CONNECTIONS MAND 729 CA02-075 REHAB OF CTB AIR HANDLING UNITS SGR 3,343 CA02-076 UPGRADE HVAC IN CTB EAST SGR 1,000 CA02-079 CTB UPGRADE OF HOTWATER CONVERTER SYS IN MER NO. 1, 2, & 4 SGR 1,430 CA02-080 REHAB OF SANITARY EJECTOR PITS AT CTB SGR 1,829 CA02-081 CTB UPGRADE OF HOTWATER CONVERTER SYSTEM IN MER NO. 3 SGR 784 CA02-084 REHAB OF UTILITIES EAST OF CTB SGR 254 CA02-096 CH&RP CHILLER NO. 3 SGR 420 CA02-185 RUNWAY SAFETY ENHANCEMENTS MAND 197 CA02-189 FIRE PUMP STATION UPGRADE SGR 8,000 CA02-193 CTB CONCOURSES-CONCRETE PLANK REHAB SGR 197 CA02-227 REHAB 22 ELECTRICAL TRANSFORMERS SGR 1,325 CA02-247 PROVISION FOR QUEENS PROJECT MAND 461 CA02-336 PUMP HOUSE 4 & 5 UPGRADE SGR 405 PA02-001 CAPITAL MAJOR WORK PROGRAM SGR 6,672
42,045
LANDSIDECA02-078 REHAB OF STRUCTURES L1 AND L2 SGR 4,143 CA02-348 AIR TERMINAL HIGHWAY REHAB SGR 1,167
5,310
SECURITYCA02-114 INSTALLATION OF BOLLARDS AT TENANT TERMINALS SEC 120 CA02-231 PERIMETER INTRUSION DETECTION SYSTEM SEC 8,692 CA02-246 TERMINAL SECURITY ENHANCEMENTS SEC 1,592 CA02-249 800 MHZ RADIO SYSTEM SEC 790 CA02-330 INSTALLATION OF BIOMETRIC SYSTEM SEC 215 CA02-331 PERIMETER HARDENING SEC 1,202 CA02-332 INSTALLATION OF BOLLARDS SEC 9,024 CA02-333 INSTALLATION OF UNMANNED SECURITY GATES SEC 784
THE PORT AUTHORITIY OF NEW YORK & NEW JERSEY2009 CAPITAL SPENDING
($ in thousands)SORTED BY DEPARTMENT, FACILITY AND PROGRAM
Page 2 of 19

2009PROJECT ID TITLE CATEGORY BUDGET
THE PORT AUTHORITIY OF NEW YORK & NEW JERSEY2009 CAPITAL SPENDING
($ in thousands)SORTED BY DEPARTMENT, FACILITY AND PROGRAM
CA02-337 LGA SECURITY PROTOTYPE PROJECTS SEC 971 CA02-059 IN LINE BAGGAGE SCREENING PROGRAM SEC 4,000
27,391
TERMINALSCA02-004 CTB - UPGRADE 19 HVAC CONCOURSE CORRIDORS UNITS SGR 3,807 CA02-250 CTB ROOF REPLACEMENT & STRUCTURAL REHAB. SGR 384 CA02-251 CTB ARRIVALS LEVEL ROOF (ROADWAY) REHAB. SGR 1,803 CA02-339 CTB MODERNIZATION RPP 12,500
18,494
CA02-LaGUARDIA AIRPORT 119,746
CA03-KENNEDY AIRPORTAERONAUTICAL
CA03-019 REHAB CTA ROADWAY MILL & OVERLAY SGR 500 CA03-023 REHAB NORTH BOUNDARY & EASTERN ROADS MILL & OVERLAY SGR 698 CA03-026 REHAB SOUTH SERV CT & NORTH SERV CARGO RD-MILL&OVERLAY SGR 300 CA03-027 REHAB TAXIWAY C-MILL & OVERLAY SGR 987 CA03-029 REHAB TAXIWAY F-MILL & OVERLAY SGR 400 CA03-032 REHAB TAXIWAYS FA & FB- MILL & OVERLAY SGR 501 CA03-033 TAXIWAY Q SLAB REHAB SGR 4,618 CA03-082 TAXIWAY YA EXTENSION (JFK DELAY REDUCTION) SEP 6,508 CA03-083 TAXIWAY FB EXTENSION - ZA to E (JFK DELAY REDUCTION) SEP 1,596 CA03-087 TAXIWAY KK EXTENSION (JFK DELAY REDUCTION) SEP 2,276 CA03-088 TAXIWAY J PAD (JFK DELAY REDUCTION) SEP 2,313 CA03-089 TAXIWAY P PAD (JFK DELAY REDUCTION) SEP 2,008 CA03-373 REHAB T/W A & B PHASE 3 SGR 1,940 CA03-376 REHAB TAXIWAY S, SC, SD & SR SGR 9,813 CA03-381 REHAB TAXIWAY E SGR 2,459 CA03-514 REHAB RUNWAY 13R-31L SGR 39,172 CA03-517 REHAB OF RUNWAY 4L-22R SGR 1,033 CA03-564 REHAB TAXIWAYS Y & PORTION OF T/W F, H,G,J- MILL & OVERLAY SGR 4,921 CA03-565 CONSTRUCT CENTRALIZED DE-ICING FACILITY RPP 986 CA03-575 REHAB RVSR INTERIOR MILL & OVERLAY SGR 990 CA03-576 RESTRICTED VEHICLE SVS RD BRIDGES SEP 988
85,005
INFRASTRUCTURECA03-001 INSTALL BACKFLOW PREVENTERS AND METER UPGRADES–PHASE II MAND 1,014 CA03-016 EMERGENCY FUEL SHUTOFF SYSTEM MAND 664 CA03-039 HIGH PRESSURE VALVE REPLACEMENT PH III SGR 653 CA03-043 REHAB BULK FUEL FARM COMMISSARY ROAD-MILL & OVERLAY SGR 401 CA03-078 SCHOOL SOUNDPROOFING - PHASE III MAND 7,646 CA03-080 INSTALL BACKFLOW PREVENTERS AND METER UPGRADES–PHASE I MAND 2,015
Page 3 of 19

2009PROJECT ID TITLE CATEGORY BUDGET
THE PORT AUTHORITIY OF NEW YORK & NEW JERSEY2009 CAPITAL SPENDING
($ in thousands)SORTED BY DEPARTMENT, FACILITY AND PROGRAM
CA03-112 CENTRAL SUBSTATION REHAB (A,B,C&D) RPP 207 CA03-339 REHAB BFF FUEL TANK BOTTOMS AND ROOFS - PHII MAND 1,470 CA03-380 BUILDING 161 FIRE PUMP STATION REHAB SGR 1,753 CA03-414 PROVISION FOR QUEENS PROJECTS MAND 1,000 CA03-538 REPLACE JFK OVERHEAD B-14 DOORS SGR 1,171 CA03-539 REPLACEMENT OF GEOCOMPOSITE LINERS AT BFF MAND 1,193 CA03-540 BUILDING 215 NEW ROOF SYSTEM SGR 2,083 CA03-541 REPLACEMENT OF EMERGENCY TELEPHONE SEP 1,842 CA03-567 H15 ROOF REHAB SGR 315 CA03-573 BUILDING 254 GEOTHERMAL SEP 500 CA03-574 BLDG 156 (CONTROL TOWER) ROOFING SGR 352 PA03-001 CAPITAL MAJOR WORK PROGRAM SGR 9,746
34,026
LANDSIDECA03-346 REHAB VAN WYCK ROADWAY SGR 857
857
CA03-141 INSTALLATION OF BOLLARDS AT TENANT TERMINALS SEC 460 CA03-389 AIRPORT PERIMETER SECURITY SEC 6,973 CA03-390 AOA GUARD POST SECURITY ENHANCEMENTS SEC 1,512 CA03-391 INSTALL COMPUTERIZED ACCESS CONTROL SYSTEM SEC 1,531 CA03-420 800MHZ RADIO SYSTEM SEC 2,797 CA03-505 INSTALLATION OF BIOMETRIC SYSTEM SEC 394 CA03-506 PERIMETER HARDENING SEC 3,258 CA03-507 INSTALLATION OF UNMANNED SECURITY GATES SEC 345 CA03-510 JFK SECURITY PROTOTYPE PROJECTS SEC 946 CA03-146 IN LINE BAGGAGE SCREENING PROGRAM SEC 4,000
22,215
TERMINALSCA03-008 CUSTOMER SERVICE INITIATIVES SEP 2,333 CA03-053 CTA DEVELOPMENT (PROGRAM WIDE) RPP 5,090 CA03-071 TWA FLIGHT CENTER SOUNDPROOFING/ASBESTOS ABATEMENT RPP 203 CA03-072 TWA FLIGHT CENTER EXTERIOR RENOVATION RPP 5,244 CA03-075 TWA FLIGHT CENTER INTERIOR RENOVATION RPP 5,122
17,992
CA03-KENNEDY AIRPORT 160,094
Page 4 of 19

2009PROJECT ID TITLE CATEGORY BUDGET
THE PORT AUTHORITIY OF NEW YORK & NEW JERSEY2009 CAPITAL SPENDING
($ in thousands)SORTED BY DEPARTMENT, FACILITY AND PROGRAM
CA32-KENNEDY AIRPORT REDEVELOPMENTTERMINALS
CA32-048 NEW DOMESTIC TERMINAL RPP 40,258 40,258
CA32-KENNEDY AIRPORT REDEVELOPMENT 40,258
CA39-JFK AIRTRAINCA39-001 JFK AIRTRAIN SEP 7,101
CA39-JFK AIRTRAIN 7,101
KENNEDY AIRPORT TOTAL 207,453
CA04-NEWARK LIBERTY AIRPORTAERONAUTICAL
CA04-285 TAXIWAY FILLET IMPROVEMENTS SEP 4,229 CA04-309 EWR - NAVIGATION AID IMPROVEMENTS SEP 8,440 CA04-396 REHAB RUNWAY 11-29 SGR 10,295 CA04-405 REHAB B2 & B3 RAMP SGR 164 CA04-457 RVSR LIGHTING IMPROVEMENTS TERM B AND C SGR 711
23,839
INFRASTRUCTURECA04-036 CH&RP - REPLACE TRANSFORMERS SGR 1,750 CA04-037 FUEL FARM-REHAB TANK CONTAINMENT DIKES SGR 2,808 CA04-038 CH&RP - REPLACE CHILLERS RPP 427 CA04-041 SCHOOL SOUNDPROOFING PHASE III MAND 8,054 CA04-042 CONSTRUCT RENEWABLE ENERGY FACILITIES RPP 200 CA04-073 TERM B FIRE ALARM SYSTEM UPGRADE MAND 1,989 CA04-320 REHAB OF SWITCH HOUSE #2 SGR 2,765 CA04-468 COMPLETE 27KV LOOP - CTA SEP 500 CA04-472 INSTALL FIBER OPTIC INFRASTRUCTURE SEP 201 PA04-001 CAPITAL MAJOR WORK PROGRAM SGR 28,286
46,979
LANDSIDECA04-248 MONORAIL MID LIFE OVERHAUL - VEHICLE SUB MAND 3,000 CA04-287 IMPROVEMENTS TO BREWSTER & N. A/P EXIT SGR 3,246 CA04-288 IMPROVE PORT ST & N.AREA EXIT SEP 831 CA04-306 REFURBISH CTA TOLL PLAZA SGR 3,483 CA04-315 AIRTRAIN - VEHICLE BODIES REPLACEMENT MAND 222 CA04-461 REHAB PAVEMENT PARKING LOT F SGR 3,260 CA04-651 SOUTHERN ROADWAY ACCESS SEP 956
14,998
Page 5 of 19

2009PROJECT ID TITLE CATEGORY BUDGET
THE PORT AUTHORITIY OF NEW YORK & NEW JERSEY2009 CAPITAL SPENDING
($ in thousands)SORTED BY DEPARTMENT, FACILITY AND PROGRAM
SECURITYCA04-286 EWR SECURITY PROJECTS - MISCELLANEOUS SEC 765 CA04-316 PERIMETER SECURITY SYSTEM SEC 10,225 CA04-318 ELECTRICAL SUBSTATION SECURITY ENHANCEMENT SEC 178 CA04-319 TERMINAL SECURITY ENHANCEMENTS SEC 1,166 CA04-395 800 MHZ RADIO SYSTEM SEC 981 CA04-397 INSTALLATION OF BIOMETRIC SYSTEM SEC 725 CA04-398 INSTALLATION OF BOLLARDS SEC 5,842 CA04-399 PHYSICAL ENHANCEMENT OF AOA PERIMETER SEC 2,079 CA04-400 INSTALLATION OF UNMANNED SECURITY GATES SEC 1,735 CA04-482 INSTALLATION OF BOLLARDS AT TENANT TERMINALS SEC 120 CA04-481 IN LINE BAGGAGE SCREENING PROGRAM SEC 2,000
25,817
TERMINALSCA04-034 CUSTOMER SERVICE INITIATIVES SEP 950 CA04-078 TERM B REHAB OF SATELLITE FEEDERS AND SWITCHGEAR MAND 3,370 CA04-079 TERM B REPLACE AC12, AC13 AND HOT WATER HEATING SYS PUMPS MAND 3,850 CA04-222 TERMINAL A VERTICAL CIRCULATION SEP 2,921 CA04-473 TERMINAL B REHAB ELECT. & MECH. SYSTEMS PHASE II SGR 666
11,757
CA04-NEWARK LIBERTY AIRPORT 123,391
CA44-NEWARK LIBERTY REDEVELOPMENTLANDSIDE
CA44-002 CTA ACCESS ROADS RPP 250 250
TERMINALSCA44-010 TERMINAL A MODERNIZATION RPP 12,500 CA44-017 TERMINAL B LOWER LEVEL EXPANSION & B1 VERTICAL CIRC. RPP 16,470 CA44-018 TERMINAL B UPPER LEVEL INTERNATIONAL DEPARTURES RPP 10,326 CA44-020 TERMINAL B MID-LEVEL DOMESTIC CHECK-IN RPP 8,399 CA44-021 TERMINAL B IN-LINE BAGGAGE SCREENING RPP 1,883 CA44-025 TERMINAL B CONNECTOR EXPANSION RPP 25,604 CA44-026 TERMINAL B MID-LEVEL INTERNATIONAL MEETER/GREETER RPP 1,717
76,899
CA44-NEWARK LIBERTY REDEVELOPMENT 77,149
NEWARK LIBERTY AIRPORT TOTAL 200,540
Page 6 of 19

2009PROJECT ID TITLE CATEGORY BUDGET
THE PORT AUTHORITIY OF NEW YORK & NEW JERSEY2009 CAPITAL SPENDING
($ in thousands)SORTED BY DEPARTMENT, FACILITY AND PROGRAM
CA05-TETERBORO AIRPORTAERONAUTICAL
CA05-085 REHAB RUNWAY 1-19 SGR 525 CA05-086 REHAB RUNWAY 6-24 SGR 8,501 CA05-089 REHAB TAXIWAY A SGR 552 CA05-106 PAVEMENT REMOVAL OF APRON AREA MAND 1,142 CA05-107 ENGINEERING MATERIAL ARRESTOR SYSTEM FOR R/W 1-19 MAND 1,747 CA05-108 REDNECK AVENUE RELOCATION MAND 5,598
18,065
INFRASTRUCTURECA05-023 SCHOOL SOUNDPROOFING MAND 3,508 CA05-081 CONSTRUCTION OF SNOW EQUIPMENT BUILDING SEP 351 PA05-001 CAPITAL MAJOR WORK PROGRAM SGR 5,702
9,561
SECURITYCA05-041 IMPROVE PERIMETER SECURITY FENCING SEC 1,408 CA05-049 AIRPORT PERIMETER SECURITY ENHANCEMENT SEC 4,765 CA05-066 800 MHZ RADIO SYSTEM SEC 2,383 CA05-067 PHYSICAL ENHANCEMENT OF AOA PERIMETER SEC 202 CA05-068 INSTALLATION OF UNMANNED SECURITY GATES SEC 212
8,970
CA05-TETERBORO AIRPORT 36,596
CA06-STEWART AIRPORTAERONAUTICAL
CA06-010 REHABILITATE TAXIWAY LIGHTING SGR 500 CA06-020 GATE ELECTRIFICATION SEP 2,956 CA06-028 APPROACH LIGHTING, FIXTURES & CABLES SGR 907
4,363
INFRASTRUCTURECA06-004 REPLACE AIRPORT WEATHER INSTRUMENTATION POWER CIRCUIT SGR 5,630 CA06-012 RELOCATE OPERATIONS CONTROL CENTER SEP 100 CA06-026 FIRST STREET SANITARY WASTE PIPE REPLACEMENT SGR 905 CA06-029 LT PARKING LOT EXPANSION AND STEWART BLVD REALIGNMENT SGR 10,329 CA06-036 BUILDINGS 138, 140, 142 ROOF REPLACEMENT SGR 1,010 CA06-038 BUILDINGS 2290 ROOF REPLACEMENT SGR 296 CA06-041 WETLANDS MAPPING FOR SITE PREPARATION FOR LAND DEVELOPING SGR 300 PA06-001 CAPITAL MAJOR WORK PROGRAM SGR 553
19,123
Page 7 of 19

2009PROJECT ID TITLE CATEGORY BUDGET
THE PORT AUTHORITIY OF NEW YORK & NEW JERSEY2009 CAPITAL SPENDING
($ in thousands)SORTED BY DEPARTMENT, FACILITY AND PROGRAM
LANDSIDECA06-039 REHAB OF BRUENIG ROAD AND 1ST, 2ND AND Y STREETS SGR 2,660 CA06-040 REHAB OF CARGO ROAD AND PARKING AREA FOR BUILDING 2290 SGR 1,480
4,140
TERMINALSCA06-007 TERMINAL IMPROVEMENTS RPP 1,200 CA06-037 TERMINAL BUILDING ROOF REPLACEMENT SGR 904
2,104
CA06-STEWART AIRPORT 29,730
AVIATION TOTAL 594,065
DEVELOPMENTCD05-BATHGATE INDUSTRIAL PARK
PD05-001 CAPITAL MAJOR WORK PROGRAM SGR 360 CD05-BATHGATE INDUSTRIAL PARK 360
CD11-HOBOKEN WATERFRONTINFRASTRUCTURE
CD11-011 HOBOKEN BLOCK B DEVELOPER MAND 362 362
CD11-HOBOKEN WATERFRONT 362 CD12-QUEENS WESTINFRASTRUCTURE
CD12-008 QUEENS WEST - STAGE 2 PROPERTY & DEVELOPMENT MAND 11,280 11,280
CD12-QUEENS WEST 11,280
CH02-FERRY TRANSPORTATIONINFRASTRUCTURE
CH02-006 HOBOKEN PERMANENT FERRY TERMINAL SEP 14,419 CH02-016 AIRPORT LANDINGS SEP 2,126
16,545
CH02-FERRY TRANSPORTATION 16,545
CW03-TELEPORTPW03-001 CAPITAL MAJOR WORK PROGRAM SGR 1,803
CW03-TELEPORT 1,803
DEVELOPMENT TOTAL 30,350
Page 8 of 19

2009PROJECT ID TITLE CATEGORY BUDGET
THE PORT AUTHORITIY OF NEW YORK & NEW JERSEY2009 CAPITAL SPENDING
($ in thousands)SORTED BY DEPARTMENT, FACILITY AND PROGRAM
PATHCR02-PATHCARS
CR02-215 PA-1, 2 & 3 RAILCAR OVERHAUL SGR 10,244 CR02-304 PA4 CARS - REPLACE DOOR FRAMES, COMPRESSORS SGR 4,390 CR02-345 PURCHASE 340 NEW PA5 CARS SGR 126,784 CR02-406 MASTER PLAN FOR NEW RAILCARS SGR 2,938
144,357
INFRASTRUCTRECR02-024 COMPRESSED AIR SYSTEM SGR 751 CR02-189 REHAB OUTDOOR OIL CIRCUIT BREAKERS SGR 429 CR02-259 INSTALL OF CONTINUOUS WELDED RAIL SYSTEM SGR 1,201 CR02-290 PATH EXTENSION TO EWR STUDY SEP 2,254 CR02-328 TUNNEL DRAINAGE SYSTEM - PHASE II SGR 4,577 CR02-353 SUBSTATION 2 EMERG. DIESEL GEN & OIL TANK REPLACEMENT SGR 61 CR02-412 DUCT BANK REHABILITATION - PLANNING SGR 2,439 CR02-421 TUNNEL ELECTRICAL LIGHTING SYSTEM SGR 757 CR02-425 REPLACE 27KV CABLES BETWEEN SUBSTATION #2 AND #15 SGR 343 CR02-233 WASHINGTON ST SUBSTATION SEP 2,211 CR02-336 CHRISTOPHER ST SUBSTATION REPLACEMENT AND UPGRADE SGR 3,515 CR02-378 SUBSTATION UPGRADE #8 ( WAS 7,8&9 IN APP PLAN) SGR 1,982 CR02-462 SUBSTATION UPGRADE # 7 SGR 2,880 CR02-463 SUBSTATION UPGRADE #9 SGR 858 PR02-001 CAPITAL MAJOR WORK PROGRAM SGR 14,250
38,507
SECURITYCR02-394 800 MHZ RADIO PROGRAM - POLICE SEC 15,654
15,654
SIGNALS/COMMUNICATIONSCR02-150 SIGNAL REPLACEMENT PROGRAM - INSTALL SGR 10,988 CR02-339 SIGNAL REPLACEMENT PROGRAM - DEMO SGR 1,884
12,872
STATION MODERNIZATION PROGRAMCR02-226 PATH NEW FARE COLLECTION SYSTEM SEP 954 CR02-253 COMPREHENSIVE SIGNING STATIC SEP 2,937 CR02-284 EXCHANGE PLACE EMERGENCY EXIT - 10 CAR MAND 4,360 CR02-306 NEWARK PENN PLATFORM IMPROVEMENTS - 10 CAR SGR 205 CR02-312 CONSTRUCT PATH 9TH ST ENTRANCE SEP 1,730 CR02-313 CHRISTOPHER STREET NEW ENTRANCE SEP 1,671
Page 9 of 19

2009PROJECT ID TITLE CATEGORY BUDGET
THE PORT AUTHORITIY OF NEW YORK & NEW JERSEY2009 CAPITAL SPENDING
($ in thousands)SORTED BY DEPARTMENT, FACILITY AND PROGRAM
CR02-407 GROVE STREET 10 CAR PLATFORM WITH HANDICAP ACCESS MAND 1,461 CR02-440 PATHVISION & PUBLIC ADDRESS SYSTEM REPLACEMENT SGR 1,566 CR02-442 NEWARK PENN STATION MODERNIZATION IMPROVEMENTS SGR 850 CR02-443 JOURNAL SQUARE STATION MODERNIZATION IMPROVEMENTS SGR 374 CR02-447 HOBOKEN CORRIDOR MODERNIZATION IMPROVEMENTS SGR 1,166 CR02-448 NEW MAP INFORMATION DISPLAY BOARDS SGR 795 CR02-451 PAVONIA/NEWPORT WATERPROOFING SGR 915 CR02-456 EXTEND RUNNING REPAIR SHOP SEP - CR02-458 HARRISON STATION - 10 CAR PLATFORM SEP 4,807
23,791
TRACKSCR02-212 TIE REPLACEMENT IN OUTSIDE AREAS SGR 2,591 CR02-214 TUNNEL TURNOUT REHAB - PHASE II SGR 1,673 CR02-227 TRACK CIRCUIT REHAB - PORTAL TO JSQ SGR 527 CR02-258 REPLACEMENT OF TURNOUTS-PH III SGR 3,644 CR02-261 REPLACE OF 3RD RAIL SGR 2,010 CR02-380 REPLACE DOCK BRIDGE MITER RAILS SGR 550 CR02-403 TEST TRACK FOR NEW RAILCARS SGR 323
11,317
CR02-PATH 246,498
CR08-PATH SAFETYINFRASTRUCTURE
CR08-022 VENT SYSTEM - FAN BLADE REPLACEMENT SGR 1,001 1,001
SECURITYCR08-044 SONET NETWORK SEC 78 CR08-045 ACCESS CONTROL KELTRON REPLACEMENT SEC 70 CR08-050 INTRUSION PROTECTION JSTC & GROVE ST. SEC 1,318 CR08-051 SECURITY & CONTROL CENTER BUILDING SEC 17,936 CR08-058 PURCHASE EMERGENCY RESPONSE EQUIPMENT - UTV SEC 2,311 CR08-061 INSTALL DIGITAL VIDEO RECORDING SYSTEM SEC 815 CR08-065 CCTV & ACCESS CONTROL - EXCHANGE PLACE SEC 996 CR08-066 EXCHANGE PLACE LAND SIDE SECURITY SEC 1,170 CR08-067 RAM BARRIER / GUARD BOOTH - JSTC SEC 828 CR08-068 JSTC HARDENING & PHYSICAL PROTECTION SEC 2,058 CR08-069 PATH PERIMETER FENCING SEC 615 CR08-070 JSTC TOWER INTRUSION PROTECTION - INFOGRAPHICS SEC 40 CR08-078 FLOOD GATES / FLOOD MITIGATION SEC 22,959 CR08-079 TUNNEL EXTERIOR MITIGATION SEC 55,269 CR08-080 INSTALL (LIDS) LASER INTRUSION DET. SYS @ PAV, HOB & CHRIS. ST. SEC 1,749 CR08-086 HCMF - SECONDARY ROADWAY SEC 77
Page 10 of 19

2009PROJECT ID TITLE CATEGORY BUDGET
THE PORT AUTHORITIY OF NEW YORK & NEW JERSEY2009 CAPITAL SPENDING
($ in thousands)SORTED BY DEPARTMENT, FACILITY AND PROGRAM
CR08-087 UPGRADE BADGING SEC 643 CR08-088 INTEGRATED SECURITY SYSTEMS AND GRAPHIC USER INTERFACE SEC 1,249
110,182
STATIONSCR08-041 WASHINGTON STREET EMERGENCY EXIT SEP 597
597
TRACKSCR08-060 INSTALLATION OF TUNNEL BARRIER DOOR MAND 5,625
5,625
CR08-PATH SAFETY 117,404
CR21-JOURNAL SQUAREINFRASTRUCTURE
CR21-032 JSTC - BUS TERM. ESCALATOR REPLACEMENT SGR 1,149 PR21-001 CAPITAL MAJOR WORK PROGRAM SGR 624
1,773
STATIONSCR21-034 JSTC BUILDING RENOVATIONS SEP 739 CR21-054 REPLACE SIX AIR HANDLERS AT JSTC SGR 1,525 CR21-058 CONCOURSE CEILING REPLACEMENT SGR 456 CR21-064 JSTC REDEVELOPMENT - STUDY SEP 802 CR21-068 UPGRADE PATH PAPD COMMAND AT JSTC SEC 1,146
4,668
CR21-JOURNAL SQUARE 6,442
PATH TOTAL 370,343
PORT COMMERCECP05-PORT NEWARKDEVELOPMENT
CP05-152 EXPORT CALCUTTA IMPROVEMENTS SEP 1,011 1,011
DREDGINGCP05-120 CONSOLIDATE PROJECT TO 50 FT-NJ,PJ,AMB MAND 21,000
21,000
Page 11 of 19

2009PROJECT ID TITLE CATEGORY BUDGET
THE PORT AUTHORITIY OF NEW YORK & NEW JERSEY2009 CAPITAL SPENDING
($ in thousands)SORTED BY DEPARTMENT, FACILITY AND PROGRAM
INFRASTRUCTURECP05-134 BERTH 8 & 10 REPLACEMENT SGR 10,081 CP05-154 CORBIN & TYLER STREETS INTERSECTION IMPROVEMENTS SEP 2,874 CP05-155 PORT STREET AND DOREMUS SEP 719 CP05-156 PORT STREET AND PORT STREET CONNECTOR SEP 1,824 CP05-169 BERTHS 36 & 63 WHARF RECONSTRUCTION SGR 4,106 CP05-172 BERTH 6 REPLACEMENT SGR 5,506 CP05-191 BACKFLOW PREVENTERS SGR 936 CP05-192 WAREHOUSE REHAB OR DEMOLITION AT NJMT SGR 837 CP05-193 UPGRADE WATER LINES AT NJMT SGR 1,965 PP05-001 CAPITAL MAJOR WORK PROGRAM SGR 3,872
32,719
INTERMODALCP05-073 EXPRESSRAIL/CORBIN INTRMOD R-SUPPORT 1A RPP 28 CP05-083 CONRAIL PAYMENT RPP 1,763 CP05-129 EXPRESSRAIL/CORBIN INTERMOD R-SUPPORT 1B RPP 10,565 CP05-148 EXPRESSRAIL/CORBIN INTERMOD R-SUPPORT IIA RPP 564 CP05-149 EXPRESSRAIL/CORBIN INTERMD R-SUPPORT IIB RPP 430 CP05-195 CORBIN STREET FLYOVER RPP 1,484 CP05-196 PORT NEWARK INTERMODAL ADMIN BUILDING RPP 111 CP05-197 UTILITIES- EXPRESSRAIL/CORBIN INTRMOD R-SUPPORT 1A RPP 100
15,045
ROADWAYSCP05-187 PORT STREET CAPACITY IMPROVEMENT RPP 2,000
2,000
SECURITYCP05-122 CCTV MONITOR SYSTEM & OPERATIONS CENTER SEC 2,789 CP05-124 PORT SECURITY PROGRAM - BADGE, ID SYSTEM SEC 864
3,653
CP05-PORT NEWARK 75,428
CP08-PORT AUTHORITY MARINE TERMINAL AT ELIZABETHDEVELOPMENT
CP08-071 MAHER TERMINAL - PA FUNDED TENANT IMPROVEMENTS RPP 2,000 CP08-087 MAERSK TERMINAL - PA FUNDED TENANT IMPROVEMENTS RPP 194
2,194
DREDGINGCP08-111 UTILITIES RELOCATION KVK/NB 50' CHANNEL MAND 8,797 CP08-112 CONSOLIDATED PROJECT TO 50 FEET-NJ-PJ, MAND 21,000
29,797
Page 12 of 19

2009PROJECT ID TITLE CATEGORY BUDGET
THE PORT AUTHORITIY OF NEW YORK & NEW JERSEY2009 CAPITAL SPENDING
($ in thousands)SORTED BY DEPARTMENT, FACILITY AND PROGRAM
INFRASTRUCTUREPP08-001 CAPITAL MAJOR WORK PROGRAM SGR 2,757
2,757
INTERMODALCP08-115 MCLESTER ST DUAL LEAD TRACK/ROAD RECONFIG. RPP 5,207 CP08-124 EXPRESSRAIL PHASE II CONSTRUCTION RPP 25 CP08-128 EXPRESSRAIL PHASE III RPP 343 CP08-140 UTILITIES - EXPRESSRAIL ELIZ. LEAD TRACKS & SOUTH BAY AVE. RPP 1,955
7,530
ROADWAYSCP08-086 MCLESTER ST. CURVE REALIGNMENT SEP 9,899 CP08-096 MCLESTER STREET ROADWAY WIDENING SEP 2,834 CP08-127 NORTH AVE ROADWAY CAPACITY IMPROVEMENTS SEP 1,999 CP08-139 UTILITY RELOCATION MCLESTER STREET WIDENING SEP 2,862
17,594
CP08-PORT AUTHORITY MARINE TERMINAL AT ELIZABETH 59,872
CP09-BROOKLYN PIERSINFRASTRUCTURE
CP09-105 REHABILITAITON OF PILES AT PIERS 7, 8 & 9B SGR 1,000 CP09-106 REPLACE BULKHEAD BETWEEN 7 AND 8 SGR 394 CP09-108 CRUISE TERMINAL SHORE POWER SGR 300 CP09-035 BROOKLYN PIERS INFRASTRUCTURE SGR 986
2,680
CP09-BROOKLYN PIERS 2,680
CP11-HOWLAND HOOKDEVELOPMENT
CP11-048 BLOCK B - INTERM DEVEL-DEMO 70 & 50 SERIES RPP 509 CP11-056 PORT IVORY EXPANSION-PARCEL C DEVELOP SEP 1,752
2,261
DREDGINGCP11-039 CONSOLIDATED PROJECT TO 50 FEET-NY-AMBRO MAND 28,000 CP11-044 UTILITY RELOCATION - ARTHUR KILL 50' CHANNEL MAND 9,000
37,000
Page 13 of 19

2009PROJECT ID TITLE CATEGORY BUDGET
THE PORT AUTHORITIY OF NEW YORK & NEW JERSEY2009 CAPITAL SPENDING
($ in thousands)SORTED BY DEPARTMENT, FACILITY AND PROGRAM
INFRASTRUCTURECP11-058 HOWLAND HOOK PAVING AND UTILITY PHASE 2 SGR 2,996 CP11-071 HH-PAVING AND UTILITY PHASE 2A MAND 200 PP11-001 CAPITAL MAJOR WORK PROGRAM SGR 3,116
6,312
INTERMODALCP11-038 INTERMODAL TERMINAL - TRACKS 1-5 RPP 509
509
CP11-HOWLAND HOOK 46,082
CP14-NEW JERSEY MARINE DEVELOPMENTINTERMODAL
CP14-022 OFFSITE DEVELOPMENT OF CHASSIS POOL RPP 750 750
CP14-NEW JERSEY MARINE DEVELOPMENT 750
CP16-AUTO MARINE TERMINALDEVELOPMENT
CP16-012 PORT JERSEY DEVELOPMENT RPP 14,117 CP16-027 AUTOMARINE TERMINAL DEVELOPMENT RPP 46,000
60,117
SECURITYCP16-024 INSTALLATION OF CCTV SECURITY SYSTEM SEC 928 CP16-031 INSTALL CCTV AT NJMT - PHASE IV (AMT) SEC 308
1,236
CP16-AUTO MARINE TERMINAL 61,353
PORT COMMERCE TOTAL 246,164
ACCESS TO THE REGION'S CORECF92-001 ACCESS TO THE REGION'S CORE TUNNEL PROJECT SEP 340,000
ACCESS TO THE REGION'S CORE TOTAL 340,000
REGIONAL CAPITAL PROGRAMSCF81-002 NY ECONOMIC DEVELOPMENT PROGRAM SRP 10,000 CF82-014 REGIONAL TRANSPORTATION PROGRAM SRP 7,000 CF84-008 HUDSON-RARITAN ESTUARY PROGRAM - NJ SRP 6,000
Page 14 of 19

2009PROJECT ID TITLE CATEGORY BUDGET
THE PORT AUTHORITIY OF NEW YORK & NEW JERSEY2009 CAPITAL SPENDING
($ in thousands)SORTED BY DEPARTMENT, FACILITY AND PROGRAM
CF85-007 HUDSON-RARITAN ESTUARY PROGRAM - NY SRP 4,000 CF99-001 REGIONAL TRANSPORTATION AND ECON DEVELOPMENT PROJECTS SRP 10,000 CF99-003 REGIONAL DEVELOPMENT FACILITY SRP 1,200 CF99-017 ENVIRONMENT LAND ACQUISITION PROGRAM - NY SRP 5,000 CF99-021 AIRPORT ACCESS STUDY - DOWNTOWN MANHATTAN SRP 2,100 CF99-022 NJ PROJECT DEVELOPMENT FUNDS SRP 4,600 CF99-024 NY APPROACH ROADWAYS SRP 10,000
REGIONAL CAPITAL PROGRAMS TOTAL 59,900
TUNNELS, BRIDGES & TERMINALSCB02-HOLLAND TUNNELINFRASTRUCTURE
CB02-040 REHAB TUNNEL VENT SYS MECHANICAL / ELECTRICAL SGR 15,230 CB02-157 NY VENT BUILDINGS STAIR REPLACEMENT SGR 1,907 CB02-162 REPLACE FLOOR DRAINS/PIPING OF 4 VENT BLDGS SGR 367 CB02-166 REPLACE HVAC SYS. AT NJ ADMIN. BLED & SVC GARAGE SGR 1,883 CB02-171 LED LIGHTING UPGRADE SEP 3,106 CB02-172 REHABILITATION OF CATWALK CAR RAIL SGR 347 CB02-123 REPLACEMENT OF PIER 9/204 (DEMOLITION) SGR 5,063 CB02-174 REPLACEMENT OF PIER 9/204- PHASE 2 SGR 1,955 PB02-001 CAPITAL MAJOR WORK PROGRAM SGR 2,797
32,654
ROADWAYSCB02-087 REPAVE NORTH & SOUTH TUBES SGR 3,829
3,829
SECURITYCB02-126 ACCESS CONTROL SYSTEM SEC 444 CB02-153 INSTALLATION OF CROSS PASSAGE DOORS SEC 7,390 CB02-156 SUPERVISORY CONTROL SYSTEM REPLACEMENT SGR 278
8,112
CB02-HOLLAND TUNNEL 44,595
CB03-LINCOLN TUNNELBRIDGE
CB03-149 REHAB. GALVIN PLAZA & DYER AVE. BRIDGES SGR 2,405 CB03-211 STRUCTURAL REHAB AND REPAVING OF HELIX SGR 1,449 CB03-213 RECONSTRUCTION OF HELIX SGR 1,215
5,068
INFRASTRUCTURECB03-093 REPAINTING TUNNEL VENTILATION FANS SGR 1,393
Page 15 of 19

2009PROJECT ID TITLE CATEGORY BUDGET
THE PORT AUTHORITIY OF NEW YORK & NEW JERSEY2009 CAPITAL SPENDING
($ in thousands)SORTED BY DEPARTMENT, FACILITY AND PROGRAM
CB03-131 REHAB NJ VENT BUILDING EXT SGR 2,204 CB03-228 REPLACE CRITICAL HVAC SYS AT NJ ADMIN. BLDG. SGR 311 CB03-230 NORTH AND SOUTH TUBE - UNDERSIDE OF ROADWAY REHABILITATION SGR 340 CB03-233 INSTALLATION OF BACKFLOW PREVENTERS MAND 315 CB03-239 REHAB DYER PLAZA, SUMP CEILING SLAB & 34TH TO 36ST ST. SGR 437 PB03-001 CAPITAL MAJOR WORK PROGRAM SGR 3,381
8,381
ROADWAYSCB03-214 BUS RAMP SLAB REPLACEMENT SGR 1,684
1,684
SECURITYCB03-163 UPGRADE/ACCESS CONTROL SYSTEM SEC 616 CB03-208 INSTALLATION OF CROSS PASSAGE DOORS SEC 5,574 CB03-235 UPGRADE CCTV SURVEILLANCE EQUIPMENT SEC 1,052
7,242
CB03-LINCOLN TUNNEL 22,375
CB04-GEORGE WASHINGTON BRIDGEBRIDGE
CB04-132 RECOATING UNDERSIDE OF LOWER LEVEL SGR 554 CB04-159 NY & NJ ANCHORAGE-DEHUMIDIFICATION SYSTEM SGR 190 CB04-161 PIP TO LOWER LEVEL CONNECTOR RAMP SGR 104 CB04-165 LEAD REMOVAL/RECOATING NY/NJ ANCHORAGE SGR 469 CB04-207 SUSPENDER ROPE REPLACEMENT AT GWB SGR 1,164 CB04-221 RECOAT RAMP LX1,LX2 & LL I-95 RAMPS 3&4 SGR 4,884 CB04-258 FORT LEE STREET IMPROVEMENTS SGR 1,506 CB04-261 REHAB NJ ANCHORAGE AND HUDSON TERRACE OVERPASS SGR 790 CB04-264 MAIN SPAN ULEB PAVEMENT REPLACEMENT SGR 38 CB04-270 REHAB UL R/WAY ORTHOTROPIC DECK & SUPP STEEL SGR 1,836 CB04-272 REHAB OF NY/NJ ANCHOR MAIN CABLE STRANDS SGR 612 CB04-287 GWB - PRIORITY STEEL AND CONCRETE REHABILITATION SGR 938 CB04-290 GWB REHAB OF UPPER LEVEL SIDEWALK SGR 355 CB04-296 LLWB-MAIN SPAN & TME LLEB/WB ROADWAYS-REPLACE PAVEMENT SGR 2,699 CB04-298 ULEB APPROACH, RAMPS & PIP HELIX-PAVEMENT REPLACEMENT SGR 174
16,312
INFRASTRUCTURECB04-167 MAIN TOLL HOUSE-BOILER&TOLLCANOPY HVAC SGR 112 CB04-219 REHAB NJ ADMINISTRATION BUILDING HVAC SYSTEM SGR 566 CB04-228 REPLACE FIRE HYDRANT SYS LL BRIDGE SPAN SGR 529 CB04-262 IMPACT ATTENUATOR GUIDERAILS & BARRIER REPLACEMENT SGR 479 CB04-281 REPLACE TOLL COLLECTION EQUIPMENT IN SELECTED E-ZPASS LANE SGR 3,332
Page 16 of 19

2009PROJECT ID TITLE CATEGORY BUDGET
THE PORT AUTHORITIY OF NEW YORK & NEW JERSEY2009 CAPITAL SPENDING
($ in thousands)SORTED BY DEPARTMENT, FACILITY AND PROGRAM
CB04-288 PRIORITY CRASH LOCATIONS TRAFFIC SAFETY IMPROVEMENT SGR 465 PB04-001 CAPITAL MAJOR WORK PROGRAM SGR 2,388
7,871
ROADWAYSCB04-133 RECOAT BUS TURNAROUND, RAMPS,& PLAZA SGR 130 CB04-276 REHAB 178TH/179TH STREET RAMP DECKS SGR 618 CB04-260 ALL ELECTRONIC TOLL COLLECTION (MULTI-FACILITY) SEP 1,073 CB04-282 ALL ELECTRONIC TOLL COLLECTION (MULTI-FACILITY) SGR 3,495 CB04-284 REHAB OF ROADWAY PAVEMENT LL/WEST BOUND SGR 822
6,138
SECURITYCB04-189 GWB-UPGRADE/REPL ACCESS CONTROL SYSTEM SEC 875 CB04-230 INSTALLATION OF BARRIER GATES SEC 183 CB04-231 NY TOWER BASE PROTECTION SEC 463 CB04-232 NJ TOWER BASE PROTECTION SEC 235 CB04-292 MAIN CABLE SHIELDING & FAN FENCING SEC 9,318 CB04-293 UPPER LEVEL DRAINAGE SEC 3,351 CB04-294 SUSPENDER ROPE SOCKET PROTECTION SEC 8,064 CB04-295 PROTOTYPE FIRE MITIGATE FIRE/DYNAMIC LOAD PHASE II SEC -
22,489
CB04-GEORGE WASHINGTON BRIDGE 52,810
CB06-BAYONNE BRIDGEBRIDGE
CB06-038 RECOATING UNDERSIDE NY & NJ VIADUCTS SGR 529 CB06-077 STRUCTURAL STEEL REHABILITATION SGR 1,872 CB06-087 BAYONNE BRIDGE STUDY SEP 1,500
3,900
INFRASTRUCTURECB06-073 FIRE STANDPIPE REHABILITATION SGR 717 PB06-001 CAPITAL MAJOR WORK PROGRAM SGR 743
1,460
Page 17 of 19

2009PROJECT ID TITLE CATEGORY BUDGET
THE PORT AUTHORITIY OF NEW YORK & NEW JERSEY2009 CAPITAL SPENDING
($ in thousands)SORTED BY DEPARTMENT, FACILITY AND PROGRAM
SECURITYCB06-071 PROTECTION OF SUSPENDER ROPES SEC 500 CB06-079 ARCH CHORD PROTECTION SEC 516 CB06-080 NJ ARCH ABUTMENT PROTECTION SEC 8,264
9,280
CB06-BAYONNE BRIDGE 14,641
CB07-GOETHALS BRIDGEBRIDGE
CB07-103 GOETHALS BRIDGE MODERNIZATION SGR 13,451 13,451
INFRASTRUCTURECB07-093 HVAC REHAB, FIRE ALARM/SUPPRESSION INSTALLATION SGR 7,870 CB07-108 REPLACE ADMINISTRATION BUILDING FAÇADE PANELS SGR 495 CB07-114 FIRE STANDPIPE REPLACEMENT SGR 611 PB07-001 CAPITAL MAJOR WORK PROGRAM SGR 812
9,789
CB07-GOETHALS BRIDGE 23,239
CB08-OUTERBRIDGE CROSSINGINFRASTRUCTURE
CB08-075 FIRE STANDPIPE REPLACEMENT SGR 635 PB08-001 CAPITAL MAJOR WORK PROGRAM SGR 786
1,421
CB08-OUTERBRIDGE CROSSING 1,421
CB48-GWB BUS STATIONINFRASTRUCTURE
CB48-056 GWBBS DEVELOPMENT RPP 1,000 PB48-001 CAPITAL MAJOR WORK PROGRAM SGR 113
1,113
CB48-GWB BUS STATION 1,113
CT06-PORT AUTHORITY BUS TERMINALINFRASTRUCTURE
CT06-059 REHAB. ENCLOSED PULL THROUGH PLATFORMS SGR 1,463 CT06-120 REPLACE BUILDING AUTOMATED MGMT CONTROL SYS SEP 499 CT06-130 REHABILITATE SPRINKLER PIPING SYSTEM SGR 1,281 CT06-136 REPLACEMENT OF EMERGENCY GENERATOR SGR 1,146
Page 18 of 19

2009PROJECT ID TITLE CATEGORY BUDGET
THE PORT AUTHORITIY OF NEW YORK & NEW JERSEY2009 CAPITAL SPENDING
($ in thousands)SORTED BY DEPARTMENT, FACILITY AND PROGRAM
CT06-161 PABT-ADA GATE MODIFICATIONS MAND 892 CT06-166 INSTALL ADD'L SMOKE DETECTOR SYSTEM MAND 2,454 CT06-181 REPLACEMENT OF EXHAUST FANS 19, 70 & 71 SGR 2,253 CT06-195 SEISMIC RETROFIT MAND 22,138 CT06-196 PABT - 3RD FLOOR SW WEARING COURSE REPLACEMENT SGR 2,919 CT06-202 REPLACE PRIMARY ELECTRIC SERVICE PHASE I SGR 742 CT06-203 REPLACE SIGNAGE SYSTEM SGR 501 CT06-228 PABT CEILING PANEL REPLACEMENT PROGRAM SGR 200 CT06-230 REPLACEMENT OF 58 HVAC UNITS SGR 800 CT06-235 CONCRETE REHABILITATION SGR 2,125 CT06-236 AIR RIGHTS DEVELOPMENT RPP 1,000 PT06-001 CAPITAL MAJOR WORK PROGRAM SGR 1,497
41,909
SECURITYCT06-194 INSTALLATION OF BARRIER GATES SEC 1,425 CT06-222 INSTALLATION OF BOLLARDS SEC 4,446 CT06-238 INSTALL PERIMETER BOLLARDS S/WING 9TH AVE. ENTRANCE SEC 1,341
7,212
CT06-PORT AUTHORITY BUS TERMINAL 49,121
TUNNELS, BRIDGES & TERMINALS TOTAL 209,314
WORLD TRADE CENTERCR12-001 WTC TRANSPORTATION HUB MAND 391,050 CW11-003 WTC VEHICULAR SEC CTR&TOUR BUS PKNG FAC SEC 77,038 CW11-008 WTC MEMORIAL SEP 55,195 CW11-010 WTC SITE INFRASTRUCTURE MAND 348,446 CW30-001 WTC RETAIL REDEVELOPMENT - PHASE 1 RPP 110,150 CW31-555 1 WTC, FREEDOM TOWER - CONSTRUCTION RPP 438,150
WORLD TRADE CENTER 1,420,028
PROVISION FOR PROJECTS IN DEVELOPMENTCXXX-001 PROVISION FOR PROJECTS IN DEVELOPMENT SEP 25,000
PROVISION FOR PROJECTS IN DEVELOPMENT TOTAL 25,000
CAPITAL PROGRAM TOTAL 3,295,164$
Page 19 of 19

Appendix

APPENDIXA:AGENCYOVERVIEW
MissionTo identify and meet the critical transportation infrastructure needs of the bistateregion’s businesses, residents, and visitors: providing the highest quality, mostefficient transportation and port commerce facilities and services that move peopleand goods within the region, providing access to the rest of the nation and to theworld, while strengthening the economic competitiveness of the New York-NewJersey Metropolitan Region.

PORT AUTHORITY OF NEW YORK AND NEW JERSEY FACILITIES
Facilities

THENEWYORK-NEWJERSEYREGION
The NewYork-New JerseyMetropolitan Region, one of the largest andmost diversified inthe nation, consists of the five NewYork boroughs ofManhattan, Brooklyn, Queens, StatenIsland and The Bronx; the four suburban NewYork counties of Nassau, Rockland, SuffolkandWestchester; and the eight northern New Jersey counties of Bergen, Essex, Hudson,Middlesex, Morris, Passaic, Somerset and Union.
Area: 3,900 SquareMilesPopulation: 17.2Million (estimate for 2007)Labor Force: 8.5Million (average for 2007)TotalWage& Salary Jobs: 8Million (average for 2007)Total Personal Income: $897 Billion (estimate for 2007)
Region

HistoryThe Port Authority of New York and New Jersey (the “Port Authority”) wasestablished by Compact between New York and New Jersey on April 30, 1921, as thefirst interstate agency created under the clause of the United States Constitutionpermitting compacts between states with the consent of Congress. The Compact alsocreated the Port District, an area of about 1,500 square miles in both states, centeringabout New York Harbor. Over the years, the mandate of the agency has developed topromote and protect the commerce of the bistate port and to undertake port andregional improvements not likely to be financed by private enterprise or to beattempted by either state alone: modern wharfage for the harbor shared by the twostates, tunnel and bridge connections between the states, terminal andtransportation facilities and, in general, trade and transportation projects to promotethe region’s economic well-being.
Governance of The Port AuthorityThe Governor of each state appoints six Commissioners to the agency’s Board ofCommissioners, for overlapping six year-terms; each appointment is subject to theapproval of the respective state senate. Commissioners serve as public officialswithout remuneration. The Governors retain the right to veto the actions of theCommissioners from their respective state. The Port Authority undertakes projectsand activities in accordance with the Port Compact of 1921 and amendatory andsupplemental bistate legislation. An Executive Director, appointed by the Board ofCommissioners, is responsible for managing the operation of the Port Authority in amanner consistent with the agency’s policies, as established by the Board. TheExecutive Director and the individual directors are responsible for operating withinthe budget and capital plan authorized by the Board of Commissioners by monitoringand controlling the fiscal performance of the Port Authority and its departments.
Origins

Organization Chart
BOARD OF COMMISSIONERS
EXECUTIVE DIRECTORDEPUTY EXECUTIVE DIRECTOR
GENERALCOUNSEL
CHIEFENGINEER
INSPECTORGENERAL
PUBLICSAFETY
SECRETARY CHIEF TECHNOLOGY OFFICER
CHIEF ADMINISTRATIVEOFFICER
CHIEF OPERATINGOFFICER
CHIEF FINANCIALOFFICER
CHIEF, CAPITALPLANNING
COMPTROLLER
TREASURY
MANAGEMENT& BUDGET
FINANCIAL ANALYSIS
HUMAN RESOURCES
LABOR RELATIONS
OPERATIONS SERVICES
PROCUREMENT
AVIATION
TUNNELS, BRIDGES& TERMINALS
RAIL TRANSIT
WTC CONSTRUCTION
ENVIRONMENTALPOLICY &
COMPLIANCE
BUSINESS & JOB OPPORTUNITY
PLANNINGPORT COMMERCE
CHIEF, PUBLIC & GOVERNMENT AFFAIRS
CHIEF, REAL ESTATE & DEVELOPMENT
September 19, 2008

APPENDIX B: BUDGET PROCESS AND FINANCIAL POLICIES The Port Authority’s annual budget is prepared on a basis consistent with the Port Authority’s By-Laws. The Board approves an annual expenditure budget comprised of operating expenses, debt service, gross capital expenditures and other expenditures such as heavy vehicles and computer systems that are deferred and amortized in future periods. The Board also approves the long-term strategic plan and updated capital plan of the agency. A Unified Planning Process Each year, in conjunction with the development of its annual budget, Port Authority staff undertakes a comprehensive planning process designed to ensure that the agency is consistently moving towards achieving long-term goals. Over the past two years, the Port Authority has worked to unify this process by coordinating the development of business plans, capital programs, and the annual budget. This unified planning model allows for the agency’s long-term Strategic Plan, adopted in 2005, to have a greater impact on each aspect of agency operations. The goals identified in the Strategic Plan are incorporated into both departmental business plans and the agency’s capital program. In turn, business and capital plans drive resource allocation decisions. Developing the Budget The budget process begins with the scanning process. This involves an effort on the part of Executive Director and senior staff to understand both agency performance over the past year and the environment in which the agency will be operating in the coming years. This information is then used to re-assess agency priorities and develop short-term strategies in line with agency-wide goals. The Executive Director’s office then issues planning and budget guidance that includes agency wide priorities, the regional planning context, and budget targets for each department. This guidance informs the development of department business and work plans, the capital program, and the budget for the coming year. Line Departments, the five departments that reflect the Port Authority’s major lines of business (Port Commerce, Aviation, PATH, and Tunnels, Bridges, and Terminals, and Development), are asked to submit business plans that identify department wide strategies and initiatives, both operating and capital, that reflect over-arching agency goals and take into account the planning context and priorities identified in the Executive Director’s planning guidance. Similarly, staff departments, which support the agency’s major lines of business, submit work plans that identify the ways in which these departments will help line businesses achieve agency-wide goals given the pre-established regional planning context. The Executive Director, in conjunction with the

2
Planning Department and the Management and Budget Department, provides feedback on departmental business/work plans as they are developed. In conjunction with incorporating agency feedback into finalized business/work plans, departments develop updated capital project lists and budget proposals. Once these have been submitted, the Management and Budget Department assesses the financial impact of the submissions and works with departments to finalize a budget and capital plan that meets agency and department goals within the financial constraints of the agency. Following repeated review and analysis throughout the department, a final budget proposal is presented to the Board of Commissioners for approval. Once approved, the budget is presented to the public.
Basis of Budgeting
Revenues and expenses are budgeted in an enterprise fund using the accrual basis of accounting (excluding interdepartmental rents). The budgeted Revenues and Reserves schedule is prepared pursuant to Port Authority bond resolutions and differs in some respects from accounting principles generally accepted in the United States, with the primary difference being the inclusion of principal and interest payments on outstanding Port Authority debt in lieu of depreciation and amortization related to capital investment. This is intended to demonstrate to the bondholders that the agency is generating sufficient cash flows to meet current and future debt service. For presentation purposes, budgeted net income is also calculated on a basis consistent with generally accepted accounting
SCANNING NOV DEC JAN FEB MAR APR MAY JUN JULY AUG SEPT OCT NOV DEC
Executive Management Retreat
Planning Context 15-Feb
Performance Measure Results
GUIDANCE NOV DEC JAN FEB MAR APR MAY JUN JULY AUG SEPT OCT NOV DEC
Business Plan Guidelines 15-Feb
Budget Guidance
BUSINESS PLANS NOV DEC JAN FEB MAR APR MAY JUN JULY AUG SEPT OCT NOV DEC
Business Plans (Exec Summary) 15-Feb
Estimated Budget Impacts of Plans
EXECUTIVE REVIEW NOV DEC JAN FEB MAR APR MAY JUN JULY AUG SEPT OCT NOV DEC
Executive Forum
WORKPLANS/BUSINESS PLANS NOV DEC JAN FEB MAR APR MAY JUN JULY AUG SEPT OCT NOV DEC
Draft Workplans-Staff (operating & capital) 16-Jun
Draft Bus Plans-Line (operating & capital)
Final Workplans/Business Plans
CAPITAL PLAN UPDATES NOV DEC JAN FEB MAR APR MAY JUN JULY AUG SEPT OCT NOV DEC
Draft Project List
Final Project List
OPERATING & CAPITAL BUDGETS NOV DEC JAN FEB MAR APR MAY JUN JULY AUG SEPT OCT NOV DEC
Staff Department Drafts 16-Jun
Line Department Drafts
Final Budgets
REPORTING NOV DEC JAN FEB MAR APR MAY JUN JULY AUG SEPT OCT NOV DEC
Board Presentations
Public Presentations
Approval of Budget and Updated Capital Plan
Release of Budget Book
Dec Board Meeting

3
principles. The Management and Budget Department prepares periodic financial reports, designed to inform all levels of executive management and individual directors, that measure and discuss actual and projected performance against budget and the capital plan. Financial reports are also presented to the Board of Commissioners that concisely describe the operating and capital results and financial position of the agency as a whole, highlight exceptions or significant changes impacting the agency’s financial condition, and to suggest areas where management action may be necessary.
Financial Policies The Port Authority is financially self-sustaining and must raise the moneys necessary to operate its facilities and provide services to the public at large through tolls, fares, rentals and other user charges. Funds needed for capital improvements, construction and acquisition of facilities are raised on the basis of the Port Authority’s own credit rating. The Port Authority cannot pledge the credit of either of the States of New York and New Jersey or any municipality, nor can it levy taxes or assessments. Within the context of programmatic agency-wide objectives, the Port Authority has established various financial measures designed to ensure that the agency is able to sustain its projects, plan for the future, and fund debt service. The Port Authority maintains two Reserve Funds, the General Reserve Fund and Consolidated Bond Reserve Fund, which were established in accordance with applicable laws and statutes. The agency has set specific targets for the Times to Debt Service Earned ratio, monies contained in the General Reserve Fund and the Operating Ratio.
The General Reserve Fund is pledged in support of Consolidated Bonds and Notes. Statutes which required the Port Authority to create the General Reserve Fund established the principle of pooling revenues from all facilities and require that the Port Authority apply surplus revenues from all of its existing facilities to maintain the General Reserve Fund in an amount at least equal to 10% of the par value of outstanding bonds legal for investment. The balance remaining of all net revenues of the Port Authority's existing facilities after deducting payments for debt service upon all Consolidated Bonds and Notes and the amount necessary to maintain the General Reserve Fund at its statutorily required amount, is to be paid into the Consolidated Bond Reserve Fund, which is pledged as additional security for all outstanding Consolidated Bonds and Notes. Consolidated Bonds and Notes have a first lien upon the net revenues (as defined in the Consolidated Bond Resolution) of all existing facilities of the Port Authority and any additional facility financed by Consolidated Bonds.
Other asset obligations (versatile structure obligations, commercial paper obligations, variable rate master notes, and Interest Rate Exchange Contracts (swaps) executed after 2005), and the interest thereon, are not secured by or payable from the General Reserve Fund. Principal of, and interest on, other asset obligations are payable solely from the proceeds of obligations issued for such purposes or from net revenues paid into the

4
Consolidated Bond Reserve Fund and, in the event such proceeds or net revenues are insufficient therefore, from other moneys of the Port Authority legally available for such payments. Operating asset obligations (equipment notes, Interest Rate Exchange Contracts (swaps) executed prior to 2005, and the Fund buy-out obligation) are paid in the same manner and from the same sources as operating expenses. Special Project Bonds are not secured by or payable from the General Reserve Fund or the Consolidated Bond Reserve Fund.
The Port Authority has a long-standing policy of maintaining total reserve funds in an amount equal to at least the next two years' bonded debt service on outstanding debt secured by a pledge of the General Reserve Fund. The moneys in the reserve funds may be accumulated or applied only to purposes set forth in legislation and the agreements with the holders of the Port Authority’s obligations pertaining thereto. Debt Management Policies The Port Authority follows specific criteria when dealing with debt management, financing capital construction at the agency’s facilities or refunding existing obligations. It does so by closely monitoring and controlling the flow of Variable Rate Master Notes, Commercial Paper, Equipment Notes, and Special Project Bonds. These debt management criteria are described in more detail below:
• Variable Rate Master Notes: cannot be issued if the resulting aggregate principal amount at any one time outstanding is in excess of $400 million.
• Commercial Paper: cannot be issued if the resulting aggregate principal amount at
any one time outstanding is in excess of $500 million ($300 million for Series A and $200 million for Series B).
• Port Authority Equipment Notes: proceeds are to be used in connection with the
purchase of certain equipment by the Port Authority, to refund certain obligations issued by the Port Authority in connection with the purchase of equipment and for incidental purposes, including certain cost of such note obligations. These notes cannot be issued if the resulting aggregate principal amount at any one time outstanding is in excess of $250 million.
• Special Project Bonds: issued only for the purpose of providing funds for a single
project for a lessee or for the purpose of refunding all or any part of a prior series of Special Project Bond obligations. These bonds shall not be issued in an amount that is greater than the amount determined by the Port Authority to be necessary to accomplish the purpose for which such Series of Special Project Bonds is issued.

5
APPENDIX C: GOALS, OBJECTIVES, MEASURES
STRATEGIC
CAMPAIGN GOALS OBJECTIVES MEASURES
Complete airport improvements at
EWR, LGA, & JFK and development
of SWF
Improve on-time arrivals and
departures at PA airports
Improve passenger satisfaction at PA
airports
Improve travel options
between airports and
regional business centers
Expand transit access to
the region's airports
Complete airport access
improvements for EWR and SWF
Increase inter-regional
travel options
Support strengthened inter-
regional rail service
Increase rail share of short-haul inter-
regional travel
Complete PATH expansion and
modernization, XBL expansion at
Lincoln Tunnel, and ARC
Increase transit share of peak period
trans-Hudson travel
Maintain PATH on-time performance
Increase passengers' ratings
Complete WTC redevelopment
Support mixed-use development at
PABT, Harrison, and JSTC
Provide sufficient goods
movement capacity to
serve growing local
markets
Expand goods movement
capacity and productivity
Complete harbor deepening, terminal
redevelopment, and rail freight
improvements
Increase throughput at port terminals
(container lifts/acre)
Increase rail throughput at port
terminals (container lifts)
Construct comprehensive
ExpressRail system to increase
capacity
Increase "highly satisfied" port and
air cargo customer ratings
Maintain PA facilities in structurally
sound condition
Improve on-time completion rate of
priority repairs
Train facility managers and staff in
disaster response and recovery
Reduce accidents and injuries
Reduce crime at PA facilities
Implement clean trucks and carbon
neutral programs
Recycle construction and demolition
waste
Incorporate sustainable design into
new facilities
Increase air travel capacity
and quality to meet
growing air travel demand
Increase transit capacity
and quality to meet
growing trans-Hudson
demand
Institute Regional Smart Cards and
All-Electronic Tolling
Create simplified regional
tolls and fairs and improved
travel information systems
through joint efforts with
regional transportation
providers
Maintain energy-efficient
and environmentally
sustainable operations
Expand and modernize the
regions airports with new
terminals, runways, and
roadways
Expand and modernize
trans-Hudson transit
services
Increase transit-oriented
development
Improve efficiency of
regional freight distribution
facilities and goods
movement corridors
Eliminate institutional
barriers to efficient travel
throughout the region
Maintain existing
infrastructure assets in a
state of good repair
Minimize safety hazards
and security risks
Ensure the safety,
security, reliability, and
resilience of critical
transportation facilities
and services
Develop property near PA
transit hubs
Minimize the impact of
goods moving within the
region and speed non-
local freight out of the
region
Reduce greenhouse gas
emissions, energy use,
and waste generated by
agency operations,
business partners, and
customers
SAFE, SECURE,
SUSTAINABLE
INFRASTRUCTURE
INTER-REGIONAL
TRANSPORTATION
FOR A
COMPETITIVE
SERVICE EXPORT
ECONOMY
TRANSIT-BASED
REGIONAL GROWTH
EFFICIENT GOODS
MOVEMENT
NETWORK
SEAMLESS
REGIONAL TRAVEL

6
APPENDIX D: GLOSSARY Allocated Expenses – Expenses allocated to various business programs and facilities of the Port Authority, using labor as the basis for allocation, for the provision of centralized general management and administrative services and/or general services applicable to Port District development activities. Budget – A formal financial estimate of expected revenues and expenditures setting forth the Port Authority’s financial operations for a calendar year in a form compatible with the Port Authority’s accounting system. The estimate is prepared by all departments and approved by the Board of Commissioners. It serves as the basis for producing the Financial Plan and becomes a means of achieving systematic review of program expenditures to ensure that they are made in accordance with the policies and financial decisions of the Board and the By-Laws of the Port Authority. Capital Expenditures - Expenditures for projects that benefit future accounting periods and are expected to prolong the service lives of assets beyond the originally assigned life or result in a better or more efficient asset. Capital expenses are broken down into seven categories that reflect the policy goals of the agency:
1. State of Good Repair (SGR) – Projects that are necessary to maintain the continued functioning of a Port Authority assets consistent with the Agency’s business objectives, especially those necessary to maintain critical structural integrity and operational capability of facilities.
2. Mandatory (MAND) – Projects required by law, governmental rule or regulation,
or by a rule or policy of the Board of Commissioners.
3. Security (SEC) – Projects that are necessary to meet the Agency’s Security Plan. The Office of Emergency Management has reviewed the scope of the projects for consistency with Agency security goals.
4. Revenue Producing Projects (RPP) – Projects which provide system
enhancements, improved customer service levels, and/or regional benefits and which yield a positive financial return to the Port Authority on its invested capital.
5. System Enhancing Projects (SEP) – Projects that provide system enhancements,
improved customer service levels, and/or regional benefits but do not yield a positive financial return to the Port Authority.
6. Regional Projects (SRP) – Projects undertaken by the Port Authority which
advance the objectives of the Port Authority but unlike other Port Authority projects -- which are typically confined to a specific Port Authority operated facilities – are not operated by the Port Authority. They are generally initiated at the request of one of the two states.

7
Capital Plan – Reflects the current assessment of the potential need for capital expenditures for the modernization, renovation, rehabilitation, expansion or acquisition of existing and additional facilities in order to continue to maintain appropriate levels of service. Commercial Paper (CP) – Short-term obligations authorized to be issued to provide interim financing for the payment of capital expenditures in connection with the facilities of the Port Authority or to refund prior obligations. Consolidated Bonds – A form of long-term debt issued pursuant to the Consolidated Bond Resolution of 1952 and subsequent resolutions. Consolidated Bond Reserve Fund – A special fund created by Section 7 of the Consolidated Bond Resolution. The balance remaining of all net revenues of the Port Authority’s existing facilities after deducting payments for debt service upon all Consolidated Bonds and Notes and the amount necessary to maintain the General Reserve Fund at its statutorily required amount, is to be paid into the Consolidated Bond Reserve Fund, which is pledged as additional security for all outstanding Consolidated Bonds and Notes. Consolidated Bonds and Notes have a first lien upon the net revenues (as defined in the Consolidated Bond Resolution) of all existing facilities of the Port Authority and any additional facility financed by Consolidated Bonds. Debt Service – Represents interest payments, accruals, and mandatory and accelerated amortization (by sinking fund payments, serial maturities, bank loan payments, etc.), on outstanding debt charged to the operating and reserve funds. Direct Prorated Expenses – Centralized line department, operations and maintenance services, and engineering general expenses that are prorated directly to individual operating facilities and business programs based on their prorated share of direct labor costs. Facility – A location classification defining a complete and self-contained unit operated by the Port Authority. Fund Buy-Out – Represents the annual implicit interest cost (8.25%) contained in the present value of amounts due to the States of New York and New Jersey upon the termination, in 1990, of the Fund for Regional Development. General Reserve Fund – A special fund established pursuant to Chapter 5 of the Laws of New Jersey of 1931 and Chapter 48 of the Laws of New York of 1931, as amended and supplemented. Under the statutes authorizing the pledge of the General Reserve Fund, the Port Authority may raise monies to finance or refinance any of its present facilities by the issue and sale of bonds legal for investment. Additional terminal or transportation facilities may also be financed this way. Surplus revenues from facilities are required to be pooled by the Port Authority and applied to the maintenance of a

8
General Reserve Fund in an amount equal to at least 10% of the par value of all such outstanding bonds legal for investment, as so defined. Gross Operating Revenues –revenues from rentals, tolls, fares, aviation fees and other charges derived in connection with the use of and privileges granted at Port Authority facilities before the deduction of operating expenses. Net Operating Revenues – Gross operating revenues less operating expenses and amounts in connection with operating asset obligations, adjusted by net recoverable/expense amounts related to the events of September 11, 2001. Operating Asset Financing - Interest expense associated with the funding of operating assets such as the Fund Buy-Out, where the Port Authority assumed the assets and liabilities of the former Fund for Regional Development, which had been established to sub-lease World Trade Center space previously held by the State of New York; and Equipment Notes, which are obligations that are authorized to be issued to facilitate the purchase of operating equipment such as automotive vehicles, telephones, radios, computer equipment and office furnishings. Operating Expenses – expenses incurred in connection with the operation, maintenance, security, repair and administration of Port Authority facilities and business programs, including direct prorated and allocated expenses. Operating expenses are subdivided into six categories:
1. Security – Providing safe and secure transportation services to the region and nation by vigilance over potential threats, investment in infrastructure and new technology, and employment of best practices in security and emergency preparedness operations. Adapting programs in response to changing conditions and meeting or exceeding government and industry standards while adding value to the business.
2. Operations – Staff and materials required to manage transportation facilities and
provide support services to the traveling public throughout the Port Authority's regional transportation network, which includes airports, vehicular tunnels, bridges and terminals, rail transit system and port shipping facilities.
3. Maintenance – Labor and materials to protect the agency’s capital investments
and keep properties, facility structures and equipment operating at a high level of performance, including complying with applicable codes and regulations, thereby preventing injury to life and damage to property.
4. Management Services – Support operations for all lines of business -- Aviation,
PATH, Port Commerce, Tunnels, Bridges & Terminals, and World Trade Center.

9
5. Rent – Payments made periodically to governmental agencies and landlords in return for the use of land, a building, an office, or other property.
6. Debt Expense – Interest costs for special project bonds and operating assets.
Operating Ratio - The resultant of dividing the Port Authority's gross operating revenues by operating expenses. Passenger Facility Charge (PFC) –Pursuant to the Federal Aviation Safety and Capacity Expansion Act of 1990, the Port Authority has been authorized to impose a PFC on passengers utilizing its airports. PFC collections are restricted to projects undertaken with the prior approval of the FAA. Port Authority Equipment Notes (PAEN) – Obligations authorized to be issued for purposes of payment for capital expenditures in connection with the facilities of the Port Authority or to refund prior obligations. PAEN carry variable interest rates set by a remarketing agent and are subject to prepayment at the option of the Port Authority or upon demand of the holders. Return On Investment (ROI) – The relationship, generally expressed as a percentage, between the net income and the investment required to earn the income. Special Project Bonds (SPB) - Limited obligations issued for the purpose of providing specific projects for a lessee or to refund prior obligations. SPBs are secured solely by a pledge of facility rental derived by the Port Authority under a lease with the lessee. Neither the full faith and credit of the Port Authority nor any of its revenues, assets or reserve funds are pledged for the payment of debt service on the bonds. Times Debt Service Earned – The relationship of net revenues available for debt service and reserves to the total obligatory bonded debt service. In this context, “total obligatory bonded debt service” excludes Fund for Regional Development buyout principal and interest expense, debt service on Special Project Bonds, operating equipment lease financing obligations and any PFC backed debt associated with investment in use. Variable Rate Master Notes (VRMN) – Obligations authorized to be issued for purposes of payment for capital expenditures in connection with the facilities of the Port Authority or to refund prior obligations. VRMN carry variable interest rates in accordance with specified indices and are subject to prepayment at the option of the Port Authority or upon demand of the holders. Versatile Structure Obligations (VSO) – Obligations authorized to be issued for purposes of payment for capital expenditures in connection with the facilities of the Port Authority or to refund prior obligations. VSO carry variable interest rates set by a remarketing agent and are subject to prepayment at the option of the Port Authority or upon demand of the holders.

THE PORT AUTHORITY OF NY & NJ
225 PARK AVENUE SOUTH
NEW YORK, NY 10003
www.panynj.info
12/17/2008