porous concrete design
TRANSCRIPT

Santa Clara UniversityScholar Commons
Civil Engineering Senior Theses Engineering Senior Theses
Spring 2017
Porous Concrete DesignJonathan AngSanta Clara University, [email protected]
Erik LihndalSanta Clara University
Follow this and additional works at: https://scholarcommons.scu.edu/ceng_senior
Part of the Civil and Environmental Engineering Commons
This Thesis is brought to you for free and open access by the Engineering Senior Theses at Scholar Commons. It has been accepted for inclusion in CivilEngineering Senior Theses by an authorized administrator of Scholar Commons. For more information, please contact [email protected].
Recommended CitationAng, Jonathan and Lihndal, Erik, "Porous Concrete Design" (2017). Civil Engineering Senior Theses. 58.https://scholarcommons.scu.edu/ceng_senior/58

SANTA CLARA UNIVERSITY
Department of Civil Engineering
I HEREBY RECOMMEND THAT THE THESIS PREPARED UNDER MY SUPERVISION BY
Jonathan Ang, Erik Lihndal
ENTITLED
Porous Concrete Design,
BE ACCEPTED IN PARTIAL FULFILLMENT OF THE REQUIREMENTS FOR THE DEGREE OF
BACHELOR OF SCIENCE IN
CIVIL ENGINEERING
Thesis Advisor(s)
Department Chair( s

Porous Concrete Design
By
Jonathan Ang, Erik Lihndal
SENIOR DESIGN PROJECT REPORT
Submitted to the Department of Civil Engineering
of
SANTA CLARA UNIVERSITY
in Partial Fulfillment of the Requirements for the degree of
Bachelor of Science in Civil Engineering
Santa Clara, California
Spring 2017
Table of Contents
1 - BACKGROUND INFORMATION .............................................................................................. 3 1.1 - WHAT IS POROUS CONCRETE? .................................................................................................. 1
1.2 - PROJECT DESCRIPTION ..................................................................................................................... 1
2 - POSSIBLE BENEFITS AND PROBLEMS ................................................................................. 2 2.1 - BENEFITS .......................................................................................................................................... 2 2.2-POSSIBLE PROBLEMS ........................................................................................................................ 3
3 - LEED ..................................................................................................................................... 3
4 - AGGREGATE PROPERTIES .................................................................................................... 6 4.1 - DESIGN .............................................................................................................................................. 6
4.2-ABSORPTION ...................................................................................................................................... 6
5-MIX DESIGN .............................................................................................................................. 7 5.1-PART lMIX ........................................................................................................................................ 7
5.2-PART 2 .............................................................................................................................................. 7
5 .3 - CLASS II AGGREGATE ..................................................................... : ................................................. 8
5 .4 - TEST SPECIMENS ............................................................................................................................... 9
6 - ETHICS ..................................................................................................................................... 10
7 - COMPRESSION STRENGTH TEST ....................................................................................... 11
8 - PERCOLATION RATE TEST ................................................................................................. 12
9 - TEST RESULTS ....................................................................................................................... 14 9.1-COMPRESSION (PART 1) .................................................................................................................. 14 PREVIOUS SCU STUDY RESULTS ............................................................................................................ 14 9.2-TAK.EAWAY (PART l) ...................................................................................................................... 14 9.3 -COMPRESSION (PART 2) .................................................................................................................. 15 9.4-PERCOLATION (PART 2) .................................................................................................................. 16
10 - CLOGGING ............................................................................................................................ 18 10.1-PROBLEMS WITH CLOGGING ......................................................................................................... 18 10.2 - EXPERIMENT PROCEDURE ............................................................................................................ 18 10.3-RESULTS ....................................................................................................................................... 19 10.4-TAK.EAWAYS ................................................................................................................................. 22
11- CONCLUSION ........................................................................................................................ 22 1 l.l -lMPROVEMENTS ............................................................................................................................ 22
13 -APPENDIX ............................................................................................................................. 24
14 - REFERENCES: ....................................................................................................................... 25
1 - Background Information
1.1- What is Porous Concrete? Porous concrete is a special kind of concrete that has high porosity. The only difference
between porous concrete and normal concrete is that a porous concrete mix does not consist of sand or other small particles. The lack of sand and small particles creates voids in the concrete. The voids that area created are the reason why water is able to pass through a porous concrete mix. Porous concrete is used for low traffic areas such as parking lots and pavements. The main purpose of porous concrete is to reduce or even eliminate storm water runoff which has a number of benefits.
1.2 - Project Description For this project, the team developed a porous pavement mixture that will be applicable
for practical and real life use. This means that the porous concrete mixture must have a certain permeability and compressive strength.
There were two main parts to the project. Initially the team found what value of water to cement ratio would give the highest possible compression strength. The team started with experimenting with water to cement ratio due to the fact that it is the only variable that affects compressive strength and barely, if at all, affects permeability. After figuring out what the best water to cement ratio was, the next part of the project was about experimenting with other variables that affect the permeability and compression strength of a porous concrete.
After acquiring the best water to cement ratio for the highest compression strength, the second part of the experiment will consist of varying two other variables, which were aggregate size and types of aggregate. By optimizing these variables, an optimal porous concrete mixture was found that could be used for practical use. The hope was to find a mixture that can be used for either pavements or parking lots.
1

2 - Possible Benefits and Problems
2.1-Bene/its Having porous concrete on a project site is both financially and environmentally
beneficial. One major financial benefit of porous concrete is its ability to control storm water
runoff. In many states, and especially in California, an owner is responsible for controlling its
storm water runoff. Most of the time owners will use methods such as retention ponds. Retention
ponds are a water retention system that store storm water and release it underground slowly or
move it into the sewage. A problem with this method is that the retention system itself requires
quite a bit of space and can be expensive to make. If a project site has porous concrete, it will
eliminate the need for a retention system. This means that the area that is usually used for a
retention system could be used for something else, such as extra parking space or an additional
building. Not only does porous concrete save space, but it is also saves money by not having to
build a retention pond in the first place, as seen in Figures 1 and 2. Furthermore, porous concrete
will enable a building to get additional LEED points which has a number of benefits on its own.
In addition to financial benefits, porous concrete also has environmental benefits. The
greatest environmental benefits is that it is able to restore the natural hydrological cycle. It allows
water to infiltrate back into soil rather than it going into a sewage system. This is especially
beneficial to those areas that depend on ground water as a water resource. Porous concrete is able
to maintain the reservoir in the soils, and it helps the soil retains its water content.
Conventional Stormwater System
Figure I: Conventional Stormwater System
2
Bay Area Pervious Concrete Stormwater System
Figure 2: Pervious Concrete Stromwater System

2.2 - Possible problems The main problem with porous concrete is its voids. Having voids means that it will
not be as strong and durable as conventional concrete. That is why porous concrete cannot
be used for areas with heavy traffic or areas that demand heavy loads. Additionally, porous
concrete is very susceptible to cold weather areas due to its weakness to freeze and thaw.
Porous concrete will always experience freeze and thaw conditions due to its voids.
Currently porous concrete is typically not used in cold weather climates.
In other words, unlike conventional concrete, porous concrete is not as versatile and
has some restrictions with regards how it is used.
3 -LEED
LEED, also known as Leadership in Energy and Environmental Design, is the most
recognizable green building rating system in the world. LEED provides a framework for
evaluating building performance by establishing minimum requirements in several fields. There
are four levels of LEED certifications: Gold, Silver, Bronze and Platinum. Platinum is the
highest rating. In order to get a certification, the building must accumulate a certain amount of
LEED points; the more the LEED points a building has, the better the certification it will receive.
There are several benefits to having a LEED certified building. LEED certified buildings have an
average faster lease up rate, higher property value and qualify for tax rebates and zoning
allowances. Since the building is sustainable and more energy efficient, it will reduce the overall
cost of the building operations and thus save the owners money in the process.
The list below shows the additional; LEED points a project with porous concrete could have. As
seen below, this project could give an additional 10 points, which could be crucial when it comes
to getting a higher LEED certification.
3

Storm water design (Sustainable Sites -c6.J)
Intent: To limit the amount of disruption and pollution of natural waters, which is done by
managing storm water runoff, increasing on site infiltration and eliminating contaminants.
Porous concrete is able to get this lead point because it reduces storm water runoff by allowing
water to infiltrate into the soil. It also reduces pollutants because it filters contaminants as water
passes through it.
Possible points: 1
Heat island effect (Sustainable Sites-c7.1)
Intent: To reduce heat island effect. To minimize microclimate and reduce urban energy
demands.
Heat island effect can be reduced by providing shading, which can be done by plantations
planted around the area. Porous concrete is good for growing plants and trees because its
permeability allows water to infiltrate into its roots. This is relevant when it comes to having
porous pavements in parking lots and sidewalks.
Possible points: 1
Water efficiency (Water Effeciency-cl)
Intent: To limit or eliminate the use of potable water or other unnatural surfaces for landscape
irrigation.
The subgrade layer below the porous concrete can store rainwater and use the retained water for
irrigation.
Possible points: 2
4

Materials and Resources (Material Resources-c4)
Intent: To increase demand for building products that have incorporated recycled content
material, reducing the impacts resulting from extraction of new material.
The mixture could use recycled cementitious materials such as fly ash and silica fume. In
addition, the team could use recycled aggregates instead of normal aggregates.
Possible points: 3
Innovative Design anterior Design and Construction Innovation)
Intent: Use innovative design.
Since porous concrete is a relatively new innovation that has not yet been standardized by any
institution, it is considered to be an innovative design.
Possible points: 3
Total Possible points: 10
5

4 - Aggregate Properties
4.1 -Design
Before the group determined the possible mix design, the ACI guidelines required finding
the properties of the aggregates that were proposed. The aggregate properties are essential for
calculating the proportion of water, aggregate and cement needed in a mix design. The properties
the group needed to find were bulk specific weight, absorption and bulk unit weight. Using
standard ASTM guidelines, the team found the properties of each type and size of aggregate.
4.2 -Absorption Table 1: ASTM C127 -Absorption of Coarse Aggregate .
• sample
·314 normal
• 112 class 2
: 1/2 normal
13/4 class 2
4.3 -Specific gravity
Absorption
Table 2: ASTM C127 - Specific Gravity of Coarse Aggregate.
·sample
3/4 normal
1/2 class 2
1/2 normal
3/4 class 2
Specific gravity - .,_,.,.,, .. ,,,." "'""'"'"'··~ ·-=··· ···--~- ·-,-·
2.86
2.52
2.89
2.56
4A-Bulk Unit Weight
Table 3: ASTM C29 - Bulk Density in Aggregate.
13/4 normal
1/2 class 2
1/2 normal
·3/4 class 2
81.57
102.10
92.25
6
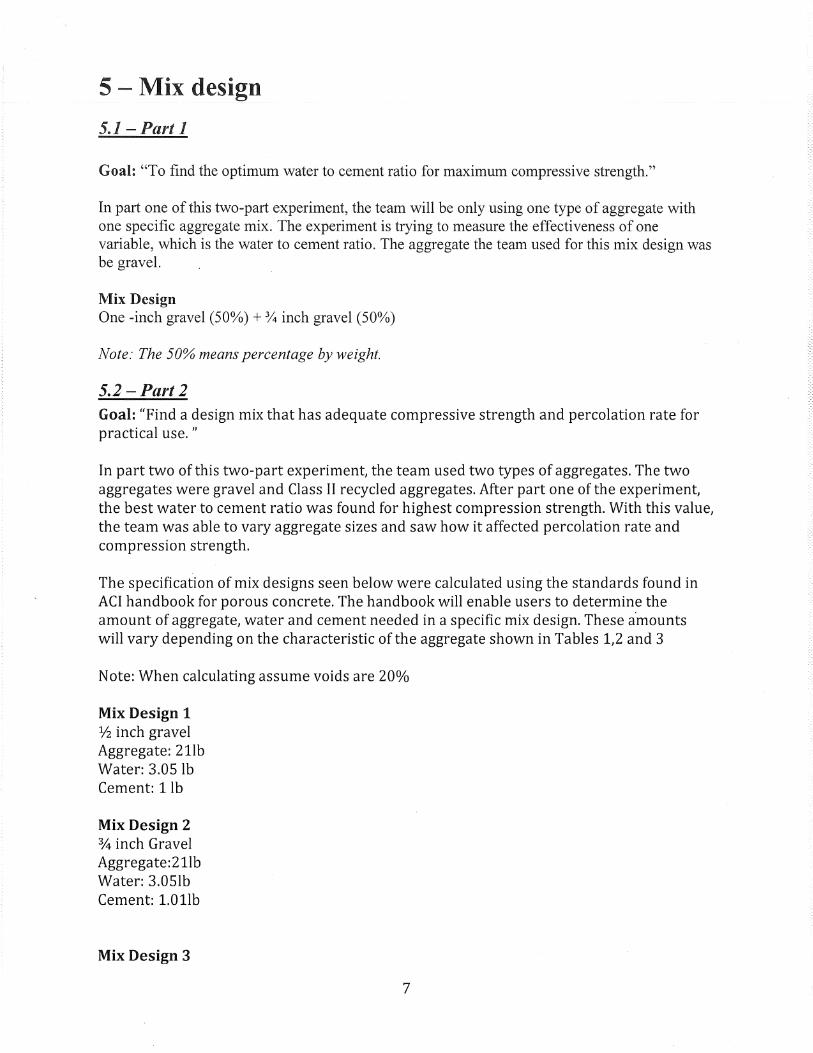
5 - Mix design
5.1-Part I
Goal: "To find the optimum water to cement ratio for maximum compressive strength."
In part one of this two-part experiment, the team will be only using one type of aggregate with one specific aggregate mix. The experiment is trying to measure the effectiveness of one variable, which is the water to cement ratio. The aggregate the team used for this mix design was be gravel.
Mix Design One -inch gravel (50%) +¾inch gravel (50%)
Note: The 50% means percentage by weight.
5.2-Part 2 Goal: "Find a design mix that has adequate compressive strength and percolation rate for practical use. "
In part two of this two-part experiment, the team used two types of aggregates. The two aggregates were gravel and Class II recycled aggregates. After part one of the experiment, the best water to cement ratio was found for highest compression strength. With this value, the team was able to vary aggregate sizes and saw how it affected percolation rate and compression strength.
The specification of mix designs seen below were calculated using the standards found in ACI handbook for porous concrete. The handbook will enable users to determine the amount of aggregate, water and cement needed in a specific mix design. These a·mounts will vary depending on the characteristic of the aggregate shown in Tables 1,2 and 3
Note: When calculating assume voids are 20%
Mix Design 1 ½ inch gravel Aggregate: 2 llb Water: 3.05 lb Cement: 1 lb
Mix Design 2 ¾ inch Gravel Aggregate:21lb Water: 3.051b Cement: 1.0llb
Mix Design 3
7

½ inch Gravel (50%) + ¾ inch Gravel (50%) Aggregate: 21.151b Water: 3.041b Cement: 1.011b
Mix Design 4 ¾ inch Class II Aggregate: 211b Water: 3.051b Cement: 1.011b
Mix Design 5. ½ inch Class II (50%) +¾inch Class II (50%) Aggregate: 191b Water:3.0Slb Cement: 11b
5.3 - Class II aggregate For the second part of the two-part experiment, Class II aggregate was introduced. Class
II aggregate is a type of recycled base rock. The reason why Class II aggregate was used is
because it is more angular than the gravel aggregate. The belief is that its angularity creates more
surface area that touches one another. This- increased surface area will mean that there will be
less voids and more fiction between particles. This will not only make the porous concrete
mixture more compact but it will also help it bind more strongly due to its increased touching
surface area.
8

5.4 - Test specimens
(i.175"'
L ~-------
cE'"TI ~-1 q_c3 ,.:) V ' L, L
Figure 3: Sample in Mold
Once the mix was made it was placed into a plastic conatiner four inches in diameter and
eight nches deep. When putting in the mixture the team made it as compact as possible using a
metal rod ensuring all the spaces were occupied by the mixutre. Furthurrnore, the team made
sure the surface of the test specimen was as flat as possible. The flat surface is vital, not only for
a practical use but it madethe compression test results more accurate because the weight was
more evenly disitributed along the sample.
Once placed inside the mold, the mixture was left outside to air dry for 24 hours.
Then it was placed in a bath of limewater where it cured for 28 days. After the curing
process the mold was removed and left it to dry for a few days. Compression testing was
able to be completed once the samples were completely dried.
9
6 - Ethics
The team believed that porous concrete will be very beneficial in regards with saving the
environment. As the population of the world increases, more space will be required for people to
live in. This means that as time passes, more and more of the Earth's surface will be occupied by
concrete floors. One of the biggest problems concrete floors have is that it is not permeable. In
other words, water does not infiltrate into the Earth's natural floors. This causes a number of
problems, and it is especially relevant in countries that depend on underground water as a water
supply.
Indonesia is an example of a country that heavily relies on groundwater as a source of
water. The amount of water that they are taking from the ground is much more than the amount of
water that goes into the ground. When this happens, not only will the soil start to compact, causing
land to sink, but it will also deteriorate the soil's ability to store and retain water. It is estimated
that Jakarta, Indonesia's capital city, is sinking at a fast rate of two millimeter (2mm) per year. A
contributor to making the situation worse is the absence of natural infiltration systems and an
abundance of concrete floors. For this specific situation, the presence of porous concrete will
greatly help. It allows water to naturally infiltrate back into the soil; this enables soil to be able to
recover the water that has been pumped out and thus prevents the soil from further compacting
and the ground from sinking. Preventing the city of Jakarta from sinking will be greatly beneficial
to its citizens. They will not have to worry about their homes being destroyed and their businesses
being effected by heavy flooding caused by a sinking landscape.
Like Jakarta, other places in the world are having the same problem. Their lands are sinking
and their grounds are drying up. Porous concrete is an inexpensive and effective solution to these
problems.
10

7 - Compression Strength Test Compression strength is another important feature for a porous concrete. Although it is
will not be as strong as a conventional concrete mix, it still must be strong enough to handle the
weight of people or cars, depending on what it is used for. For this experiment, the team
followed the ASTM C39/39M guidelines. The team used the Tinius Olsen 400 kip Universal
Test Machine to break the samples to failure.
Before doing the compression test, it was ensured that the sample was dry. This was done
by leaving it to dry over a few days, or the process could have been accelerated by using an air
compressor to help water evaporate more quickly. After the sample was dry, the sample was then
Sulphur capped on both sides. Sulphur capping ensures that the pressure is distributed evenly
throughout the entire sample when it is compressed.
Sulphur Capping
Porous Concrete Sample
Figure 4:Sulphur capped sample
11
Tinus Olsen Machine
Figure 5: Tinus Olsen Machine

8 - Percolation Rate Test One important feature of pervious concrete is its ability to let water percolate
through it. The permeability of the test sample can be measured by a percolation rate,
which refers to the rate pf which water is able to pass through the concrete sample. The
team decided that to use a simple falling head test in order to measure the sample's
percolation rate. A falling head instead of constant head test was used since it was
recommended by the ACI guidelines to porous concrete. Fortunately, the team did not have
to make the falling head apparatus because a previous student in Santa Clara University
already made one.
According to the Santa Clara student, that testing apparatus was made using PVC
pipes, O-rings, a valve, rubber couplers and a used plastic container. Both Teflon tape and
asphalt binder were used for all connections, to make sure that there would be no leaks.
Dimensions of apparatus
Diameter of plastic cylinder: eight (8) inches
Surface area of plastic cylinder: 50.27 inches
Procedure
1. Make sure the test is done on an even surface
2. Place the cylinder inside the PVC tube opening
3. Tighten it using a screwdriver to ensure water does not leak
4. Place the used plastic container on top of the test cylinder and tighten it using a
screwdriver
5. Open valve to allow water to pass through
6. Pour water inside the plastic container until the pressure from each end of the
apparatus is equalized. Then close valve
7. Pour water to the desired height of the plastic container
8. · Open valve and measure how long it takes for all the water to pass through the
sample
9. Take the time measurement and convert it into volume per hour Repeat 3 times for
each sample
12
(:

Note
Plastic Container
Tube opening
Concrete Sample
Valve
Experiment one: height of water is 12 inches
Experiment two: height of water is six inches
13
Figure 6: Falling head test

9 - Test Results
9.1 - Compression (Part 1)
Table 5:Project test results compared to previous study.
W:CMratio 0.27 0.30 0.34
Loading (lb) NIA 5,136 6,195
Compression Test (psi) NIA 409 493
Previous SCU Study Results.
W:CMratio 0.27 0.30 0.34
Loading (lb) 3,851 10,010 12,580
Compression Test (psi) 306 797 1,001
9.2 - Takeaway (Part 1) Previous studies on porous concrete done by a former SCU student found that the
samples that had the highest compressive strength were the ones with a water to cement
ratio of 0.34. As shown in Table 5, it is evident that these findings agree with previous
studies.
Samples that have the highest compression strength are those with a higher water
to cement ratio and in this case, it was 0.34, while the weakest samples are those with a
water to cement ratio of 0.27. The reason there was N/ A for the results with 0.27 water to
cement ratio was because the sample itself was so weak that it barely held itself together.
Some of the samples actually broke apart during the Sulphur capping process.
In conclusion, porous concrete with a water to cement ratio of 0.34 will yield porous
concrete with the highest compressive strength.
14

9.3 - Compression (Part 2)
Table 7: Compression test results.
Mix Design Loading (lb)
½ Gravel 17615
¾ Gravel 13883
Mix Gravel 8721
¾ Class II 3130
Mix Class II 5517
1600
1401.35 1400
1200 ..., ..c b.O C: 1000 Q) ... ..., V)
C: :=-800 0 V,
·- a. V'I -V'I Q) ... a. 600 E 0 u
400
200
0
½Gravel
Getting compression strength
Compression strength (psi)
¾ Gravel
1401.35
1104.46
693.79
249.00
438.90
Mix Gravel
Design Mix
¾ Class II
Figure 7: Compression Strength Graph.
Equation [# I J
Mix Class II
Compression strength = Loading / Surface Area of sample
Radius of sample = 4 inch Surface area= rrr 2
15
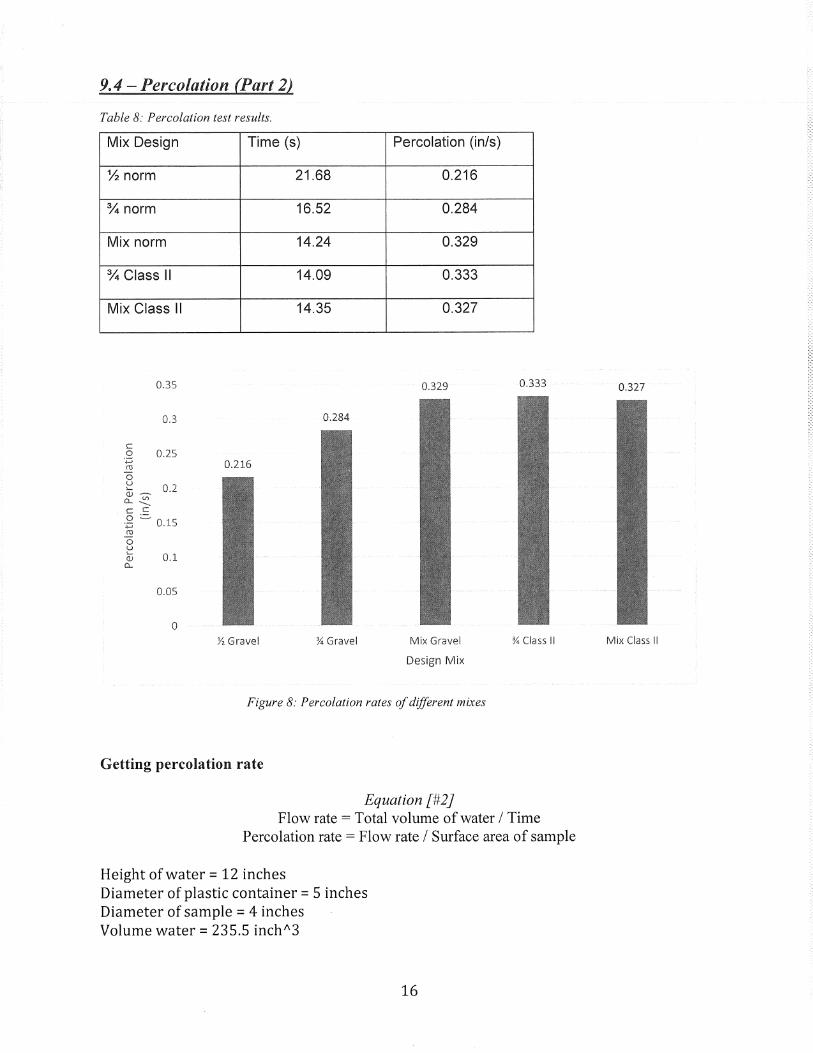
9.4 - Percolation (Part 2)
Table 8: Percolation test results.
Mix Design Time (s) Percolation (in/s)
½norm 21.68 0.216
¾norm 16.52 0.284
Mix norm 14.24 0.329
¾Class II 14.09 0.333
Mix Class II 14.35 0.327
0.35 0.329 0.333
0.3 0.284
C 0 0.25 :;::; 0.216 ~ 0 u
0.2 .... CIJ~ c.. ~
.c C
.g = 0.15 ro 0 u .....
0.1 (!J c..
0.05
0 ½ Gravel ¾ Gravel Mix Gravel ¾ Class II
Design Mix
Figure 8: Percolation rates of different mixes
Getting percolation rate
Equation [#2] Flow rate= Total volume of water/ Time
Percolation rate = Flow rate / Surface area of sample
Height of water= 12 inches Diameter of plastic container = 5 inches Diameter of sample= 4 inches Volume water= 235.5 inchA3
16
0:327
Mix Class II

9.4-Takeaway (Part 2) The results showed that gravel had a much higher compression strength compared to
Class II aggregate. This meant that the hypothesis was incorrect. The reason why the gravel mix
had a higher compression strength than the Class II mix was that the Class II aggregate is a
recycled material. This can be seen from its aggregate properties. Class II aggregate has higher
water absorption and a lower unit weight compared to the gravel. Another reason why this might
be the case is due to cementitious material. The cementitious material seems to be able to bind
better to the gravel mix than the Class II aggregate mix. Cementitious material is the glue that
binds one aggregate to another. The reason for this has to do with the fact that Class II
aggregates have a rougher surface area. The rough surface means more cementitious material
will be used for covering up its rough edges rather than being used to bind to other aggregates.
It was also found that smaller aggregate size leads to a higher compressive strength as
seen from the Figure 8. Half-inch gravel has a higher compressive strength compared to ¾-inch
gravel. Similarly, Mix class II has a higher compressive strength than¾ class II aggregate. The
smaller aggregate size means more compaction and surface area contact between each aggregate,
which leads to greater overall strength.
The results for the percolation rate was the complete opposite of compression strength.
Smaller aggregates tend to lead to a slower percolation rate while larger aggregates leads to a
higher percolation rate. The smaller aggregates have more but smaller voids. This slows down
the movement of water flowing through it.
Moreover, in general Class II aggregate mix has a higher percolation rate than the gravel
mix. The reason for this is the cementitious material once again. The rough surface of the Class
II aggregates used some of its cementitious material to cover them up. This means that there is
less cementitious material actually binding the aggregate itself. Since there is less material
binding the aggregates together, they will have larger voids in-between its aggregate. The larger
voids leads to a higher percolation rate
17

10 - Clogging
10.1 - Problems with Clogging Clogging is one of the main concerns with porous concrete. Porous concrete has such as
its susceptibility in cold climates due to freeze and thaw but clogging is something that is
avoidable. There are two primary ways to prevent clogging: vacuuming or using a pressure
washer. Due to the size of the sample vacuuming, vacuuming would be most practical.
During research, no methods of experimental procedure on how to evaluate the
effectiveness on vacuuming debris in porous concrete were found. So the team came up with an
experimental procedure.
This procedure consists of two parts. The first part was to make sure that the porous
concrete sample had been somewhat clogged, while the second part determined how effective
vacuuming was regarding the clogging problem.
10.2 - Experiment Procedure
Clogging Procedure 1. Test for porosity
2. Place about 30grams of debris on the top of the sample
3. Test for porosity
4. Note the difference in porosity
5. Redo steps 2-4 again until clogged
6. Take off debris that is left on top of sample
7. Test for porosity
8. Record final results
9. Compare result to initial porosity test
10. Wait for sample to dry
18
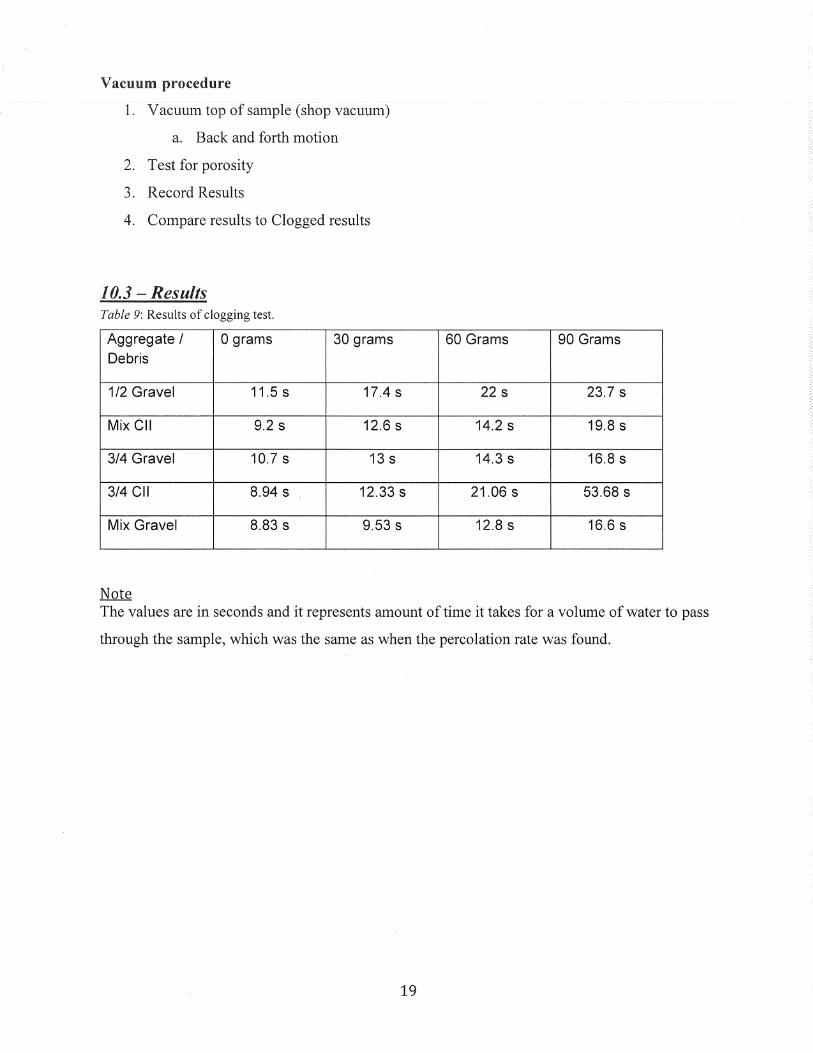
Vacuum procedure
1. Vacuum top of sample (shop vacuum)
a. Back and forth motion
2. Test for porosity
3. Record Results
4. Compare results to Clogged results
10.3 - Results Table 9: Results of clogging test.
Aggregate I 0 grams 30 grams 60 Grams 90 Grams Debris
1/2 Gravel 11.5 s 17.4 s 22 s 23.7 s
Mix CII 9.2 s 12.6 s 14.2 s 19.8 s
3/4 Gravel 10.7 s 13 s 14.3 s 16.8 s
3/4 CII 8.94 s 12.33 s 21.06 s 53.68 s
Mix Gravel 8.83 s 9.53 s 12.8 s 16.6 s
Note The values are in seconds and it represents amount of time it takes for a volume of water to pass
through the sample, which was the same as when the percolation rate was found.
19
60
50
40
-1/2Gravel
0:: (]) 30 E
-Mix CII
i= -3/4Gravel
20
-Mix Gravel
10
0 0 30 60 90
Mass of Debris (g)
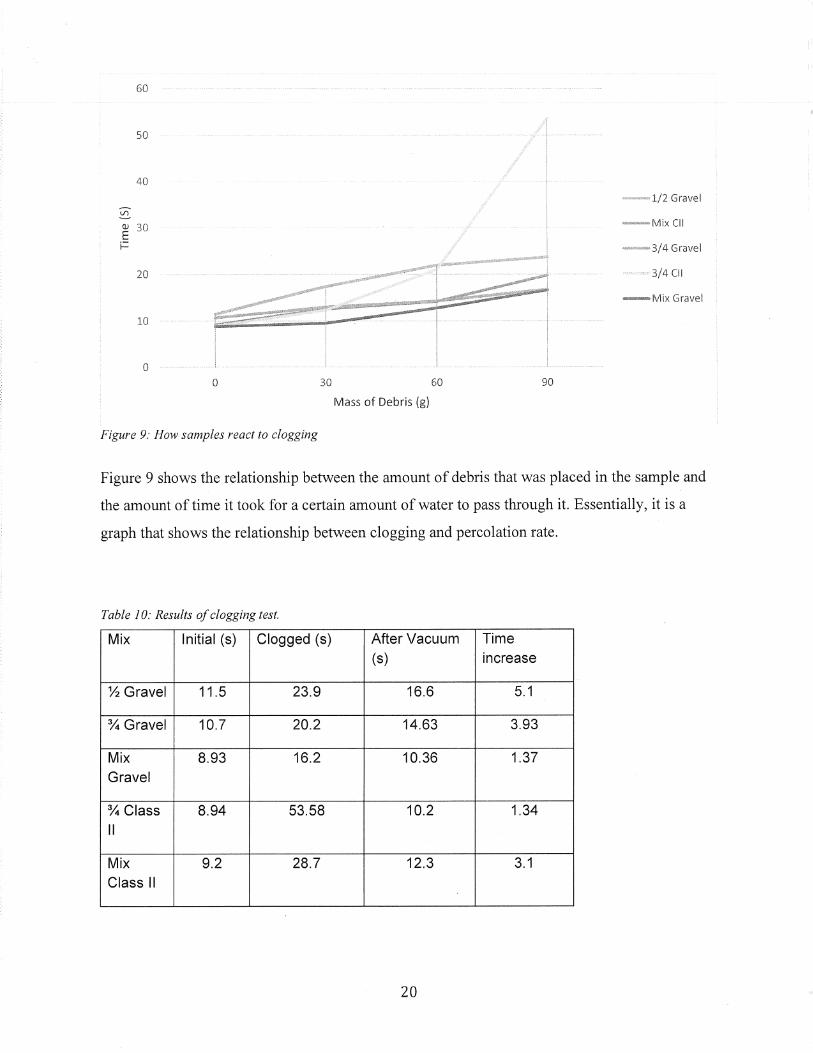
Figure 9: How samples react to clogging
Figure 9 shows the relationship between the amount of debris that was placed in the sample and
the amount of time it took for a certain amount of water to pass through it. Essentially, it is a
graph that shows the relationship between clogging and percolation rate.
Table I 0: Results of clogging test.
Mix Initial (s) Clogged (s) After Vacuum Time (s) increase
½ Gravel 11.5 23.9 16.6 5.1
¾ Gravel 10.7 20.2 14.63 3.93
Mix 8.93 16.2 10.36 1.37
Gravel
¾ Class 8.94 53.58 10.2 1.34
II
Mix 9.2 28.7 12.3 3.1
Class II
20

Table I I: Percentage of permeability lost.
Mix Initial (in/s)
½ Gravel 0.815
¾ Gravel 0.877
Mix 1.050 Gravel
¾ Class 1.049 II
Mix 1.019 Class II
Clogged After vacuum Loss with
(in/s) (in/s) clogging (%)
0.392 0.565 51.88
0.464 0.640 47.03
0.579 0.905 44.88
0.175 0.919 83.31
0.327 0.762 67.94
Equation
% Loss with clogging = (Initial - clogged) I Initial
% Loss after vacuum = (Vacuum -Initial) I Initial
21
Loss after vacuum(%)
30.72
26.86
13.80
12.35
25.20

10.4- Takeaways From the results, the team found that vacuuming was most ineffective with samples
that had smaller aggregate size. The small voids make it more difficult for the vacuum to
take out the debris. Vacuuming the design mix with the Class II aggregates was more
effective than vacuuming the design mix with the gravel aggregate.
Additionally, when the team broke open the mold to every sample after the test, the
team was able to see where the debris stayed inside the sample. It was found that the
vacuum was able to remove debris that was closer to the surface, but it was not able to do
so with debris that has infiltrated about five inches below the surface of the sample.
11 - Conclusion Each and every mixture can fulfill the requirements for even the worst rainstorm but only
some of them have the compressive strength necessary for particle use. In other words, only
some mixtures are able to withstand the compression forces of human traffic and vehicles. From
the findings of this project, it was found that the samples that had the highest compression
strength were the half inch gravel mixture. Due to this fact, the half inch gravel would be the best
design mixture for practical use.
Furthermore, smaller aggregate mixes are more practical because of their small surface
voids. Small surface voids will prevent punctures and, for example, will enable people wearing
high heels to walk on its surfaces without worrying that their heels would get stuck inside the
surface voids. Overall, smaller aggregates mixes are simple a safer and aesthetically pleasing
option. Aggregates that are used should be no bigger than half inch.
11.1-Improvements Some further improvements could be made in order to improve compressive strength of
design mixture. The first possible improvements would be done by adding chemical admixtures
to the mixture. Some admixtures such as water retarders will help increase compression strength
by lowering the water to cement ratio. Another possibility is by using another type of aggregates
22

that is angular similar to Class II aggregate. But this time the new aggregate should not be a
recycled so that's it will yield a higher compression strength.
23

12 - Appendix
A-1
Raw Data for Specific gravity and absorption test
.container . . + . i :
Container. Container i Weight· Weight. Weight aggregate• Container: Aggregate Specific I . Sample (g) : +agweigate 'Aggregate in h20 i Wire .: c3,.~-9.rei~ate.:.9r:t 1.9D'. ..L~rt ..... . ..• ~!~~i~Y..l~~s 3/4 gravel L 217.5 1524.3 1306.8 0.96 0.11 850 1515.4
1/2 class 2 233.3 1245.5 1012.2 0.72 0.11 610 1223.1
1/2 gravel 216.6 1226.6 1010 0.77 0.11 660 1220.1
3/4 class 2 314.9 1233.5 918.6 0.68 0.12 560 1114.7
Raw Data for Specific gravity and absorption test
Bucket · Sample : +aggregate
3/4 , class 2 7.35
3/4 gravel 8.52
11/2 •. ~ravel i112 iclass 2 i
8.62
6.92'
Water Water + specific · Density
Bucket' Aggregate bucket gravity : temperature g/cm3
0.16.
5.16 23: 0.997538 :
24
217.5
233.3 989.8
217.6 . 0.748
228.2 886.5 2.56 1 3.62

13 - References:
ACI 522.1-13 Specification for Pervious Concrete Pavement
25