633 strain measurements on porous concrete samples for...
TRANSCRIPT
Strain measurements on porous concrete samples fortriaxial compression and extension tests under very highconfinementX H Vu*, Y Malecot, and L Daudeville
Universite Joseph Fourier – Grenoble I, Laboratoire Sols, Solides, Structures – Risques, Grenoble, France
The manuscript was received on 31 March 2009 and was accepted after revision for publication on 16 July 2009.
DOI: 10.1243/03093247JSA547
Abstract: This article presents the production of strain measurements on porous concretesamples for use in triaxial compression and extension tests with a very high lateral confiningpressure. When a massive concrete structure is subjected to severe loadings (e.g. rock falls,near-field detonations, and ballistic impacts), the material undergoes triaxial loading at a highconfining pressure. To reproduce high levels of stress with well-controlled loading paths, statictests are carried out on concrete using a high-capacity triaxial press, called GIGA. This pressallows the testing of concrete specimens (7 cm in diameter and 14 or 15.5 cm long) for levels ofconfining pressure ranging up to 850 MPa and axial stresses of up to 2.35 GPa. The porouscharacteristic of the material together with the high confining pressure require both developinga material protection device and building strain gauge-based instrumentation of unprece-dented design for such confining pressures. In addition, the effect of pressure and othersources of error on strain and stress measurements are identified herein thanks to testsperformed on model materials. This study shows that the effect of pressure on strain gaugemeasurements is negligible, whereas this same effect proves significant in the axial displace-ment measurement by means of a linear variable differential transformer (LVDT) sensor andmust be taken into account therefore during the data processing phase. This article will presentthe initial results of triaxial compression tests conducted at high confining pressure on both dryand saturated concrete samples instrumented with gauges. It will also provide results of atriaxial extension test conducted at high confinement on dry concrete: a unique step incharacterizing the triaxial behaviour of concrete. Moreover, it will be demonstrated thatsimultaneous axial strain measurements using gauges and the LVDT sensor serve to evaluatestrain homogeneity of the sample tested at high confinement.
Keywords: concrete, triaxial compression test, triaxial extension test, high confinement, highstress, experimental procedure, strain measurements
1 INTRODUCTION
Concrete is the most widely used manufactured
material in the world. In particular, it is employed in
the building of highly sensitive infrastructure (civil
engineering structures, dams, nuclear power plants,
etc.). Its mechanical behaviour however is still rather
poorly understood, especially under extreme load-
ings. When subjected to violent explosion or ballistic
impact, concrete undergoes very severe triaxial
loadings [1]. In exceptional cases, such an impact
may cause complete perforation of the target. The
validation of concrete behavioural models, which
take the phenomena of fragile damage and irrever-
sible strain in compaction into account simulta-
neously, thus requires test results capable of repro-
ducing complex loading paths.
This triaxial behaviour can be identified under
quasi-static conditions thanks to a triaxial press with
high loading capacity, which allows for a homo-
geneous, well-controlled and precisely guided load-
*Corresponding author: Laboratoire Sols, Solides, Structures –
Risques, Universite Joseph Fourier – Grenoble I, Grenoble, 38041,
France.
email: [email protected]; [email protected]
633
JSA547 J. Strain Analysis Vol. 44
ing. This type of test also makes it possible fully to
instrument the studied object.
A high-capacity press, called GIGA, was specifi-
cally designed and installed in the 3S-R laboratory in
collaboration with France’s ‘Centre d’Etudes de
Gramat’ (Delegation Generale pour l’Armement,
French Ministry of Defence). This cooperative
venture is part of a larger research project on the
vulnerability of concrete infrastructure when sub-
jected to impact. During the initial stage of this
project, the joint mission focused on studying the
quasi-static triaxial behaviour of concrete under very
high confinement. In subsequent studies of this
research, strain rate effects on concrete behaviour
will be examined by means of both split Hopkinson
pressure bar tests [2] and impact tests on targets.
Given the stress levels reached and the macro-
porous nature of the studied concretes, the intro-
duction of triaxial testing has required the creation
of experimental and instrumentation devices. This
article will focus on the development and validation
of such devices. In similar studies previously con-
ducted on smaller samples at lower levels of stress
and confinement [1, 3–6], axial and orthoradial
strain have been measured by means of a linear
variable differential transformer (LVDT) displace-
ment sensor. The pressure effect on an LVDT sensor
measurement, however, was not discussed in any of
these articles. Moreover, the moisture evolution of
concrete samples during preparation before testing
has not been evaluated in any of the preceding
studies either. However, after the cement setting,
concrete is a quasi-saturated material. In most cases,
it is then submitted to an environment with lower
relative humidity, such that a drying process occurs
within the concrete. As the pore network of the
cement matrix is very thin, this moisture transport
proceeds very slowly and can be described using a
diffusion-like equation [7]. The time required to
reach moisture equilibrium varies with the square of
the built structure thickness. Given that most
sensitive concrete infrastructures, such as bridge
piers, dams, and nuclear reactors, are very massive,
their core can remain quasi-saturated most of their
lifetime, while their facing dries very quickly. The
saturation degree of the concrete is then an
important parameter to look at to study the vulner-
ability of such massive infrastructures.
In this paper, the experimental device used to
perform the current study will be described in
section 2. Development of the experimental proce-
dure for carrying out triaxial tests under very high
confinement will be presented in section 3, which
also focuses on the introduction of strain gauges for
strain measurements of porous concrete samples
under very high confinement. To the best of the
current authors’ knowledge, such an approach is
unprecedented at such high confining pressures.
This part of the paper will display the protective
device for gauges and sample, along with the
instrumentation set-up for saturated samples. The
validation of this experimental procedure is the topic
of section 4, which will also address the pressure
effect on responses of the force sensor, extenso-
metric gauges and the LVDT displacement sensor.
Section 5 will offer the initial results of both the
triaxial compression tests conducted on dry and
saturated concretes and a triaxial extension test on
dry concrete. This section will include a discussion
to show how the simultaneous measurements of
axial strain using a gauge and an LVDT sensor enable
the evaluation of the strain homogeneity in the
various samples. The paper closes with a presenta-
tion of the main conclusions from this study and the
outlook for future work.
2 EXPERIMENTAL DEVICE
2.1 The triaxial cell
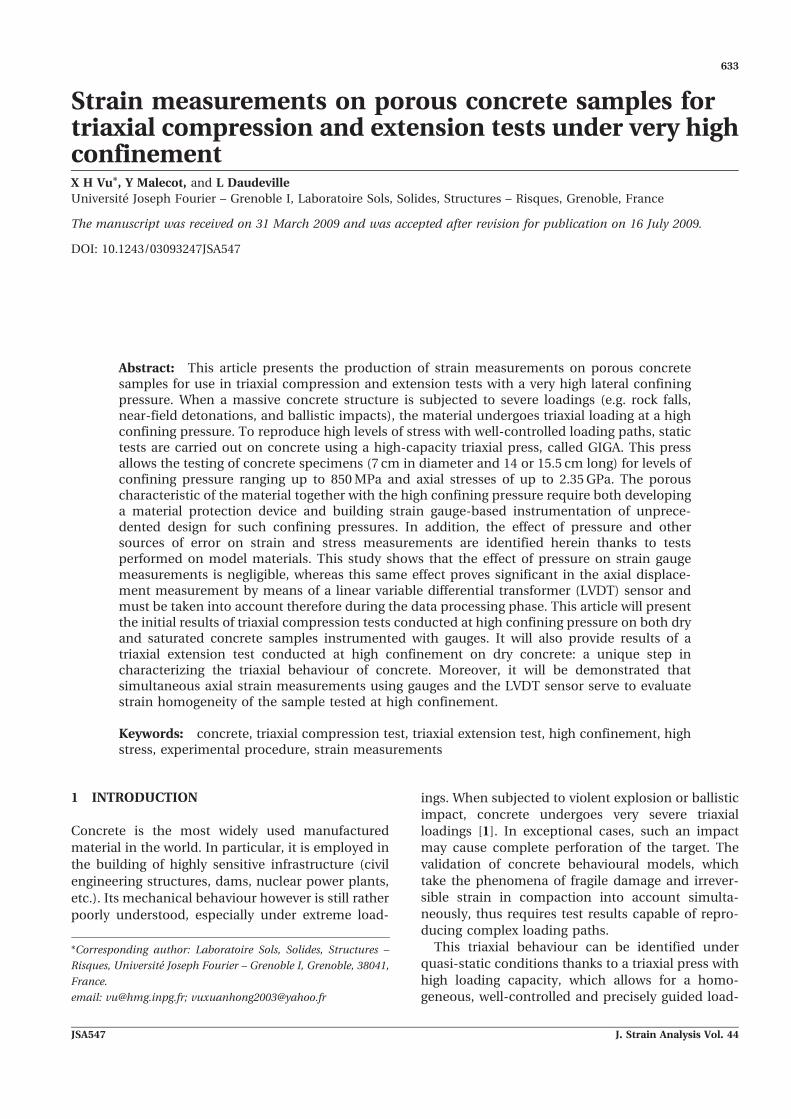
The high-capacity triaxial press, presented in Fig. 1,
was especially designed and developed for this
study. A cross-sectional view of the confinement
cell is shown in Fig. 2, with the concrete sample
being placed inside this cell. The press is able to load
Fig. 1 The GIGA press
634 X H Vu, Y Malecot, and L Daudeville
J. Strain Analysis Vol. 44 JSA547
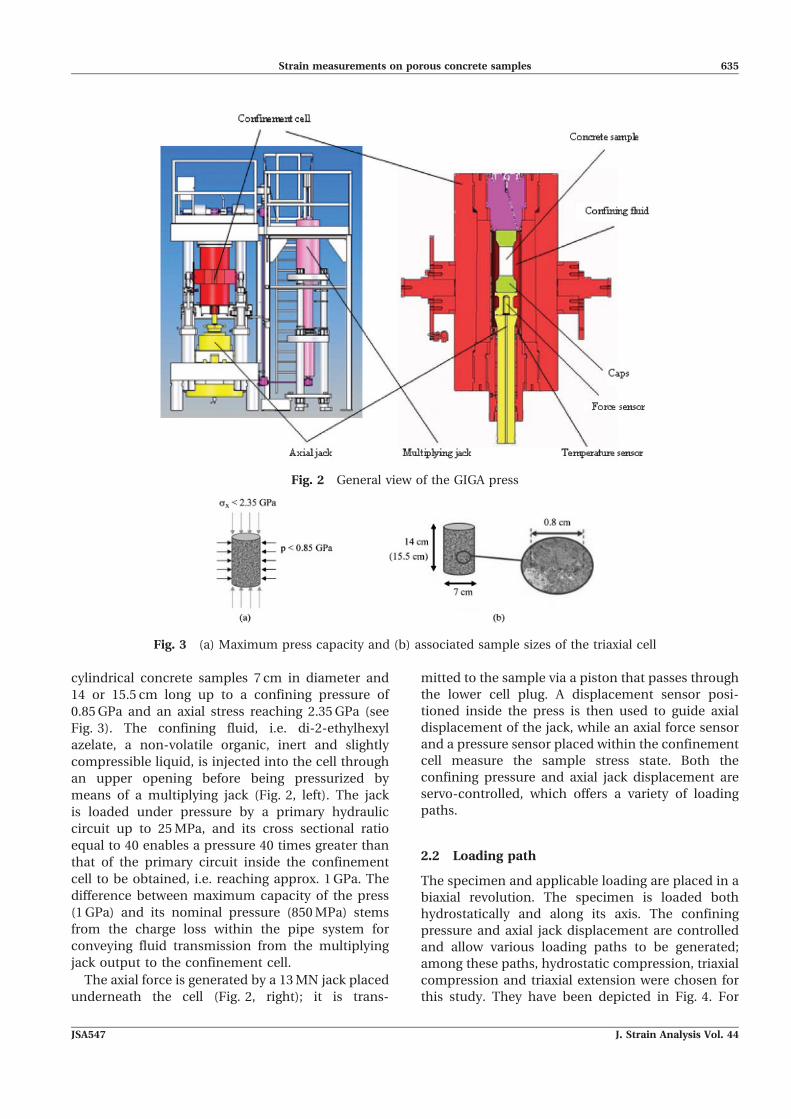
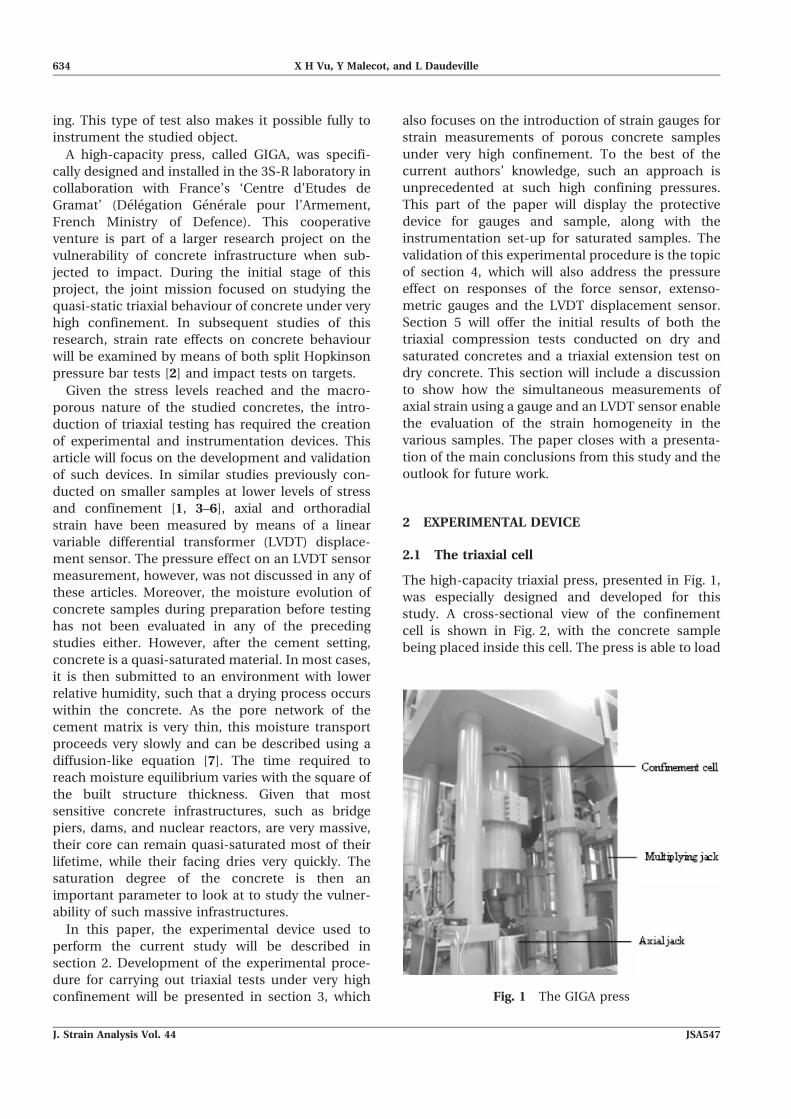
cylindrical concrete samples 7 cm in diameter and
14 or 15.5 cm long up to a confining pressure of
0.85 GPa and an axial stress reaching 2.35 GPa (see
Fig. 3). The confining fluid, i.e. di-2-ethylhexyl
azelate, a non-volatile organic, inert and slightly
compressible liquid, is injected into the cell through
an upper opening before being pressurized by
means of a multiplying jack (Fig. 2, left). The jack
is loaded under pressure by a primary hydraulic
circuit up to 25 MPa, and its cross sectional ratio
equal to 40 enables a pressure 40 times greater than
that of the primary circuit inside the confinement
cell to be obtained, i.e. reaching approx. 1 GPa. The
difference between maximum capacity of the press
(1 GPa) and its nominal pressure (850 MPa) stems
from the charge loss within the pipe system for
conveying fluid transmission from the multiplying
jack output to the confinement cell.
The axial force is generated by a 13 MN jack placed
underneath the cell (Fig. 2, right); it is trans-
mitted to the sample via a piston that passes through
the lower cell plug. A displacement sensor posi-
tioned inside the press is then used to guide axial
displacement of the jack, while an axial force sensor
and a pressure sensor placed within the confinement
cell measure the sample stress state. Both the
confining pressure and axial jack displacement are
servo-controlled, which offers a variety of loading
paths.
2.2 Loading path
The specimen and applicable loading are placed in a
biaxial revolution. The specimen is loaded both
hydrostatically and along its axis. The confining
pressure and axial jack displacement are controlled
and allow various loading paths to be generated;
among these paths, hydrostatic compression, triaxial
compression and triaxial extension were chosen for
this study. They have been depicted in Fig. 4. For
Fig. 2 General view of the GIGA press
Fig. 3 (a) Maximum press capacity and (b) associated sample sizes of the triaxial cell
Strain measurements on porous concrete samples 635
JSA547 J. Strain Analysis Vol. 44
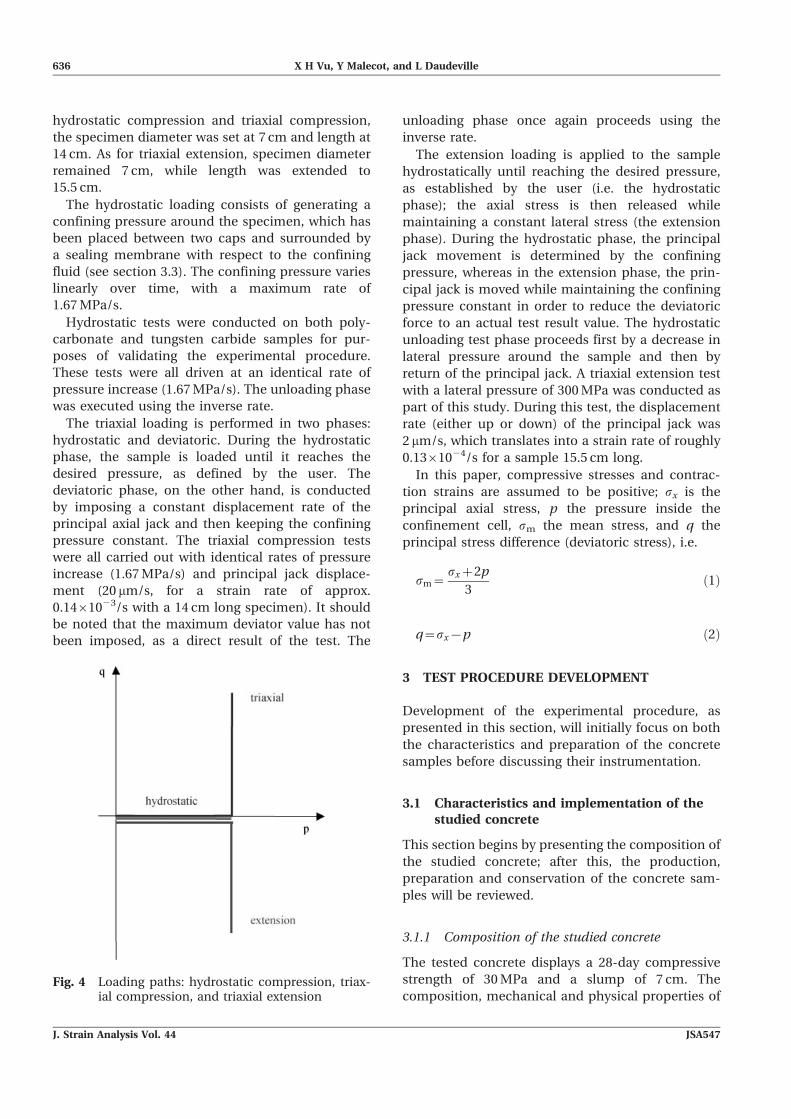
hydrostatic compression and triaxial compression,
the specimen diameter was set at 7 cm and length at
14 cm. As for triaxial extension, specimen diameter
remained 7 cm, while length was extended to
15.5 cm.
The hydrostatic loading consists of generating a
confining pressure around the specimen, which has
been placed between two caps and surrounded by
a sealing membrane with respect to the confining
fluid (see section 3.3). The confining pressure varies
linearly over time, with a maximum rate of
1.67 MPa/s.
Hydrostatic tests were conducted on both poly-
carbonate and tungsten carbide samples for pur-
poses of validating the experimental procedure.
These tests were all driven at an identical rate of
pressure increase (1.67 MPa/s). The unloading phase
was executed using the inverse rate.
The triaxial loading is performed in two phases:
hydrostatic and deviatoric. During the hydrostatic
phase, the sample is loaded until it reaches the
desired pressure, as defined by the user. The
deviatoric phase, on the other hand, is conducted
by imposing a constant displacement rate of the
principal axial jack and then keeping the confining
pressure constant. The triaxial compression tests
were all carried out with identical rates of pressure
increase (1.67 MPa/s) and principal jack displace-
ment (20 mm/s, for a strain rate of approx.
0.1461023/s with a 14 cm long specimen). It should
be noted that the maximum deviator value has not
been imposed, as a direct result of the test. The
unloading phase once again proceeds using the
inverse rate.
The extension loading is applied to the sample
hydrostatically until reaching the desired pressure,
as established by the user (i.e. the hydrostatic
phase); the axial stress is then released while
maintaining a constant lateral stress (the extension
phase). During the hydrostatic phase, the principal
jack movement is determined by the confining
pressure, whereas in the extension phase, the prin-
cipal jack is moved while maintaining the confining
pressure constant in order to reduce the deviatoric
force to an actual test result value. The hydrostatic
unloading test phase proceeds first by a decrease in
lateral pressure around the sample and then by
return of the principal jack. A triaxial extension test
with a lateral pressure of 300 MPa was conducted as
part of this study. During this test, the displacement
rate (either up or down) of the principal jack was
2 mm/s, which translates into a strain rate of roughly
0.1361024/s for a sample 15.5 cm long.
In this paper, compressive stresses and contrac-
tion strains are assumed to be positive; sx is the
principal axial stress, p the pressure inside the
confinement cell, sm the mean stress, and q the
principal stress difference (deviatoric stress), i.e.
sm~sxz2p
3ð1Þ
q~sx{p ð2Þ
3 TEST PROCEDURE DEVELOPMENT
Development of the experimental procedure, as
presented in this section, will initially focus on both
the characteristics and preparation of the concrete
samples before discussing their instrumentation.
3.1 Characteristics and implementation of thestudied concrete
This section begins by presenting the composition of
the studied concrete; after this, the production,
preparation and conservation of the concrete sam-
ples will be reviewed.
3.1.1 Composition of the studied concrete
The tested concrete displays a 28-day compressive
strength of 30 MPa and a slump of 7 cm. The
composition, mechanical and physical properties ofFig. 4 Loading paths: hydrostatic compression, triax-
ial compression, and triaxial extension
636 X H Vu, Y Malecot, and L Daudeville
J. Strain Analysis Vol. 44 JSA547
this concrete are listed in Table 1. It should be noted
that the very high-quality cement used, for purposes
of greater control over material reproducibility, leads
to a particularly low cement volume. Aggregate
compounds containing 99 per cent quartzite are
derived from natural deposits (i.e. rolled aggregates).
The maximum aggregate size (8 mm) has been
chosen on the basis of specimen diameter (70 mm).
According to Yip and Tam [8], the effect of sample
size can be neglected in simple compression for this
maximum aggregate size. This conclusion is as-
sumed to be valid as well in triaxial compression.
3.1.2 Specimen production
A production procedure for the concrete specimens
was established with the aim of ensuring minimal
variability in mechanical properties of the material.
The concrete (R30A7) was cast in a parallelepiped
mould in batches 13.5 l in volume. Concrete place-
ment entails 30 s of vibration on a vibrating table.
The concrete block, upon removal from the mould
24 h after casting, is conserved for 28 days in a
saturated environment within plastic bags immersed
in water, so as to insulate the concrete both
physically and thermally. The block is then cored,
cut and ground. All these machining stages are
performed using water lubrication in order to avoid
heating the concrete. The two sample faces are
parallel to within 0.1 mm on a diameter of 70 mm.
The observation of concrete specimens after ma-
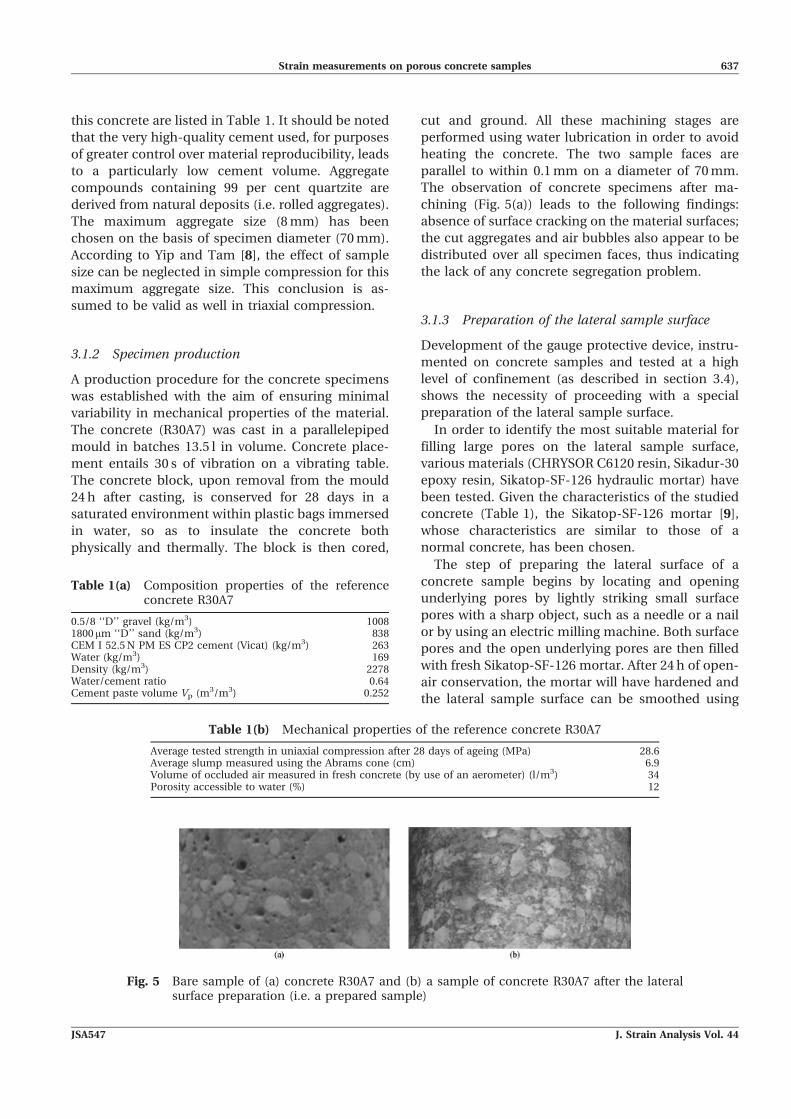
chining (Fig. 5(a)) leads to the following findings:
absence of surface cracking on the material surfaces;
the cut aggregates and air bubbles also appear to be
distributed over all specimen faces, thus indicating
the lack of any concrete segregation problem.
3.1.3 Preparation of the lateral sample surface
Development of the gauge protective device, instru-
mented on concrete samples and tested at a high
level of confinement (as described in section 3.4),
shows the necessity of proceeding with a special
preparation of the lateral sample surface.
In order to identify the most suitable material for
filling large pores on the lateral sample surface,
various materials (CHRYSOR C6120 resin, Sikadur-30
epoxy resin, Sikatop-SF-126 hydraulic mortar) have
been tested. Given the characteristics of the studied
concrete (Table 1), the Sikatop-SF-126 mortar [9],
whose characteristics are similar to those of a
normal concrete, has been chosen.
The step of preparing the lateral surface of a
concrete sample begins by locating and opening
underlying pores by lightly striking small surface
pores with a sharp object, such as a needle or a nail
or by using an electric milling machine. Both surface
pores and the open underlying pores are then filled
with fresh Sikatop-SF-126 mortar. After 24 h of open-
air conservation, the mortar will have hardened and
the lateral sample surface can be smoothed using
Table 1(a) Composition properties of the referenceconcrete R30A7
0.5/8 ‘‘D’’ gravel (kg/m3) 10081800mm ‘‘D’’ sand (kg/m3) 838CEM I 52.5 N PM ES CP2 cement (Vicat) (kg/m3) 263Water (kg/m3) 169Density (kg/m3) 2278Water/cement ratio 0.64Cement paste volume Vp (m3/m3) 0.252
Table 1(b) Mechanical properties of the reference concrete R30A7
Average tested strength in uniaxial compression after 28 days of ageing (MPa) 28.6Average slump measured using the Abrams cone (cm) 6.9Volume of occluded air measured in fresh concrete (by use of an aerometer) (l/m3) 34Porosity accessible to water (%) 12
Fig. 5 Bare sample of (a) concrete R30A7 and (b) a sample of concrete R30A7 after the lateralsurface preparation (i.e. a prepared sample)
Strain measurements on porous concrete samples 637
JSA547 J. Strain Analysis Vol. 44
sandpaper or a small electric sander. It can be
observed that air bubbles on the lateral surface of the
bare sample (Fig. 5(a)) have been completely filled
by the mortar (Fig. 5(b)). A comparative study on
sample mass variation before and after this prepara-
tion step has been performed; results show that the
average quantities of concrete removed and mortar
added for a 7614 cm sample correspond respectively
to 0.6 per cent and 0.8 per cent of sample weight.
This finding therefore suggests that such a lateral
treatment of the sample surface exerts only a
negligible impact on concrete behaviour.
3.1.4 Concrete conservation conditions
The samples are held in water for about 4 months, in
accordance with a conservation procedure. Two
kinds of sample have been tested: dried and
saturated.
After some 4 months of conservation in water, the
‘dried specimens’ are placed in a drying oven, at a
temperature T of 50 uC and relative humidity (RH) of
8 per cent, for a period lasting between 3 and 6
months. Note that after 1 month of oven drying, the
daily variation in sample mass does not exceed 0.1
per cent and can thus be considered stabilized.
According to the study conducted by Castellote et
al. [10], when the cementitious matrix is dried at a
temperature below 50 uC, decomposition of matrix
components is very limited, with the major phe-
nomenon here being the evaporation of free water
within the cementitious matrix. The drying tem-
perature of concrete (50 uC) is thus set so as to avoid
damaging the concrete material.
The ‘dried specimens’ are then conserved in the
ambient laboratory atmosphere (with T equal to
about 18 uC and RH about 40 per cent) during the
instrumentation procedure, which lasts roughly 3
days prior to testing. In such a sample the water
mass in its volume typically increases by around 1.4
per cent after 3 days. The saturation ratio of the
‘dried concrete’ tested in this study is approximately
11 per cent. Note that the sample saturation ratio
(Sr) is estimated from weight measurements as
follows
Sr~1{msat{m
g msat{mhyd
� � ð3Þ
where m is the sample mass, msat the mass of the
saturated sample, mhyd the mass of the saturated
sample obtained from a hydrostatic weighing, and g
the concrete porosity, assumed to be identical for
each concrete sample (i.e. g 5 12 per cent).
The ‘saturated specimens’ are conserved in water
between 6 and 10 months before the test. For the
delicate, saturated specimen, a specific strain gauge
instrumentation procedure needed to be developed;
this is described in section 3.6.
3.2 Strain measurement
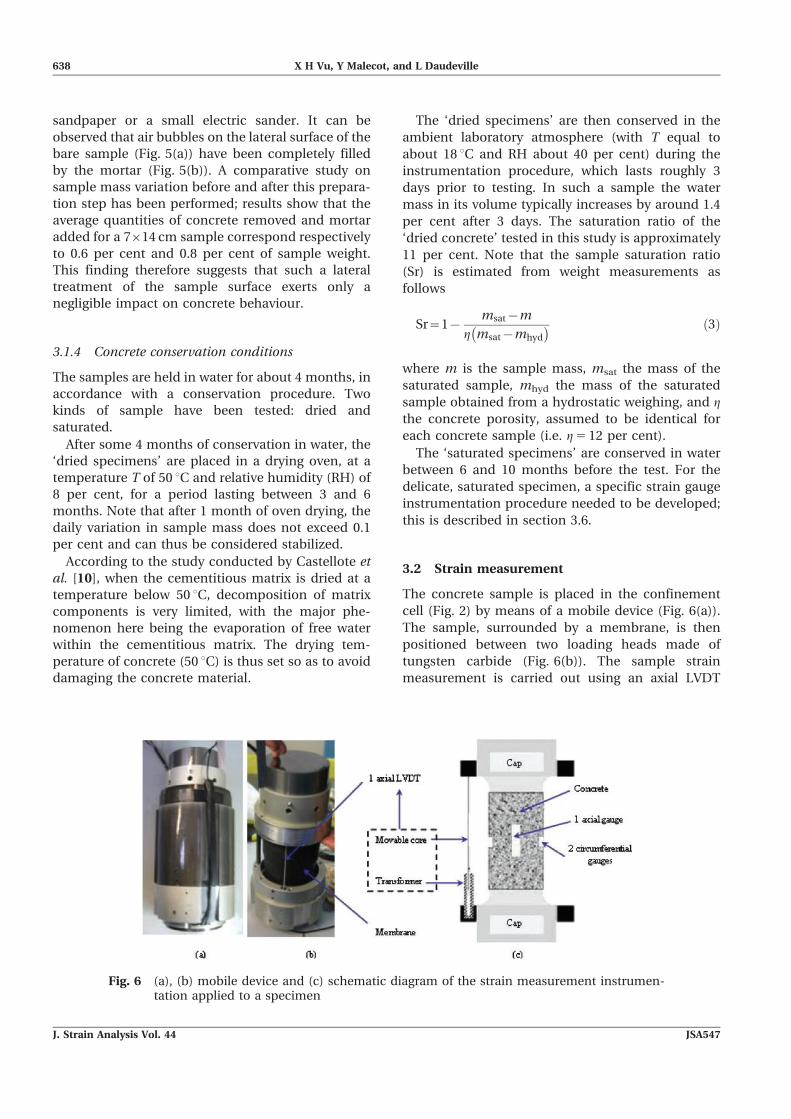
The concrete sample is placed in the confinement
cell (Fig. 2) by means of a mobile device (Fig. 6(a)).
The sample, surrounded by a membrane, is then
positioned between two loading heads made of
tungsten carbide (Fig. 6(b)). The sample strain
measurement is carried out using an axial LVDT
Fig. 6 (a), (b) mobile device and (c) schematic diagram of the strain measurement instrumen-tation applied to a specimen
638 X H Vu, Y Malecot, and L Daudeville
J. Strain Analysis Vol. 44 JSA547
sensor, an axial gauge and two circumferential
gauges (Fig. 6(c)). The LVDT sensor used for this
study, model 500X-3013 manufactured by the
SCHAEVITZ Sensors Company, consists of a trans-
former and a movable magnetic core (Fig. 6(c)).
Each part of the LVDT sensor is fastened onto a
loading head through the aluminium mobile sup-
ports (Figs 6(b) and (c)). This sensor is capable of
measuring relative displacement up to 50 mm. The
axial gauge, bonded to the middle of the concrete
sample, provides a local strain measurement. Note
that during sample implementation on the mobile
device, the LVDT sensor is positioned diametrically
opposite the axial gauge. A comparison of axial
strain, obtained respectively by the LVDT sensor and
the axial gauge, allows evaluation of the sample
strain homogeneity. The circumferential strain is
measured using two diametrically opposed gauges.
These two gauges serve to increase the probability of
maintaining at least one measurement at the end of
the test, while making it possible to verify strain
homogeneity. To the best of the authors’ knowledge,
the use of gauges for triaxial testing on concrete at
such high confinement levels is unprecedented.
The gauges used in this study, of the type EP-08-
120-10CBE from Vishay Micro-Measurements, are
28 mm long, i.e. roughly four times the size of the
largest aggregate in the concrete composition
(Dmax 5 8 mm). These gauges allow for strain mea-
surements up to a 15 per cent elongation, which
corresponds to expected strain at concrete failure
under high confinement.
The GA2 type of glue produced by Vishay Micro-
Measurements is used for bonding gauges and
terminal strips onto the sample. This glue has been
specially adapted for concrete bonding; it allows for
sample strain measurement up to 15 per cent (i.e.
strains measurable by the strain gauge fitted). The
layer of GA2 glue at the interface between gauge and
sample needs to be very thin so that the gauge
response can represent the actual concrete strain
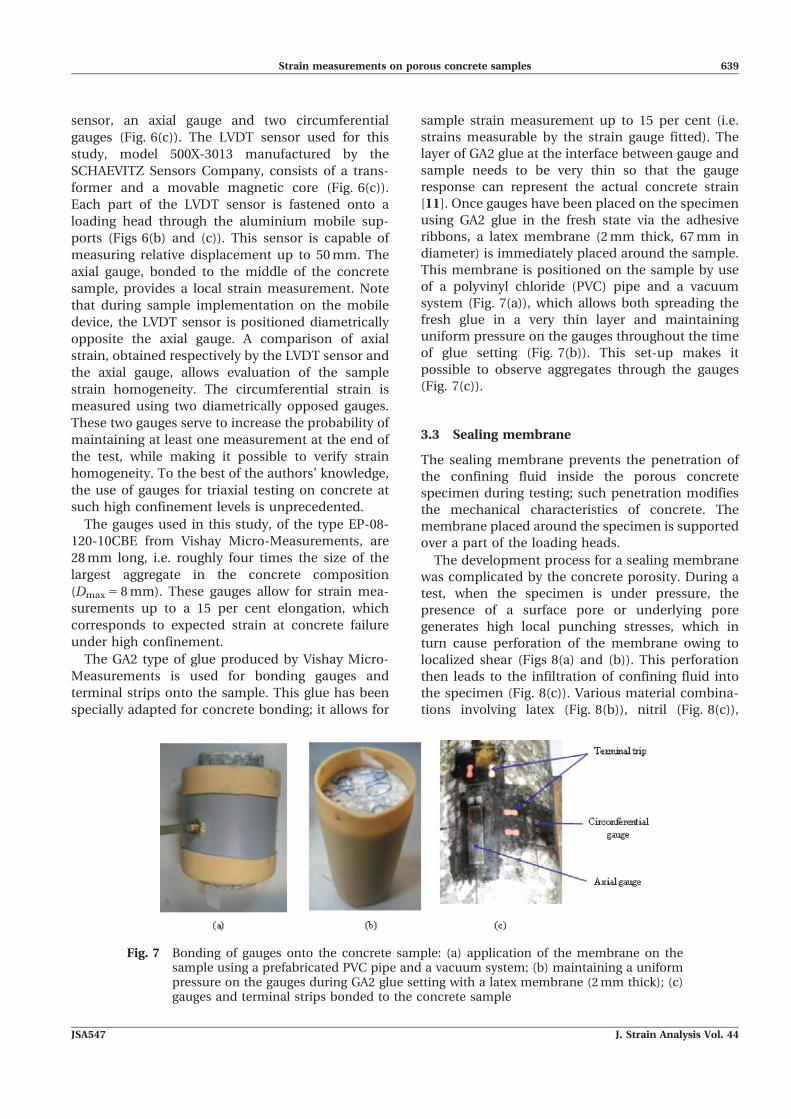
[11]. Once gauges have been placed on the specimen
using GA2 glue in the fresh state via the adhesive
ribbons, a latex membrane (2 mm thick, 67 mm in
diameter) is immediately placed around the sample.
This membrane is positioned on the sample by use
of a polyvinyl chloride (PVC) pipe and a vacuum
system (Fig. 7(a)), which allows both spreading the
fresh glue in a very thin layer and maintaining
uniform pressure on the gauges throughout the time
of glue setting (Fig. 7(b)). This set-up makes it
possible to observe aggregates through the gauges
(Fig. 7(c)).
3.3 Sealing membrane
The sealing membrane prevents the penetration of
the confining fluid inside the porous concrete
specimen during testing; such penetration modifies
the mechanical characteristics of concrete. The
membrane placed around the specimen is supported
over a part of the loading heads.
The development process for a sealing membrane
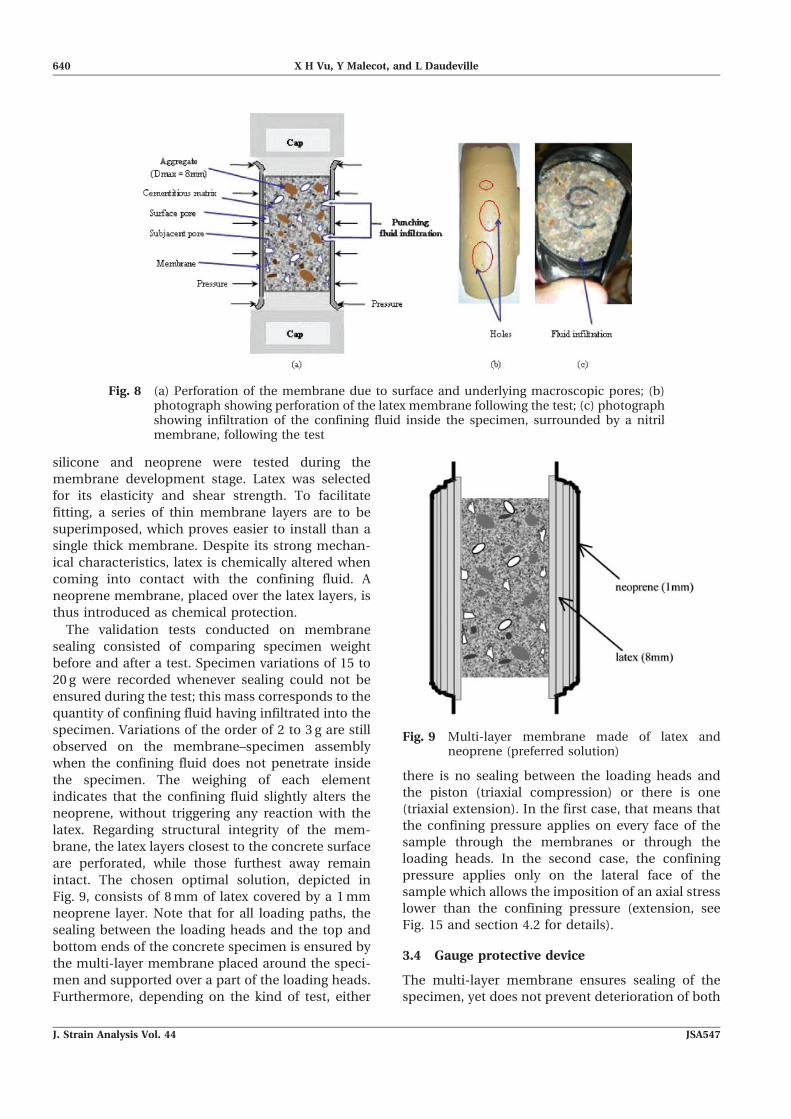
was complicated by the concrete porosity. During a
test, when the specimen is under pressure, the
presence of a surface pore or underlying pore
generates high local punching stresses, which in
turn cause perforation of the membrane owing to
localized shear (Figs 8(a) and (b)). This perforation
then leads to the infiltration of confining fluid into
the specimen (Fig. 8(c)). Various material combina-
tions involving latex (Fig. 8(b)), nitril (Fig. 8(c)),
Fig. 7 Bonding of gauges onto the concrete sample: (a) application of the membrane on thesample using a prefabricated PVC pipe and a vacuum system; (b) maintaining a uniformpressure on the gauges during GA2 glue setting with a latex membrane (2 mm thick); (c)gauges and terminal strips bonded to the concrete sample
Strain measurements on porous concrete samples 639
JSA547 J. Strain Analysis Vol. 44
silicone and neoprene were tested during the
membrane development stage. Latex was selected
for its elasticity and shear strength. To facilitate
fitting, a series of thin membrane layers are to be
superimposed, which proves easier to install than a
single thick membrane. Despite its strong mechan-
ical characteristics, latex is chemically altered when
coming into contact with the confining fluid. A
neoprene membrane, placed over the latex layers, is
thus introduced as chemical protection.
The validation tests conducted on membrane
sealing consisted of comparing specimen weight
before and after a test. Specimen variations of 15 to
20 g were recorded whenever sealing could not be
ensured during the test; this mass corresponds to the
quantity of confining fluid having infiltrated into the
specimen. Variations of the order of 2 to 3 g are still
observed on the membrane–specimen assembly
when the confining fluid does not penetrate inside
the specimen. The weighing of each element
indicates that the confining fluid slightly alters the
neoprene, without triggering any reaction with the
latex. Regarding structural integrity of the mem-
brane, the latex layers closest to the concrete surface
are perforated, while those furthest away remain
intact. The chosen optimal solution, depicted in
Fig. 9, consists of 8 mm of latex covered by a 1 mm
neoprene layer. Note that for all loading paths, the
sealing between the loading heads and the top and
bottom ends of the concrete specimen is ensured by
the multi-layer membrane placed around the speci-
men and supported over a part of the loading heads.
Furthermore, depending on the kind of test, either
there is no sealing between the loading heads and
the piston (triaxial compression) or there is one
(triaxial extension). In the first case, that means that
the confining pressure applies on every face of the
sample through the membranes or through the
loading heads. In the second case, the confining
pressure applies only on the lateral face of the
sample which allows the imposition of an axial stress
lower than the confining pressure (extension, see
Fig. 15 and section 4.2 for details).
3.4 Gauge protective device
The multi-layer membrane ensures sealing of the
specimen, yet does not prevent deterioration of both
Fig. 8 (a) Perforation of the membrane due to surface and underlying macroscopic pores; (b)photograph showing perforation of the latex membrane following the test; (c) photographshowing infiltration of the confining fluid inside the specimen, surrounded by a nitrilmembrane, following the test
Fig. 9 Multi-layer membrane made of latex andneoprene (preferred solution)
640 X H Vu, Y Malecot, and L Daudeville
J. Strain Analysis Vol. 44 JSA547
the gauges and gauge connection wires owing to
punching (Figs 10(a) and (c)) when positioned above
macroscopic or microscopic porosities beneath the
surface. Such a condition leads to a loss of gauge
signal during the test. To resolve this problem, two
levels of protection have been introduced. The first
consists of filling the large-diameter pores on the
specimen lateral surface with mortar (see section
3.1.3), while the second calls for protecting the
gauges with a semi-rigid shield that allows spreading
the confining stress.
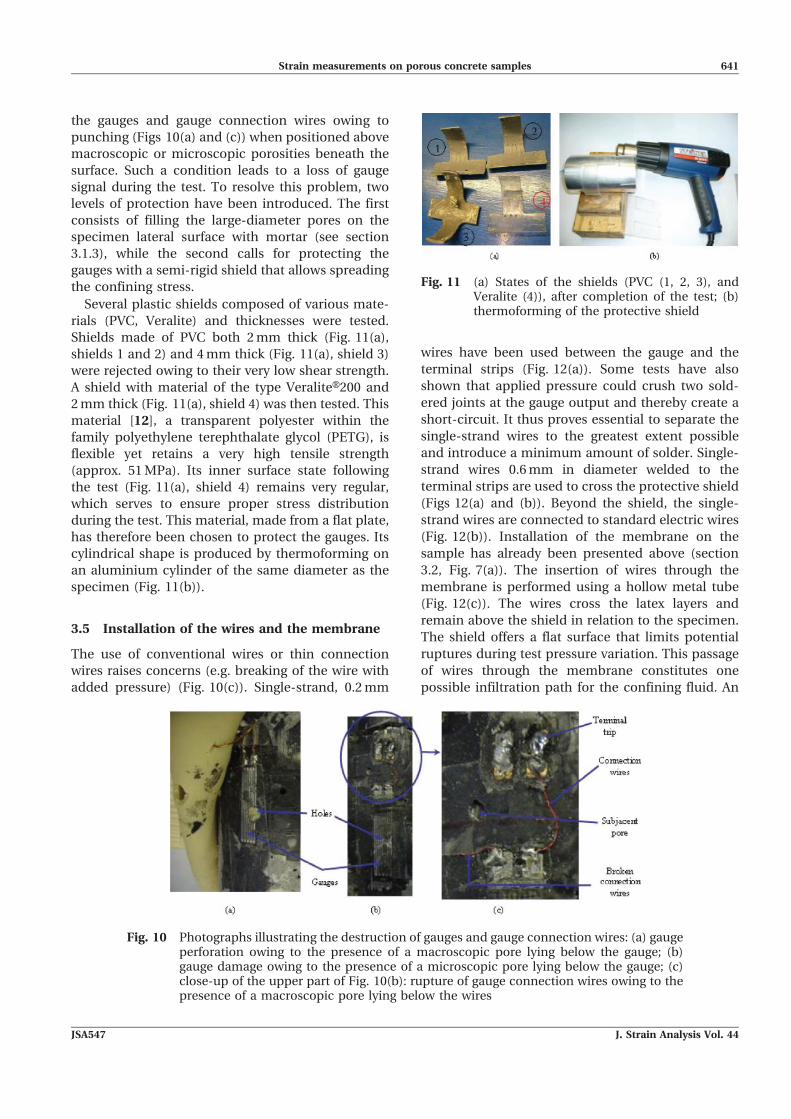
Several plastic shields composed of various mate-
rials (PVC, Veralite) and thicknesses were tested.
Shields made of PVC both 2 mm thick (Fig. 11(a),
shields 1 and 2) and 4 mm thick (Fig. 11(a), shield 3)
were rejected owing to their very low shear strength.
A shield with material of the type VeraliteH200 and
2 mm thick (Fig. 11(a), shield 4) was then tested. This
material [12], a transparent polyester within the
family polyethylene terephthalate glycol (PETG), is
flexible yet retains a very high tensile strength
(approx. 51 MPa). Its inner surface state following
the test (Fig. 11(a), shield 4) remains very regular,
which serves to ensure proper stress distribution
during the test. This material, made from a flat plate,
has therefore been chosen to protect the gauges. Its
cylindrical shape is produced by thermoforming on
an aluminium cylinder of the same diameter as the
specimen (Fig. 11(b)).
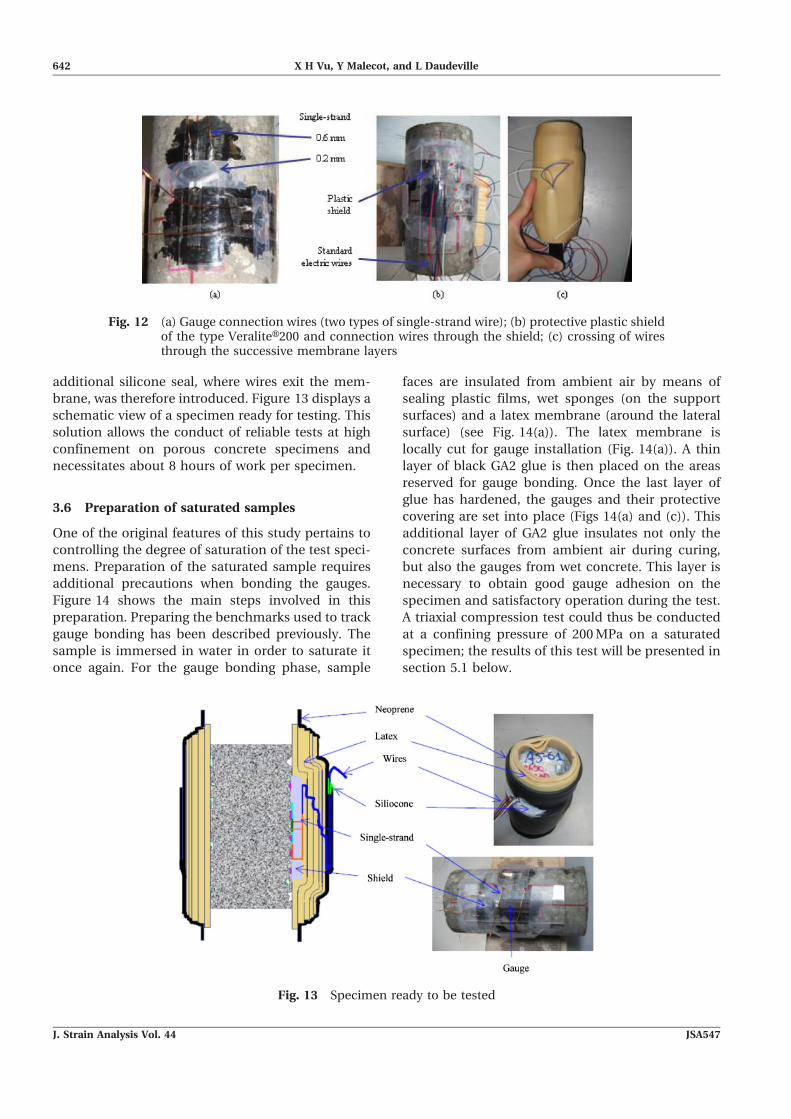
3.5 Installation of the wires and the membrane
The use of conventional wires or thin connection
wires raises concerns (e.g. breaking of the wire with
added pressure) (Fig. 10(c)). Single-strand, 0.2 mm
wires have been used between the gauge and the
terminal strips (Fig. 12(a)). Some tests have also
shown that applied pressure could crush two sold-
ered joints at the gauge output and thereby create a
short-circuit. It thus proves essential to separate the
single-strand wires to the greatest extent possible
and introduce a minimum amount of solder. Single-
strand wires 0.6 mm in diameter welded to the
terminal strips are used to cross the protective shield
(Figs 12(a) and (b)). Beyond the shield, the single-
strand wires are connected to standard electric wires
(Fig. 12(b)). Installation of the membrane on the
sample has already been presented above (section
3.2, Fig. 7(a)). The insertion of wires through the
membrane is performed using a hollow metal tube
(Fig. 12(c)). The wires cross the latex layers and
remain above the shield in relation to the specimen.
The shield offers a flat surface that limits potential
ruptures during test pressure variation. This passage
of wires through the membrane constitutes one
possible infiltration path for the confining fluid. An
Fig. 10 Photographs illustrating the destruction of gauges and gauge connection wires: (a) gaugeperforation owing to the presence of a macroscopic pore lying below the gauge; (b)gauge damage owing to the presence of a microscopic pore lying below the gauge; (c)close-up of the upper part of Fig. 10(b): rupture of gauge connection wires owing to thepresence of a macroscopic pore lying below the wires
Fig. 11 (a) States of the shields (PVC (1, 2, 3), andVeralite (4)), after completion of the test; (b)thermoforming of the protective shield
Strain measurements on porous concrete samples 641
JSA547 J. Strain Analysis Vol. 44
additional silicone seal, where wires exit the mem-
brane, was therefore introduced. Figure 13 displays a
schematic view of a specimen ready for testing. This
solution allows the conduct of reliable tests at high
confinement on porous concrete specimens and
necessitates about 8 hours of work per specimen.
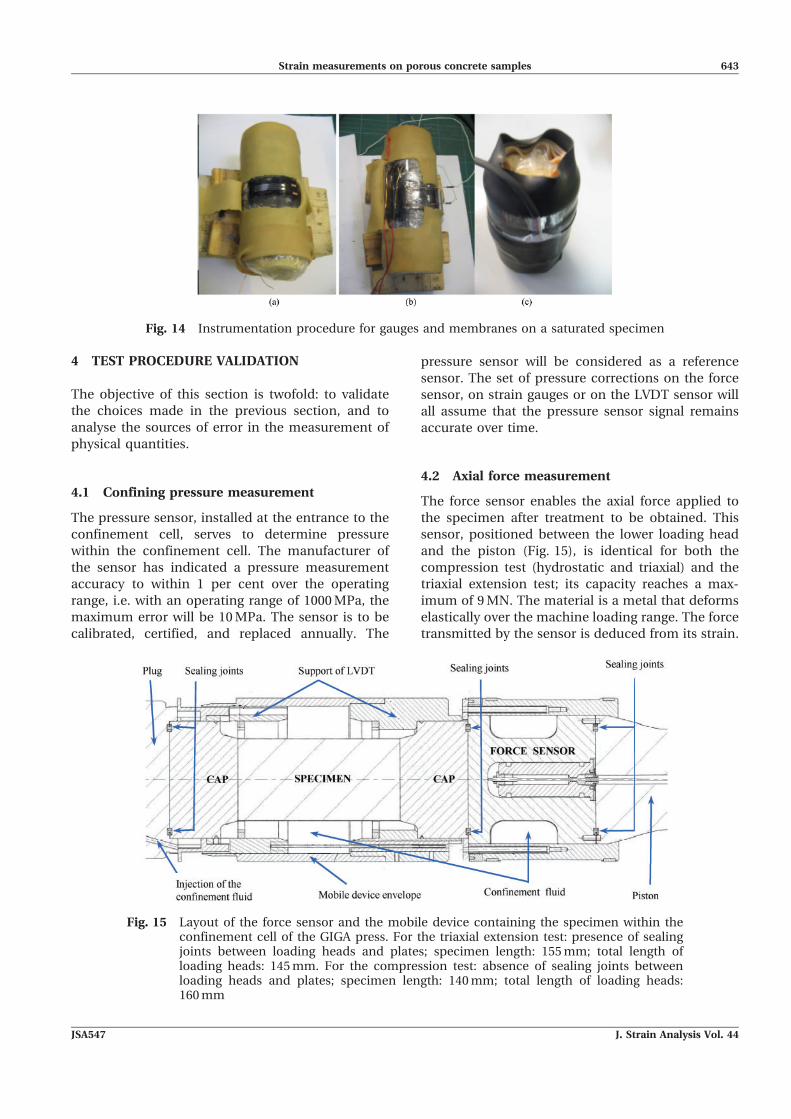
3.6 Preparation of saturated samples
One of the original features of this study pertains to
controlling the degree of saturation of the test speci-
mens. Preparation of the saturated sample requires
additional precautions when bonding the gauges.
Figure 14 shows the main steps involved in this
preparation. Preparing the benchmarks used to track
gauge bonding has been described previously. The
sample is immersed in water in order to saturate it
once again. For the gauge bonding phase, sample
faces are insulated from ambient air by means of
sealing plastic films, wet sponges (on the support
surfaces) and a latex membrane (around the lateral
surface) (see Fig. 14(a)). The latex membrane is
locally cut for gauge installation (Fig. 14(a)). A thin
layer of black GA2 glue is then placed on the areas
reserved for gauge bonding. Once the last layer of
glue has hardened, the gauges and their protective
covering are set into place (Figs 14(a) and (c)). This
additional layer of GA2 glue insulates not only the
concrete surfaces from ambient air during curing,
but also the gauges from wet concrete. This layer is
necessary to obtain good gauge adhesion on the
specimen and satisfactory operation during the test.
A triaxial compression test could thus be conducted
at a confining pressure of 200 MPa on a saturated
specimen; the results of this test will be presented in
section 5.1 below.
Fig. 12 (a) Gauge connection wires (two types of single-strand wire); (b) protective plastic shieldof the type VeraliteH200 and connection wires through the shield; (c) crossing of wiresthrough the successive membrane layers
Fig. 13 Specimen ready to be tested
642 X H Vu, Y Malecot, and L Daudeville
J. Strain Analysis Vol. 44 JSA547
4 TEST PROCEDURE VALIDATION
The objective of this section is twofold: to validate
the choices made in the previous section, and to
analyse the sources of error in the measurement of
physical quantities.
4.1 Confining pressure measurement
The pressure sensor, installed at the entrance to the
confinement cell, serves to determine pressure
within the confinement cell. The manufacturer of
the sensor has indicated a pressure measurement
accuracy to within 1 per cent over the operating
range, i.e. with an operating range of 1000 MPa, the
maximum error will be 10 MPa. The sensor is to be
calibrated, certified, and replaced annually. The
pressure sensor will be considered as a reference
sensor. The set of pressure corrections on the force
sensor, on strain gauges or on the LVDT sensor will
all assume that the pressure sensor signal remains
accurate over time.
4.2 Axial force measurement
The force sensor enables the axial force applied to
the specimen after treatment to be obtained. This
sensor, positioned between the lower loading head
and the piston (Fig. 15), is identical for both the
compression test (hydrostatic and triaxial) and the
triaxial extension test; its capacity reaches a max-
imum of 9 MN. The material is a metal that deforms
elastically over the machine loading range. The force
transmitted by the sensor is deduced from its strain.
Fig. 14 Instrumentation procedure for gauges and membranes on a saturated specimen
Fig. 15 Layout of the force sensor and the mobile device containing the specimen within theconfinement cell of the GIGA press. For the triaxial extension test: presence of sealingjoints between loading heads and plates; specimen length: 155 mm; total length ofloading heads: 145 mm. For the compression test: absence of sealing joints betweenloading heads and plates; specimen length: 140 mm; total length of loading heads:160 mm
Strain measurements on porous concrete samples 643
JSA547 J. Strain Analysis Vol. 44
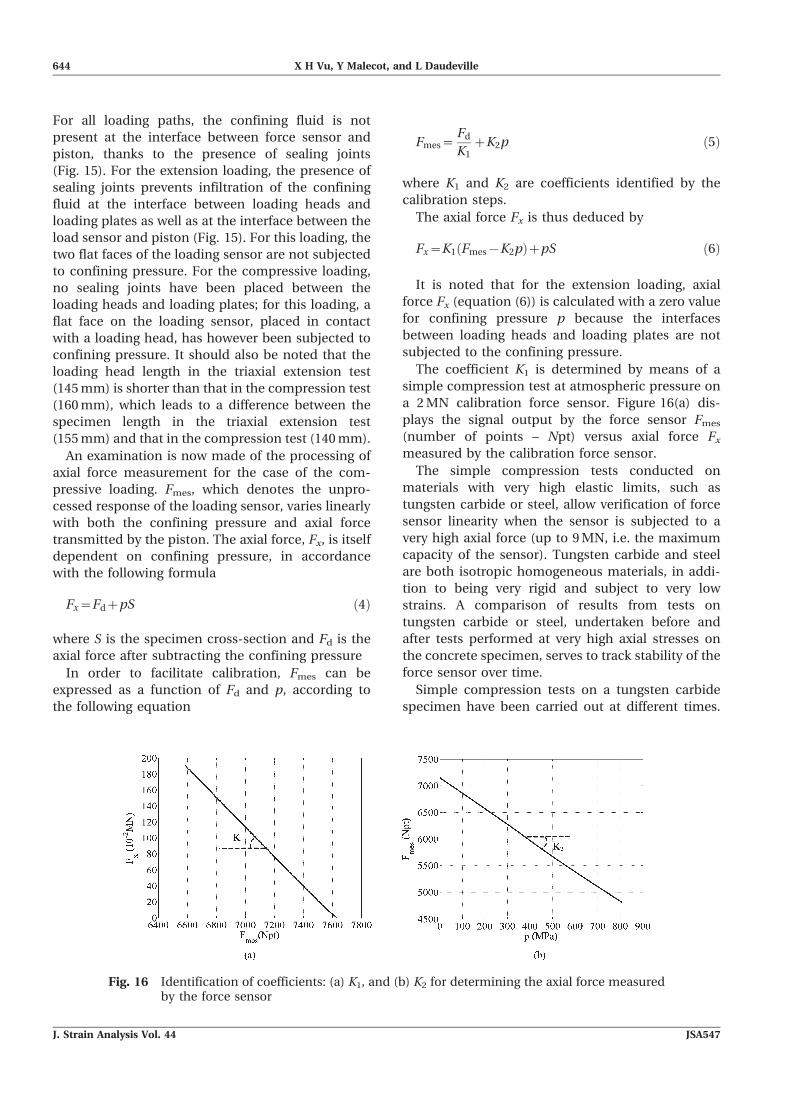
For all loading paths, the confining fluid is not
present at the interface between force sensor and
piston, thanks to the presence of sealing joints
(Fig. 15). For the extension loading, the presence of
sealing joints prevents infiltration of the confining
fluid at the interface between loading heads and
loading plates as well as at the interface between the
load sensor and piston (Fig. 15). For this loading, the
two flat faces of the loading sensor are not subjected
to confining pressure. For the compressive loading,
no sealing joints have been placed between the
loading heads and loading plates; for this loading, a
flat face on the loading sensor, placed in contact
with a loading head, has however been subjected to
confining pressure. It should also be noted that the
loading head length in the triaxial extension test
(145 mm) is shorter than that in the compression test
(160 mm), which leads to a difference between the
specimen length in the triaxial extension test
(155 mm) and that in the compression test (140 mm).
An examination is now made of the processing of
axial force measurement for the case of the com-
pressive loading. Fmes, which denotes the unpro-
cessed response of the loading sensor, varies linearly
with both the confining pressure and axial force
transmitted by the piston. The axial force, Fx, is itself
dependent on confining pressure, in accordance
with the following formula
Fx~FdzpS ð4Þ
where S is the specimen cross-section and Fd is the
axial force after subtracting the confining pressure
In order to facilitate calibration, Fmes can be
expressed as a function of Fd and p, according to
the following equation
Fmes~Fd
K1zK2p ð5Þ
where K1 and K2 are coefficients identified by the
calibration steps.
The axial force Fx is thus deduced by
Fx~K1 Fmes{K2pð ÞzpS ð6Þ
It is noted that for the extension loading, axial
force Fx (equation (6)) is calculated with a zero value
for confining pressure p because the interfaces
between loading heads and loading plates are not
subjected to the confining pressure.
The coefficient K1 is determined by means of a
simple compression test at atmospheric pressure on
a 2 MN calibration force sensor. Figure 16(a) dis-
plays the signal output by the force sensor Fmes
(number of points – Npt) versus axial force Fx
measured by the calibration force sensor.
The simple compression tests conducted on
materials with very high elastic limits, such as
tungsten carbide or steel, allow verification of force
sensor linearity when the sensor is subjected to a
very high axial force (up to 9 MN, i.e. the maximum
capacity of the sensor). Tungsten carbide and steel
are both isotropic homogeneous materials, in addi-
tion to being very rigid and subject to very low
strains. A comparison of results from tests on
tungsten carbide or steel, undertaken before and
after tests performed at very high axial stresses on
the concrete specimen, serves to track stability of the
force sensor over time.
Simple compression tests on a tungsten carbide
specimen have been carried out at different times.
Fig. 16 Identification of coefficients: (a) K1, and (b) K2 for determining the axial force measuredby the force sensor
644 X H Vu, Y Malecot, and L Daudeville
J. Strain Analysis Vol. 44 JSA547
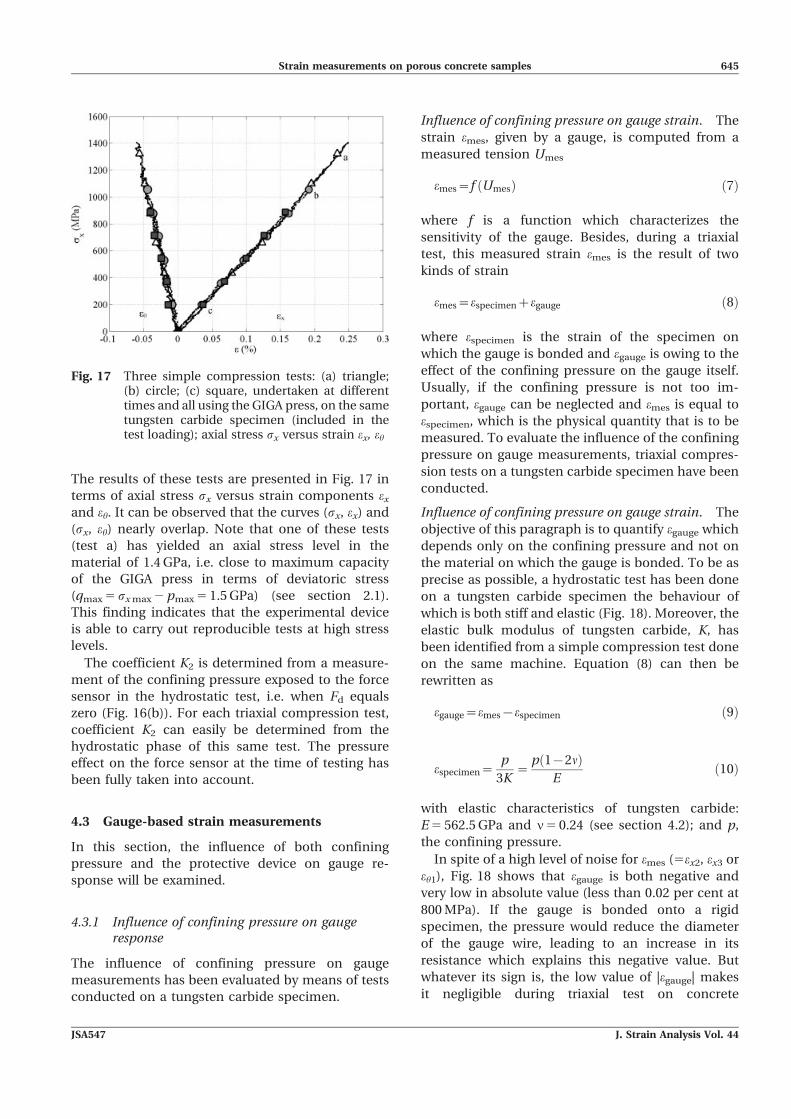
The results of these tests are presented in Fig. 17 in
terms of axial stress sx versus strain components ex
and eh. It can be observed that the curves (sx, ex) and
(sx, eh) nearly overlap. Note that one of these tests
(test a) has yielded an axial stress level in the
material of 1.4 GPa, i.e. close to maximum capacity
of the GIGA press in terms of deviatoric stress
(qmax 5 sx max 2 pmax 5 1.5 GPa) (see section 2.1).
This finding indicates that the experimental device
is able to carry out reproducible tests at high stress
levels.
The coefficient K2 is determined from a measure-
ment of the confining pressure exposed to the force
sensor in the hydrostatic test, i.e. when Fd equals
zero (Fig. 16(b)). For each triaxial compression test,
coefficient K2 can easily be determined from the
hydrostatic phase of this same test. The pressure
effect on the force sensor at the time of testing has
been fully taken into account.
4.3 Gauge-based strain measurements
In this section, the influence of both confining
pressure and the protective device on gauge re-
sponse will be examined.
4.3.1 Influence of confining pressure on gaugeresponse
The influence of confining pressure on gauge
measurements has been evaluated by means of tests
conducted on a tungsten carbide specimen.
Influence of confining pressure on gauge strain. The
strain emes, given by a gauge, is computed from a
measured tension Umes
emes~f Umesð Þ ð7Þ
where f is a function which characterizes the
sensitivity of the gauge. Besides, during a triaxial
test, this measured strain emes is the result of two
kinds of strain
emes~especimenzegauge ð8Þ
where especimen is the strain of the specimen on
which the gauge is bonded and egauge is owing to the
effect of the confining pressure on the gauge itself.
Usually, if the confining pressure is not too im-
portant, egauge can be neglected and emes is equal to
especimen, which is the physical quantity that is to be
measured. To evaluate the influence of the confining
pressure on gauge measurements, triaxial compres-
sion tests on a tungsten carbide specimen have been
conducted.
Influence of confining pressure on gauge strain. The
objective of this paragraph is to quantify egauge which
depends only on the confining pressure and not on
the material on which the gauge is bonded. To be as
precise as possible, a hydrostatic test has been done
on a tungsten carbide specimen the behaviour of
which is both stiff and elastic (Fig. 18). Moreover, the
elastic bulk modulus of tungsten carbide, K, has
been identified from a simple compression test done
on the same machine. Equation (8) can then be
rewritten as
egauge~emes{especimen ð9Þ
especimen~p
3K~
p 1{2nð ÞE
ð10Þ
with elastic characteristics of tungsten carbide:
E 5 562.5 GPa and n5 0.24 (see section 4.2); and p,
the confining pressure.
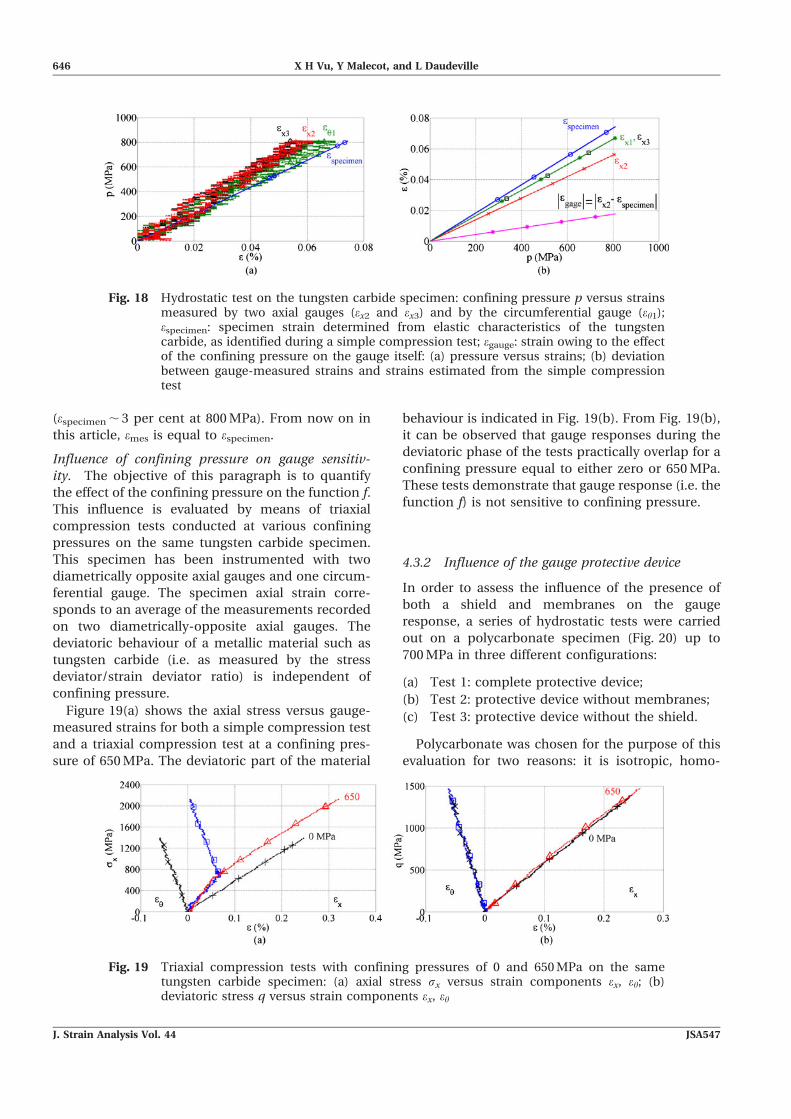
In spite of a high level of noise for emes (5ex2, ex3 or
eh1), Fig. 18 shows that egauge is both negative and
very low in absolute value (less than 0.02 per cent at
800 MPa). If the gauge is bonded onto a rigid
specimen, the pressure would reduce the diameter
of the gauge wire, leading to an increase in its
resistance which explains this negative value. But
whatever its sign is, the low value of |egauge| makes
it negligible during triaxial test on concrete
Fig. 17 Three simple compression tests: (a) triangle;(b) circle; (c) square, undertaken at differenttimes and all using the GIGA press, on the sametungsten carbide specimen (included in thetest loading); axial stress sx versus strain ex, eh
Strain measurements on porous concrete samples 645
JSA547 J. Strain Analysis Vol. 44
(especimen , 3 per cent at 800 MPa). From now on in
this article, emes is equal to especimen.
Influence of confining pressure on gauge sensitiv-
ity. The objective of this paragraph is to quantify
the effect of the confining pressure on the function f.
This influence is evaluated by means of triaxial
compression tests conducted at various confining
pressures on the same tungsten carbide specimen.
This specimen has been instrumented with two
diametrically opposite axial gauges and one circum-
ferential gauge. The specimen axial strain corre-
sponds to an average of the measurements recorded
on two diametrically-opposite axial gauges. The
deviatoric behaviour of a metallic material such as
tungsten carbide (i.e. as measured by the stress
deviator/strain deviator ratio) is independent of
confining pressure.
Figure 19(a) shows the axial stress versus gauge-
measured strains for both a simple compression test
and a triaxial compression test at a confining pres-
sure of 650 MPa. The deviatoric part of the material
behaviour is indicated in Fig. 19(b). From Fig. 19(b),
it can be observed that gauge responses during the
deviatoric phase of the tests practically overlap for a
confining pressure equal to either zero or 650 MPa.
These tests demonstrate that gauge response (i.e. the
function f) is not sensitive to confining pressure.
4.3.2 Influence of the gauge protective device
In order to assess the influence of the presence of
both a shield and membranes on the gauge
response, a series of hydrostatic tests were carried
out on a polycarbonate specimen (Fig. 20) up to
700 MPa in three different configurations:
(a) Test 1: complete protective device;
(b) Test 2: protective device without membranes;
(c) Test 3: protective device without the shield.
Polycarbonate was chosen for the purpose of this
evaluation for two reasons: it is isotropic, homo-
Fig. 18 Hydrostatic test on the tungsten carbide specimen: confining pressure p versus strainsmeasured by two axial gauges (ex2 and ex3) and by the circumferential gauge (eh1);especimen: specimen strain determined from elastic characteristics of the tungstencarbide, as identified during a simple compression test; egauge: strain owing to the effectof the confining pressure on the gauge itself: (a) pressure versus strains; (b) deviationbetween gauge-measured strains and strains estimated from the simple compressiontest
Fig. 19 Triaxial compression tests with confining pressures of 0 and 650 MPa on the sametungsten carbide specimen: (a) axial stress sx versus strain components ex, eh; (b)deviatoric stress q versus strain components ex, eh
646 X H Vu, Y Malecot, and L Daudeville
J. Strain Analysis Vol. 44 JSA547
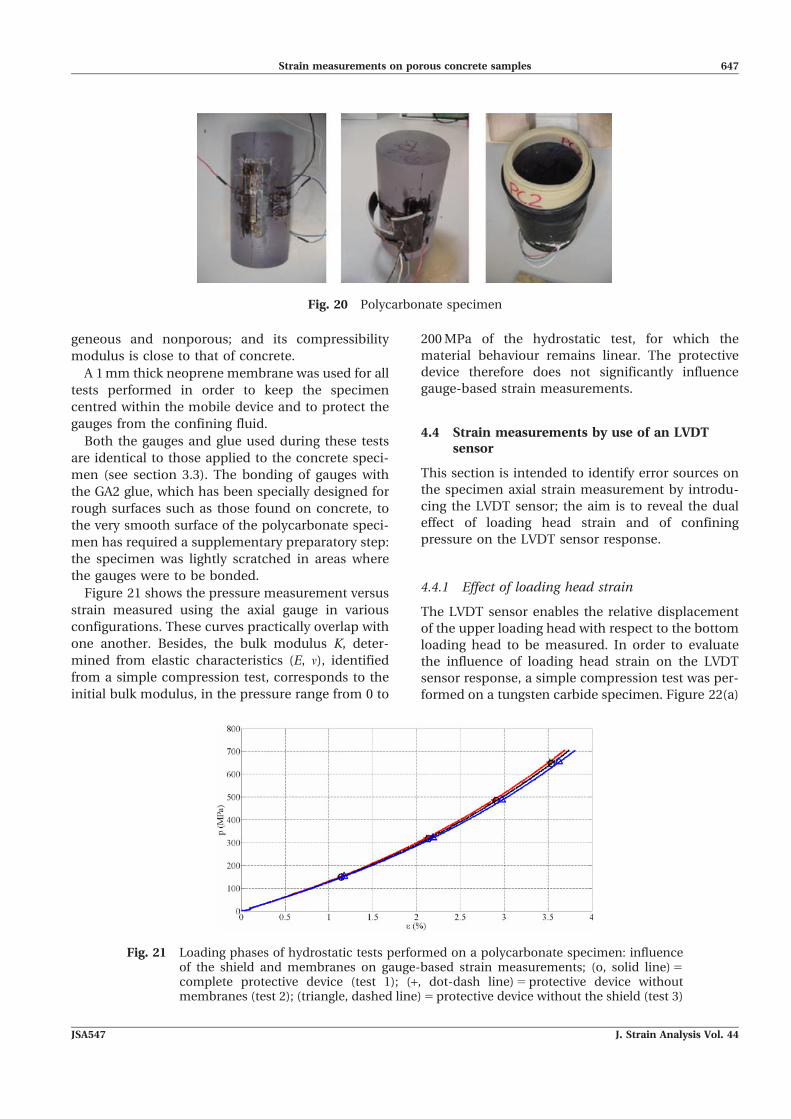
geneous and nonporous; and its compressibility
modulus is close to that of concrete.
A 1 mm thick neoprene membrane was used for all
tests performed in order to keep the specimen
centred within the mobile device and to protect the
gauges from the confining fluid.
Both the gauges and glue used during these tests
are identical to those applied to the concrete speci-
men (see section 3.3). The bonding of gauges with
the GA2 glue, which has been specially designed for
rough surfaces such as those found on concrete, to
the very smooth surface of the polycarbonate speci-
men has required a supplementary preparatory step:
the specimen was lightly scratched in areas where
the gauges were to be bonded.
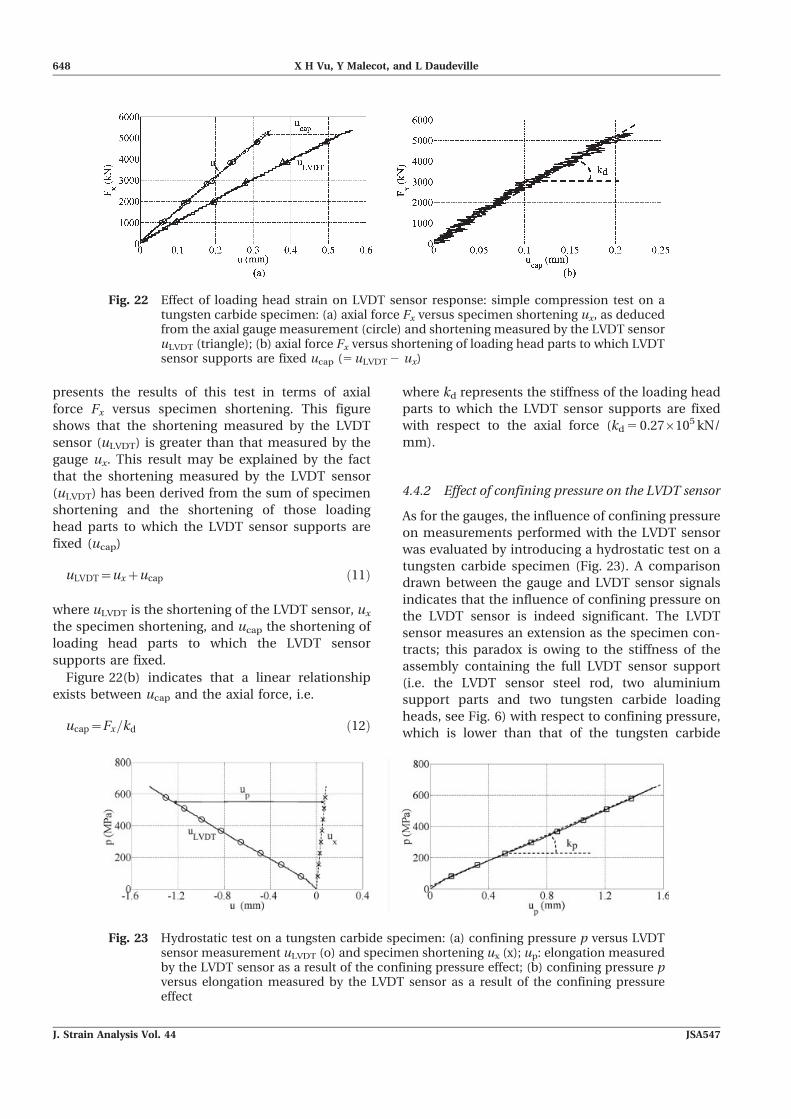
Figure 21 shows the pressure measurement versus
strain measured using the axial gauge in various
configurations. These curves practically overlap with
one another. Besides, the bulk modulus K, deter-
mined from elastic characteristics (E, n), identified
from a simple compression test, corresponds to the
initial bulk modulus, in the pressure range from 0 to
200 MPa of the hydrostatic test, for which the
material behaviour remains linear. The protective
device therefore does not significantly influence
gauge-based strain measurements.
4.4 Strain measurements by use of an LVDTsensor
This section is intended to identify error sources on
the specimen axial strain measurement by introdu-
cing the LVDT sensor; the aim is to reveal the dual
effect of loading head strain and of confining
pressure on the LVDT sensor response.
4.4.1 Effect of loading head strain
The LVDT sensor enables the relative displacement
of the upper loading head with respect to the bottom
loading head to be measured. In order to evaluate
the influence of loading head strain on the LVDT
sensor response, a simple compression test was per-
formed on a tungsten carbide specimen. Figure 22(a)
Fig. 20 Polycarbonate specimen
Fig. 21 Loading phases of hydrostatic tests performed on a polycarbonate specimen: influenceof the shield and membranes on gauge-based strain measurements; (o, solid line) 5
complete protective device (test 1); (+, dot-dash line) 5 protective device withoutmembranes (test 2); (triangle, dashed line) 5 protective device without the shield (test 3)
Strain measurements on porous concrete samples 647
JSA547 J. Strain Analysis Vol. 44
presents the results of this test in terms of axial
force Fx versus specimen shortening. This figure
shows that the shortening measured by the LVDT
sensor (uLVDT) is greater than that measured by the
gauge ux. This result may be explained by the fact
that the shortening measured by the LVDT sensor
(uLVDT) has been derived from the sum of specimen
shortening and the shortening of those loading
head parts to which the LVDT sensor supports are
fixed (ucap)
uLVDT~uxzucap ð11Þ
where uLVDT is the shortening of the LVDT sensor, ux
the specimen shortening, and ucap the shortening of
loading head parts to which the LVDT sensor
supports are fixed.
Figure 22(b) indicates that a linear relationship
exists between ucap and the axial force, i.e.
ucap~Fx=kd ð12Þ
where kd represents the stiffness of the loading head
parts to which the LVDT sensor supports are fixed
with respect to the axial force (kd 5 0.276105 kN/
mm).
4.4.2 Effect of confining pressure on the LVDT sensor
As for the gauges, the influence of confining pressure
on measurements performed with the LVDT sensor
was evaluated by introducing a hydrostatic test on a
tungsten carbide specimen (Fig. 23). A comparison
drawn between the gauge and LVDT sensor signals
indicates that the influence of confining pressure on
the LVDT sensor is indeed significant. The LVDT
sensor measures an extension as the specimen con-
tracts; this paradox is owing to the stiffness of the
assembly containing the full LVDT sensor support
(i.e. the LVDT sensor steel rod, two aluminium
support parts and two tungsten carbide loading
heads, see Fig. 6) with respect to confining pressure,
which is lower than that of the tungsten carbide
Fig. 22 Effect of loading head strain on LVDT sensor response: simple compression test on atungsten carbide specimen: (a) axial force Fx versus specimen shortening ux, as deducedfrom the axial gauge measurement (circle) and shortening measured by the LVDT sensoruLVDT (triangle); (b) axial force Fx versus shortening of loading head parts to which LVDTsensor supports are fixed ucap (5 uLVDT 2 ux)
Fig. 23 Hydrostatic test on a tungsten carbide specimen: (a) confining pressure p versus LVDTsensor measurement uLVDT (o) and specimen shortening ux (x); up: elongation measuredby the LVDT sensor as a result of the confining pressure effect; (b) confining pressure pversus elongation measured by the LVDT sensor as a result of the confining pressureeffect
648 X H Vu, Y Malecot, and L Daudeville
J. Strain Analysis Vol. 44 JSA547
specimen. This paradox causes both the stem and
LVDT sensor body to become relatively remote and
thus yield an extension measurement. Such an effect
is less distinct with concrete, a material much less
rigid than tungsten carbide. It is still necessary
however to take into consideration this phenom-
enon, which accounts for an error of approx. 1.1 per
cent at a confining pressure equal to 650 MPa.
Figure 23(b) shows that the deviation between
specimen shortening ux and LVDT sensor measure-
ment uLVDT varies linearly with confining pressure,
i.e.
up~ux{uLVDT~p�
kp ð13Þ
where kp is the coefficient correlated with stiffness of
the assembly of LVDT sensor support parts with
respect to confining pressure (kp 5 0.426103 MPa/
mm; ux is the specimen shortening as determined
from the elastic characteristics of tungsten carbide
(identified by means of a simple compression test –
ux 5 Lespecimen, see section 4.3.1); and L is the
specimen length.
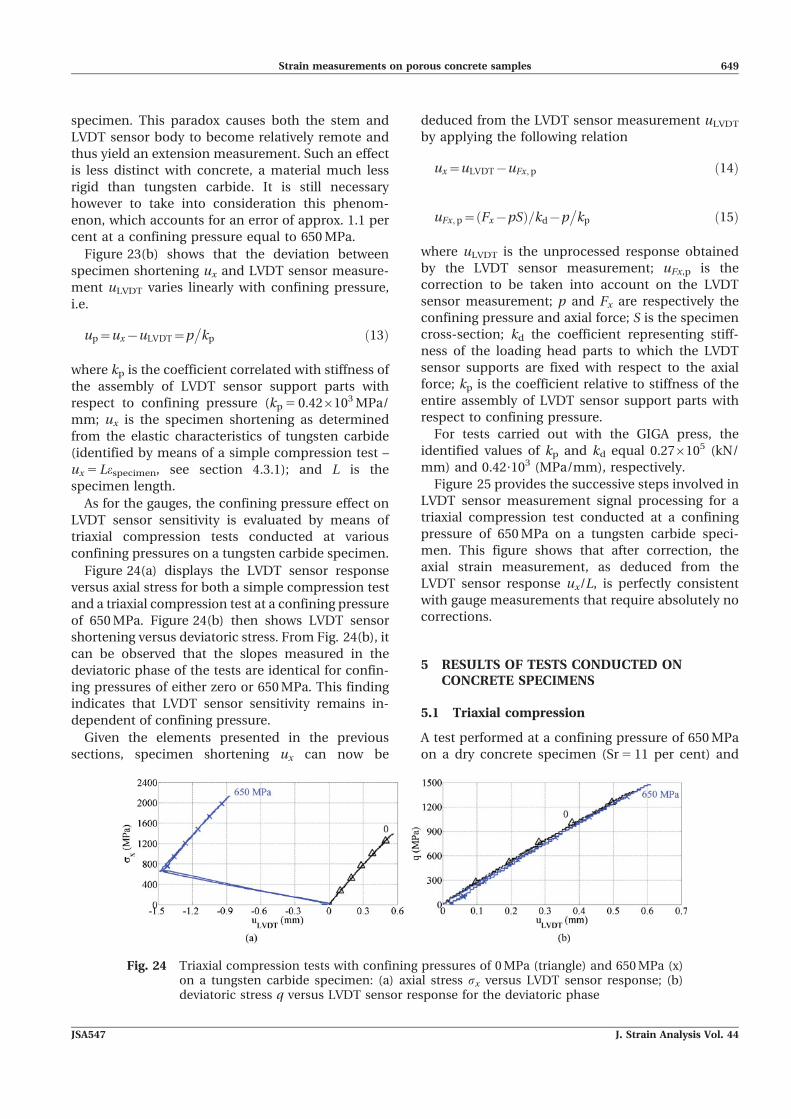
As for the gauges, the confining pressure effect on
LVDT sensor sensitivity is evaluated by means of
triaxial compression tests conducted at various
confining pressures on a tungsten carbide specimen.
Figure 24(a) displays the LVDT sensor response
versus axial stress for both a simple compression test
and a triaxial compression test at a confining pressure
of 650 MPa. Figure 24(b) then shows LVDT sensor
shortening versus deviatoric stress. From Fig. 24(b), it
can be observed that the slopes measured in the
deviatoric phase of the tests are identical for confin-
ing pressures of either zero or 650 MPa. This finding
indicates that LVDT sensor sensitivity remains in-
dependent of confining pressure.
Given the elements presented in the previous
sections, specimen shortening ux can now be
deduced from the LVDT sensor measurement uLVDT
by applying the following relation
ux~uLVDT{uFx, p ð14Þ
uFx, p~ Fx{pSð Þ=kd{p�
kp ð15Þ
where uLVDT is the unprocessed response obtained
by the LVDT sensor measurement; uFx,p is the
correction to be taken into account on the LVDT
sensor measurement; p and Fx are respectively the
confining pressure and axial force; S is the specimen
cross-section; kd the coefficient representing stiff-
ness of the loading head parts to which the LVDT
sensor supports are fixed with respect to the axial
force; kp is the coefficient relative to stiffness of the
entire assembly of LVDT sensor support parts with
respect to confining pressure.
For tests carried out with the GIGA press, the
identified values of kp and kd equal 0.276105 (kN/
mm) and 0.42?103 (MPa/mm), respectively.
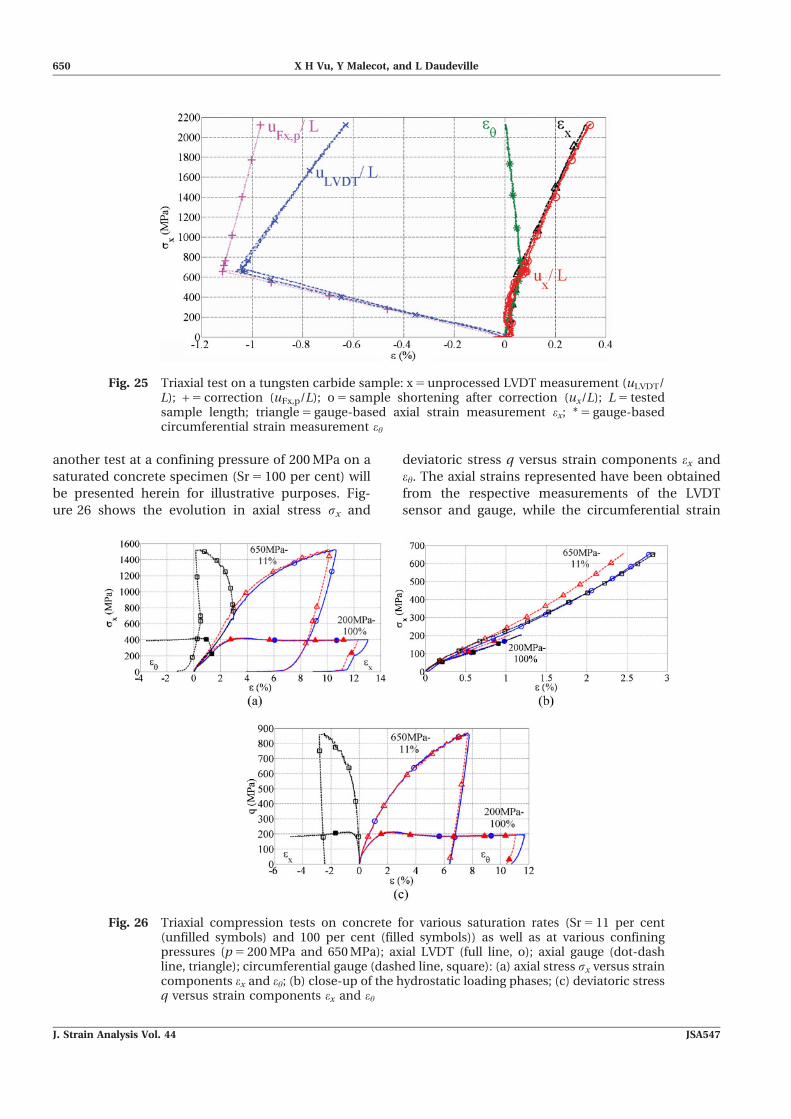
Figure 25 provides the successive steps involved in
LVDT sensor measurement signal processing for a
triaxial compression test conducted at a confining
pressure of 650 MPa on a tungsten carbide speci-
men. This figure shows that after correction, the
axial strain measurement, as deduced from the
LVDT sensor response ux/L, is perfectly consistent
with gauge measurements that require absolutely no
corrections.
5 RESULTS OF TESTS CONDUCTED ONCONCRETE SPECIMENS
5.1 Triaxial compression
A test performed at a confining pressure of 650 MPa
on a dry concrete specimen (Sr 5 11 per cent) and
Fig. 24 Triaxial compression tests with confining pressures of 0 MPa (triangle) and 650 MPa (x)on a tungsten carbide specimen: (a) axial stress sx versus LVDT sensor response; (b)deviatoric stress q versus LVDT sensor response for the deviatoric phase
Strain measurements on porous concrete samples 649
JSA547 J. Strain Analysis Vol. 44
another test at a confining pressure of 200 MPa on a
saturated concrete specimen (Sr 5 100 per cent) will
be presented herein for illustrative purposes. Fig-
ure 26 shows the evolution in axial stress sx and
deviatoric stress q versus strain components ex and
eh. The axial strains represented have been obtained
from the respective measurements of the LVDT
sensor and gauge, while the circumferential strain
Fig. 25 Triaxial test on a tungsten carbide sample: x 5 unprocessed LVDT measurement (uLVDT/L); + 5 correction (uFx,p/L); o 5 sample shortening after correction (ux/L); L 5 testedsample length; triangle 5 gauge-based axial strain measurement ex; * 5 gauge-basedcircumferential strain measurement eh
Fig. 26 Triaxial compression tests on concrete for various saturation rates (Sr 5 11 per cent(unfilled symbols) and 100 per cent (filled symbols)) as well as at various confiningpressures (p 5 200 MPa and 650 MPa); axial LVDT (full line, o); axial gauge (dot-dashline, triangle); circumferential gauge (dashed line, square): (a) axial stress sx versus straincomponents ex and eh; (b) close-up of the hydrostatic loading phases; (c) deviatoric stressq versus strain components ex and eh
650 X H Vu, Y Malecot, and L Daudeville
J. Strain Analysis Vol. 44 JSA547
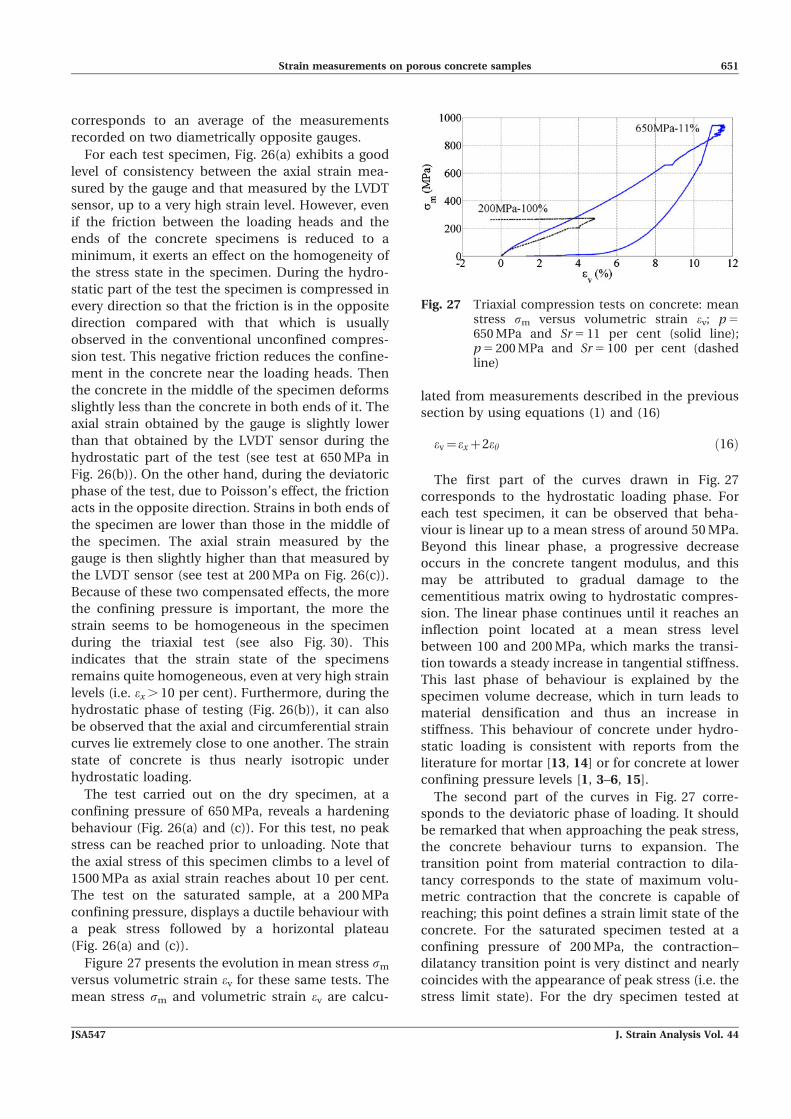
corresponds to an average of the measurements
recorded on two diametrically opposite gauges.
For each test specimen, Fig. 26(a) exhibits a good
level of consistency between the axial strain mea-
sured by the gauge and that measured by the LVDT
sensor, up to a very high strain level. However, even
if the friction between the loading heads and the
ends of the concrete specimens is reduced to a
minimum, it exerts an effect on the homogeneity of
the stress state in the specimen. During the hydro-
static part of the test the specimen is compressed in
every direction so that the friction is in the opposite
direction compared with that which is usually
observed in the conventional unconfined compres-
sion test. This negative friction reduces the confine-
ment in the concrete near the loading heads. Then
the concrete in the middle of the specimen deforms
slightly less than the concrete in both ends of it. The
axial strain obtained by the gauge is slightly lower
than that obtained by the LVDT sensor during the
hydrostatic part of the test (see test at 650 MPa in
Fig. 26(b)). On the other hand, during the deviatoric
phase of the test, due to Poisson’s effect, the friction
acts in the opposite direction. Strains in both ends of
the specimen are lower than those in the middle of
the specimen. The axial strain measured by the
gauge is then slightly higher than that measured by
the LVDT sensor (see test at 200 MPa on Fig. 26(c)).
Because of these two compensated effects, the more
the confining pressure is important, the more the
strain seems to be homogeneous in the specimen
during the triaxial test (see also Fig. 30). This
indicates that the strain state of the specimens
remains quite homogeneous, even at very high strain
levels (i.e. ex . 10 per cent). Furthermore, during the
hydrostatic phase of testing (Fig. 26(b)), it can also
be observed that the axial and circumferential strain
curves lie extremely close to one another. The strain
state of concrete is thus nearly isotropic under
hydrostatic loading.
The test carried out on the dry specimen, at a
confining pressure of 650 MPa, reveals a hardening
behaviour (Fig. 26(a) and (c)). For this test, no peak
stress can be reached prior to unloading. Note that
the axial stress of this specimen climbs to a level of
1500 MPa as axial strain reaches about 10 per cent.
The test on the saturated sample, at a 200 MPa
confining pressure, displays a ductile behaviour with
a peak stress followed by a horizontal plateau
(Fig. 26(a) and (c)).
Figure 27 presents the evolution in mean stress sm
versus volumetric strain ev for these same tests. The
mean stress sm and volumetric strain ev are calcu-
lated from measurements described in the previous
section by using equations (1) and (16)
ev~exz2eh ð16Þ
The first part of the curves drawn in Fig. 27
corresponds to the hydrostatic loading phase. For
each test specimen, it can be observed that beha-
viour is linear up to a mean stress of around 50 MPa.
Beyond this linear phase, a progressive decrease
occurs in the concrete tangent modulus, and this
may be attributed to gradual damage to the
cementitious matrix owing to hydrostatic compres-
sion. The linear phase continues until it reaches an
inflection point located at a mean stress level
between 100 and 200 MPa, which marks the transi-
tion towards a steady increase in tangential stiffness.
This last phase of behaviour is explained by the
specimen volume decrease, which in turn leads to
material densification and thus an increase in
stiffness. This behaviour of concrete under hydro-
static loading is consistent with reports from the
literature for mortar [13, 14] or for concrete at lower
confining pressure levels [1, 3–6, 15].
The second part of the curves in Fig. 27 corre-
sponds to the deviatoric phase of loading. It should
be remarked that when approaching the peak stress,
the concrete behaviour turns to expansion. The
transition point from material contraction to dila-
tancy corresponds to the state of maximum volu-
metric contraction that the concrete is capable of
reaching; this point defines a strain limit state of the
concrete. For the saturated specimen tested at a
confining pressure of 200 MPa, the contraction–
dilatancy transition point is very distinct and nearly
coincides with the appearance of peak stress (i.e. the
stress limit state). For the dry specimen tested at
Fig. 27 Triaxial compression tests on concrete: meanstress sm versus volumetric strain ev; p 5
650 MPa and Sr 5 11 per cent (solid line);p 5 200 MPa and Sr 5 100 per cent (dashedline)
Strain measurements on porous concrete samples 651
JSA547 J. Strain Analysis Vol. 44
650 MPa however, the contraction–dilatancy transi-
tion point is much less marked. The appearance of
expansion lies well below the maximum axial stress
level, which moreover has not been reached during
this test. The final part of the curves corresponds to
the unloading phase (only that of the 650 MPa test is
shown). A very high level of nonlinearity can be
observed at the completion of unloading; at this
point, the residual volumetric strain of the concrete
returns to less than 2 per cent. This substantial
decrease in tangential modulus is probably attribu-
table to damage of the cementitious matrix when the
granular skeleton, which essentially remains elastic,
returns to its original form.
5.2 Triaxial extension
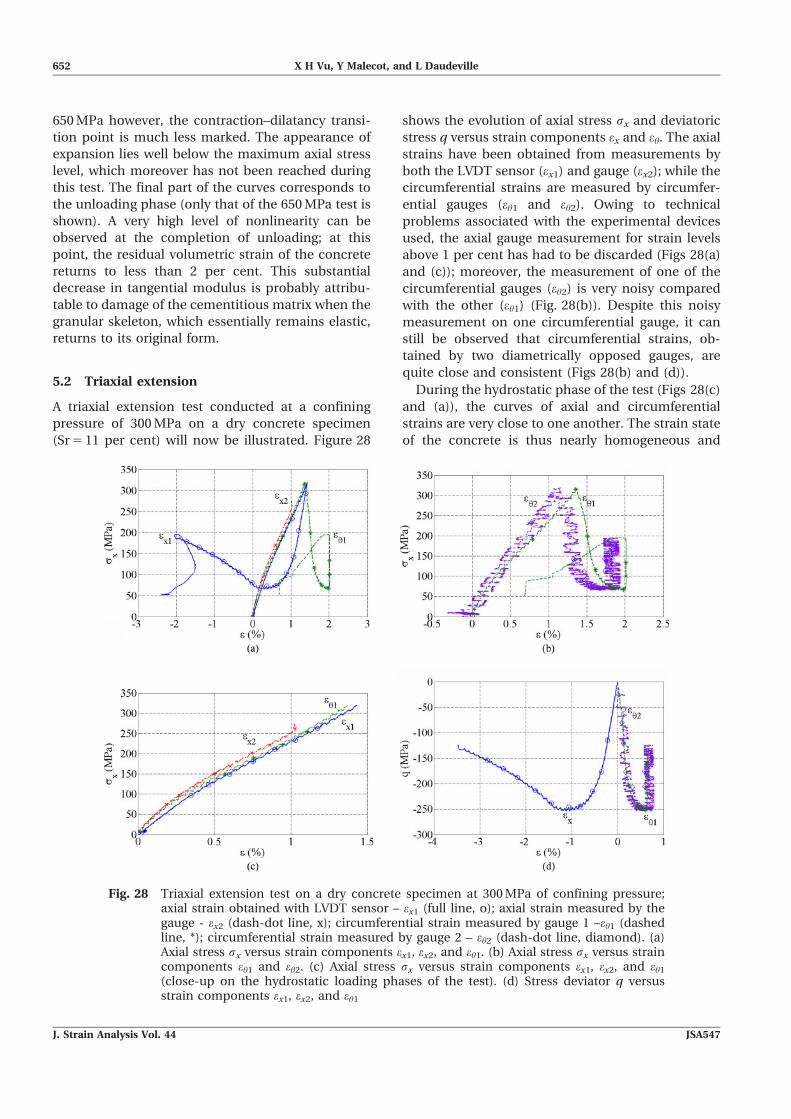
A triaxial extension test conducted at a confining
pressure of 300 MPa on a dry concrete specimen
(Sr 5 11 per cent) will now be illustrated. Figure 28
shows the evolution of axial stress sx and deviatoric
stress q versus strain components ex and eh. The axial
strains have been obtained from measurements by
both the LVDT sensor (ex1) and gauge (ex2); while the
circumferential strains are measured by circumfer-
ential gauges (eh1 and eh2). Owing to technical
problems associated with the experimental devices
used, the axial gauge measurement for strain levels
above 1 per cent has had to be discarded (Figs 28(a)
and (c)); moreover, the measurement of one of the
circumferential gauges (eh2) is very noisy compared
with the other (eh1) (Fig. 28(b)). Despite this noisy
measurement on one circumferential gauge, it can
still be observed that circumferential strains, ob-
tained by two diametrically opposed gauges, are
quite close and consistent (Figs 28(b) and (d)).
During the hydrostatic phase of the test (Figs 28(c)
and (a)), the curves of axial and circumferential
strains are very close to one another. The strain state
of the concrete is thus nearly homogeneous and
Fig. 28 Triaxial extension test on a dry concrete specimen at 300 MPa of confining pressure;axial strain obtained with LVDT sensor – ex1 (full line, o); axial strain measured by thegauge - ex2 (dash-dot line, x); circumferential strain measured by gauge 1 –eh1 (dashedline, *); circumferential strain measured by gauge 2 – eh2 (dash-dot line, diamond). (a)Axial stress sx versus strain components ex1, ex2, and eh1. (b) Axial stress sx versus straincomponents eh1 and eh2. (c) Axial stress sx versus strain components ex1, ex2, and eh1
(close-up on the hydrostatic loading phases of the test). (d) Stress deviator q versusstrain components ex1, ex2, and eh1
652 X H Vu, Y Malecot, and L Daudeville
J. Strain Analysis Vol. 44 JSA547
isotropic under hydrostatic loading. The axial and
circumferential strains measured during this test are
also consistent with those observed in the triaxial
compression test at 650 MPa on the dry concrete
specimen (see section 5.1).
The extension phase of the test (Figs 28(d) and (a))
indicates an axial extension and a circumferential
contraction of the specimen, which is the opposite of
what has been observed for a classical triaxial
compression test. During this phase, the material
tangential stiffness gradually decreases with an
increase in the material axial strain. A minimum
stress threshold for the material can be observed
within the expansion phase of the test at an axial
stress of around 65 MPa (Fig 28(a)) or 2253 MPa of
deviator (Fig. 28(d)). This threshold corresponds to
the minimum stress state that the material is able to
undergo in triaxial extension and serves to define the
stress limit state of the material.
The test unloading phase (Fig. 28(a)) begins with
the gradual reduction in confining pressure on the
specimen lateral surfaces, until reaching zero pres-
sure by keeping the same imposed axial displacement
of the specimen. Once the confining pressure on the
lateral surfaces has reached zero, the imposed axial
displacement of the concrete specimen gradually
decreases until the end of the test. This unloading
phase initially produces an axial contraction and
circumferential extension (the phase of decreasing
confining pressure on the lateral surfaces) and then
an axial extension and near-zero variation of speci-
men circumferential strain (the phase of gradually
decreasing imposed axial displacement). It may be
noted at this point that beyond the minimum stress
threshold, the axial strain evolution (ex1) is consistent
with the axial stress evolution. The circumferential
strain variation however is not entirely consistent
with axial stress evolution. The evolution in circum-
ferential strain is next to zero over the two following
portions of the stress–strain curve (Fig. 28(a)): be-
tween the minimum stress threshold and the end of
test loading (first part), and between the beginning of
the decrease in imposed axial displacement on the
specimen and the end of the test (second part). As a
matter of fact, the circumferential strain measure-
ment, as obtained from the gauges, is a local
measurement, while the axial strain measurement
obtained with the LVDT sensor is global. The
inconsistent evolution between axial stress and
circumferential strains may be correlated with a
material localization when the material is being
loaded in an imposed displacement beyond its stress
limit state.
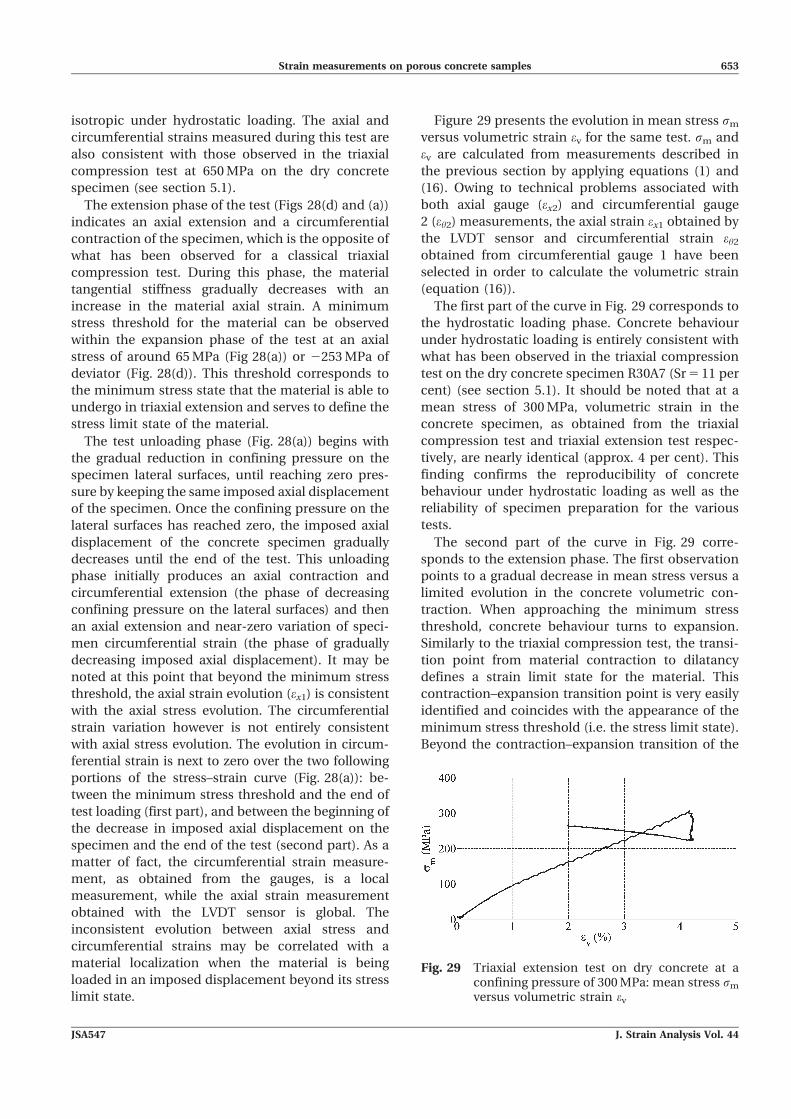
Figure 29 presents the evolution in mean stress sm
versus volumetric strain ev for the same test. sm and
ev are calculated from measurements described in
the previous section by applying equations (1) and
(16). Owing to technical problems associated with
both axial gauge (ex2) and circumferential gauge
2 (eh2) measurements, the axial strain ex1 obtained by
the LVDT sensor and circumferential strain eh2
obtained from circumferential gauge 1 have been
selected in order to calculate the volumetric strain
(equation (16)).
The first part of the curve in Fig. 29 corresponds to
the hydrostatic loading phase. Concrete behaviour
under hydrostatic loading is entirely consistent with
what has been observed in the triaxial compression
test on the dry concrete specimen R30A7 (Sr 5 11 per
cent) (see section 5.1). It should be noted that at a
mean stress of 300 MPa, volumetric strain in the
concrete specimen, as obtained from the triaxial
compression test and triaxial extension test respec-
tively, are nearly identical (approx. 4 per cent). This
finding confirms the reproducibility of concrete
behaviour under hydrostatic loading as well as the
reliability of specimen preparation for the various
tests.
The second part of the curve in Fig. 29 corre-
sponds to the extension phase. The first observation
points to a gradual decrease in mean stress versus a
limited evolution in the concrete volumetric con-
traction. When approaching the minimum stress
threshold, concrete behaviour turns to expansion.
Similarly to the triaxial compression test, the transi-
tion point from material contraction to dilatancy
defines a strain limit state for the material. This
contraction–expansion transition point is very easily
identified and coincides with the appearance of the
minimum stress threshold (i.e. the stress limit state).
Beyond the contraction–expansion transition of the
Fig. 29 Triaxial extension test on dry concrete at aconfining pressure of 300 MPa: mean stress sm
versus volumetric strain ev
Strain measurements on porous concrete samples 653
JSA547 J. Strain Analysis Vol. 44
material and until entering the test unloading phase
(around a mean stress of 265 MPa), a gradual
increase in mean stress, or rather a gradual increase
in the deviator versus a decrease in material
volumetric strain (i.e. material dilatancy), can be
observed. Also note that during this phase, an axial
elongation of the specimen occurs along with a
circumferential strain that nearly equals zero. This
phenomenon may be correlated as well with a
material localization when the material has been
loaded beyond its stress or strain limit state.
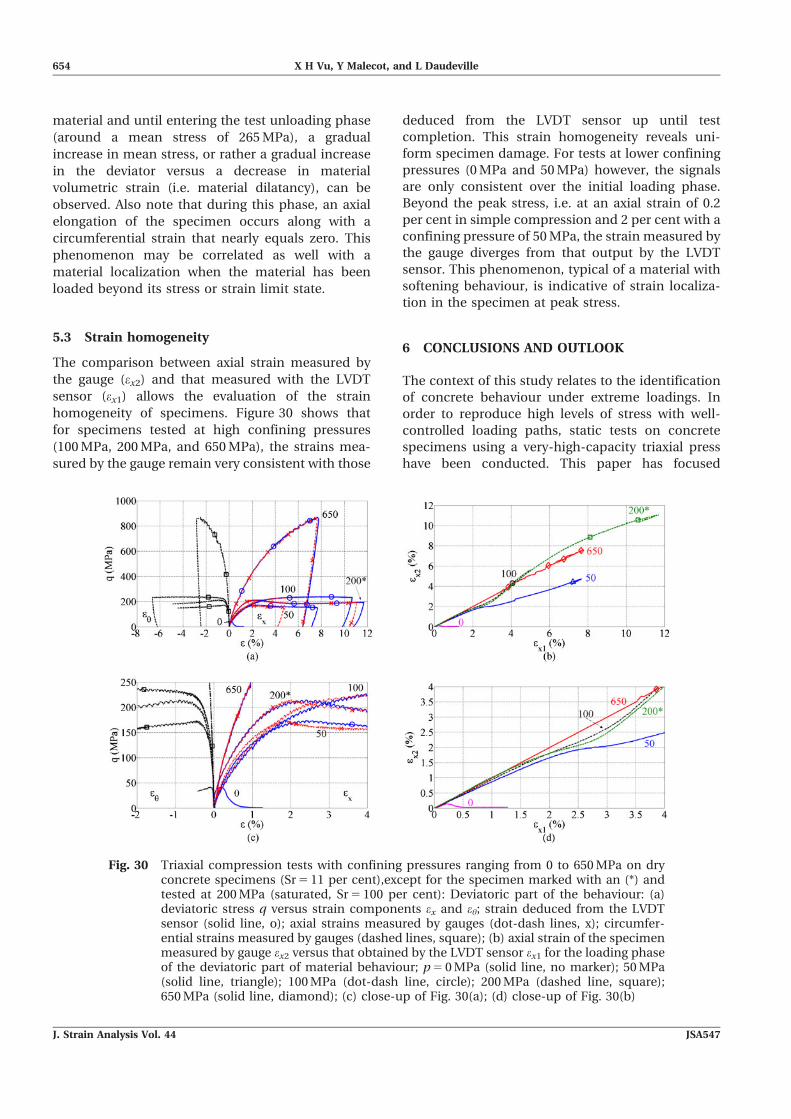
5.3 Strain homogeneity
The comparison between axial strain measured by
the gauge (ex2) and that measured with the LVDT
sensor (ex1) allows the evaluation of the strain
homogeneity of specimens. Figure 30 shows that
for specimens tested at high confining pressures
(100 MPa, 200 MPa, and 650 MPa), the strains mea-
sured by the gauge remain very consistent with those
deduced from the LVDT sensor up until test
completion. This strain homogeneity reveals uni-
form specimen damage. For tests at lower confining
pressures (0 MPa and 50 MPa) however, the signals
are only consistent over the initial loading phase.
Beyond the peak stress, i.e. at an axial strain of 0.2
per cent in simple compression and 2 per cent with a
confining pressure of 50 MPa, the strain measured by
the gauge diverges from that output by the LVDT
sensor. This phenomenon, typical of a material with
softening behaviour, is indicative of strain localiza-
tion in the specimen at peak stress.
6 CONCLUSIONS AND OUTLOOK
The context of this study relates to the identification
of concrete behaviour under extreme loadings. In
order to reproduce high levels of stress with well-
controlled loading paths, static tests on concrete
specimens using a very-high-capacity triaxial press
have been conducted. This paper has focused
Fig. 30 Triaxial compression tests with confining pressures ranging from 0 to 650 MPa on dryconcrete specimens (Sr 5 11 per cent),except for the specimen marked with an (*) andtested at 200 MPa (saturated, Sr 5 100 per cent): Deviatoric part of the behaviour: (a)deviatoric stress q versus strain components ex and eh; strain deduced from the LVDTsensor (solid line, o); axial strains measured by gauges (dot-dash lines, x); circumfer-ential strains measured by gauges (dashed lines, square); (b) axial strain of the specimenmeasured by gauge ex2 versus that obtained by the LVDT sensor ex1 for the loading phaseof the deviatoric part of material behaviour; p 5 0 MPa (solid line, no marker); 50 MPa(solid line, triangle); 100 MPa (dot-dash line, circle); 200 MPa (dashed line, square);650 MPa (solid line, diamond); (c) close-up of Fig. 30(a); (d) close-up of Fig. 30(b)
654 X H Vu, Y Malecot, and L Daudeville
J. Strain Analysis Vol. 44 JSA547
specifically on developing and validating strain
measurements by means of gauges and the LVDT
displacement sensor on concrete specimens through
performing tests with very high confining pressures.
A concrete specimen production and preparation
protocol has also been developed. Strain measure-
ments by use of gauges bonded to the concrete could
be undertaken by means of special preparation of
the specimen lateral surface in addition to introdu-
cing a protective device. Sealing problems, owing to
the presence of macroscopic concrete pores respon-
sible for membrane perforation and confining fluid
infiltration into the specimen, have been resolved
thanks to development of a protective multi-layer
membrane. Hydrostatic tests, conducted on a poly-
carbonate specimen, have shown that this protective
device does not exert a significant impact on strain
measurements using gauges. This paper has also
effectively demonstrated the possibility of perform-
ing strain measurements with gauges by controlling
the degree of concrete saturation (from dry to
saturated concrete). The effect of confining pressure
on strain measurement has been highlighted
through triaxial compression tests on a tungsten
carbide specimen. While the pressure effect on strain
measurement using gauges may be neglected,
pressure does however strongly modify the LVDT
sensor measurement, which requires correction.
The initial triaxial compression and extension tests
conducted on concrete enable the validation of the
experimental device developed herein. The axial and
circumferential strain measurements of the concrete
specimen under high confinement also allow the
characterization of the specimen behaviour. The
volumetric behaviour curve yields an evaluation of
concrete compaction as well as its strain state limit.
A comparison drawn between the axial strain
obtained by gauge measurements and that deduced
from the LVDT sensor measurement also offers an
evaluation of strain homogeneity along with the
possible detection of the localization phenomenon.
This study has demonstrated the possibility of
performing, in a most reliable manner, triaxial
compression and extension tests at high confine-
ment pressures on porous concrete specimens with
a controlled degree of saturation. Thanks to the
innovative experimental device developed during
this study, the initial experimental campaigns focus-
ing on the influence of loading path [16], the water/
cement ratio [17, 18], degree of saturation [19] have
been undertaken and have yielded unprecedented
results. This device has also allowed the study of
both concrete damage [20] and concrete behaviour
[21] under high stress. Future improvements to the
GIGA experimental device will consist of draining
excess water and measuring pore pressure, in an
effort to better quantify the effect of degree of
concrete saturation on its behaviour under high
confinement.
ACKNOWLEDGEMENTS
The GIGA press has been installed in the 3S-Rlaboratory within the framework of a cooperativeagreement signed with France’s Delegation Generalepour l’Armement (CEG, DGA, French Ministry ofDefence). This research has been performed thanksto financial support received from the ‘Centred’Etudes de Gramat’ (CEG, DGA). The authors wouldlike to thank Dr Eric Buzaud and Dr ChristophePontiroli (CEG) for giving technical and scientificadvice.
F Authors 2009
REFERENCES
1 Warren, T., Fossum, A., and Frew, D. Experimentalinvestigation of size effect in concrete fractureunder multiaxial compression into low-strength(23 MPa) concrete: target characterization andsimulations. Int. J. Impact Engng, 2004, 30, 477–503.
2 Hopkinson, B. A method of measuring the pres-sure in the deformation of high explosives or by theimpact of bullets. Phil. Trans R. Soc., 1914, A213,437–452.
3 Akers, S. A. and Phillips, B. R. Concrete modelledas an inhomogeneous material: numerical simula-tions of contact detonation charges. In 18thInternational Symposium on The military aspectsof blast and shock, Oberjettenberg, Germany, 2004.
4 Schmidt, J. M. High pressure and high strain ratebehavior of cementitious materials: experimentsand elastic/viscoplastic modeling, doctoral disserta-tion, University of Florida, USA, 2003.
5 Schmidt, J. M., Cazacu, O., and Green, M. L.Experimental and theoretical investigation of thehigh-pressure behavior of concrete. Int. J. Numer.Analytical Meth. Geomech., 2008, 33(1), 1–23.
6 William, E. M., Akers, S. E., and Reed, P. A.Constitutive models for the triaxial behavior ofconcrete. Geotechnical and Structures Laboratory,2005, U.S. Army. Report no. ERDC/GSL TR-05-16.
7 Baroghel-Bouny, V., Mainguy, M., Lassabatere, T.,and Coussy, O. Characterization and identificationof equilibrium and transfer moisture properties forordinary and high-performance cementitious ma-
Strain measurements on porous concrete samples 655
JSA547 J. Strain Analysis Vol. 44
terials. Cement and Concrete Res., 1999, 29, 225–1238.
8 Yip, W. K. and Tam, C. T. Concrete strengthevaluation through the use of small diameter cores.Mag. Concrete Res., 1995, 40(143), 99–105.
9 Sikatop-SF-126, Technical notice of the mortarSikatop-SF-126, document no. 6.53, version no. 146,2007, Sika France S.A., 2007, available from www.sika.fr. In French.
10 Castellote, M., Alonso, C., Andradea, C., Turrillas,X., and Campoc, J. Composition and microstruc-tural changes of cement pastes upon heating, asstudied by neutron diffraction. Cement and Con-crete Res., 2004, 34, 1633–1644.
11 Strain Gage applications with M-bond AE-10, AE-15 and GA-2 Adhesive Systems, Instruction BulletinB-137, document no. 11137, Vishay Micro-Meas-urements, Revision 05 April 2005.
12 VeraliteH200, Technical sheet of VeraliteH200(PETG - Polyethylene Terephtalate Glycol), Productof I.P.B., Waregem, Belgium, available from http://www.ipb.be.
13 Bazant, Z. P., Bishop, F. C., and Chang, T. P.Confined compression tests of cement paste andconcrete up to 300 Ksi. ACI Journal, 1986, 33,553–560.
14 Burlion, N., Pijaudier-Cabot, G., and Dahan, N.Experimental analysis of compaction of concreteand motar. Int. J. Numer. Analytical Methods inGeomech., 2001, 25, 1467–1486.
15 Sfer, D., Carol, I., Gettu, R., and Etse, G. Study ofthe behavior of concrete under triaxial compres-sion. J. Engng Mech., 2002, 128(2), 156–163.
16 Gabet, T., Malecot, Y., and Daudeville, L. Triaxialbehavior of concrete under high stresses: Influenceof the loading path on compaction and limit states.Cement and Concrete Res., 2008, 38(3), 403–412.
17 Vu, X. H., Malecot, Y., Daudeville, L., and Buzaud,E. Effect of the water/cement ratio on concretebehavior under extreme loading. Int. J. Numer.Analytical Methods in Geomech., 2009, in press.DOI: 10.1002/nag.796.
18 Vu, X. H., Malecot, Y., Daudeville, L., and Buzaud,E. Comportement du beton sous fort confinement:effet du rapport eau/ciment. Eur. J. Environ. CivilEngng, 2008, 12(4), 429–457. DOI: 10.3166/ejece.12.429-457. In French.
19 Vu, X. H., Malecot, Y., and Daudeville, L. Experi-mental analysis of concrete behavior under highconfinement: effect of the saturation ratio. Int. J.Solids Structs, 2009, 46, 1105–1120. DOI: 10.1016/j.ijsolstr.2008.10.015 (b).
20 Poinard, C., Malecot, Y., and Daudeville, L.Damage of concrete in a very high stress state:experimental investigation. Mater. Structs, 2009.DOI 10.1617/s11527-008-9467-6.
21 Dupray, F., Malecot, Y., Daudeville, L., andBuzaud, E. A mesoscopic model for the behaviourof concrete under high confinement. Int. J. Numer.Analytical Methods in Geomech., 2009. DOI:10.1002/nag.771.
APPENDIX
Notation
Variables
E, K, n Young’s modulus, compressibil-
ity modulus, Poisson’s ratio
f function characterizing the
sensitivity of the gauge
Fd axial force after subtracting the
confining pressure
Fmes unprocessed response of the
loading sensor
Fx axial force
kd coefficient representing stiffness
of the loading head parts to
which the LVDT sensor supports
are fixed with
respect to the axial force
kp coefficient representing stiffness
of the loading head parts to
which the LVDT sensor supports
are fixed with respect to
confining pressure
K1, K2 coefficients linked to the force
sensor, identified by the
calibration steps
L sample length
m sample mass
mhyd mass of the saturated sample
from hydrostatic weighing
msat mass of the saturated sample
p confining pressure
q 5 sx 2 p deviatoric stress (deviator)
S specimen cross-section
Sr concrete saturation ratio
Sr~1{ msat{m
g msat{mhydð Þucap shortening of loading head parts
to which the LVDT sensor
supports are fixed
uFx,p correction to be taken into
account on the LVDT sensor
measurement
uLVDT unprocessed response obtained
by the LVDT sensor
measurement
ux specimen shortening
Umes measured tension of the gauge
egauge strain owing to the effect of the
confining pressure on the
gauge itself
656 X H Vu, Y Malecot, and L Daudeville
J. Strain Analysis Vol. 44 JSA547
emes specimen strain measured by
gauge
especimen specimen strain
ev 5 ex + 2eh volumetric strain
ex mean axial strain
ex1, ex2, ex3 axial strains obtained respec-
tively with measurements of the
LVDT sensor, of the axial gauge 1
and of the axial gauge 2
eh mean circumferential strain
eh1, eh2 circumferential strains obtained
respectively with measurements
of the circumferential gauge 1
and of the circumferential gauge
2
g concrete porosity accessible to
water
sm~sxz2p
3 mean stress
sx axial stress
Designation of the concretes
Dried concrete – Sr 5 11 per cent
Saturated concrete – Sr 5 100 per cent
Sign conventions
e > 0 during contraction
s > 0 during compression
Abbreviations
LVDT linear variable differential trans-
former
650 MPa–11 per cent: triaxial test, conducted at
650 MPa of confining pressure on a concrete sample
displaying a saturation ratio of 11 per cent
(p 5 650 MPa, Sr 5 11 per cent)
200 MPa–100 per cent: triaxial test, conducted at
200 MPa, of confining pressure on a saturated
concrete sample (p 5 200 MPa, Sr 5 100 per cent)
Strain measurements on porous concrete samples 657
JSA547 J. Strain Analysis Vol. 44