pore size distributions in clays - clay minerals society
TRANSCRIPT
Clays and Clay Minerals, 1970, Vol. 18, pp. 7-23. Pergamon Press. Printed in Great Britain
PORE SIZE DISTRIBUTIONS IN CLAYS
SIDNEY DIAMOND
Purdue University, Lafayette, Indiana 47907
(Received 11 August 1969)
Abstrae t -A knowledge of the distribution of pore sizes in clay and soil bodies is a useful element in the microstructural characterization of such materials. Pore-size distributions and total porosity of a number of reference clays, naturally-occurring subsoils, and commercial clay samples prepared in various ways were determined by mercury porosimetry. The range of equivalent pore diameter explored covered almost five orders of magnitude, from several hundred microns down to approxi- mately 150A. The method and its assumptions are critically evaluated, and measurements of the contact angle of mercury on clays yield values of 139 ~ for montmorillonite and 147 ~ for kaolinite and illite clays. The extent of shrinkage on oven-drying prior to mercury intrusion is assessed in each case and found to vary from insignificant to as much as 30 per cent of the pore space, depending on microstructural state and degree of initial saturation. The development of techniques for water removal which do not involve change in pore structure is explored. Some preliminary results for structurally weak saturated clays suggest that critical-region drying and perhaps freeze-drying procedures may be practical.
INTRODUCTION
A COMPLETE physical description of the state of a clay soil or an experimental clay mass is often of considerable interest. Usually the information available is confined to measurements of gross parameters, such as moisture content, bulk density, total porosity, etc. Less frequently additional descriptors such as particle-size distribution, surface area, and information on mutual orientation of particles is supplied.
In many instances knowledge of at least one additional parameter, the mathematical distri- bution of pore sizes in the mass, may assist in interpreting the behavior of the material. Changes in the pore-size distribution arising from mechanical loading, remolding, chemical treatment, plant root growth, freezing and thawing, or other influences often need to be taken into account in interpreting experimental results. It is the purpose of this paper to call attention to the fact that direct measure- ments of this property may readily be performed, to illustrate the results obtained for various clay and soil materials, and to discuss the limitations of the technique employed.
There are two major approaches currently available for the determination of pore size distri- butions in porous solids, viz.: forced intrusion of a non-wetting fluid (usually mercury) under pressure, and the "capillary condensation method," which involves interpretation of adsorption or desorption isotherms to calculate that portion of the sorption that is due to capillary condensation. The latter method is much more difficult experi-
mentally and suffers from the limitation that the maximum pore diameter that can be tallied is of the order of 1000 fit, much smaller than many of the pores present in clays. In consequence, no further discussion is made of the capillary con- densation approach and the remainder of this paper is concerned with mercury intrusion measurements.
THE METHOD OF MERCURY INTRUSION
The basis of the mercury intrusion method, as conceived originally by Washburn (1921) and subsequently applied by Ritter and Drake (1945), Winslow and Shapiro (1959) and others, rests on the simple physical principle that a non- wetting fluid, i.e. one whose contact angle is greater than 90 ~ for a particular solid, will not spon- taneously intrude the pores of that solid but will do so if sufficient pressure is applied. The pressure required depends on the contact angle, the pore shape, and the surface tension of the liquid. For pores of cylinderical shape the relationship between pressure and the minimum pore diameter which may be intruded was given by Washburn as:
P = --4 y cos O/d ( 1 )
where P is the required pressure y is the surface tension of the liquid 0 is the contact angle d is the diameter of the pore.
Since most porous media contain pores of irregular and widely-varying shape, pores that are
8 SIDNEY DIAMOND
intruded under a given pressure are referred to as having an "equivalent" cylindrical diameter as calculated from Equation (1).
Experimentally, the method consists of the following steps: one applies an increment of pressure to a suitable experimental apparatus in which mercury (or other non-wetting liquid) is permitted to intrude the pores of a sample; one measures the volume intruded when the liquid ceases to flow; and then one repeats the process under successively higher pressures to the limit of the apparatus. The volume of mercury intruded in a given step is taken as the total volume of pores with equivalent diameters smaller than that corres- ponding to the preceding pressure and larger than that corresponding to the pressure causing the flow. By adding the results of all of the steps a cumulative volume distribution with respect to pore diameters is built up.
Several inherent characteristics of the method should be noted:
(a) The pores must be empty of water or any other fluid at the start of the experiment.
(b) Completely isolated pores inaccessible to the exterior of the sample cannot be measured.
(c) Pores accessible only through entryways of smaller diameter will not be intruded until sufficient pressure is applied to intrude the entryways or "necks"; hence, all of the volume of such pores will be allocated to the diameter class of the most restricted part of the entryway.
(d) Even if all of the pore space is accessible to the outside, the entire volume of pores of a given sample may not be measured, depend- ing on whether the instrument has sufficient pressuring capacity to intrude the finest pores present.
SPECIAL SAMPLE PREPARATION PROBLEMS WITH CLAYS
The size of sample that can be employed is limited by the capacity of the intrusion readout system employed. In the usual forms of mercury intrusion apparatus this capacity is of the order of several tenths of a cubic centimeter, restricting sample sizes to the order of l g.
For most porous substances, the critical require- ment that the pores be empty at the start normally is met by oven drying the sample, followed by evacuation to comparatively low pressures. While the effects of oven drying and evacuation are of little consequence for most materials, partly or completely saturated clay (or soil) bodies may
shrink appreciably on drying, decreasing the total porosity by an often significant amount. Details of the shrinkage process depend on the initial moisture content and degree of saturation, the micro- structure of the clay, and probably the details of the drying process itself (Yong and Warkentin, 1966, pp. 151-159). The particle rearrangements involved not only reduce the total porosity but inevitably change the distribution of pore sizes as well, to a degree that cannot be completely pre- dicted. The effect of the foregoing is that the pore- size distribution obtained from a clay mass after oven drying does not completely reflect the distri- bution previously existing in the partly or com- pletely saturated sample of interest. Methods of removing the water in such a way as to avoid bulk shrinkage and particle rearrangement are currently under study and certain results already obtained are presented later in this report.
The bulk of the work reported here has been done on oven-dried samples. In cases where a definite reference state exists, an effort has been made to assess the shrinkage involved in oven- drying, and the consequent changes in pore size distribution that may have taken place. It should be noted that the range of pore sizes covered extends over five orders of magnitude; in con- sequence small shifts in the experimental pore size distribution function associated with minor shrinkage effects will likely not affect the general import of the data.
EXPERIMENTAL DETAILS
The pressuring equipment used in this study was a modified Aminco-Winslow porosimeter (American Instrument Co., Silver Spring, Md.) with a pressuring capacity of 15,000psi and a mechanical sensing device capable of registering intrusion of mercury in increments of 0.0001 ml. The filling device supplied with this equipment was removed and a separate filling device of advanced design* was used for the initial mercury filling and for measurement of intrusion at pressures less than 1 atm. This device, in which the dilato- meter ("penetrometer") is filled while in a hori- zontal position, permits filling of the dilatometer under essentially zero head of mercury. Its use extends the practical upper limit of pore diameter that can be measured to approximately 800/~, a feature of some importance with some clays and many soils.
Standard dilatometers of approximately 6ml capacity and 1.3 mm bore diameter were used, as
*U.S. Pat. No. 3,438,245 awarded to Prado Labora- tories, Cleveland, Ohio, April 15, 1969.

PORE SIZE DISTRIBUTIONS IN CLAYS 9
illustrated in Fig. 1. The sequence of operations was as follows:
(1) The sample, of appropriate size and state of dryness, was weighed analytically and placed in the dilatometer, which was then assembled, weighed, and inserted into the filling device. The entire system was then evacuated to a residual pressure of approximately 10/z Hg, as measured with a McLeod gauge.
(2) Mercury was admitted to the filling device to a level just commensurate with the top of the borehole in the stem of the dilatometer. The pressure was increased to approximately 1 0 m m H g by means of a bleeder valve connecting the evacuated system to the atmosphere, and the space surrounding the sample in the dilatometer allowed to fill with mercury. Pressures in this range were measured with a mercury manometer.
(3) The residual mercury in the filling device was drained, and the position on the stem of the dilatometer at which the mercury column broke off was recorded.
(4) The atmosphere bleeder valve was again opened and the pressure increased by an appropriate increment, forcing mercury into the largest accessible pores in the sample. After the cessation of flow, the new position of the mercury meniscus along the calibrated stem of the dilatometer was recorded, the difference in position indicating the amount of mercury intruded into the sample. The precision of reading the position of the meniscus visually was probably not much better than 0-0005 ml.
(5) This process was repeated a number of times until atmospheric pressure was reached. Subsequently, the dilatometer was removed from the filling device, weighed again to determine the amount of mercury held, and transferred to the hydraulic pressuring chamber of the porosimeter. In this chamber pressure is generated by an electrically-driven hydraulic pump, and transmitted to the chamber using ethanol as the working fluid. Pressuring was continued in incre- ments between 15 and 15,000 psi, pressure being read by Bourdon-tube gauges and the amount of intrusion recorded digitally by a mechanical readout device in units of 0-0001 ml. Twenty to thirty increments of pressure were recorded for the typical determination.
From the data secured it was possible to calcul- ate cumulative pore size distribution on a weight,
SAMPLE ~ /~MERCURY ~CALtBRATEO CAPILLARY
/ BORE
DILATOMETER AT FILLING
~ .,, PRESSURE
DILATOMETER AFTER PRESSURE
APPLIED AND MERCURY INTRUDED
Fig. 1. Schematic view of dilatometerafter filling, and after pressure has been applied and mercury hasintruded
into the sample.
volume, or percentage of total pore space basis; sample bulk volume; and, based on an assumed specific gravity for the clay, the total porosity in terms of pore volume in cm ~ per g of clay. It was also possible to employ the penetrometer to measure the bulk density of a corresponding undried sample and thus calculate the total porosity in the undried condition.
In the conduct of the mercury intrusion experi- ment and in the resulting calculation of the pore size distribution curve several cautions and corrections need to be observed:
(a) The time required for equilibration varies with the nature of the pore system and is not uniform from step to step within a given run. Care must be taken to insure completion of the intrusion process at a given pressure before the next pressure increment is applied.
(b) In the initial evacuation step a small but finite residual amount of air is trapped within the penetrometer. A Boyle 's Law correction for the decreasing volume of this t rapped air at each increment of increasing pressure is appropriate. This is numerically important only at pressures below one atmosphere.
(c) A further correction is required for the effective compressibility of the mercury in the penetrometer for pressures higher than approximately 100psi. The amount of the correction may be ascertained by noting the apparent intrusion under a pressure cycle of a penetrometer filled entirely with mercury, without a sample being present. The correc- tion required is significantly less than that which would be calculated from the bulk compressibility of mercury since the applied
10 SIDNEY DIAMOND
pressure also acts to reduce the internal volume of the glass penetrometer. For a 6.1 cm 3 dilatometer, calculations based on the compressibility of mercury would predict a correction of 0.0214cm 3 at 15,000psi; the experimental value recorded at this pressure is less than one-third of this, 0.0066 cm a.
SURFACE TENSION AND CONTACT ANGLE VALUES
The equation used in calculating the diameter class corresponding to the pressure applied (Equation (1)) requires a knowledge of both the surface tension of the liquid and its contact angle on the solid being intruded.
There are a number of determinations of the surface tension of mercury in the literature. The value of 484dynes/cm at 25~ (Kemball, 1946, Nicholas et al., 1961) was selected as the best value available and used throughout. Every effort was made to insure that the mercury used in each experiment was scrupulously clean, and mercury coming into contact with a sample was discarded and replaced after each run.
The question of an appropriate contact angle is a little more complicated. Many workers in mercury porosimetry apparently have selected a single value for the contact angle of mercury out of the comparatively few measurements available in the literature, and have applied this value to all substances tested. The usual values so employed are 130 ~ (Winslow and Shapiro, 1959) or 140 ~ (Ritter and Drake, 1945).
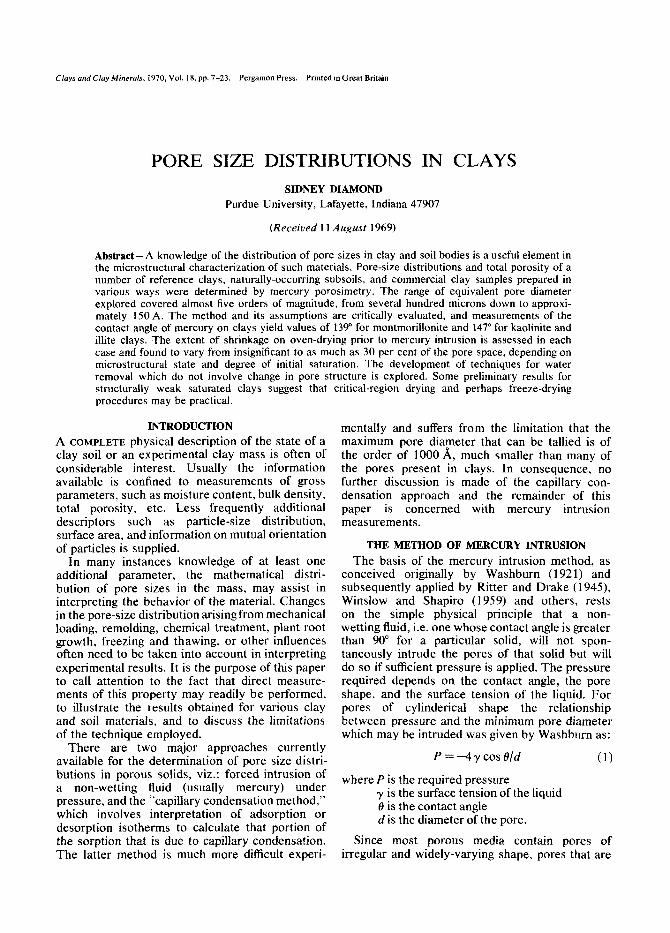
There is an apparent absence of measurements of the contact angle of mercury on clays in the literature. In view of this, measurements of this parameter were undertaken by the author using the sessile drop method whose use is described (for spreading coefficient measurements) by Padday (1953). The method consists of measuring the heights of sessile drops of the liquid on a horizontal surface of the solid to be studied as a function of drop weight or size. There is a maximum drop height that can be supported regardless of increas- ing drop size. This is related to the contact angle by Equation (2), given in essence by Adam (1941).
cos 0 ---- -gDh2+ 1 (2) 2T
where 0 is the contact angle g is the acceleration due to gravity
D is the density of the liquid h is the maximum height of the sessile drop y is the surface tension of the liquid.
Several preliminary measurements of contact angles undertaken to check the technique yielded values of 137 ~ for mercury on clean glass plates and 112 ~ for water on paraffin-coated glass plates, both values being in accord with previously- published determinations (Adamson, 1967; Padday, 1953). Determinations were then carried out on glass plates coated with uniform layers of clay which were deposited from dilute sus- pension, air-dried, and then oven-dried prior to examination. Results for kaolinite and illite samples were within a degree of an average value of 147 ~ while those for three different montmoril- lonites (a sodium-calcium bentonite, a highly organic montmorillonite soil clay, and an iron-rich montmorillonite soil clay) were all within a degree of an average value of 139 ~ A representative deter- mination, for mercury on a Georgia kaolinite, is given in Fig. 2. In the calculations reported in this paper the contact angle value employed was 139 ~ for montmorillonite clay and 147 ~ for all other clay mineral types.
PORE SIZE DISTRIBUTION CURVES
Data presentation and reproducibility In this paper the experimental pore size distribu-
tion data are presented in the form of cumulative pore diameter distribution curves, the pore volume parameter being expressed as cm 3 of pore space per gram of oven-dried clay. The data are cumulated from largest pore diameter measured (on the right-hand side of the figure) to the smallest diameter limit set by the pressuring capacity of the instrument. In presenting pore size distribution curves over limited size ranges, some authors prefer to present the derivative distribution func- tion (d (vol.)/d(diam.)) rather than the cumulative function, but the derivative function is severely distorted for data covering several orders of magnitude of pore sizes. Further, the cumulative or integral function used here has the distinct advantage that the fraction of pore space between any arbitrary bounds of pore size can be assessed at a glance.
Reference clay mineral samples A great deal of information has been published
on various characteristics of the reference clay mineral standards distributed under the auspices of the American Petroleum Institute 's Project 49 (Preliminary Reports, Reference Clay Minerals, A.P.I. Research Project 49; Columbia University, New York, January 1951). While samples of the original Project 49 set were not available for this project, pore-size distribution data were secured for samples collected at the same sites by Holmes and
PORE SIZE DISTRIBUTIONS IN CLAYS 11
0 . 1 6 0
0ol40
0.120 ( / ) taJ 1 -
O.lOO
0.080 (-9
0"060 o. 0 n- O 0-040
0.020
0.0
DROP HEIGHT DATA :
MERCURY ON KAOLINITE - COATED PLATE
hmax = 0 ' 1 4 3 8 in
O = 146 ~
i A i i i i
5 tO 15 20 25 30 D R O P W E I G H T G R A M S
Fig. 2. Drop height data for mercury on kaolinite-coated glass plate.
distributed by Ward 's Natural Science Establish- ment.
These clay samples are supplied as partly-ground and mixed pieces of size ranging up to an inch or more. The specimens employed in the pore-size distribution work were selected from the larger fragments and cut to appropriate size using a wood chisel. The samples were all sensibly air dry as supplied, although the initial hygroscopic moisture ranged up to about 19 per cent.
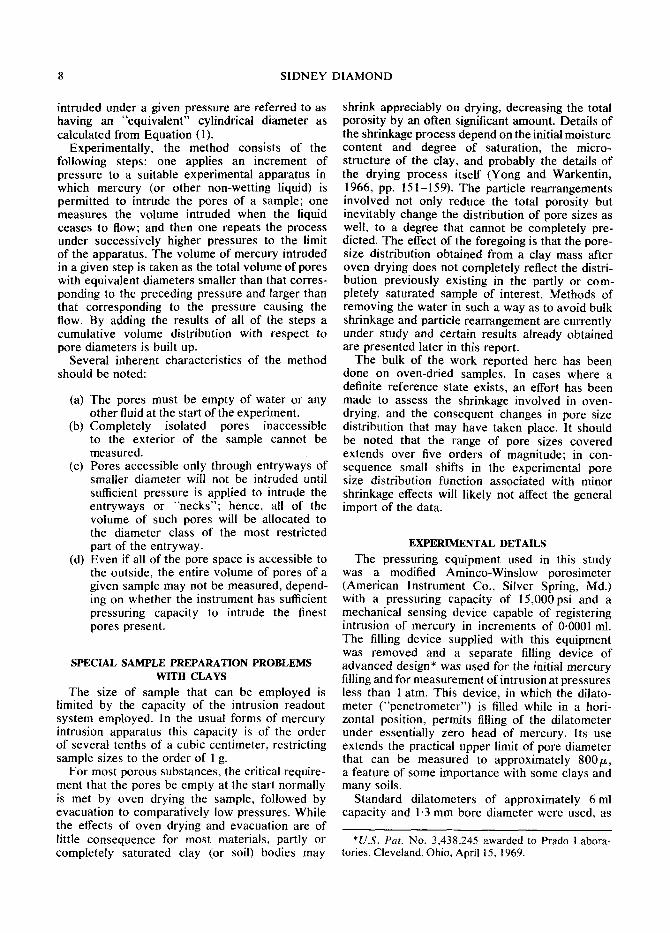
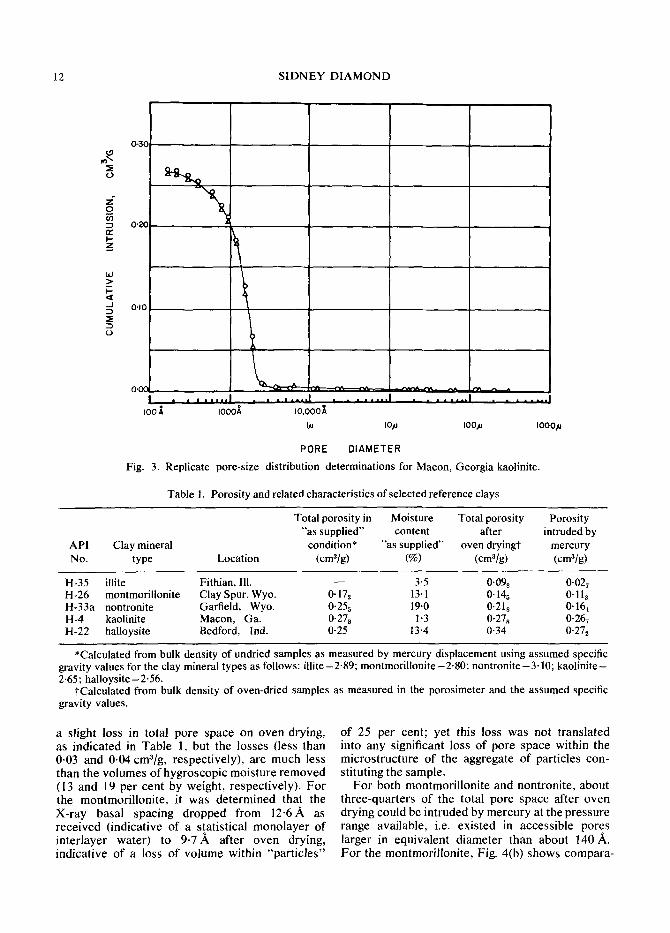
The reproducibility of the pore-size distribution curve was found to depend largely on the uni- formity of the specimen material with reference to the very small sample sizes that could normally be run. Where the clays concerned are micro- scopically homogeneous (such as the reference kaolinite from Macon, Georgia) or where an artificial sample has been prepared in such a way that homogeneity on a small scale exists (such as the compacted grundite samples), replicate runs trace the identical pore size distribution curve to a high degree of precision, as indicated in Fig. 3. Where the clays or soils are not homogeneous on a small scale, such as the reference halloysite from Bedford, Indiana or the natural subsoil samples from Indiana, replicates are not identical but naturally vary with the characteristics of the individual small specimen tested. All of the data presented in this report are individual runs which either are identical to other replicates or are judged most representative of a set of differing replicates.
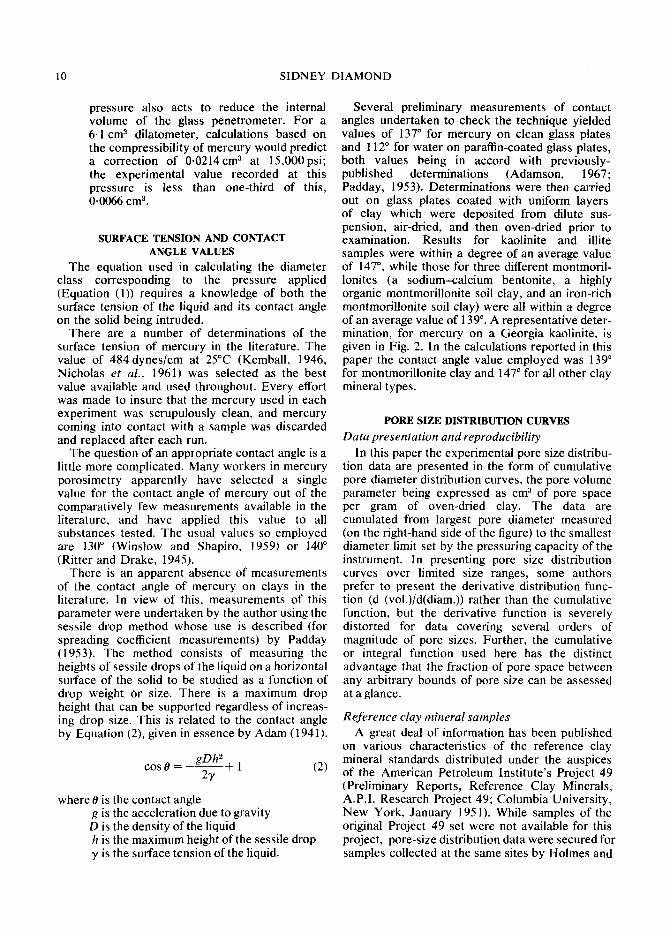
Selected samples were oven dried overnight and the pore-size distributions obtained, together with relevant information on shrinkage of the pore space accompanying the oven-drying process. Pertinent information on these samples is sum- marized in Table 1 and the pore-size distribution curves are given in Fig. 4 and Fig. 5. The numerical data of Table l representing the average values cited for total penetration of mercury into a parti- cular material may be slightly different from that shown in the corresponding curve of Fig. 4.
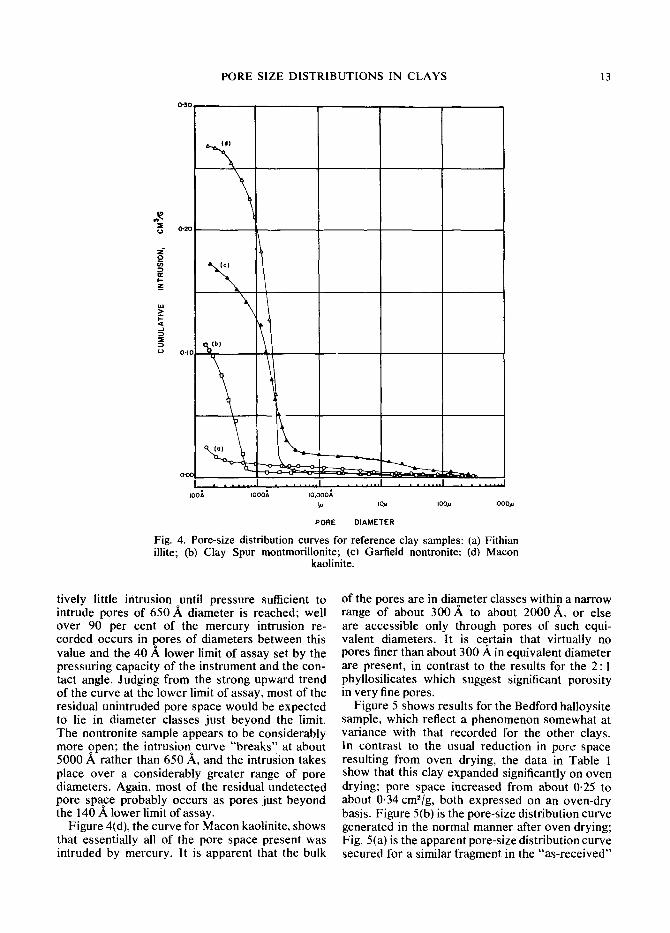
Figure 4(a), for the Fithian illite, is an illustration of an extremely "tight" microstructure. Total penetration of mercury into the samples is low (less than 0.03 cm3/g); this is less than one-third of the comparatively small volume of pores calculated to be present after oven drying. Since the "as- supplied" moisture content is so low, the shrinkage on oven drying was negligible. The pore space that has been intruded is distributed over the full range of pore sizes explored, the only noteworthy feature of the distribution curve being the upturn in pore volume for diameters less than 300A. It seems likely that most of the residual pore space not assayed is in pores less than 160 A in diameter. The fineness of the pores is a consequence of bothsmall particle size (external surface areas of 70-80 mZ/g are usually observed) and of the geological con- solidation processes undergone by this clay.
Figures 4(b) and 4(c) give typical curves for the Clay Spur montmorillonite and the Garfield non- tronite samples, respectively. Both clays suffer
12 SIDNEY DIAMOND
(.9
0
i o r
I-- z
Lid >.
I - /
(J
0-3(
0"2(
0-10 1 �9 �9 I l l l l l l * . �9 * , , = *1 I I . . . . . .
Joo ~, ioo0~ i �9 i . . . , | �9 . �9 , . , . , I
,o,ooo~ i# io# I00~ IO00/u
PORE DIAMETER
Fig. 3. Replicate pore-size distribution determinations for Macon, Georgia kaolinite.
Table 1. Porosity and related characteristics of selected reference clays
Total porosity in Moisture Total porosity Porosity "'as supplied" content after intruded by
API Clay mineral condition* "as supplied" oven drying? mercury No. type Location (cm3/g) (%) (cma/g) (cmZ/g)
H-35 illite Fithian, Ill. - - 3'5 0"098 0-027 H-26 montmoriUonite Clay Spur, Wyo. 0.17~ 13.1 0.145 0.11~ H-33a nontronite Garfield, Wyo. 0.255 19.0 0.218 0.164 H-4 kaolinite Macon, Ga. 0-278 1"3 0.278 0-267 H-22 halloysite Bedford, Ind. 0-25 13.4 0-34 0"27z
*Calculated from bulk density of undried samples as measured by mercury displacement using assumed specific gravity values for the clay mineral types as follows: illite-2-89; montmorillonite-2.80; nontronite-3.10; kaolinite- 2.65; halloysite- 2.56.
tCalculated from bulk density of oven-dried samples as measured in the porosimeter and the assumed specific gravity values.
a slight loss in total pore space on oven drying, as indicated in Table 1, but the losses (less than 0.03 and 0.04 cm3/g, respectively), are much less than the volumes of hygroscopic moisture removed (13 and 19 per cent by weight, respectively). For the montmorillonite, it was determined that the X-ray basal spacing dropped from 12.6A as received (indicative of a statistical monolayer of interlayer water) to 9.7fi, after oven drying, indicative of a loss of volume within "panic les"
of 25 per cent; yet this loss was not translated into any significant loss of pore space within the microstructure of the aggregate of particles con- stituting the sample.
For both montmorillonite and nontronite, about three-quarters of the total pore space after oven drying could be intruded by mercury at the pressure range available, i.e. existed in accessible pores larger in equivalent diameter than about 140 ,~. Fo r the montmorillonite, Fig. 4(b) shows compara-
PORE SIZE DISTRIBUTIONS IN CLAYS 13
0-20
1 r
_z
~ %,b) (") O'lO
�9 0 ~ , , - J , . . . . . . . | . . . . . . . . . . . . . . . . . . . . . . .
IOOA I000 "~ I0,000~ I,,u Io~ IOO~u IO00~
PORE DIAMETER
Fig. 4. Pore-size distdbution curves for reference clay samples: (a) Fithian illite; (b) Clay Spur montmorillonite; (c) Garfield nontronite; (d) Macon
kaolinite.
tively little intrusion until pressure sufficient to intrude pores of 650 fl~ diameter is reached; well over 90 per cent of the mercury intrusion re- corded occurs in pores of diameters between this value and the 40 ,~ lower limit of assay set by the pressuring capacity of the instrument and the con- tact angle. Judging from the strong upward trend of the curve at the lower limit of assay, most of the residual unintruded pore space would be expected to lie in diameter classes just beyond the limit. The nontronite sample appears to be considerably more open; the intrusion curve "breaks" at about 5000 ,~ rather than 650 .A, and the intrusion takes place over a considerably greater range of pore diameters. Again, most of the residual undetected pore space probably occurs as pores just beyond the 140 A lower limit of assay.
Figure 4(d), the curve for Macon kaolinite, shows that essentially all of the pore space present was intruded by mercury. It is apparent that the bulk
of the pores are in diameter classes within a narrow range of about 300 ,~ to about 2000 ~ , or else are accessible only through pores of such equi- valent diameters. It is certain that virtually no pores finer than about 300 A in equivalent diameter are present, in contrast to the results for the 2:1 phyilosilicates which suggest significant porosity in very fine pores.
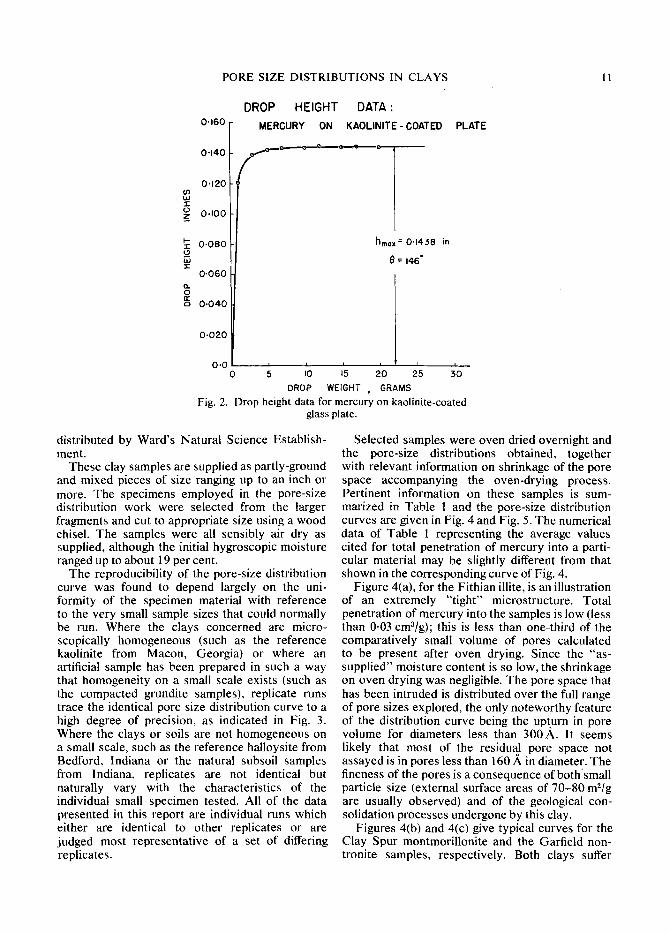
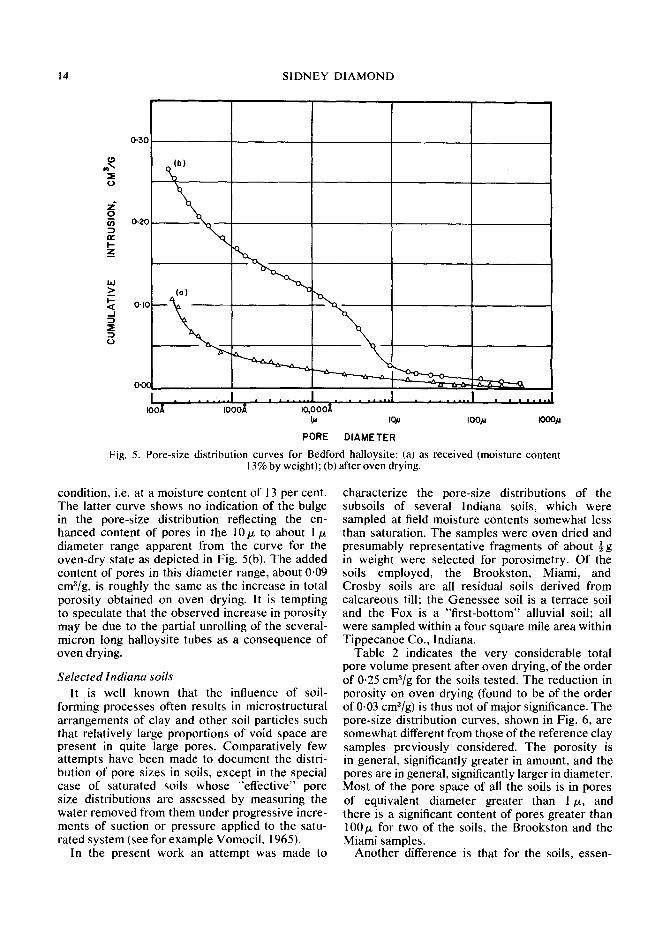
Figure 5 shows results for the Bedford halloysite sample, which reflect a phenomenon somewhat at variance with that recorded for the other clays. In contrast to the usual reduction in pore space resulting from oven drying, the data in Table 1 show that this clay expanded significantly on oven drying; pore space increased from about 0-25 to about 0.34 cm2/g, both expressed on an oven-dry basis. Figure 5(b) is the pore-size distribution curve generated in the normal manner after oven drying; Fig. 5(a) is the apparent pore-size distribution curve secured for a similar fragment in the "as-received"
14 SIDNEY DIAMOND
0-30
> (a)
O'IC - - -J
~E
I , . . . . . . . I . . . . . . . I . . . . . . . . I . . . . . . . . I , , . . . . . . I Ioo~ iooo,K io,ooo~
~ io~u Ioo~u iooo~u
PORE DIAMETER
Fig. 5. Pore-size distribution curves for Bedford halloysite: (a) as received (moisture content 13% by weight); (b) after oven drying.
Z O
o.2e t~ I - z
condition, i.e. at a moisture content of 13 per cent. The latter curve shows no indication of the bulge in the pore-size distribution reflecting the en- hanced content of pores in the 10p. to about 1/z diameter range apparent from the curve for the oven-dry state as depicted in Fig. 5(b). The added content of pores in this diameter range, about 0.09 cm3/g, is roughly the same as the increase in total porosity obtained on oven drying. It is tempting to speculate that the observed increase in porosity may be due to the partial unrolling of the several- micron long halloysite tubes as a consequence of oven drying.
Selected Indiana soils
It is well known that the influence of soil- forming processes often results in microstructural arrangements of clay and other soil particles such that relatively large proportions of void space are present in quite large pores. Comparatively few attempts have been made to document the distri- bution of pore sizes in soils, except in the special case of saturated soils whose "effective" pore size distributions are assessed by measuring the water removed from them under progressive incre- ments of suction or pressure applied to the satu- rated system (see for example Vomocil, 1965).
In the present work an attempt was made to
characterize the pore-size distributions of the subsoils of several Indiana soils, which were sampled at field moisture contents somewhat less than saturation. The samples were oven dried and presumably representative fragments of about �89 in weight were selected for porosimetry. Of the soils employed, the Brookston, Miami, and Crosby soils are all residual soils derived from calcareous till; the Genessee soil is a terrace soil and the Fox is a "first-bottom" alluvial soil; all were sampled within a four square mile area within Tippecanoe Co., Indiana.
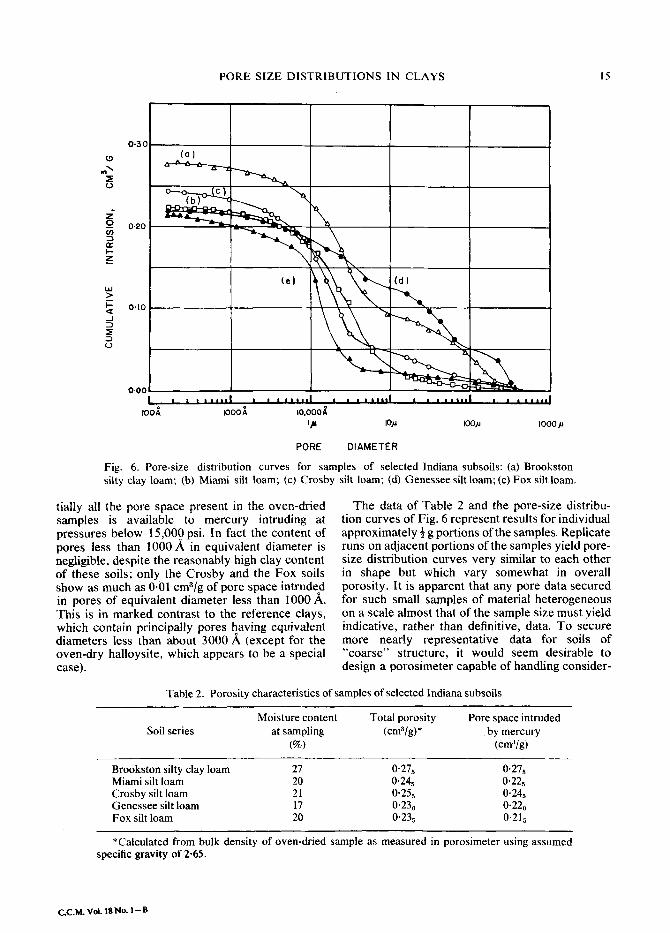
Table 2 indicates the very considerable total pore volume present after oven drying, of the order of 0-25 cmS/g for the soils tested. The reduction in porosity on oven drying (found to be of the order of 0.03 cm3/g) is thus not of major significance. The pore-size distribution curves, shown in Fig. 6, are somewhat different from those of the reference clay samples previously considered. The porosity is in general, significantly greater in amount, and the pores are in general, significantly larger in diameter. Most of the pore space of all the soils is in pores of equivalent diameter greater than 1/z, and there is a significant content of pores greater than 100/z for two of the soils, the Brookston and the Miami samples.
Another difference is that for the soils, essen-
PORE SIZE DISTRIBUTIONS IN CLAYS 15
r
t.)
i 0 u)
r,- I.- Z
uJ > I - /
t )
0 - 3 0
0.20
0.10
0.00
,ooi
(a)
(el {d) --...
I I I ' ' ' * ' I , , * * . , , * l , = . , * = . . I * . , . . . , , I . . , , , , , , I
,oooi ~o,ooo~, I#, lOp lOOju lO00ju
PORE DIAMETER
Fig. 6. Pore-size distribution curves for samples of selected Indiana subsoils: (a)Brookston silty clay loam; (b) Miami silt loam; (c) Crosby silt loam; (d) Genessee silt loam; (e)Fox silt loam.
tiaUy all the pore space present in the oven-dried samples is available to mercury intruding at pressures below 15,000 psi. In fact the content of pores less than 1000 A in equivalent diameter is negligible, despite the reasonably high clay content of these soils; only the Crosby and the Fox soils show as much as 0.01 cm3/g of pore space intruded in pores of equivalent diameter less than I000 ,~. This is in marked contrast to the reference clays, which contain principally pores having equivalent diameters less than about 3000 A (except for the oven-dry halloysite, which appears to be a special case).
The data of Table 2 and the pore-size distribu- tion curves of Fig. 6 represent results for individual approximately �89 g portions of the samples. Replicate runs on adjacent portions of the samples yield pore- size distribution curves very similar to each other in shape but which vary somewhat in overall porosity. It is apparent that any pore data secured for such small samples of material heterogeneous on a scale almost that of the sample size must yield indicative, rather than definitive, data. To secure more nearly representative data for soils of "coarse" structure, it would seem desirable to design a porosimeter capable of handling consider-
Table 2. Porosity characteristics of samples of selected Indiana subsoils
Soil series Moisture content Total porosity Pore space intruded
at sampling (cm3/g) * by mercury (%) (cm~/g)
Brookston silty clay loam 27 0"275 0'275 Miami silt loam 20 0"245 0"225 Crosby silt loam 21 0"255 0"245 Genessee silt loam 17 0-23o 0"220 Fox silt loam 20 0"235 0.215
*Calculated from bulk density of oven-dried sample as measured in porosimeter using assumed specific gravity of 2-65.
C,,C.M. Vol. 18No. I-B

16 SIDNEY DIAMOND
ably larger maximum intruded volumes that the 0.2 cm a limit of the instrument employed.
Clays sedimented from dispersed and from salt- flocculated suspensions
Samples of two commercial clays, Edgar Plastic kaolin from Florida, and Grundite, an illite-bearing clay from Illinois were employed. Portions of each were thoroughly dispersed in a milkshake machine, using a trace of Calgon as a dispersing agent, so as to form an aqueous suspension of about two per cent concentration by weight. A portion of each suspension was allowed to sediment un- disturbed for a number of days until the super- natant solution was essentially clear. The remaining portion of each suspension was flocculated by the addition of sodium chloride (added with stirring until definite flocs were observed). The salt- flocculated suspensions were allowed to settle overnight, after which the supernatant liquid was essentially clear. The supernatant liquid in each case was siphoned off; additional liquid removed by aspirator suction over a Bfichner funnel, and each of the samples was allowed to air-dry, forming a cake of the order of one-quarter inch in thickness at the bottom of the container. Portions of the material were sampled with a razor blade so as to attempt to include representative proportions of both fine and coarse material, and the samples were oven dried and pore-size distri- butions determined. The porosity data is given in Table 3 and the pore-size distribution curves in Fig. 7. Replicate samples give virtually identical results for the "salt-flocculated'" samples, but some variation was noted in both the total porosity and pore-size distribution curves of the "dispersed" materials, presumably due to sampling difficulty.
It is apparent from the table that for both clays settlement in the salt-flocculated condition led to
a dried material with only about 60 per cent of the porosity retained by samples allowed to settle in the dispersed state. For both clays, Fig. 7 in- dicates that the bulk of the pore space assayed is in pores of significantly smaller sizes for the salt- flocculated material than for the material settled from the dispersed condition.
It is apparent from Table 3 that for both kinds of kaolinite preparation essentially all of the pore space present after oven drying was intruded by mercury; in contrast, for the illite preparations, especially the "dispersed" sample, a significant fraction of the pore space was not intruded, i.e. was present in pores of equivalent diameter less than about 160 A or else was available to the surface only through channels smaller than this limiting value.
Figure 7(a) indicates that a small but significant content of quite large pores (5/~ to several hun- dred p.) occurs in the "dispersed" kaolinite clay; but large pores are essentially absent from the "dispersed" illite and particularly from both "flocculated" samples. The explanation for this effect appears to lie in the polydispersity of the clay, combined with the peculiar nature of the coarse kaolinite particles. The coarse size fraction of the kaolin, which has been studied extensively by Ormsby and Shartsis (1960), consists of particles which are composed of "books" of kaolinite plates rather than individual plates. A brief examination of the dried kaolin preparations by scanning elec- tron microscopy* was made. It was apparent, as seen in Fig. 8, that the bottom layer of the sample prepared from the dispersed state consisted of "books" several to many microns in size, separated
*The scanning electron micrographs were supplied through the courtesy of Engis Equipment Co., Chicago, Illinois.
Table 3. Porosity characteristics of oven-dried commercial clay specimens
Pore space Total intruded by
Condition of porosity* mercury Sample sedimentation (cm3/g) (cm3/g)
Edgar Plastic Dispersed 0'470 0'450 kaolin Flocculated 0"283 0"204 (kaolinite) Grundite Dispersed 0"270 0"220 (illite) Flocculated 0.186 0.135
*Calculated from bulk density of oven-dried sample as measured in porosimeter using assumed specific gravity of 2.65 for the Edgar Plastic kaolin and 2.82 for the Grundite.

PORE SIZE D I S T R I B U T I O N S IN CLAYS 17
:E o
~
z
0"40
(hi
O ' Z C
(d) " ~
o
. . . . . . . . . . . . . . . . | . . . . . . . . ~ool ~oooX io,ooo
. . . . , . o
I# IO~u IOOju IOOO~u
PORE DIAMETER
Fig. 7. Pore-size d ist r ibut ion curves fo r sedimented commerc ia l c lay samples: (a) Edgar Plastic kaolin, "'dispersed"; (b) Edgar Plastic kaolin, "flocculated"; (c) Grundite, "dispersed"; (d) Grundite, "flocculated."
by pore spaces of the same order of magnitude. With the sample prepared from the flocculated state, the "books" are intimately surrounded by masses of finer particles, as seen in Fig. 9, and the resulting large spaces between "books" are not present. Figure 7 shows that besides the very large pores, the bulk of the pore space in the "dispersed" kaolinite ranges between limits of about 500 A and 2p~; in contrast, the bulk of the pore space in the "flocculated" preparation is confined to a signi- ficantly smaller and narrower range of perhaps 400 .~ to about 1000 A.
The general characteristics of the illite curves seem to be somewhat different from those of the corresponding kaolinite curves. The preparation made from the dispersed suspension seems to have the bulk of its observable porosity concentrated between about 500 ,~ and 2/z in equivalent dia- meter, but the lesser pore space intruded in the "flocculated" sample is more or less uniformly spread over the whole of the available size range below 2 p..
Compacted clays A major feature of the utilization of clay and
other soils for engineering purposes is the manner
in which they densify and become stronger with the application of mechanical compactive effort. In general, field compaction of soils involves the application of as many passes of heavy compaction equipment as required to attain a specific bulk density, after previously adjusting the loosened soil to an appropriate moisture content. For a given level of compactive effort the optimal moisture content for a given soil is determined by a standardized laboratory testing process involving compaction by the repeated impact of a weight allowed to fall on the soil from a specified height. Attempts to compact at moisture contents significantly different from the optimum result in less dense soils which are usually inferior in their ability to support loads.
The pore structure of compacted soils is of interest in defining the details of the compaction process and the state of compaction. In the present work, pore-size distributions have been determined for the Edgar Plastic kaolin commercial clay previously discussed, compacted by an impact compaction method essentially similar to standard procedures. Preparation of the samples involved thorough blending of the clay with a stated per- centage of water in a twin-shell solid-liquid
18 SIDNEY DIAMOND
blender, followed by compaction in three layers in a mold approximately 3.3 cm in diameter and 7.1 cm high. The compaction was effected by the dropping of a 1450-g cylindrical compaction hammer through a distance of 25.4 cm a specified number of times (usually 30) per layer. The method resembles, but does not exactly duplicate, those specified in ASTM D-698 and D-1557, Tests For Moisture-Density Relations of Soils.
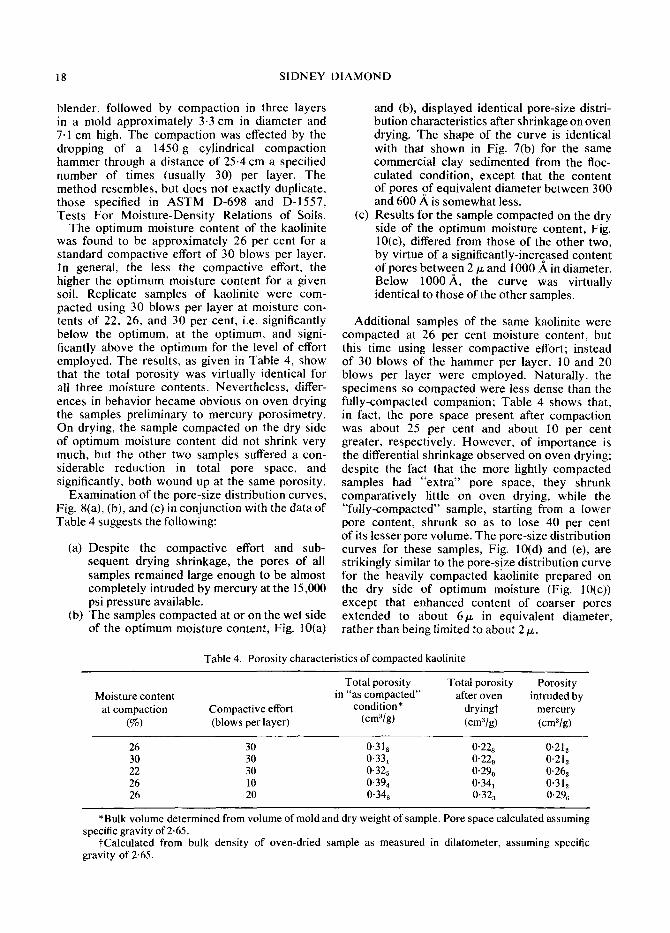
The optimum moisture content of the kaolinite was found to be approximately 26 per cent for a standard compactive effort of 30 blows per layer. In general, the less the compactive effort, the higher the optimum moisture content for a given soil. Replicate samples of kaolinite were com- pacted using 30 blows per layer at moisture con- tents of 22, 26, and 30 per cent, i.e. significantly below the optimum, at the optimum, and signi- ficantly above the optimum for the level of effort employed. The results, as given in Table 4, show that the total porosity was virtually identical for all three moisture contents. Nevertheless, differ- ences in behavior became obvious on oven drying the samples preliminary to mercury porosimetry. On drying, the sample compacted on the dry side of optimum moisture content did not shrink very much, but the other two samples suffered a con- siderable reduction in total pore space, and significantly, both wound up at the same porosity.
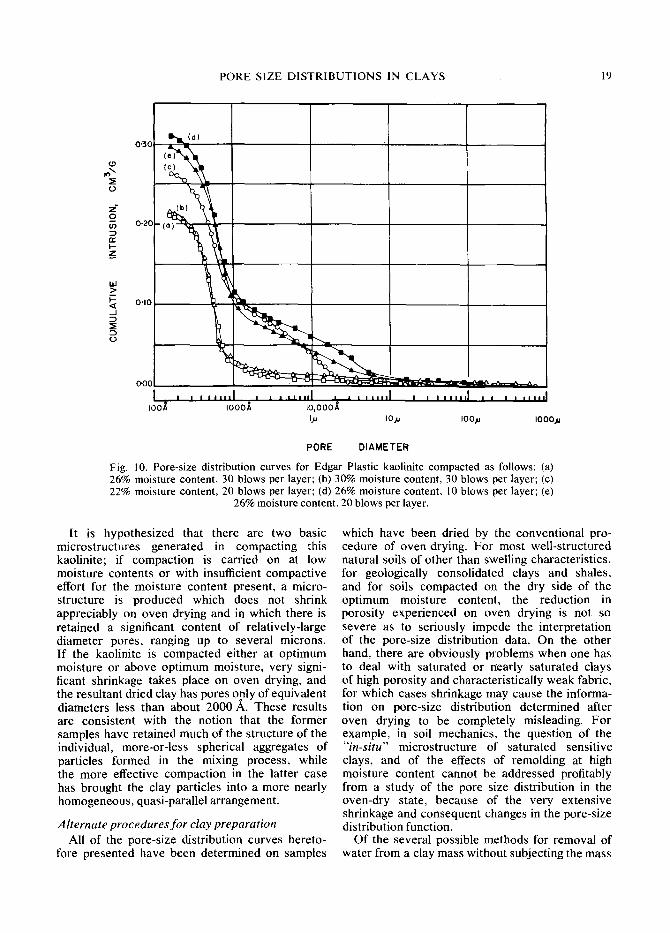
Examination of the pore-size distribution curves, Fig. 8(a), (b), and (c) in conjunction with the data of Table 4 suggests the following:
(a) Despite the compactive effort and sub- sequent drying shrinkage, the pores of all samples remained large enough to be almost completely intruded by mercury at the 15,000 psi pressure available.
(b) The samples compacted at or on the wet side of the optimum moisture content, Fig. 10(a)
(c)
and (b), displayed identical pore-size distri- bution characteristics after shrinkage on oven drying. The shape of the curve is identical with that shown in Fig. 7(b) for the same commercial clay sedimented from the floc- culated condition, except that the content of pores of equivalent diameter between 300 and 600 ~ is somewhat less. Results for the sample compacted on the dry side of the optimum moisture content, Fig. 10(c), differed from those of the other two, by virtue of a significantly-increased content of pores between 2/x and 1000 A in diameter. Below 1000A, the curve was virtually identical to those of the other samples.
Additional samples of the same kaolinite were compacted at 26 per cent moisture content, but this time using lesser compactive effort; instead of 30 blows of the hammer per layer, l0 and 20 blows per layer were employed. Naturally, the specimens so compacted were less dense than the fully-compacted companion; Table 4 shows that, in fact, the pore space present after compaction was about 25 per cent and about 10 per cent greater, respectively. However, of importance is the differential shrinkage observed on oven drying; despite the fact that the more lightly compacted samples had "extra" pore space, they shrunk comparatively little on oven drying, while the "fully-compacted" sample, starting from a lower pore content, shrunk so as to lose 40 per cent of its lesser pore volume. The pore-size distribution curves for these samples, Fig. 10(d) and (e), are strikingly similar to the pore-s!ze distribution curve for the heavily compacted kaolinite prepared on the dry side of optimum moisture (Fig. 10(c)) except that enhanced content of coarser pores extended to about 6/x in equivalent diameter, rather than being limited to about 2/x.
Table 4. Porosity characteristics of compacted kaolinite
Total porosity Total porosity Porosity Moisture content in "as compacted" after oven intruded by
at compaction Compactive effort condition* dryingi mercury (%) (blows per layer) (cma/g) (cm3/g) (cm3/g)
26 30 0'318 0"228 0"21z 30 30 0'33~ 0"229 0'213 22 30 0"32s 0"290 0"262 26 10 0'394 0"341 0"312 26 20 0"348 0"328 0'296
*Bulk volume determined from volume of mold and dry weight of sample. Pore space calculated assuming specific gravity of 2.65.
tCalculated from bulk density of oven-dried sample as measured in dilatometer, assuming specific gravity of 2-65.
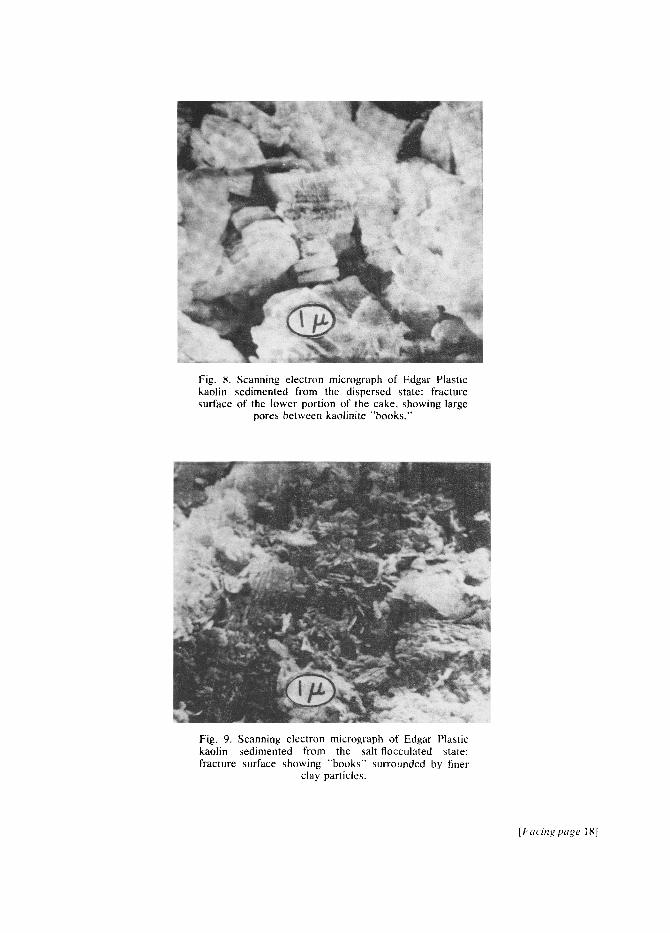
Fig. 8. Scanning electron micrograph of Edgar Plastic kaolin sedimented from the dispersed state: fracture surface of the lower portion of the cake, showing large
pores between kaolinite "'books."
Fig, 9. Scanning electron micrograph of Edgar Plastic kaolin sedimented from the salt-flocculated state: fracture surface showing "books" surrounded by finer
clay particles.
[[,a(ill~/~(l~e ] 8]
PORE SIZE DISTRIBUTIONS IN CLAYS 19
(.9
z ~ 0 (/)
n," k- Z
> F-
._1 ::D
::D
0"3C
0-20
OqO
0"00
I00,~
(b)
, , . . . . . I . . . . . . . . I . . . . . . . . I , , , , , , , , I . . . . . . . . . I iooo~, to,000~
I~u IO~u IO0~u IO00ju
PORE D I A M E T E R
Fig. 10. Pore-size distribution curves for Edgar Plastic kaolinite compacted as follows: (a) 26% moisture content, 30 blows per layer; (b) 30% moisture content, 30 blows per layer; (c) 22% moisture content, 20 blows per layer; (d) 26% moisture content, 10 blows per layer; (e)
26% moisture content, 20 blows per layer.
It is hypothesized that there are two basic microstructures generated in compacting this kaolinite; if compaction is carried on at low moisture contents or with insufficient compactive effort for the moisture content present, a micro- structure is produced which does not shrink appreciably on oven drying and in which there is retained a significant content of relatively-large diameter pores, ranging up to several microns. If the kaolinite is compacted either at optimum moisture or above optimum moisture, very signi- ficant shrinkage takes place on oven drying, and the resultant dried clay has pores only of equivalent diameters less than about 2000 A. These results are consistent with the notion that the former samples have retained much of the structure of the individual, more-or-less spherical aggregates of particles formed in the mixing process, while the more effective compaction in the latter case has brought the clay particles into a more nearly homogeneous, quasi-parallel arrangement.
Alternate procedures for clay preparation All of the pore-size distribution curves hereto-
fore presented have been determined on samples
which have been dried by the conventional pro- cedure of oven drying. For most welt-structured natural soils of other than swelling characteristics, for geologically consolidated clays and shales, and for soils compacted on the dry side of the optimum moisture content, the reduction in porosity experienced on oven drying is not so severe as to seriously impede the interpretation of the pore-size distribution data. On the other hand, there are obviously problems when one has to deal with saturated or nearly saturated clays of high porosity and characteristically weak fabric, for which cases shrinkage may cause the informa- tion on pore-size distribution determined after oven drying to be completely misleading. Fo r example, in soil mechanics, the question of the "in-situ" microstructure of saturated sensitive clays, and of the effects of remolding at high moisture content cannot be addressed profitably from a study of the pore size distribution in the oven-dry state, because of the very extensive shrinkage and consequent changes in the pore-size distribution function.
Of the several possible methods for removal of water from a clay mass without subjecting the mass
20 SIDNEY DIAMOND
to shrinkage, two are being explored in research at Purdue University. The simpler procedure is "freeze-drying"; i.e. rapid freezing of the samples in liquid nitrogen or some other cryogenic medium followed by evacuation of the water under vacuum at a temperature sufficiently low that no unfrozen water can exist in the system. Thus, the influence of contraction of water menisci in pulling the clay particles into closer approach to each other as the sample dries is avoided. The major difficulty with this procedure is that of ensuring that no significant changes in the microstructure accompany the freezing process. For example, Ahlrichs and White (1967) have shown that rapid redistribution of interlayer water takes place on quick-freezing montmorillonite; whether this redistribution can affect the measured pore-size distribution is not yet known.
A second possible procedure involves arranging a dynamic program of temperature and pressure changes so that the water in the sample is slowly brought into the thermodynamic "critical region" without being expelled from the clay. In this region (temperature above 274~ and pressure greater than 216.4 bars) the meniscus marking the interface between liquid water in the pores of the sample and water vapor has disappeared, all water existing
as a single homogenous fluid phase. It is then possible to "distill" the water from the sample to a slightly colder region without the clay undergoing shrinkage. Once this process is complete, the sample can be slowly cooled and depressured without serious consequence.
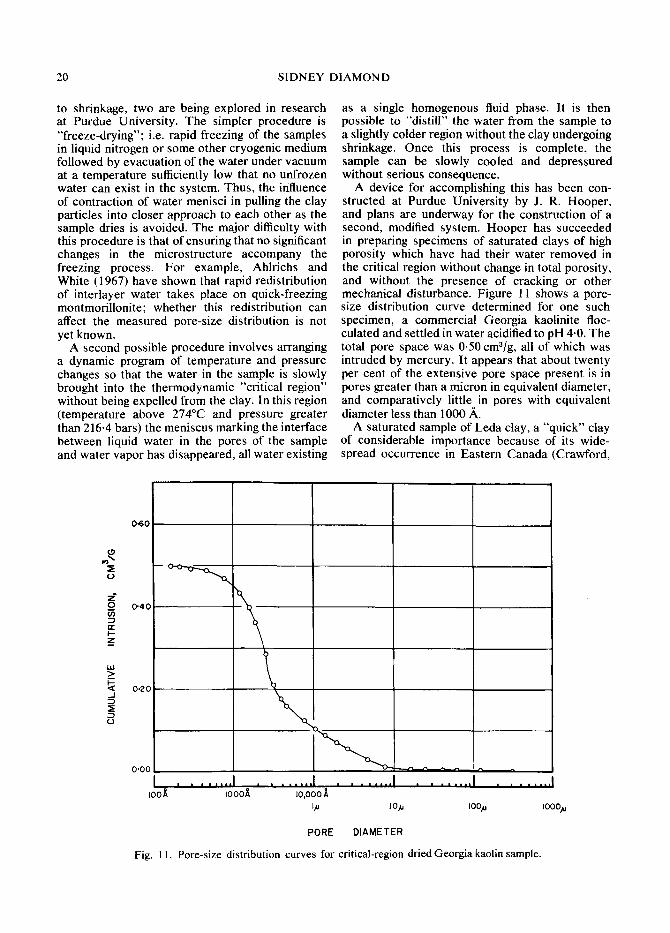
A device for accomplishing this has been con- structed at Purdue University by J. R. Hooper, and plans are underway for the construction of a second, modified system. Hooper has succeeded in preparing specimens of saturated clays of high porosity which have had their water removed in the critical region without change in total porosity, and without the presence of cracking or other mechanical disturbance. Figure 11 shows a pore- size distribution curve determined for one such specimen, a commercial Georgia kaolinite floc- culated and settled in water acidified to pH 4.0. The total pore space was 0.50 cm3/g, all of which was intruded by mercury. It appears that about twenty per cent of the extensive pore space present is in pores greater than a micron in equivalent diameter, and comparatively little in pores with equivalent diameter less than 1000 ~,
A saturated sample of Leda clay, a "quick" clay of considerable importance because of its wide- spread occurrence in Eastern Canada (Crawford,
(.9
:E t)
0
n-
Z
W >
_d
(D
0"60
0"40
0.20
0"00
....... I ................ I ........ I i I ' �9 ~ �9
I00~ I000~ I0,000 A ~ io~ loo~ iooo~
PORE DIAMETER
Fig. I h Pore-size distribution curves for critical-region dried Georgia kaolin sample.
PORE SIZE DISTRIBUTIONS 1N CLAYS 21
I _; ~176 !
w ~ o.ao[
0 . 0 0 I I , . , . , I , I i I I i I I
=ool Ioool I0,000~, bu
. . . . I . . . . . . . . . I . . . . . . . . I
IO,u I00~ I000#
PORE DIAMETER
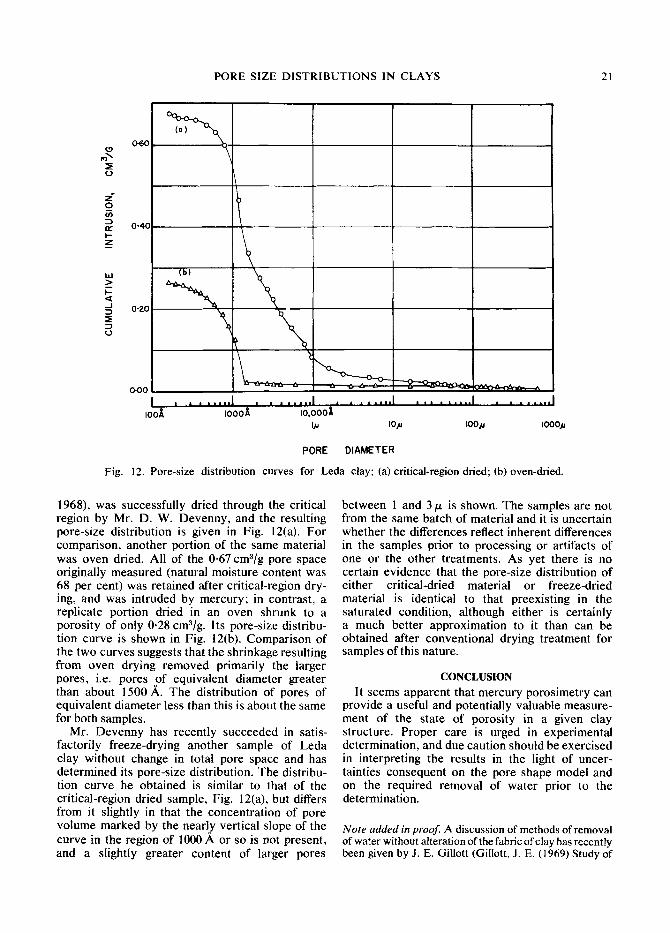
Fig. 12. Pore-size distribution curves for Leda clay; (a)critical-region dried; (b)oven-dried.
1968), was successfully dried through the critical region by Mr. D. W. Devenny, and the resulting pore-size distribution is given in Fig. 12(a). For comparison, another portion of the same material was oven dried. All of the 0.67 cm3/g pore space originally measured (natural moisture content was 68 per cent) was retained after critical-region dry- ing, and was intruded by mercury; in contrast, a replicate portion dried in an oven shrunk to a porosity of only 0.28 cmZ/g. Its pore-size distribu- tion curve is shown in Fig. 12(b). Comparison of the two curves suggests that the shrinkage resulting from oven drying removed primarily the larger pores, i.e. pores of equivalent diameter greater than about 1500 A. The distribution of pores of equivalent diameter less than this is about the same for both samples.
Mr. Devenny has recently succeeded in satis- factorily freeze-drying another sample of Leda clay without change in total pore space and has determined its pore-size distribution. The distribu- tion curve he obtained is similar to that of the critical-region dried sample, Fig. 12(a), but differs from it slightly in that the concentration of pore volume marked by the nearly vertical slope of the curve in the region of lO00 ,~ or so is not present, and a slightly greater content of larger pores
between 1 and 3 tx is shown. The samples are not from the same batch of material and it is uncertain whether the differences reflect inherent differences in the samples prior to processing or artifacts of one or the other treatments. As yet there is no certain evidence that the pore-size distribution of either critical-dried material or freeze-dried material is identical to that preexisting in the saturated condition, although either is certainly a much better approximation to it than can be obtained after conventional drying treatment for samples of this nature.
CONCLUSION It seems apparent that mercury porosimetry can
provide a useful and potentially valuable measure- ment of the state of porosity in a given clay structure. Proper care is urged in experimental determination, and due caution should be exercised in interpreting the results in the light of uncer- tainties consequent on the pore shape model and on the required removal of water prior to the determination.
Note added in proof. A discussion of methods of removal of water without alteration of the fabric of clay has recently been given by J. E. Gillott (Gillott, J. E. (1969) Study of

22 SIDNEY D I A M O N D
the fabric of fine-grained sediments with the scanning electron microscope: J, Sediment. Petrol. 39, 90-105).
Acknowledgment-1 acknowledge with thanks the very competent technical assistance of Mrs. Patricia Mewhinney and Mr. D. N. Winslow.
R E F E R E N C E S Adamson, Arthur W. (1967) Physical Chemistry of
Surfaces (2nd edn) lnterscience, New York 747 pp. Ahlrichs, J. L., and White, J. L. (1962) Freezing and
lyophilizing alters the structure of bentonite gels: Science 136, I 16-118.
Crawford, Carl B. (1968) Quick clays of eastern Canada: Eng. Geol. 2, 239-265.
Kemball, C. (1946) On the surface tension of mercury: Trans. Faraday Soc. 42,526-537.
Nicholas, M. E., Joyner, P. A., Tessem, B. M., and Olsen, M. D. (1961) The effects of various gases and vapors on the surface tension of mercury: J. Phys. Chem. 65, 1373-1375.
Ormsby, C. W. and Shartsis, J. M. (1960) Surface area and exchange capacity relation in a Florida kaolinite:
J. Am. Ceram. Soc. 43, 44-47. Padday, J. J. (1957) A new method for measuring the
spreading coefficient of a liquid on a solid surface: Proc. 2nd Intern. Congr. Surface Activity, London 3, 136-142.
Ritter, H. L., and Drake, D. L. (1945) Pore-size distribu- tion in porous materials: Ind. Eng. Chem., Analyt. Ed, 17,782-791.
Vomocil, James A. (1965) Porosity: In Methods of Soil Analysis (Edited by C. A. Black) American Society of Agronomy, Madison, Wisconsin, Part 1,299-314.
Washburn, E. W. (1921) Note on a method of determin- ing the distribution of pore sizes in a porous material: Proc. Nat.Acad. Sci. U.S. 7, 115-116.
Winslow, N. M. and Shapiro, J. J. (1959) An instrument for the measurement of pore-sized distribution by mercury penetration: A.S.T.M. Bull. 236, 39-54.
Yong, Raymond N. and Warkentin, Benno P. (1966) Introduction to Soil Behavior: Macmillan, New York, 439 pp.
R6sum~- La connaissance de la distribution des dimensions des pores dans l'argile et les constituants du sol, est un 61dment utile dans la caractdrisation microstructurale de tels mat6riaux. Les distri- butions de la dimension des pores et la porosit6 totale d'un certain hombre d'argiles de r6f6rence, se produisant naturellement dans les sous-sols, et les 6chantillons d'argile commerciaux pr6par6s de diff6rentes mani6res, ont dt6 d6termines par la porosim6trie du mercure. L'6tendue du diam6tre 6quivalent du pore explor6, couvrait presque cinq ordres de grandeur, variant de plusieurs centaines de microns pour atteindre approxativement 150 A. La m6thode et ses hypoth/~ses sont 6valu6es d'une far critique, et les mesures de I'angle de contact de mercure sur les argiles fournissent des valeurs de 139 ~ pour le montmoriUonite et 147 ~ pour la kaofinite et les argiles illite. Le degr6 de retrait par s6chage au four pr6alablement b. rinjection de mercure est 6valu~ darts chaque cas et on s'aperr qu'il varie d'une valeur insignifiante pour atteindre un taux de 30 pour cent de l'espace du pore, cela d6pend de I'etat microstructural et du degr6 de saturation initial. Le d6veloppement des techniques pour l'61imination d'eau qui n'implique pas de modifications dans la structure du pore est explor& Certains r6sultats pr61iminaires pour les argiles satur6s, structurellement faibles, sugg~rent que le s6chage de la r6gion critique et peut-6tre les mdthodes de s6chage par cong61ation, peuvent 6tre pratiqu6s.
K u r z r e f e r a t - Eine Kenntnis der Verteitung der Porengr6ssen in Tonen und Erdbi~den ist ein wichtiges Element in der mikrostrukturellen Charakterisierung solcher Materiale. Die Porengri~ssenverteilungen und die Gesamtporosit~it einer Anzahl von Kontrolltonen, natiirlich vorkommender Untergrunde und auf verschiedene Weise bereiteter, handelsm~issiger Tonproben wurden mittels Quecksilber- Porosimetrie bestimmt. Der Bereich untersuchter Porendurchmesser umfasste beinahe fiinf Gr6ssen- ordnungen, angefangen yon einigen Hundert Mikrons his hinunter zu etwa 150 A. Dieses Verfahren und seine Voraussetzungen werden kritisch beurteilt, und Messungen des Kontaktwinkels des Quecksilbers an Tonen ergaben Werte yon 139 ~ fiJr Montmorillonit und 147 ~ fiir Kaolinit und lllit Tone. Das Ausmass der Schrumpfung durch Ofentrocknung vor dem Eindringen des Quecksilbers wurde jeweils eingesch~itzt, und es wurde festgestellt, dass die Variation, je nach dem mikrostruktur- ellen Zustand und dem Masse an anffinglicfier S~ittigung, sich yon unbedeutenden Werten his hinauf zu 30 Prozent des Porenraumes bewegten. Die Entwicklung yon Methoden fiir die Entfernung yon Wasser ohne Ver~inderung der Porenstruktur wird er6rtert. Vorl~iufige Resultate n-fit strukturell schwachen, ges~ittigten Tonen deuten darauf him dass Trocknung im kritischen Bereich und vielleicht Friertrocknungsverfahren yon praktischer Bedeutung sein kfnnten.
P e 3 E o M e ~ P a c n p e ~ e ~ e n H e pa3MepOB h o p a r~HHe H noqBax gB~SeTC~ iI.q~ 3THX MaTepHaYIOB BaXHblM 3YIeMeHTOM gX MHKpOCTpyKTypHoi~ xapalcTepHCTHKH. Pacnpel leyleHHe pa3Mepoa h o p H 0 6 m a s HopHcTOCTb ~[Jlg CTaB}lapTHb[X FJIHH H HO~!/OtIBeHHblX 0 6 p a 3 u o n , a TaK~Ke ~ pa3P~HqHO HpHFOTO- BYleHHb[X 06pa3LIoa KOMMepqeCKHX FYlHH ~bl.rlH onpe~ef leHbi c IIOMOII~bIO pTyTHOrO MeTORa. I/[HTepnaY[ HaI~]IeHHhIX p a 3 M e p o n 3KBHBaJIeHTHOrO ~(HaMeTpa Hop noKpbIaaeT rlO~TH nffTb lIopff~[KOB BeYIHqHHb[, OT Hec[<o]IhKHX COTeH MHKP0H }IO HpHMepHo 150 A. CaM MeTOs H HcnoJIb3OBaHHHe B HeM ~[oIIyIIIeHHff KpHTHqecKH olleHeHbI, a H3MepeHI~ KOHTaKTHOFO y r a a pTyTH Ha F~HHaX ~ a ~ n

PORE SIZE DISTRIBUTIONS IN CLAYS 23
3HatIeHHI~ 139 o d n S MOHTMOpHYIYlOHHTOBblX H 1470 d n g KaoYlHHHTOBbIX H FHdpOCYIIO~HCTHX FYlHH. B Ka)I(dOM c ~ y ~ a e OHeHeHa CTeHCHb C~aTH~t IlpH BblCy/.HHBaHHH B n e q a x d o BHe~peHHfl pTyTH H Ha~ileHO, ~TO B 3aBHCHMOCTH OT MHKpOCTpyKTypHoFO COCTORHHfl H CTeIIeHH llepBOHa~la2IbHOrO HaCbImeHHg OHa H3MCH~ICTC~I OT He3Ha~-HTeYlbHO~ dO 30~o 0 6 ~ e M a h o p . PaCCMOTpeHb[ BO3MO)KHOGTH pa3BHTH~I MCTOdOB ydaYleHHg BOdbl ~e3 H3MeHeHH~ HOpHCTO~ cTpyXTypbL H e x o T o p b i e FlpCdBa- pHTeYlbHbIe lIaHHble ~Jlg cTpyETypHo r HacbIIE[CHHBIX TYIHH yEa3hlBalOT Ha Hp~tKTHtICCKylO 3HatlHMOCTb BBIGyIIIHBaHH~I B KpHTHtIeCKOI~ O62IaCTH, a TaK)Ke, BO3MO)I(HO, H BblCylHHBaHH$I IIpH 3aMopa>KHBaHHH.