absolute pore size distributions from...
TRANSCRIPT
ABSOLUTE PORE SIZE DISTRIBUTIONS FROM NMR
G.H. Sørland1,2, K. Djurhuus1, H. C. Widerøe3 , J.R. Lien1, and A. Skauge1
1Centre for Integrated Petroleum Research, University of Bergen, Norway 2Anvendt Teknologi, Harstad, Norway
3Statoil Research Centre, Trondheim, Norway
(received 15 May 2007, accepted 6 June 2007) Abstract NMR measurements on core samples saturated with brine returns valuable information on the porous structure of the rock core. Monitoring a single fluid component in a relaxation experiment reflects the pore size distribution and thus the degree of sorting of the porous rock. The basic assumptions are that the mobility of the component confined in the porous rock is of such a value that a small fraction of the probing molecules experience the surfaces of the pores and that the surface relaxation strength is fairly independent of pore size. Then one may combine diffusion measurements at short observation times returning a value for the average surface to volume ratio with ordinary relaxation time measurements to obtain an absolute pore size distribution instead of the standard T2 distributions or T1-T2 correlated two dimensional distributions. Keywords Pore size distribution, diffusion, relaxation, surface to volume ratio, surface relaxivity
The Open-Access Journal for the Basic Principles of Diffusion Theory, Experiment and Application
© 2007, G.H. Sørland,Diffusion Fundamentals 5 (2007) 4.1 - 4.15 1

1. Introduction Ever since Mitra et al. [1] introduced the short observation time expansion of the observed diffusion coefficient, resolving the surface to volume ratio (S/V) from the surface relaxivity ρ, efforts have been made to measure the true surface to volume ratio of core samples. However, a major obstacle has been the lack of an NMR spectrometer properly dedicated to this purpose, leading to loss of contribution from the smallest pores due to long values of the motional encoding/decoding intervals in the pulsed field gradient sequences. Without dedicated hardware it is not possible to obtain measuring points at short enough observation times for the square root of time expansion to be valid [1,2]. Bearing this in mind a Maran DRX 12 MHz spectrometer was designed for optimized diffusion measurements at short observation times and over relatively large sample volumes. The spectrometer includes a set of gradient coils capable of delivering up to 225 Gauss/cm (2.25 T/m) in applied magnetic field gradient strength. In principle, it is then possible to reduce the encoding/decoding intervals to 1 ms or less by keeping pulsed field gradient duration less than 0.5 ms for each pulse. The gradient coils are mounted on the magnetic pole shoes and not on the probe in order to separate the sample from the coils. The effect from knocking of the gradient coils when running the diffusion experiment is then minimized. In addition we have modified the 11 interval Pulsed Field Gradient Spin Echo sequence and the 13 interval Pulsed Field Gradient Stimulated Echo sequence such that we achieved eddy current dead times down to 400 μs without active shielding or pre-emphasis adjustment. Hence, reliable diffusion measurements on brine saturated samples with motional encoding/decoding interval of as short as 1 ms and with shortest observation times of approximately 1.5 ms, can be performed. With such short encoding/decoding intervals the CPMG sequence can be run with the same inter echo spacing (2t) as in the diffusion experiment. As a result, the T2 distribution derived from a CPMG experiment can be directly converted to an absolute pore size distribution. By optimizing the experimental set up pore sizes (V/S) down to just a few μm may be resolved. The use of the T2 distribution derived from a multiexponential fit of the CPMG attenuation is truly an approximation itself. However, when comparing our method with conventional methods, such as mercury intrusion techniques, we argue that despite its implicit approximations the method reveals new and vital information not extractable by other means. In systems with significant contributions from T2 components of 1 ms or less, the CPMG sequence with t = 1 ms does not represent the complete T2 distribution of the system. To be able to relate the measured surface to volume ratio from the diffusion experiment to a pore size distribution as found from an ordinary CPMG experiment with an arbitrary t value, some assumptions must be made. The most important assumption is that the surface relaxivity ρ does not change significantly as a function of pore size. Of course there are limits where these assumptions are not valid, but in the following we will illustrate that the proposed combination of diffusion and relaxation time NMR experiments truly reveal new and important information as compared to standard conventional techniques for obtaining pore size distributions. When using this approach we are able to resolve pore sizes down to less than 1 μm.
© 2007, G.H. Sørland,Diffusion Fundamentals 5 (2007) 4.1 - 4.15 2

2. Theory Here we recapture the method for obtaining the surface to volume ratio at short observation times. Consider a porous medium as shown in fig. 1, where the cavities are saturated with a single component fluid. VRV
Fig. 1: A two-dimensional slice of a porous system. The black area corresponds to the cavities that can be filled with brine while the gray areas correspond to the sold matrix. The interface between the black and grey area is the surface S while r0 and r correspond to the initial position of a water molecule and the position after a time t (eq. 2). The equation of motion for the diffusing molecules within the cavities may be described by the standard diffusion equation:
GDtG 2
0∇=∂∂
(1)
where the diffusion propagator ),,( 0 tGG rr= , is the conditional probability [3], defined as
),,()0,( 00 tPpG rrr ×= (2)
© 2007, G.H. Sørland,Diffusion Fundamentals 5 (2007) 4.1 - 4.15 3

where is the probability of finding the polarized particle at position at time t = 0, and is the probability of finding this particle at position r at at a later time t (see fig. 1).
)0,( 0rp 0r),,( 0 tP rr
When including the effect from relaxation at the pore walls, the boundary condition can be stated as
0 0r S r SD G Gρ∈ ∈⋅∇ + =n (3) Here n is the outward normal vector on the pore surface S and ρ is the surface relaxivity. The boundary condition merely states that the surface may act as a sink for the coherence of the NMR signal of the particles, while in the physical picture the particles collide with the surface and bounce back into the cavity. As seen by the NMR experiment, the particle, if it relaxes at the surface, vanishes from the porous system. This is why it is difficult to relate the NMR diffusion experiments to physical properties as described by the diffusion equation (eq. 1) without the surface relaxation term in the boundary condition (eq. 3). The existence of a surface relaxation term makes the true physical picture of particles different from the picture of the nuclear magnetic moments of the particles. 2.1 The short observation time expansion of the diffusion coefficient As shown by Mitra et al [1], there is a situation where the surface relaxation term is absent in the solution of the diffusion propagator, i.e. the short time expansion. By assuming piecewise smooth and flat surfaces and that only a small fraction of the particles are sensing the restricting geometries, the restricted diffusion coefficient can be written as
),,(9
41)(0
0
tRVStD
DtD ρϕ
π+−≈ (4)
where D(t) is the time dependent diffusion coefficient, D0 is the unrestricted diffusion coefficient, in bulk fluid, and t is the observation time. The higher order terms in t,
),,( tRρϕ holds the deviation due to finite surface relaxivity and curvature (R) of the surfaces. At the shortest observation times these terms may be neglected such that the deviation from bulk diffusion depends on the surface to volume ratio alone. In a porous system a large span in pore sizes must be assumed. eq. (4) must be expected to be valid also for a heterogeneous system. If ξi is the volume fraction of the pores with surface to volume ratio (S/V)i, eq. (4) can be expressed as
⎟⎟⎠
⎞⎜⎜⎝
⎛⎟⎠⎞
⎜⎝⎛−=⎥
⎦
⎤⎢⎣
⎡⎟⎠⎞
⎜⎝⎛−≈ ∑∑ V
StDVStD
DD
i ii
i
ii 00
0 941
941
ππξξ (5)
© 2007, G.H. Sørland,Diffusion Fundamentals 5 (2007) 4.1 - 4.15 4

Measurements of the early departure from bulk diffusion combined with a linear fit of the experimental data to the square root of time will thus result in a value for the average surface to volume ratio )/( VS . 2.2 Transforming a T2 distribution to a pore size distribution Assuming that the brine is probing the pores within the porous rock, there is a simple relation [4] between T2 values and the pore sizes
ρS
VT ≈2 (6)
This shows that the surface to volume ratio is coupled to the surface relaxivity ρ. We make the assumption that eq. (6) holds for any pore size. With ξi being the volume fraction of pores with surface to volume ratio and corresponding relaxation time TiVS )/( 2i , we may follow Uh and Watson [5] and write
⎟⎠⎞
⎜⎝⎛=⎟
⎠⎞
⎜⎝⎛≈⎟
⎠⎞
⎜⎝⎛= ∑∑∑
=== VS
VS
VS
T i
n
ii
ii
n
ii
i
n
ii ρξρρξξ
1121
1 (7)
Here we have made the basic assumption that the surface relaxivity ρ is independent of pore size. The left hand side of eq. (7) is the harmonic mean 2/1 T of the T2-distribution weighted by the fraction ξi of nuclei with relaxation time T2i and n is the number of subdivisions of pore sizes. This average can be calculated from the T2-distribution obtained in a CPMG measurement where the magnetization attenuation is converted to a T)(tM obs
2 distribution by in a standard way solving an inverse problem using e.g. an Inverse Laplace Transform (ILT) routine [6]. Then the surface relaxivity ρ can be calculated from eq. (7) if the average surface to volume ratio )/( VS is already found from the diffusion experiment as described in section 2.1. Finally, the measured T2-distribution can be transformed into an absolute pore size distribution (V/S) by means of the relationship inherent in eq. (6). One should note that in order to relate the surface to volume ratio from the diffusion experiment in eq. (4) to the surface to volume ratio from the relaxation time experiment (eq. 6), the inter echo spacing of the two NMR experiments should be equal. The presence of position dependent strong internal magnetic field gradients will reduce the number of molecules probing the surface. As seen from the NMR experiment there will not be a constant distribution of nuclear spins within the cavities. To make use of eqs. (6-7) the initial distribution of nuclear spins must therefore be equal. Otherwise they will probe apparently different pore structures. However, the presence of internal magnetic field
© 2007, G.H. Sørland,Diffusion Fundamentals 5 (2007) 4.1 - 4.15 5

gradients will not have an influence on the leading order term in the short observation time expansion. The approximation implied in eq. (4) will be valid for observation times that depend on such parameters as internal magnetic field gradient strength, surface relaxivity and curvature of the surfaces. To sum up, the procedure for deriving absolute distributions is as follows: 1) The average surface to volume ratio )/( VS is found from fitting eq. (5) to a set of
diffusion measurements at short observation times.
2) The average (S/V) can be correlated to the average (1/T2) found from a CPMG experiment. From eq. (7) eq. (6) can then be written as
2
1 ST V
ρ⎛ ⎞ ⎛ ⎞
≈⎜ ⎟ ⎜ ⎟⎝ ⎠ ⎝ ⎠
=> 1
2
1 ST V
ρ−
⎛ ⎞ ⎛ ⎞= ×⎜ ⎟ ⎜ ⎟
⎝ ⎠ ⎝ ⎠ (8)
hence we find the relaxivity ρ which then is assumed to be pore size independent.
3) Under the assumption of pore size independency of the relaxivity the value of ρ can
then be used in eq (6) thus resulting in a linear relation between T2 and the volume to surface ratio which is a measure of the pore size. By multiplying the T2 distribution by the calculated surface relaxivity the distribution is normalized to a pore size distribution in absolute length units.
In a situation where there is a significant fraction of components with T2 of 1 ms or shorter, the CPMG with t of 1 ms will underestimate the contribution from this part in an ordinary T2 distribution. Also, when the coupling to an internal magnetic field gradient G0 adds an extra term to equation as follows
2 2 20
2
1 23
S DGT V
ρ γ τ≈ + (9)
the pore size distribution will be weighted towards a relatively larger contribution from apparently smaller pores. A way to include signal and information that is initially lost or weighted differently with a t-value of 1 ms is simply to assume that the distribution area at 1 ms corresponds to the area from right to left from a CPMG at t = 0.1 ms (see fig. 2). When the distribution is made out of n points and the whole distribution area at 1 ms equals the distribution area at 0.1 ms when summarized from i = j to n (see fig. 2 ), then one may replace the 2/1 T value at t = 1 ms with the one at t = 0.1 ms as follows
© 2007, G.H. Sørland,Diffusion Fundamentals 5 (2007) 4.1 - 4.15 6

⎟⎠⎞
⎜⎝⎛≈⎟⎟
⎠
⎞⎜⎜⎝
⎛=
=VS
T msms
112
1τ
τ
ρ and 0.12 0.1
1n
i ii j ms
ST Vτ
τ
ξ ρ == =
⎛ ⎞≈ ⎜ ⎟⎝ ⎠
∑ ms (10)
=> 2 0.10.1 1
2 1
1
1
n
i ii j ms
ms ms
ms
T
T
ττ
τ
ξρ = =
=
=
=⎛ ⎞⎜ ⎟⎝ ⎠
∑τρ = (11)
Substituting this surface relaxivity for the T2 distribution at t value of 0.1 ms yields a pore size distribution that takes into account the component with T2 values of ~1 ms or shorter.
0
50
100
150
200
250
300
350
0.01 0.1 1 10 100 1000 10000T 2 (ms)
Dis
tribu
tion
inte
nsity
i =ji =1 i =n
τ = 1 ms
τ = 0.1 ms
Fig. 2: T2 distributions of a brine saturated rock core sample at two t values. 3. Experimental The method for determining pore size distributions was applied to two brine saturated samples, one outcrop sandstone sample and one reservoir carbonate sample using a 12 MHz Maran DRX from Oxford Instruments. The operating temperature was 35 °C and the bulk diffusion coefficient of the brine was D0 = 2.9×10⁻⁹ m2/s. Due to finite rise time on the gradient amplifier the shortest duration of the applied gradient pulse was set to d = 0.6 ms. The eddy current settling time was set to δ 1 + δ 2 = 0.4 ms yielding an inter echo spacing
© 2007, G.H. Sørland,Diffusion Fundamentals 5 (2007) 4.1 - 4.15 7
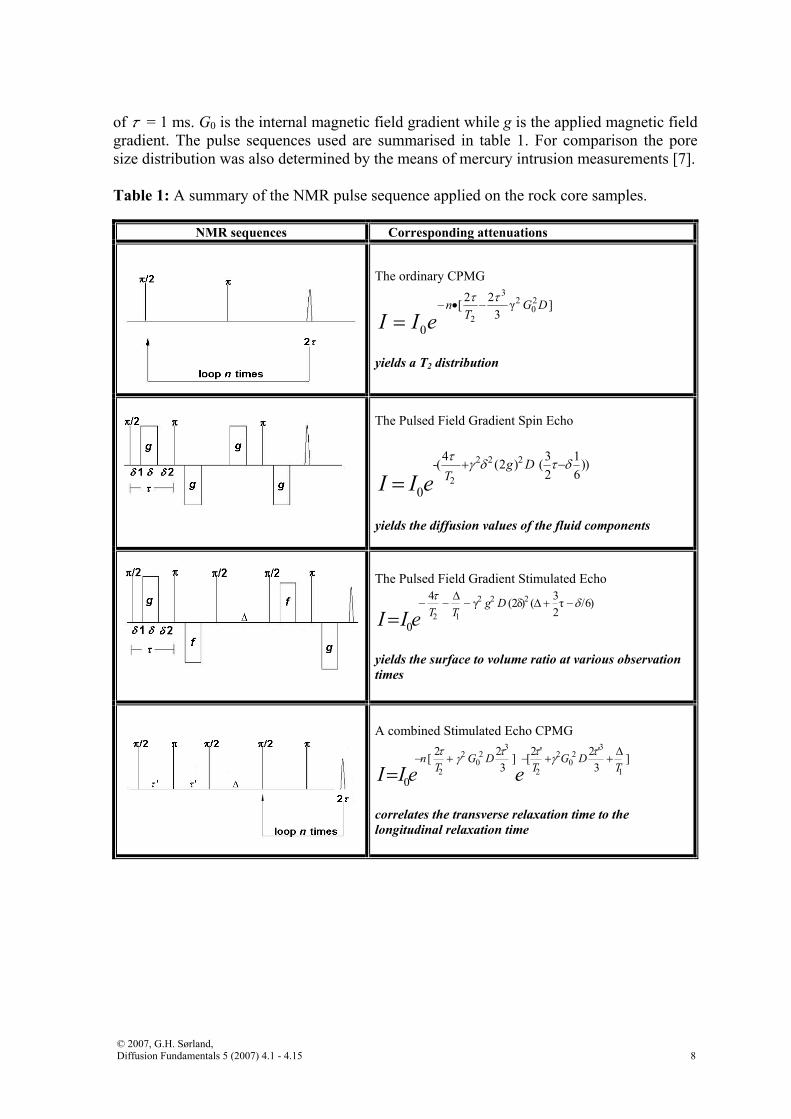
of t = 1 ms. G0 is the internal magnetic field gradient while g is the applied magnetic field gradient. The pulse sequences used are summarised in table 1. For comparison the pore size distribution was also determined by the means of mercury intrusion measurements [7]. Table 1: A summary of the NMR pulse sequence applied on the rock core samples.
NMR sequences Corresponding attenuations
The ordinary CPMG 3
2 20
2
2 2[ γ ]3
0
n GTI I eτ τ
− • −
=D
yields a T2 distribution
The Pulsed Field Gradient Spin Echo
2 2 2
2
4 3-( (2 ) ( ))2 6
0
g DTI I eτ γ δ τ δ+ −
=1
yields the diffusion values of the fluid components
The Pulsed Field Gradient Stimulated Echo 2 2 2
2 1
4 3 γ (2δ) ( τ /6)2
0
g DT TI I eτ δΔ
− − − Δ + −
= yields the surface to volume ratio at various observation times
A combined Stimulated Echo CPMG 3 3
2 2 2 2 0 0
2 2
2 2 2 ' 2 '[ ] [ ]3 3
0
n G D G DT TI I e eτ τ τ τγ γ Δ
− + − + +
= 1T correlates the transverse relaxation time to the longitudinal relaxation time
© 2007, G.H. Sørland,Diffusion Fundamentals 5 (2007) 4.1 - 4.15 8

4. Results and discussion 4.1 Absolute pore size distributions from NMR As shown in the theoretical section we must conduct two NMR experiments to obtain a pore size distribution. Fig. 3 shows the results from the short time diffusion experiment on the two brine saturated samples where the observation time t is varied. Sample A is a reservoir carbonate core while sample B is an outcrop sandstone core. According to eq. (4) these measured diffusion coefficients give a linear attenuation when plotted against the square root of the observation time, and the slope of the attenuation yields the surface to volume ratio, (S/V). From the two attenuations we see that the deviation from bulk diffusion is higher for sample A at equal observation times. As the first order deviation term is dependent on the bulk diffusion and the surface to volume ratio only, we may thus already conclude that sample A on average contains smaller pores than sample B. Even though their pore sizes differ significantly, the extrapolation back to zero observation time yields the bulk diffusion coefficient of water D0 = (2.9 ±0.1)×10-9 m2/s. As shown in the work by Mitra et al [1] a successful determination of the surface to volume ratio relies on the determination of the time dependent diffusion coefficient at observation times where the deviation from bulk diffusion is small. A test to see if the measured values for D(t) are within the limits of the short time approximation as given in eq. (4) is to extrapolate the diffusion coefficient D(t) back to zero observation time. If the calculated diffusion coefficient D(t) at zero observation time deviates significantly from the true bulk diffusion coefficient of the brine, the short time expansion is not valid.
Sample Ay = -9.20E-05x + 2.86E-05
Sample By = -2.79E-05x + 2.98E-05
1.5E-05
1.7E-05
1.9E-05
2.1E-05
2.3E-05
2.5E-05
2.7E-05
2.9E-05
0.00 0.02 0.04 0.06 0.08 0.10 0.12 0.14 0.16
t 1/2 (s1/2)
D (c
m2 /s
)
Fig. 3: Diffusion measurements of two brine saturated core samples at short observation times
© 2007, G.H. Sørland,Diffusion Fundamentals 5 (2007) 4.1 - 4.15 9

0.0
0.2
0.4
0.6
0.8
1.0
1.2
0.001 0.01 0.1 1 10 100
r (μm)
Rel
ativ
e di
strib
utio
n in
tens
ity
Fig. 4: Pore size distributions of sample A from the NMR method (solid line) and from mercury intrusion (dashed line). To get a pore size distribution similar to the one obtained by mercury intrusion measurements we perform an ordinary T2 relaxation time experiment followed by a one dimensional Inverse Laplace Transform (ILT) [5] on the real time attenuation. From the ILT data we find the average of (1/T2) and may then calculate the surface relaxivity in accordance with eq. (6). Substitution of the surface relaxivity then transforms the ILT into a pore size distribution shown in fig. 4 for sample A, where V/S has been multiplied with 2 to correspond to cylindrical pores and thus be comparable to the result from mercury porosimetry. When comparing the pore size distribution derived from the two methods we find the determined mean pore size to be larger from the NMR measurements than from mercury porosimetry. While the distribution curves from mercury porosimetry are fairly constant, i.e. a narrow peak with a left shoulder, the pore size distributions from the NMR measurements varies more in shape from sample to sample. The average pore radius is 6.0 μm from the NMR measurements and 2.0 μm from mercury porosimetry when assuming cylindrical pores. The somewhat higher average radius and broader distribution from NMR can be explained as a result of fundamental differences in the measuring techniques. Mercury porosimetry is based on injecting mercury into the sample at successively higher pressures while recording the volume of fluid injected into the sample at each step. Pore sizes are then calculated through the relation between capillary pressure and pore radius [7], and the volume of each pore size is calculated from the volumes injected. When the connectivity of the medium deviates from ideality, the technique tends to underestimate the larger cavities within the rock as the volumes of larger pores not reached at the correct
© 2007, G.H. Sørland,Diffusion Fundamentals 5 (2007) 4.1 - 4.15 10

corresponding pressure due to e.g. pore throat effects are assigned to smaller pores. The result is often a narrow distribution of pore sizes shifted towards smaller pore sizes. The NMR experiments monitor molecules that are probing different cavities throughout the NMR measurement, resulting in a response depending on the size of the individual cavities. Thus we believe the NMR techniques to be more sensitive to variation in pore size distributions within the rock core as compared to the mercury intrusion technique. Figs. (5-7) show a sample examined with mercury porosimetry (fig. 5), scanning electron microscopy (SEM) (fig. 6) and NMR (fig. 7). The NMR distribution represents the V/S of the pores meaning that no model is imposed on the cavities. If cylindrical pores is assumed the highest peak appears at a radius of approximately 14 μm. If spherical pores is assumed the peak appears at a radius of approximately 20 μm and correspondingly a diameter of approximately 40 μm. The cut off diameter is seen at 60 μm. The SEM picture clearly shows a large fraction of pores with diameter larger than this cut off value, average diameter in two dimensions for the largest pores seems to be approximately 200 μm. This difference can be explained by the fact that the pore space is not made of spherical cavities with smooth surfaces. The model of spherical pores with smooth surfaces yields the smallest sphere radius as seen by the NMR method. The rough surfaces sensed by the NMR measurements are much larger in area than the surface in the smooth surface model
3
NMR SPHERE MODEL
S SV V −
⎛ ⎞ ⎛ ⎞>⎜ ⎟ ⎜ ⎟⎝ ⎠ ⎝ ⎠ r
= (12)
Thus when imposing the model, the larger surface areas yields smaller radius than the actual dimension of the pores in the real system. This explains why the NMR cut off diameter with the spherical model is less than the diameter of the largest pores. Another feature is found in the T1-(V/S) correlated distribution. Such a plot shows that there is additional information at smaller values of V/S. One fraction is found at smaller T1 which is equivalent to T1/T2 ratio close to 1, while one fraction appears at larger T1. This is equivalent to T1/T2 ratio larger than 1. In clay material we would expect to find small pores and a T1/T2 ratio close to 1 [9]. In surface layers, channels and areas where internal gradients do not change polarity over the distance the molecules are diffusing during the inter echo spacing in the NMR experiment, we would expect a T1/T2 ratio that is larger than 1. Thus we may distinguish between brine found at small V/S values with respect to different locations within the porous medium. When there are two fractions at the same V/S, the one with shorter T1 is located in clay like materiel. This is where the effect from internal gradients is negligible as its polarity and size changes over the distance the clay bound brine is diffusing during the inter echo spacing. The fraction with higher T1, is then located where the internal gradients do not change polarity and strength over the same distance.
© 2007, G.H. Sørland,Diffusion Fundamentals 5 (2007) 4.1 - 4.15 11

0.0
0.5
1.0
1.5
2.0
0.001 0.01 0.1 1 10 100r (μm)
d Sw
/ d
Log
Pore
thro
at ra
d.
Fig. 5: Pore throat distribution from a sample using mercury porosimetry 1600 µm Fig. 6: SEM picture of sample in fig. 5, recorded by Tony Boassen at Statoil Research Centre Trondheim (Norway).
© 2007, G.H. Sørland,Diffusion Fundamentals 5 (2007) 4.1 - 4.15 12

Fig. 7: T1-V/S correlated distribution from sample in fig. 5. 4.2 On the approximations in the pore size (V/S) distribution model To be able to transfer the NMR measurements one must make some approximations. The literature makes use of three length scales, the diffusion length, the dephasing length and the pore length [10]. In the short time expansion developed by Mitra et al. [1] it was assumed piecewise smooth surfaces that only a small fraction of the probing molecules experienced, i.e. the diffusion length is much less than the pore length. Thus one could apply the square root of time attenuation of the diffusion coefficient to get the surface to volume ratio. Of course, in systems mainly consisting of small pores, as in clays or zeolites, this model fails. If it is apparent that the measured diffusion coefficient is attenuated significantly at the shortest observation time possible (~1 ms), the S/V ratio cannot be found accurately. To measure the S/V for such a system by NMR another and larger probing molecule with lower mobility as compared to the brine should be used. To make use of the expression that relates the T2 distribution to the surface relaxivity and the surface to volume ratio, one assumes to be in the fast diffusion limit, i.e. diffusion length larger than pore length and/or dephasing length is smaller than pore length. In the CPMG attenuation with a value for τ less than 1 ms, the dephasing length is usually less than the pore length. In the early part of the CPMG, the diffusion length is clearly not larger than the pore length. This may lead to an overestimate of the V/S, as a significant part of the probing molecules have not sensed the restriction yet and therefore contribute as a bulk component while at larger echo numbers, the assumption is fulfilled. If the life time of the magnetisation is long there will at even higher echo numbers be an exchange between different pore classes. Under this effect the pore size distribution will
© 2007, G.H. Sørland,Diffusion Fundamentals 5 (2007) 4.1 - 4.15 13
be smeared out thus leading to broader peaks in the pore size distribution. Latour et al. [11] performed ILT on CPMG attenuations of water-saturated sandstones at different temperatures, and found little effect on the distribution due to more exchange between regions because of higher mobility at higher temperature. Thus they were in the fast diffusion limit. In general, the use of eq. (6) should be done with care as it is indeed not fulfilled for a CPMG attenuation. Still it is being used extensively in literature because it does probe the heterogeneity of the porous samples. And when we compare our results with conventional techniques, we do see that the NMR method probes the whole pore space while methods such as mercury porosimetry probe the pore throats more or less independently of the pore cavities. Thus it will not be as sensitive to bi or tri-modal structures as our method, which is neatly documented in fig. 5 and fig. 7. From an experimental point of view, it is also important that the diffusion coefficient extracted from NMR pulse sequence truly reflects the mean squared displacement. As the logarithm of attenuation from a pulsed field gradient experiment within a heterogeneous system is not necessarily linear with respect to the square of the gradient strength, one must fit the diffusion coefficient within the regime where the second cumulant approximation is valid [12]. If the gradient pulses are long, one should also consider taking into account restricted diffusion during the duration of the gradient pulses [13-14]. The results presented here have not taken into account restricted diffusion during the gradient pulses. This is evidently not correct for the clay bound brine, but the contribution from this part when determining the average S/V is small both due to short relaxation time and much slower diffusivity [15]. It is when we make use of the CPMG attenuation with τ = 100 μs the clay bound brine is included in the V/S distribution. Inclusion of restricted diffusion during the gradient pulses would lead to a smaller and more correct S/V ratio, i.e. a small shift of the V/S distribution towards higher values. 5. Conclusion We have shown that the NMR technique yields a method for absolute determination of V/S distributions on a limited number of rock core samples. Application of simple models for the pores, as smooth spherical pores, may transform the V/S distribution to a pore size distribution. Such simple models may underestimate the true size of the pores, as the measured surface is larger than the surface in the spherical model. References [1] P. Mitra, P.N. Sen, and L.M. Schwartz, Phys. Rev. B; 47 (1993) 8565-74 [2] M.D. Hürlimann, K.G. Helmer, L.L. Latour, and C.H. Sotak, J. Mag. Res. A 111 (1994), 169-178 [3] J. Kärger and D.M. Ruthven, Diffusion in Zeolites, John Wiley and Sons inc., (1992)
© 2007, G.H. Sørland,Diffusion Fundamentals 5 (2007) 4.1 - 4.15 14

[4] M.H. Cohen, K.S. Mendelson, J. Appl. Phys. 53 (2) (1982) [5] S.W. Provencher Comput. Phys. Commun. 27,(1982), 229–242. [6] J. Uh, and A.T. Watson, Ind. Eng. Chem. Res. 43 (2004), 3026-3032 [7] H.L. Ritter. and L.C. Drake, Ind. Eng. Chem.; 17 (1945): 782-786 [8] A. Matteson, J.P. Tomanic, M.M. Herron, D.F. Allen and W.E. Kenyon, SPE Reservoir Eval. & Eng. 3 (5), (2000) [9] R.L Kleinberg, S.A. Farooqui, and M.A. Horsfield, J. Colloid and Interface Science 158 (1993), 195-198 [10] M.D. Hürlimann, J. Mag. Res.131 (1998), 232-240 [11] L.L Latour, R.L Kleinberg, and A. Sezginer, J. Colloid and Interface Science 150, No2 (1992) [12] J. Stepišnik, Physica B 270 (1990) 110-117 [13] P.P. Mitra and B.I. Halperin, J. Mag. Res. A 113 (1995), 94-101 [14] E.J. Fordham, P.P. Mitra, and L.L Latour, J. Mag. Res. A 121 (1996), 1878-192 [15] Y. Nakashima, American Mineralogist, Vol. 86 (2001), 132-138
© 2007, G.H. Sørland,Diffusion Fundamentals 5 (2007) 4.1 - 4.15 15