pollutant concentration in runoff at mcmurdo station ... · pollutant concentration in runoff at...
TRANSCRIPT
ERD
C/CR
REL
TR-1
4-15
Engineering for Polar Operations, Logistics, and Research (EPOLAR)
Pollutant Concentration in Runoff at McMurdo Station, Antarctica
Cold
Reg
ions
Res
earc
h
and
Engi
neer
ing
Labo
rato
ry
Rosa T. Affleck, Meredith Carr, Laura Elliot, Corey Chan, and Margaret Knuth
August 2014
Approved for public release; distribution is unlimited.

The U.S. Army Engineer Research and Development Center (ERDC) solves the nation’s toughest engineering and environmental challenges. ERDC develops innovative solutions in civil and military engineering, geospatial sciences, water resources, and environmental sciences for the Army, the Department of Defense, civilian agencies, and our nation’s public good. Find out more at www.erdc.usace.army.mil.
To search for other technical reports published by ERDC, visit the ERDC online library at http://acwc.sdp.sirsi.net/client/default.
Engineering for Polar Operations, Logistics, and Research (EPOLAR)
ERDC/CRREL TR-14-15 August 2014
Pollutant Concentration in Runoff at McMurdo Station, Antarctica
Rosa Affleck and Meredith Carr Cold Regions Research and Engineering Laboratory (CRREL) U.S. Army Engineer Research and Development Center 72 Lyme Road Hanover, NH 03755-1290
Laura Elliot and Corey Chan Lockheed Martin, Antarctic Support Contract 7400 S. Tucson Way Centennial, CO 08112
Margaret Knuth National Science Foundation Division of Polar Programs, Antarctic Infrastructure and Logistics 4201 Wilson Boulevard, Arlington, VA 22230.
Final Report
Approved for public release; distribution is unlimited.
Prepared for National Science Foundation, Division of Polar Programs Antarctic Infrastructure and Logistics Arlington, VA 22230
Under Engineering for Polar Operations, Logistics, and Research (EPOLAR) EP-ANT-11-04, “McMurdo Drainage & Erosion Study: 2010–2011 Season”

ERDC/CRREL TR-14-15 ii
Abstract
Accidental spills and chemical contamination from leaking fuel and mate-rials (lubricants, paints, etc.) at McMurdo Station have caused environ-mental concerns, and snowmelt runoff may tend to transport these con-taminants. Therefore, the objective of our study was to quantify the pollutant types and levels in the runoff throughout a season. To under-stand what types of analytes were present and being carried by the runoff into Winter Quarters Bay, we collected water samples from the runoff at major flow arteries at McMurdo Station six times during various flow events in austral summer 2010–2011. Pollutants analyzed included heavy metals, polycyclic aromatic hydrocarbons (PAHs), total hydrocarbons, and volatile organic compounds. Results showed that concentrations for heavy metals were elevated during the first flush when flow began in receiving channels where significant operational or day-to-day activities occurred. In other places, elevated values occurred during the first significant flow; and the concentrations for selected PAHs were elevated during the first peak flow. Given that the snowmelt runoff contained significant concen-tration of heavy metals and certain PAHs, some of which were above the thresholds for chronic limits for aquatic water quality in saltwater, preven-tion and mitigation are crucial for reducing contamination at McMurdo Station.

ERDC/CRREL TR-14-15 iii
Contents Abstract .......................................................................................................................................................... ii
Illustrations .................................................................................................................................................... iv
Preface ............................................................................................................................................................. v
Acronyms and Abbreviations ...................................................................................................................... vi
1 Introduction ............................................................................................................................................ 1
2 Background ............................................................................................................................................ 2
3 Sample Collection and Test Methods ............................................................................................... 7 3.1 Timing of sampling.......................................................................................................... 7 3.2 Test methods................................................................................................................... 8
4 Results .................................................................................................................................................. 10 4.1 Detection limit ............................................................................................................... 10 4.2 Equivalent mass flow rate ............................................................................................ 11 4.3 Relationship to aquatic life standards ......................................................................... 14
5 Summary and Conclusion ................................................................................................................. 19
6 Recommendations .............................................................................................................................. 21
References ................................................................................................................................................... 22
Appendix A: Procedures for Water Sample Collection during 2010–11 Study ............................. 24
Appendix B: Summary of Test Methods and Standards Used and Results of Runoff Water Samples .................................................................................................................................... 27
Report Documentation Page

ERDC/CRREL TR-14-15 iv
Illustrations
Figures
1 Map of McMurdo Station showing the watershed boundary (dashed line) and ice field contributing to the snowmelt. The watershed covers an area of approximately 5 km2 (Affleck et al. 2012a) ................................................................................ 3
2 McMurdo Station watershed and sub-basin boundaries (Affleck et al. 2012a) ................... 4 3 Along the Gasoline Alley drainage channel adjacent to the fuelling station (photo
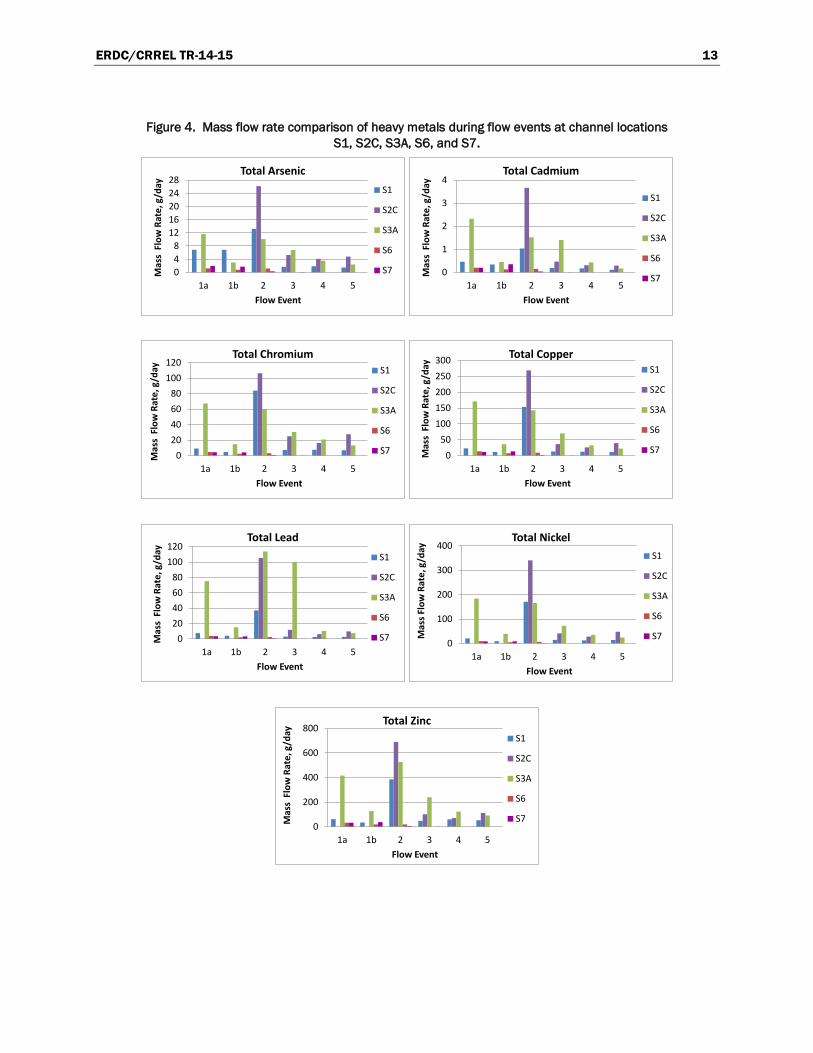
by Lynette Barna, CRREL, 19 December 2010) ......................................................................... 5 4 Mass flow rate comparison of heavy metals during flow events at channel
locations S1, S2C, S3A, S6, and S7 .......................................................................................... 13 5 Mass flow rates of selected polycyclic aromatic hydrocarbons that were above
detection limits during flow events at channel locations S1, S2B, S2C, S3A, and S6 ................................................................................................................................................... 14
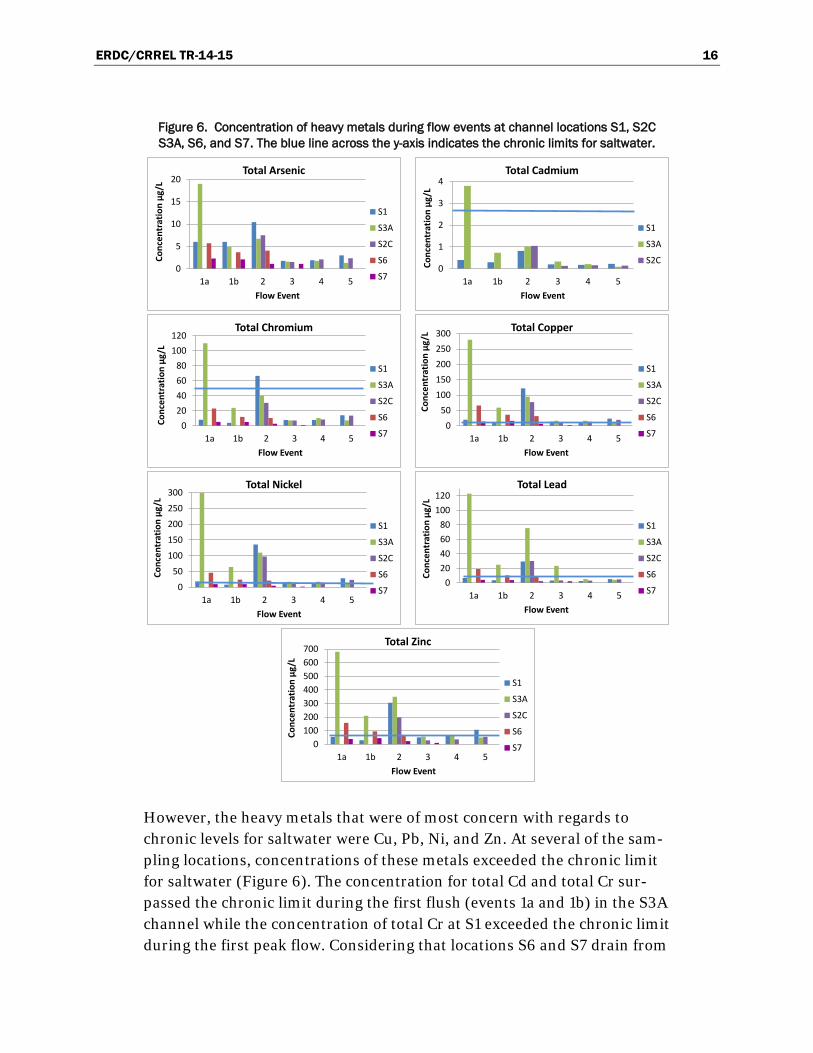
6 Concentration of heavy metals during flow events at channel locations S1, S2C S3A, S6, and S7. The blue line across the y-axis indicates the chronic limits for saltwater ........................................................................................................................................ 16
7 Concentration of selected PAHs during flow events at channel locations S1, S2C, S3A, and S6 .................................................................................................................................. 17
Tables
1 Sampling locations and descriptions ........................................................................................... 7 2 Sampling time and dates for the corresponding flow events ................................................... 8 3 Summary of test methods used and their detection limits ...................................................... 9 4 Pollutant outcome with respect to default detection limits based on Table 3 ..................... 10 5 The corresponding flow rate at each location during the sampling events .......................... 11 6 Water quality limits on pollutants for aquatic life, published by various agencies.
The colors correspond to the limit lines in Figure 6 ................................................................. 15

ERDC/CRREL TR-14-15 v
Preface
This study was conducted for the National Science Foundation (NSF), Di-vision of Polar Programs (PLR), under Engineering for Polar Operations, Logistics, and Research (EPOLAR) EP-ANT-11-04, “McMurdo Drainage & Erosion Study: 2010–11 Season.” The technical monitor was George L. Blaisdell, Chief Program Manager, NSF-PLR, U.S. Antarctic Program.
This report was prepared by Rosa Affleck (Force Projection and Sustain-ment Branch, Dr. Edel Cortez, Chief) and Dr. Meredith Carr (Remote Sensing/GIS and Water Resources Branch, Timothy Pangburn, Chief), U.S. Army Engineer Research and Development Center (ERDC), Cold Re-gions Research and Engineering Laboratory (CRREL); Laura Elliot and Corey Chan, Lockheed Martin, Antarctic Support Contract; and Margaret Knuth, National Science Foundation, Division of Polar Programs, Antarc-tic Infrastructure and Logistics.
At the time of publication, Janet Hardy was the program manager for En-gineering for Polar Operations, Logistics, and Research (EPOLAR) Antarc-tica; Dr. Justin Berman was Chief of the Research and Engineering Divi-sion. The Deputy Director of ERDC-CRREL was Dr. Lance Hansen, and the Director was Dr. Robert Davis.
The authors are grateful for the assistance provided by shipping, receiving, supply, and logistics support at McMurdo Station during the field work.
The authors also thank the following CRREL staff for their contributions: Renee Melendy for superb office administrative and logistical support and Joni Quimby for shipping and receiving the equipment and supplies used during the field work.
Emily Moynihan provided our editing support. Technical reviews were provided by Louise Parker (CRREL) and George Blaisdell (National Sci-ence Foundation, Division of Polar Programs, Antarctic Infrastructure and Logistics).
The Commander of ERDC is COL Jeffrey R. Eckstein, and the Director of ERDC is Dr. Jeffery P. Holland.

ERDC/CRREL TR-14-15 vi
Acronyms and Abbreviations
APHA American Public Health Association
As Arsenic
ASCE American Society of Civil Engineers
BTEX Benzene, Toluene, Ethylbenzene, and Total Xylenes
CCC Criterion Continuous Concentration
Cd Cadmium
CMC Criteria Maximum Concentration
CPL Contract Laboratory Program
Co Cobalt
Cr Chromium
Cu Copper
CRREL Cold Regions Research and Engineering Laboratory
DL Detection Limit
DNF Do Not Freeze
EPOLAR Engineering for Polar Operations, Logistics and Research
ERDC U.S. Army Engineer Research and Development Center
Fe Iron
GC-FID Gas Chromatography–Flame Ionization Detector
GC-MS Gas Chromatography–Mass Spectrometry
GC-MS FS Gas Chromatography–Mass Spectrometry with Fused Silica
GC-MS-SIM Gas Chromatography–Mass Spectrometry with Selective Ion Monitoring
ERDC/CRREL TR-14-15 vii
ICP-MS Inductively Coupled Plasma–Mass Spectrometry
Mn Manganese
Ni Nickel
NRDC National Resources Defense Council
PAHs Polycyclic Aromatic Hydrocarbons
Pb Lead
RPSC Raytheon Polar Services Company
SPE Solid Phase Extraction
TPHs Total Petroleum Hydrocarbons
USEPA U.S. Environmental Protection Agency
WQB Winter Quarters Bay
VOC Volatile Organic Compound
Zn Zinc

ERDC/CRREL TR-14-15 viii

ERDC/CRREL TR-14-15 1
1 Introduction
McMurdo Station is a research facility and the logistics hub of the United States Antarctic Program, located on an outcrop of barren volcanic rock on the southern tip of Ross Island, Antarctica. Science support activities at the Station have created some degree of landscape or terrain disturbance and environmental alteration (Klein et al. 2008; Kennicutt et al. 2010). Significant landscape disturbance occurred in the late 1950s and contin-ued in the 1970s as construction activities accommodated expansion. Ad-ditionally, accidental spills and chemical contamination from leaking fuel and materials (lubricants, paints, etc.) brought to and used at the Station have caused environmental alterations. Furthermore, the contaminants may have a tendency to be transported in the runoff during the snowmelt period.
Runoff from the watershed is mostly from snowmelt as liquid precipitation is rare at McMurdo. During the austral summer of 2010–11, the U.S. Army Cold Regions Research and Engineering Laboratory (CRREL) measured runoff and concentration of pollutants. For the runoff measurements, analyses, and results, see Affleck et al. (2012a, 2014).
The objective of our study was to quantify the pollutant types and levels in the runoff throughout a season. We hypothesized that pollutant levels are likely to be elevated when runoff first begins and will taper as the season progresses. Therefore, this report quantifies the variations in the concen-tration of pollutants measured during the peak first flush and the subse-quent peak runoff events throughout the 2010–11 austral summer season at McMurdo Station. A first flush event is when summer flow starts to trickle with a measureable volume in the channel. A first peak flow nor-mally occurs in early or mid-December, and then subsequent significant flow typically occurs throughout the summer season. Thus we focused our runoff water sampling during the first flush event, the first peak flow, and subsequent high or peak flows throughout the season.

ERDC/CRREL TR-14-15 2
2 Background
Runoff in summer is driven primarily by the melting of snow and glacier ice (Affleck et al. 2012a, 2012b). The major flow paths at McMurdo Station are typically filled with snow and ice in the winter months. As the austral summer approaches, major flow arteries are manually cleared in anticipa-tion of the ephemeral runoff during these summer months. Snowmelt runoff passes through McMurdo via a system of drainage ditches, gullies, and culverts. The major flow paths are well-defined, earthen ditches that cross under the existing roads via culverts (Affleck et al. 2012a). Most of these drainage channels have very steep sides or embankment slopes and steep in-channel gradients. Ultimately, the snowmelt runoff discharges in-to Winter Quarters Bay (WQB) and McMurdo Sound at several points (Figure 1).
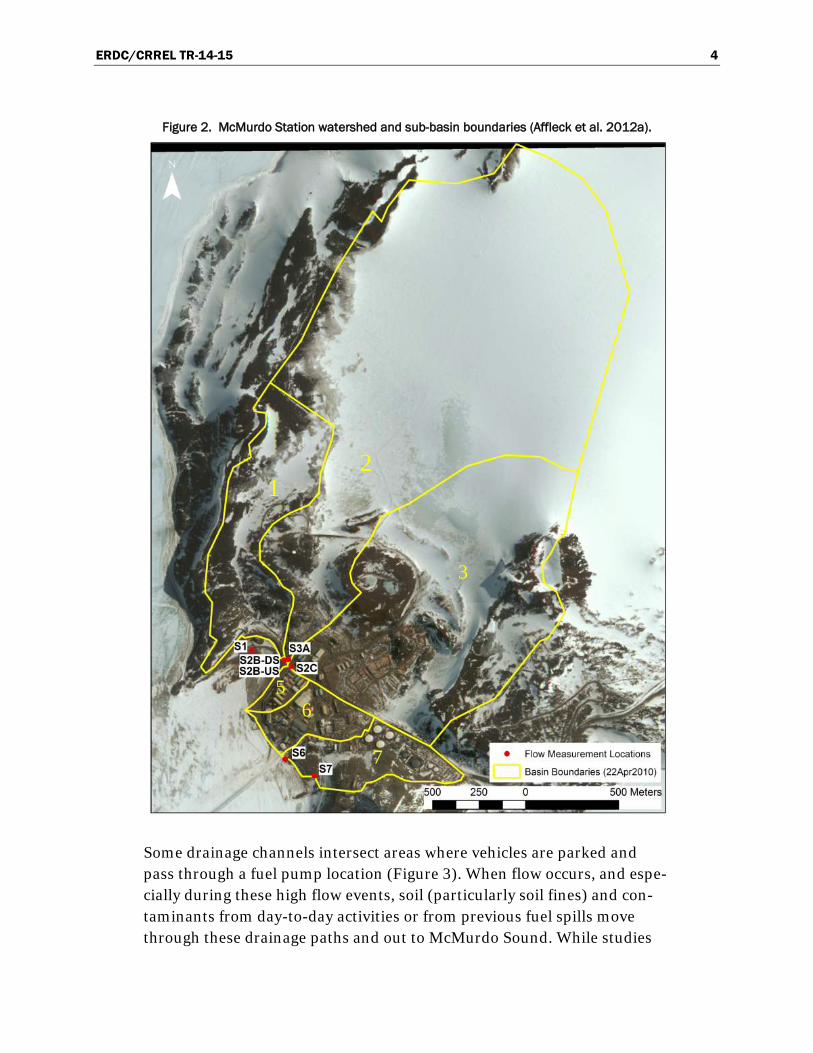
The McMurdo Station watershed is one of the southernmost basins that annually experiences active water flow (Figure 2). The watershed is divid-ed into six basins. Three major sub-basins (1, 2, and 3) are located north of the Station and are largely covered with a perennial snow and glacial cov-er. The other three sub-basins (5, 6, and 7) are relatively small. Sub-basin 1 drains the area from the west along Hut Point Ridge and Arrival Heights, then along the road and down to the pier and Hut Point. Sub-basin 2 has the largest area and encompasses the majority of the snowfield and the depression above Gasoline Alley. Sub-basin 3 includes the area north of the Main Road, then adjacent to Crater Hill area, loops around portion of the snowfield, and continues on the east at the T-Site area. Snowmelt run-off from sub-basins 2 and 3 merges downstream into WQB. Sub-basin 5 drains the area around the dorm, along the road towards the bay and be-low the Water Treatment Plant. Sub-basin 6 is composed of the area south of the dorms and Main Road, along the road to the Chalet, and down to the road along the bay. Sub-basin 7 is the area south of the Fuel Tanks, around Observation Hill, and below the Helo Pad.

ERDC/CRREL TR-14-15 3
Figure 1. Map of McMurdo Station showing the watershed boundary (dashed line) and ice field contributing to the snowmelt. The watershed covers an area of approximately 5 km2
(Affleck et al. 2012a).
ERDC/CRREL TR-14-15 4
Figure 2. McMurdo Station watershed and sub-basin boundaries (Affleck et al. 2012a).
Some drainage channels intersect areas where vehicles are parked and pass through a fuel pump location (Figure 3). When flow occurs, and espe-cially during these high flow events, soil (particularly soil fines) and con-taminants from day-to-day activities or from previous fuel spills move through these drainage paths and out to McMurdo Sound. While studies
2 1
6
7
3
5

ERDC/CRREL TR-14-15 5
done by Kennicutt et al. (2010) and Klein et al. (2008, 2012) have done much to characterize the impacts of human activity at McMurdo Station, they have not quantified the potential movement of pollutants through these drainage paths and flow events throughout a season.
Figure 3. Along the Gasoline Alley drainage channel adjacent to the fuelling station (photo by Lynette Barna, CRREL, 19 December 2010).
The first study to examine how much contamination from fuel spills was being transported by snowmelt runoff in streams around McMurdo Sta-tion was done during the 1995–96 and 1996–97 austral summers (Antarc-tic Support Associates 1997a, 1997b) and showed that significant levels of fuel-related contaminants were picked up by the runoff along the chan-nels, including along Gasoline Alley, by the Helo Pad, and along the Main Road (Figure 1). Although their finding was not from intensive sampling, they indicated that snowmelt runoff transported metals, including arsenic (As), iron (Fe), lead (Pb), manganese (Mn), and zinc (Zn). These metals are naturally leached from soils and, to some degree, from hydrocarbons and other manufactured products. Gasoline, grease, and motor oils are known sources of heavy metals, such as cadmium (Cd), cobalt (Co), copper (Cu), Fe, Mn, nickel (Ni), Pb, and Zn (NRDC 2001). Heavy metals can oc-cur naturally in soils and leach into ground and surface waters but are usually not at toxic levels.
ERDC/CRREL TR-14-15 6
Kennicutt et al. (2010) and Klein et al. (2008, 2012) collected and ana-lyzed several hundred soil samples and over nine years monitored the ex-tent of the environmental impact of the various contaminants. These con-taminants were from localized spills and were primarily in the operational active areas at the Station. They found hydrocarbons levels in soils were high in areas where accidental spills occurred and in areas or pads where operational or from day-to-day activities (i.e., vehicle parking, heavy equipment loading and unloading, fueling loading, etc.) were taking place. From 1992 to 2004, up to 10,000 L of localized fuel spills occurred in sub-basins 2 and 3; and 25,000 L of fuel was spilled in sub-basins 6 and 7. Their study found that the total hydrocarbon concentrations in surficial soils at McMurdo Station were dispersed in patches with ranges from 30 to 100 ppm; roads, parking areas, refueling stations, recent fuel spills, the Helo Pad, and the vehicle maintenance facility had the highest concentra-tion of total hydrocarbon (Kennicutt et al. 2010; Klein et al. 2008, 2012).
Crocket (1997) documented the mean background levels of metals present in gray and red soils at McMurdo Station. Both soils’ background levels for total metals varied although not very significantly. For example, the gray soil reported to have 5.8 ppm, while the red soil reported to have 5.0 ppm. While Kennicutt et al. (2010) studied heavy metals in contaminated soils, their findings indicated that certain metal concentrations in soil were near background levels and Pb was found to be elevated. Also, they indicated that contamination levels were contained to the areas where spills oc-curred and that there had been limited redistribution of the contaminants due to limited runoff events. However, Affleck et al. (2012a) found that lateral flows from ice melting in the subsurface (i.e., the active layer) oc-curred above and along the impermeable frozen soil layer. Thus, contami-nants could potentially migrate into the permeable thawed ground and in-to the drainage channels during runoff.

ERDC/CRREL TR-14-15 7
3 Sample Collection and Test Methods
3.1 Timing of sampling
Timing for water samples collection was essential to the study. Previous snowmelt runoff studies indicated that first flush runoff events occurred around the first week in December. However, the exact timing of these events varied from year to year (Affleck et al. 2012a, 2014). We took sever-al sampling collections at various flow occurrences, including the first flush, first peak, and subsequent peak flow. We defined the first flush event as the first flow incident of the season that had a measureable vol-ume in the channel that could be collected without touching the lip of the wide-mouthed, 1 L glass bottle to the bottom of the ditch. We should note that we expected the flow to peak between 3 pm and 9 pm (Affleck et al. 2012a) under normal conditions. During the first flush and first peak run-off events, we collected two duplicate sample sets at each sample loca-tion—one in the morning, prior to the peak flow event, and the other as close to the peak flow event as feasible. We collected the subsequent peak flow water samples to capture contaminant loads as the season pro-gressed. Table 1 describes the water sample locations. We took samples at S1 and S3A at each flow event (Table 2) while, in other locations (i.e., S5 and S6), we took water samples during the first flush only, due to not enough water in the channel. At S2C, we took samples except for during the first flush; this was because the channel still had some ice and did not have enough water to take samples. Appendix A describes our procedures for bottle labeling and handling of water samples.
Table 1. Sampling locations and descriptions.
Locations Description S1 Downstream of the culvert by the pier, representing the runoff for sub-basin 1 S2B Channel along Main Road merging with Gasoline Alley flow, representing the runoff
for sub-basins 2 and 3 S2C Downstream channel along Gasoline Alley, representing the runoff for sub-basin 2 S3A Channel on Main Road before crossing Gasoline Alley, representing the runoff for
sub-basin 3 S5 Flow path developed during the season for sub-basin 5 S6 Above the ditch parallel to the Main Road and an area downstream for sub-basin 6 S7 Downstream of the culvert, Helo Pad, and fuel storage for sub-basin 7

ERDC/CRREL TR-14-15 8
Table 2. Sampling time and dates for the corresponding flow events.
Identifier Flow Events Locations Actual Sampling Dates, Time 1a First Flush S1, S2B, S3A, S5, S6, S7 09 Dec. 2010, 4:30–7:40 pm 1b First Flush Peak S1, S2B, S3A, S5, S6, S7 09 Dec. 2010, 8:05–9:10 pm 2 First Peak S1, S2C, S3A, S7 14 Dec. 2010, 7:05–8:40 pm 3 Subsequent Peak S1, S2C, S3A, S7 29 Dec. 2010, 7:15–8:50 pm 4 Subsequent Peak S1, S2B, S2C, S3A 17 Jan. 2011, 8:07–9:25 pm 5 Subsequent Peak S1, S2B, S2C, S3A 21 Jan. 2011, 8:00–9:15 pm
3.2 Test methods
We sent to Hill Laboratories (an environment laboratory in New Zealand) for testing several water samples taken throughout the 2010–11 season. The actual sample dates were 9, 14, and 29 December and 17 and 21 Janu-ary (Table 2). We collected a total of 70 surface water samples to measure the following:
• Heavy metals, including As, Cd, chromium (Cr), Co, Ni, Pb, and Zn • Polycyclic aromatic hydrocarbons (PAHs), including acenaphthene,
acenaphthylene, anthracene, benzos, chrysene, dibenzo flouranthene, flourene, naphthalene, phenanthrene, pyrene
• Total petroleum hydrocarbons (TPHs) (including C10–C14, C15–C36, and C6–C38) and volatile organic compounds (VOCs), including halo-genated aliphatics and monoaromatic hydrocarbons (such as benzene, toluene, ethylbenzene, and total xylenes [i.e., BTEX] compounds).
We shipped to an accredited environmental laboratory, Hill Laboratories in New Zealand, these samples according to sampling and packaging standards and guidance. Hill Laboratories used standard methods (de-scribed in this section and summarized in Table 3) to test the samples for the heavy metals, PAHs, TPHs, and VOCs. Samples collected for the heavy metals were tested by Hill Laboratories using inductively coupled plasma–mass spectrometry (ICP-MS) according to U.S. Environmental Protection Agency (USEPA) and the American Public Health Association (APHA) 3125 B (USEPA 1992a). Hill Laboratories tested the PAH samples by using solid phase extraction (SPE) on gas chromatography–mass spectrometry with selective ion monitoring (GC-MS-SIM) instruments and by using the USEPA contract laboratory program (CPL) method. Hill Laboratories ex-tracted and tested samples for TPH by using primarily gas chromatog-

ERDC/CRREL TR-14-15 9
raphy–flame ionization detector (GC-FID) analysis, USEPA method 8015C (USEPA 2007). The lab analyzed VOC samples by using a purge and trap gas chromatography–mass spectrometry with Fused Silica (GC-MS FS) test based on USEPA method 524.2 (USEPA 1992b). Each standard meth-od used to detect the elements and compounds has a default detection lim-it (Table 3). Appendix B compiles the methods described in this section and the corresponding detection limits for each test.
Table 3. Summary of test methods used and their detection limits.
Test Types Tests Methods
Default Detection
Limits, µg/L or PPB
(g/m3)
Heavy Metals Total Arsenic Total Lead Total Zinc
Nitric acid digestion, ICP-MS, APHA 3125 B 21st ed., USEPA 200.8 (USEPA 1992a)
1.10 (0.0011)
Total Cadmium 0.05 (5.3E−5) Total Chromium Total Copper Total Nickel
0.53 (5.3E−4)
Polycyclic Aromatic Hydrocarbons
Solid Phase Extraction (SPE) if required, GC-MS-SIM analysis, USEPA CPL method (modified)
0.005 (5.0E6)
Total Petroleum Hydrocarbons
C6–C9 Solvent extraction, SPE cleanup, GC-MS analysis (USEPA 2007)
60 (0.060)
C10–C14 Separating funnel extraction, GC-FID analysis, USEPA 8015C (USEPA 2007)
40 (0.040) C15–C36 10 (0.01)
Total hydrocarbons (C6–C36)
Separating funnel extraction, GC-FID and purge and trap GC-MS analysis for C6–C9 carbon band (USEPA 2007)
200 (0.2)
Volatile Organic Compounds
Listed in Appendix B
Purge and trap GC-MS FS analysis, USEPA Method 524.2 (USEPA 1992b)
Listed in Appendix B

ERDC/CRREL TR-14-15 10
4 Results
4.1 Detection limit
In this analysis, we used the detection limits (DLs) for each of the test methods to determine which contaminants were present in the water sam-ples (Table 4). We found that heavy metals were above the DLs throughout the sampling events and were the most detected pollutants in most chan-nels. Most of the PAHs were below the DL, with the exception of fluoranthene, fluorine, naphthalene, phenanthrene, and Pyrene. This was true for all of the water collected from the S2B, S2C, and S3A channels. We detected TPHs to be above the DL during the first flush and first peak flow events. In contrast, VOCs were all below the detection limit throughout the sampling events. Appendix C presents detailed results for those analytes that exceeded their respective detection level. Values listed with less than the threshold readings (i.e., the < sign with numbers) were considered be-low the DL).
Table 4. Pollutant outcome with respect to default detection limits based on Table 3.
Tests Total heavy metals Polycyclic Aromatic Hydrocarbons
Total Petroleum Hydrocarbons
Volatile Organic Compounds Locations
S1 Above DL except for As and Cd during the first flush
A Below DL Below DL
S2B Above DL B C Below DL S2C Above DL B D Below DL S3A Above DL B C Below DL S6 Above DL A C Below DL S7 Above DL except for
As during events 2 and 3
Below DL Below DL Below DL
A—Most compounds tested were below the DL except the pyrene compound was above the DL during the first flush.
B—Most compounds tested were below the DL while fluoranthene, fluorene, naphthalene, phenanthrene, and pyrene compounds were above the DL.
C—At the DL during the first flush for C10–C14 and C10–C14 contaminants.
D—At the DL during the first peak flow for C10–C14 and C10–C14 contaminants.

ERDC/CRREL TR-14-15 11
4.2 Equivalent mass flow rate
In conjunction with the pollutant sampling, we measured the discharge from snowmelt for each location during the austral summer of 2010–11, which is documented in Affleck et al (2014). The typical flow in channels at McMurdo Station fluctuates daily and throughout the entire summer sea-son (Affleck et al. 2012a, 2014). As shown in Figure 2, S1 runoff flowed di-rectly into Winter Quarters Bay (WQB). A significant amount of runoff at McMurdo Stations flowed into channels S2C and S3A because both chan-nels received snowmelt runoff from large areas of the watershed (snow-melt runoff from sub-basins 2 and 3). Flow from S2c and S3A merged into S2B, which then diverted into WQB. While S1 and S2B flowed into WQB, flows at S5, S6, and S7 diverted below the Helo Pad. Flows at channels S5, S6, and S7 received snowmelt from small sub-basins in the watershed (Figure 2).
Pressure sensors in the channels where we collected water samples meas-ured stream discharge every 15 minutes (Affleck et al. 2014). Table 5 summarizes the cumulative discharges for the entire day during the corre-sponding sampling events. Because the runoff varies in each location, we normalized the pollutant concentration to the flow rate for the location sampling time. This provided a mass flow rate estimation (in grams per day) and comparisons between the various sites. We should note that the mass flow rate estimation assumed that the levels of concentration for the analytes were uniform for the corresponding sampling day. We analyzed the mass flow rate primarily for those analytes that were above the DLs at the S1, S2C, S3A, S6, and S7 sites to determine which sub-basins contrib-uted the most pollutant concentration.
Table 5. The corresponding flow rate at each location during the sampling events.
Sampling Events Sampling Dates
Flow Discharge m3/day S1 S2C S3A S6 S7
1a and 1b 09 Dec. 2010 1144 832 612 208 840 2 14 Dec. 2010 1261 3489 1507 291 265 3 29 Dec. 2010 953 3508 4239 74 4 17 Jan. 2011 979 1950 2007 5 21 Jan. 2011 492 2038 1824

ERDC/CRREL TR-14-15 12
The results showed that the maximum mass flow rate for most heavy met-als occurred at site S2C with significant amounts during the first peak flow (event 2); then the amount tapered in the subsequent sampling times later in the season. Within this flow event, these concentrations were approxi-mately 26 g for As, 3.6 g for Cd, 106 g for Cr, 269 g for Cu, 105 g for Pb, 340 g for Ni, and 689 g for Zn all on the same day (i.e., a one-day period) of discharge at S2C. Significant mass flow rates of heavy metals were also transported at the S3A channel, especially during events 1a and 2 and to an extent during event 3. We found Pb to be elevated at S3A during events 1a, 2, and 3. The mass flow rates of metals transported at S2C and S3A were significant, which supported the fact that sub-basins 2 and 3 have large land areas dedicated to operational locations with active day-to-day activities, including cargo storage pads, roads, and parking spaces. When combined, the runoff contained substantial amount of pollutants; for ex-ample, the combined amount of Pb discharged to WQB from S1, S2C and S3A was approximately 256 g during the entire day on 14 December 2010. Although significantly smaller in magnitude compared to S2C and S3A, the heavy metals mass flow rates for other locations (S1, S6, and S7, Figure 4) showed an elevated amount when runoff was high; then the amount ta-pered in the subsequent sampling times later in the season. This was also generally true for site S1.
Similarly, the mass flow rate for selected PAHs, such as acenaphthene, fluoranthene, fluorine, phenanthrene, and pyrene, showed that these con-taminants were transported in runoff mostly at S3A and S2C (Figure 5). Phenanthrene was the only PAHs found in the runoff at S1. At S6 and S7, none of these analytes were detected during the sampling periods.
ERDC/CRREL TR-14-15 13
Figure 4. Mass flow rate comparison of heavy metals during flow events at channel locations S1, S2C, S3A, S6, and S7.
048
1216202428
1a 1b 2 3 4 5
Mas
s Fl
ow R
ate,
g/d
ay
Flow Event
Total ArsenicS1
S2C
S3A
S6
S7 0
1
2
3
4
1a 1b 2 3 4 5
Mas
s Fl
ow R
ate,
g/d
ay
Flow Event
Total Cadmium
S1
S2C
S3A
S6
S7
020406080
100120
1a 1b 2 3 4 5
Mas
s Fl
ow R
ate,
g/d
ay
Flow Event
Total ChromiumS1
S2C
S3A
S6
S7 050
100150200250300
1a 1b 2 3 4 5
Mas
s Fl
ow R
ate,
g/d
ay
Flow Event
Total CopperS1
S2C
S3A
S6
S7
020406080
100120
1a 1b 2 3 4 5
Mas
s Fl
ow R
ate,
g/d
ay
Flow Event
Total LeadS1
S2C
S3A
S6
S7 0
100
200
300
400
1a 1b 2 3 4 5
Mas
s Flo
w R
ate,
g/d
ay
Flow Event
Total NickelS1
S2C
S3A
S6
S7
0
200
400
600
800
1a 1b 2 3 4 5
Mas
s Fl
ow R
ate,
g/d
ay
Flow Event
Total ZincS1
S2C
S3A
S6
S7

ERDC/CRREL TR-14-15 14
Figure 5. Mass flow rates of selected polycyclic aromatic hydrocarbons that were above detection limits during flow events at channel locations S1, S2B, S2C, S3A, and S6.
4.3 Relationship to aquatic life standards
Because the runoff transported these contaminants into the WQB, we per-formed analyses to determine which analytes would be of concern for aquatic life. USEPA (2013a) and Nagpal (1995) published criteria on water quality and provided limits for acute and chronic exposures to contami-nants for aquatic life. Acute exposure is defined in terms of a criteria max-imum concentration (CMC), which is an estimate of the highest concentra-tion of a contaminant in surface water to which an aquatic community can be exposed briefly without an unacceptable effect. Chronic exposure is quantified by a criterion continuous concentration (CCC) value, which is an estimate of the highest concentration of a contaminant in surface water to which an aquatic community can be exposed indefinitely without an un-
0.00
0.05
0.10
0.15
1a 1b 2 3 4 5
Mas
s Fl
ow R
ate,
g/d
ay
Flow Event
Acenaphthene
S1
S3A
S2C
S6 0.00
0.02
0.04
0.06
0.08
0.10
0.12
1a 1b 2 3 4 5
Mas
s Fl
ow R
ate,
g/d
ay
Flow Event
Fluoranthene
S1
S3A
S2C
S6
0.00
0.02
0.04
0.06
0.08
0.10
1a 1b 2 3 4 5
Mas
s Flo
w R
ate,
g/d
ay
Flow Event
Fluorene
S1
S3A
S2C
S6 0.00
0.20
0.40
0.60
0.80
1a 1b 2 3 4 5
Mas
s Flo
w R
ate,
g/d
ay
Flow Event
Naphthalene
S1
S3A
S2C
S6
0.00
0.05
0.10
0.15
0.20
0.25
1a 1b 2 3 4 5
Mas
s Fl
ow R
ate,
g/d
ay
Flow Event
Pyrene
S1
S3A
S2C
S6 0.00
0.02
0.04
0.06
0.08
0.10
0.12
1a 1b 2 3 4 5
Mas
s Fl
ow R
ate,
g/d
ay
Flow Event
Phenanthrene
S1
S3A
S2C
S6
ERDC/CRREL TR-14-15 15
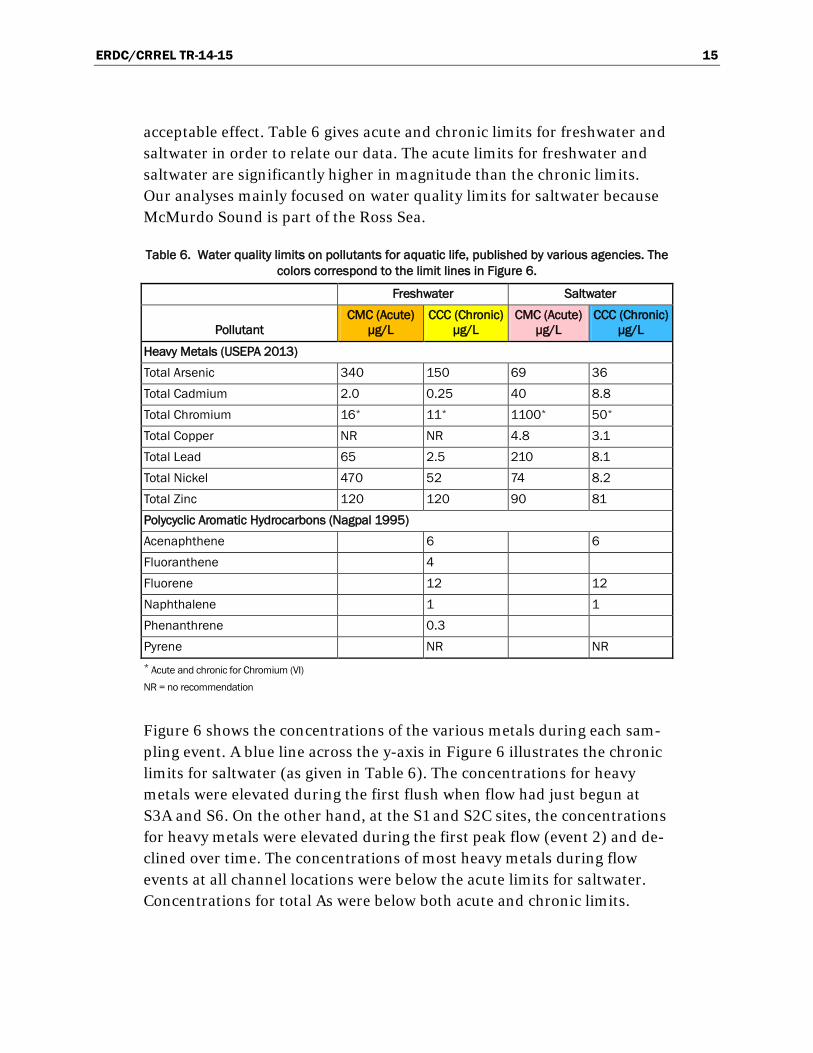
acceptable effect. Table 6 gives acute and chronic limits for freshwater and saltwater in order to relate our data. The acute limits for freshwater and saltwater are significantly higher in magnitude than the chronic limits. Our analyses mainly focused on water quality limits for saltwater because McMurdo Sound is part of the Ross Sea.
Table 6. Water quality limits on pollutants for aquatic life, published by various agencies. The colors correspond to the limit lines in Figure 6.
Freshwater Saltwater
Pollutant CMC (Acute)
µg/L CCC (Chronic)
µg/L CMC (Acute)
µg/L CCC (Chronic)
µg/L Heavy Metals (USEPA 2013) Total Arsenic 340 150 69 36 Total Cadmium 2.0 0.25 40 8.8 Total Chromium 16* 11* 1100* 50* Total Copper NR NR 4.8 3.1 Total Lead 65 2.5 210 8.1 Total Nickel 470 52 74 8.2 Total Zinc 120 120 90 81 Polycyclic Aromatic Hydrocarbons (Nagpal 1995) Acenaphthene 6 6 Fluoranthene 4 Fluorene 12 12 Naphthalene 1 1 Phenanthrene 0.3 Pyrene NR NR * Acute and chronic for Chromium (VI) NR = no recommendation
Figure 6 shows the concentrations of the various metals during each sam-pling event. A blue line across the y-axis in Figure 6 illustrates the chronic limits for saltwater (as given in Table 6). The concentrations for heavy metals were elevated during the first flush when flow had just begun at S3A and S6. On the other hand, at the S1 and S2C sites, the concentrations for heavy metals were elevated during the first peak flow (event 2) and de-clined over time. The concentrations of most heavy metals during flow events at all channel locations were below the acute limits for saltwater. Concentrations for total As were below both acute and chronic limits.
ERDC/CRREL TR-14-15 16
Figure 6. Concentration of heavy metals during flow events at channel locations S1, S2C S3A, S6, and S7. The blue line across the y-axis indicates the chronic limits for saltwater.
However, the heavy metals that were of most concern with regards to chronic levels for saltwater were Cu, Pb, Ni, and Zn. At several of the sam-pling locations, concentrations of these metals exceeded the chronic limit for saltwater (Figure 6). The concentration for total Cd and total Cr sur-passed the chronic limit during the first flush (events 1a and 1b) in the S3A channel while the concentration of total Cr at S1 exceeded the chronic limit during the first peak flow. Considering that locations S6 and S7 drain from
0
5
10
15
20
1a 1b 2 3 4 5
Conc
entr
atio
n µg
/L
Flow Event
Total Arsenic
S1
S3A
S2C
S6
S70
1
2
3
4
1a 1b 2 3 4 5
Conc
entr
atio
n µg
/L
Flow Event
Total Cadmium
S1
S3A
S2C
020406080
100120
1a 1b 2 3 4 5
Conc
entr
atio
n µg
/L
Flow Event
Total Chromium
S1
S3A
S2C
S6
S70
50100150200250300
1a 1b 2 3 4 5Co
ncen
trat
ion
µg/L
Flow Event
Total Copper
S1
S3A
S2C
S6
S7
0
50
100
150
200
250
300
1a 1b 2 3 4 5
Conc
entr
atio
n µg
/L
Flow Event
Total Nickel
S1
S3A
S2C
S6
S70
20406080
100120
1a 1b 2 3 4 5
Conc
entr
atio
n µg
/L
Flow Event
Total Lead
S1
S3A
S2C
S6
S7
0100200300400500600700
1a 1b 2 3 4 5
Conc
entr
atio
n µg
/L
Flow Event
Total Zinc
S1
S3A
S2C
S6
S7

ERDC/CRREL TR-14-15 17
sub-basins with small areas and that concentrations of many of these met-als were above the chronic limit, the data revealed that these contaminants exist at levels high enough to be of concern at the Station.
We found concentrations above the DLs for several of the PAHs, including acenaphthene, fluoranthene, fluorine, phenanthrene, naphthalene, and pyrene (Figure 7). Concentrations were elevated during the first few sam-pling events (events 1a through 3) at S3A and at S1 but then decreased during the subsequent flow events. In contrast, at S2C, concentrations of several of these PAHs were elevated during the later sampling events (2, 3, 4, and 5). However, the concentrations of these PAHs were considerably below the published chronic criteria for aquatic life. The maximum con-centration values for acenaphthene and naphthalene were 0.093 and 0.215 µg/L compared to chronic criteria of 6 and 1 µg/L, respectively (Table 6).
Figure 7. Concentration of selected PAHs during flow events at channel locations S1, S2C, S3A, and S6.
0.00
0.02
0.04
0.06
0.08
0.10
1a 1b 2 3 4 5
Conc
entr
atio
n µg
/L
Flow Event
Acenaphthene
S1
S3A
S2C
S6 0.00
0.02
0.04
0.06
0.08
1a 1b 2 3 4 5
Conc
entr
atio
n µg
/L
Flow Event
Fluoranthene
S1
S3A
S2C
S6
0.00
0.01
0.02
0.03
0.04
0.05
0.06
1a 1b 2 3 4 5
Conc
entr
atio
n µg
/L
Flow Event
Fluorene
S1
S3A
S2C
S6 0.000.020.040.060.080.100.120.14
1a 1b 2 3 4 5
Conc
entr
atio
n µg
/L
Flow Event
Phenanthrene
S1
S3A
S2C
S6
0.00
0.02
0.04
0.06
0.08
0.10
1a 1b 2 3 4 5
Conc
entr
atio
n µg
/L
Flow Event
Pyrene
S1
S3A
S2C
S6 0.00
0.05
0.10
0.15
0.20
0.25
1a 1b 2 3 4 5
Conc
entr
atio
n µg
/L
Flow Event
Naphthalene
S1
S3A
S2C
S6

ERDC/CRREL TR-14-15 18
Kennicutt et al. (2010) described that most metal concentrations on con-taminated soils exceeded the background concentrations at McMurdo re-ported in Crocket (1997), particularly As, Cd, Co, Pb, and Zn. These con-taminated soils were in areas that had previous fuel spills. Thus, we could expect runoff from these areas to also have elevated levels for all or some of these contaminants. Our study suggests that the levels for Cd, Cr, Cu, Pb, Ni, and Zn in the runoff are of concern as they exceeded the chronic limit for aquatic water quality in saltwater.

ERDC/CRREL TR-14-15 19
5 Summary and Conclusion
To understand what types of analytes were present in the runoff and di-verted into WQB, we used the limits for water quality to quantify pollutant concentrations. Five times during the 2010–11 austral summer, we sam-pled for pollutants, including heavy metals, PAHs, total hydrocarbons, and VOCs. The results of this study characterized the concentration levels in the runoff at various locations during the first flush, peak flow of the first flush, and sequential major peak flow events of the season. The overall findings included the following:
• Based on the DL for each test method, heavy metals were present in the water in all of the channels throughout the sampling events.
• The concentrations for heavy metals were elevated at S3A and S6 during the first flush when flow began while, in other places (S1 and S2C), elevated values did not occur until the first significant flow. The concentrations for selected PAHs, such as acenaphthene, fluoranthene, fluorine, phenanthrene, and pyrene, were elevated during the first peak flow at S3A and diminished during the subse-quent peak flows later in the season.
• As we compared the analytes to the limits from USEPA (2013a) and Nagpal (1995) for acute and chronic exposure for aquatic life, we found that the analytes of most concern at McMurdo Station in-cluded Cd, Cr, Cu, Pb, Ni, and Zn, which exceeded the chronic limit for aquatic water quality (saltwater) in several of the sampling loca-tions. These contaminants existed in the runoff at the Station at various levels significant enough to be a problem even in the small sub-basins.
• Overall, S2C and S3A had significant mass flow rates for total heavy metals and for selected PAHs compared to other locations (S1, S2C, S6 and S7). The runoff contained substantial amount of pollutants; for example, the combined amount of Pb discharged to WQB from S1, S2C and S3A was approximately 256 g during the first peak for the entire day. Both S2C and S3A are composed of large land areas where significant operational or day-to-day activities are per-

ERDC/CRREL TR-14-15 20
formed, including cargo storage, pads where equipment and mate-rials are stored, roads, and parking spaces.
Because temporal flow rate (discharge) in each location varies daily and throughout the season, the pollutant concentration will be high in the be-ginning of the snowmelt runoff, then fluctuate throughout the entire snowmelt runoff period, and potentially will level off at the end of the summer season. However, a continuous measurement of the pollutant concentration and the total mass discharged for the entire snowmelt run-off can be costly to perform. As the Station’s operational activities continue all year round, it is likely that certain levels of pollutants accumulate on the ground and that significant amounts of contaminants are carried out during the first flush event and during early peak flows. This was particu-larly true in areas with a big operational footprint.

ERDC/CRREL TR-14-15 21
6 Recommendations
Given that the snowmelt runoff contained significant concentration of heavy metals and certain PAHs, prevention and mitigation are crucial for reducing contamination at McMurdo Station. Human factors, such as awareness, cautiousness, improved chemical handling, and environmental friendly practices, can have an important role in reducing contamination. Engineering methods, such as best management practices or erosion con-trol systems (Affleck et al. 2014), can also mitigate further contamination. Erosion control systems are often built to trap sediment and to control or attenuate flow in the receiving channels. These should be used in channels at the Station before the runoff exits into WQB at McMurdo Sound. Given the proper implementation in the unique environment, these systems can improve water quality and can reduce pollutant discharges by allowing these elevated level of contaminations to degrade given time. Other approaches we can pursue include the following:
• Assessment of microbial communities, if present in the runoff, for po-tential bioremediation
• Evaluation of applicable physical and environmentally-safe chemical treatment technologies to decrease and mitigate the contamination levels
• Assessment of engineering approaches for collecting pollutants on des-ignated vehicle parking areas and at major operational locations.
We recommend a near-term assessment to map out the spatial pattern and levels of previously experienced historical contamination (Kennicutt et al., 2010; Klein et al., 2012) and overlay the existing channel locations. This will aid us in developing a new plan for runoff by finding a better route for drainage away from contaminated areas and by combining several existing flow paths into one primary drainage path. In addition, developing an op-erational and maintenance toolkit will help facilitate sharing information about existing environmental studies and operational data, which will pro-vide decision making strategies for infrastructure improvements and envi-ronmental remediation, when necessary.
ERDC/CRREL TR-14-15 22
References Affleck, R. T., C. Vuyovich, M. Knuth, and S. Daly. 2012a. Drainage Assessment and Flow
Monitoring at McMurdo Station during Austral Summer. ERDC/CRREL TR-12-3. Hanover, NH: U.S. Army Engineer Research and Development Center.
Affleck, R., M. Knuth, and S. Arcone. 2012b. Snow and Climatic Characterization Influencing Snowmelt at McMurdo Station. In Proceedings of the Cold Regions Engineering 2012: Sustainable Infrastructure Development in a Changing Cold Environment, 19–22 August 2012, Quebec City, Canada, 823–832.
Affleck, R. T., M. Carr, M. Knuth, L. Elliot, C. Chan and M. Diamond. 2014. Runoff Characterization and Variations at McMurdo Station, Antarctica. ERDC/CRREL TR-14-6. Hanover, NH: U.S. Army Engineer Research and Development Center.
Antarctic Support Associates. 1997a. Phase Two snowmelt runoff and associated sediment soil sampling and analysis McMurdo Station, Antarctica. April 1997.
Antarctic Support Associates. 1997b. Sampling and analysis report, phase three, snowmelt runoff and associated sediment, McMurdo Station, Antarctica. August 1997.
Crocket, A. B. 1997. Background levels of metals in soils, McMurdo Station, Antarctica Environmental Monitoring and Assessment 50:289–96
Kennicutt, M. C., II, A. Klein, P. Montagna, S. Sweet, T. Wade, T. Palmer, J. Sericano, and G. Denoux. 2010. Temporal and spatial patterns of anthropogenic disturbance at McMurdo Station, Antarctica. Environmental Research Letters. 5 (3): 034010.
Klein, A. G., S. T. Sweet, T. L. Wade, J. L. Sericano, and M. C. Kennicutt II. 2012. Spatial patterns of total petroleum hydrocarbons in the terrestrial environment at McMurdo Station, Antarctica. Antarctic Science 24 (5): 450–466.
Klein, A., M. Kennicutt, G. Wolff, S. Sweet, T. Bloxom, D. Gielstra, and M. Cleckley. 2008. The historical development of McMurdo station, Antarctica, an environmental perspective. Polar Geography 31:119–144.
Nagpal, N. K. 1995. Ambient Water Quality Criteria for Polycyclic Aromatic Hydrocarbons (PAHs). British Columbia, Canada: Water Quality Branch, Ministry of Environment, Lands and Parks. http://www.for.gov.bc.ca/hfd/library/documents/Bib71052.pdf.
National Resources Defense Council (NRDC). 2001. Stormwater Strategies: Community Responses to Runoff Pollution. http://www.nrdc.org/water/pollution/storm/chap2.asp (accessed February 2014).
ERDC/CRREL TR-14-15 23
USEPA. 1992a. Method 200.8: Determination of Trace Elements in Waters and Wastes by Inductively Coupled Plasma–Mass Spectrometry. Cincinnati, OH: U.S. Environmental Protection Agency, Office of Research and Development. http://water.epa.gov/scitech/methods/cwa/bioindicators/upload/2007_07_10_methods_method_200_8.pdf.
USEPA. 1992b. Method 524.2: Measurement of Purgeable Organic Compounds in Water by Capillary Column Chromatography/Mass Spectrometry. Cincinnati, OH: U.S. Environmental Protection Agency, Office of Research and Development. http://water.epa.gov/scitech/methods/cwa/bioindicators/upload/2007_11_27_methods_method_524_2.pdf.
USEPA. 2007. Method 8015C: Nonhalogenated Organics by Gas Chromatography. In Test Methods for Evaluating Solid Waste, Physical/Chemical Methods. SW-846. Washington, DC: U.S. Environmental Protection Agency, Office of Solid Waste and Emergency Response. http://www.epa.gov/osw/hazard/testmethods/sw846/pdfs/8015c.pdf.
USEPA. 2013. National Recommended Water Quality Criteria. Washington, DC: U.S. Environmental Protection Agency. http://water.epa.gov/scitech/swguidance/standards/criteria/current/index.cfm .

ERDC/CRREL TR-14-15 24
Appendix A: Procedures for Water Sample Collection during 2010–11 Study
Raytheon Polar Services Company (RPSC) Environmental staff assisted CRREL in developing and implementing the runoff-sampling portion of the Drainage and Erosion Study for McMurdo Station. What follows is a description of our field sampling methods.
Hill Laboratories (an environment laboratory in New Zealand) provided to RPSC Environmental at McMurdo Station all the bottles and vials used for water samples. Some bottles provided by Hill Laboratories had preserva-tive in the bottles to mix the runoff samples with. Supplies provided by Hill Laboratories included the following:
• 2 × 1 L, wide-mouth glass bottles for sample collection • 1 × 100 mL polyethylene bottle with nitric acid • 1 × 500 mL amber glass bottle, unpreserved • 1 × 250 mL amber glass bottle with sulphuric acid • 2 × 40 mL amber glass vials with ascorbic acid • Small red cooler with one blue ice pack to place all the samples collect-
ed
We used the sampling procedures as outlined below:
1. Used the designated two 1 L, wide-mouth glass bottles for each sample lo-cation to collect the runoff and filled these bottles as much as possible without touching the lip to the bottom of the ditch. Used the water from the two 1-L, wide-mouth glass bottles to fill in the following containers: 100 mL polyethylene bottle with nitric acid preserved; the 500 mL amber glass bottle, unpreserved; 250 mL amber glass bottle with sulphuric acid preserved; and the two 40 mL amber glass vials with ascorbic acid pre-served. Item 5 below details transferring the water samples to various bot-tles.
2. Legibly labeled all samples with the date, time, exact location, and person taking the sample.

ERDC/CRREL TR-14-15 25
3. Used caution with sample bottles that contained preservative and made sure the preservatives were intact and were not overfilled with the water sample.
4. Eliminated to the maximum extent possible potential sources of sample contamination by removing the sample bottle top without touching the in-side or the top rim of the bottle and without touching the inside of the bot-tle-top.
5. Collected and transferred samples.
a. Transferred the collected sample to the Hill Laboratories sample bottles, starting with the acid-preserved bottles first and finishing with unpreserved bottles.
b. Filled the bottles to within an inch or so of the top without overfill-ing it (for vials, see #5c and #6 below) and capped each bottle tight-ly and inverted a few times to mix in the preservative (if applicable).
c. Used extra caution when filling the 40 ml vials. ABSOLUTELY NO AIR BUBBLES, POCKETS, ETC., WERE ALLOWED IN THE VIAL. Filled the vial slowly until the water reached the mouth. Filled the vial with a few extra drops to allow the water to “mound up” over the lip of the vial (were careful not to overfill the bottle too much since there was acid preservative in it). A tiny amount of overflow was acceptable. Capped the bottle tightly with the Teflon septum provided. To check for bubbles, turned the bottle upside down to see if any bubbles floated up. Tapped the bottle a few times until no bubbles floated up. Otherwise added a few more drops of water into the vial and recapped it tightly. Repeated this process until no bub-bles formed.
6. If there was lag time of more than one hour between sample collection lo-cations, returned the sampler to the RPSC Environmental laboratory in Crary to place the sample bottles in a 4°C refrigerator.
7. Immediately after samples were collected, placed them in coolers and chilled them to 4°C with “blue ice.” Placed all samples upright, and secured them in place with inert cushioning, such as bubble wrap or corrugated

ERDC/CRREL TR-14-15 26
cardboard. After proper packaging, prepared the required shipping docu-ments, and coordinated transport of samples to the subcontract laboratory as described below.
8. After each sampling event, made sure to clean the 1 L, wide-mouth sample bottles with a light detergent and water mix and rinsed them with deion-ized water several times and air dried them to remove all residue from the previous sample collection.
Within 24 to 48 hours, we shipped the filled containers to Hill Laborato-ries in New Zealand. This required coordination between RPSC Environ-mental and RPSC Science Cargo for prompt shipment.
To prepare shipment documents, we chose a Transportation Control Number from the logbook, estimated the weight of the samples (recording the exact weight at the time of shipping), and labeled the box or cooler. We indicated special handling of the samples as appropriate (i.e., DNF [do not freeze], Keep Chilled, Time Sensitive, Fragile). The signature of the NSF Representative in the Chalet was required on the retrograde form for COMAIR flights. Once the box was ready, we left it in the staging area and submitted retrograde forms and Ministry of Agriculture and Fisheries permits to the RPSC Science Cargo Coordinator.

ERDC/CRREL TR-14-15 27
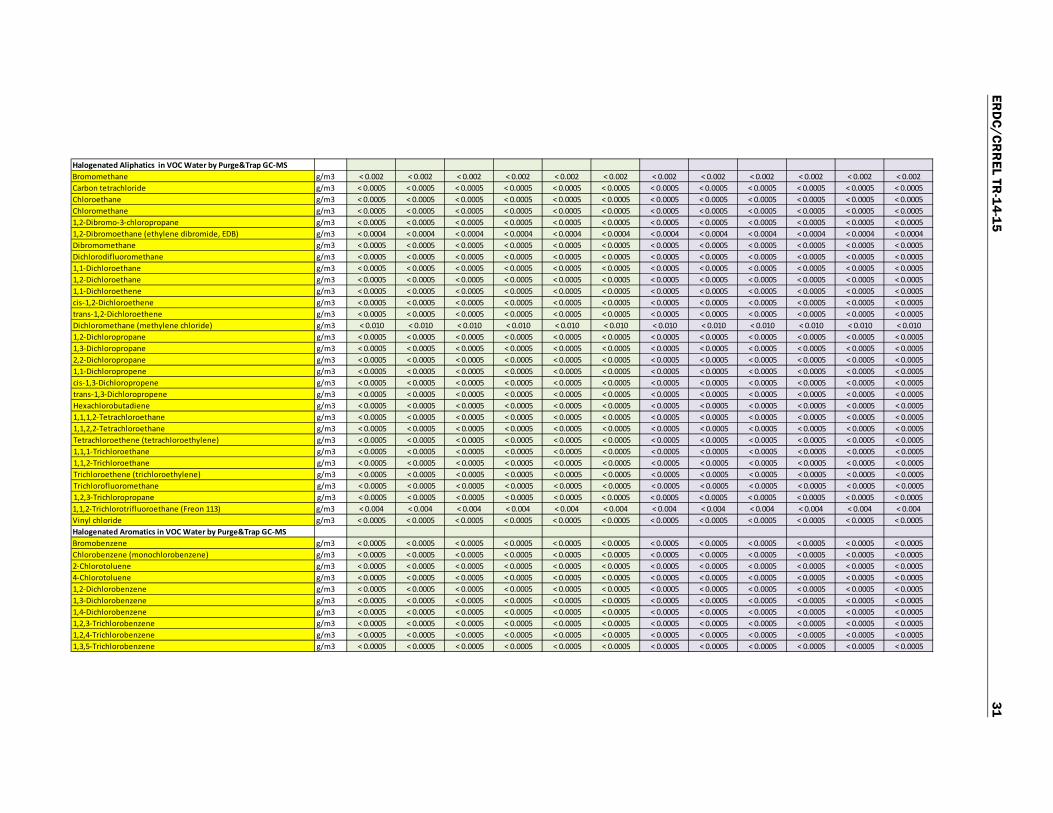
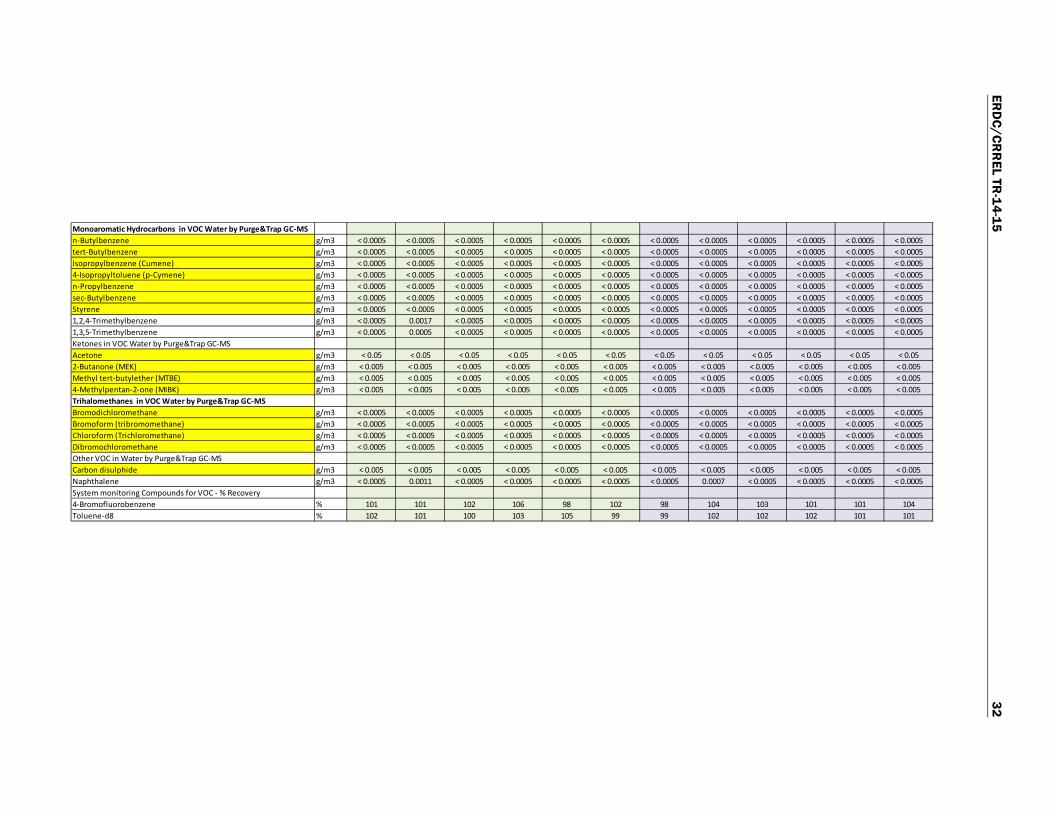
Appendix B: Summary of Test Methods and Standards Used and Results of Runoff Water Samples
Table B1 summarizes the test methods used for the runoff samples. The tests included testing for heavy metals, TPHs, and VOCs. Tables B2–B6 list the results from runoff water samples.
Table B1. Methodology and detection limits used for the runoff samples.

ERDC/CRREL TR-14-15 28

ERDC/CRREL TR-14-15 29

ERD
C/CRR
EL TR-14-15
30
Table B2. First Flush outcome at various location, 09 December 2010.
Event
Local Time 4:30 PM 5:45 PM 5:15 PM 6:45 PM 7:25 PM 7:40 PM 8:30 PM 8:15 PM 8:05 PM 8:45 PM 9:00 PM 9:10 PM
Location S1 S2B S3A S5 S6 S7 S1-peak S2B-peak S3A-peak S5-peak S6-peak S7-peakHeavy metals, totals, trace As,Cd,Cr,Cu,Ni,Pb,Zn Units:Total Arsenic g/m3 < 0.006 0.0047 0.019 0.0036 0.0057 0.0023 < 0.006 0.0031 0.0049 0.0043 0.0037 0.0021Total Cadmium g/m3 0.0004 0.00079 0.0038 0.00041 0.00096 0.00024 < 0.0003 0.00059 0.00073 0.00062 0.00062 0.00042Total Chromium g/m3 0.008 0.023 0.11 0.0083 0.023 0.0053 0.004 0.0138 0.024 0.0143 0.012 0.0051Total Copper g/m3 0.02 0.056 0.28 0.025 0.066 0.0135 0.01 0.033 0.059 0.044 0.036 0.0161Total Lead g/m3 0.0067 0.024 0.123 0.0081 0.019 0.0042 0.0036 0.0138 0.025 0.0141 0.0104 0.0039Total Nickel g/m3 0.018 0.065 0.3 0.0147 0.046 0.0099 0.008 0.037 0.064 0.029 0.024 0.0101Total Zinc g/m3 0.054 0.139 0.68 0.076 0.157 0.039 0.03 0.082 0.21 0.117 0.095 0.045Polycyclic Aromatic Hydrocarbons Trace in Water, By Liq/LiqAcenaphthene g/m3 < 0.000008 0.00001 0.000013 < 0.000008 < 0.000008 < 0.000008 < 0.000008 0.000019 < 0.000008 < 0.000008 < 0.000008 < 0.000008Acenaphthylene g/m3 < 0.000008 < 0.000008 < 0.000008 < 0.000008 < 0.000008 < 0.000008 < 0.000008 < 0.000008 < 0.000008 < 0.000008 < 0.000008 < 0.000008Anthracene g/m3 < 0.000008 < 0.000008 < 0.000008 < 0.000008 < 0.000008 < 0.000008 < 0.000008 < 0.000008 < 0.000008 < 0.000008 < 0.000008 < 0.000008Benzo[a]anthracene g/m3 < 0.000008 < 0.000008 < 0.000008 < 0.000008 < 0.000008 < 0.000008 < 0.000008 < 0.000008 < 0.000008 < 0.000008 < 0.000008 < 0.000008Benzo[a]pyrene (BAP) g/m3 < 0.000008 < 0.000008 < 0.000008 < 0.000008 < 0.000008 < 0.000008 < 0.000008 < 0.000008 < 0.000008 < 0.000008 < 0.000008 < 0.000008Benzo[b]fluoranthene + Benzo[j]fluoranthene g/m3 < 0.000008 < 0.000008 < 0.000008 < 0.000008 < 0.000008 < 0.000008 < 0.000008 < 0.000008 < 0.000008 < 0.000008 < 0.000008 < 0.000008Benzo[g,h,i]perylene g/m3 < 0.000008 < 0.000008 < 0.000008 < 0.000008 < 0.000008 < 0.000008 < 0.000008 < 0.000008 < 0.000008 < 0.000008 < 0.000008 < 0.000008Benzo[k]fluoranthene g/m3 < 0.000008 < 0.000008 < 0.000008 < 0.000008 < 0.000008 < 0.000008 < 0.000008 < 0.000008 < 0.000008 < 0.000008 < 0.000008 < 0.000008Chrysene g/m3 < 0.000008 < 0.000008 < 0.000008 < 0.000008 < 0.000008 < 0.000008 < 0.000008 < 0.000008 < 0.000008 < 0.000008 < 0.000008 < 0.000008Dibenzo[a,h]anthracene g/m3 < 0.000008 < 0.000008 < 0.000008 < 0.000008 < 0.000008 < 0.000008 < 0.000008 < 0.000008 < 0.000008 < 0.000008 < 0.000008 < 0.000008Fluoranthene g/m3 < 0.000008 0.000011 0.000014 0.000017 < 0.000008 < 0.000008 < 0.000008 0.000016 0.000011 0.000016 < 0.000008 < 0.000008Fluorene g/m3 < 0.000008 0.000018 0.000016 < 0.000008 < 0.000008 < 0.000008 < 0.000008 0.000021 < 0.000008 < 0.000008 < 0.000008 < 0.000008Indeno(1,2,3-c,d)pyrene g/m3 < 0.000008 < 0.000008 < 0.000008 < 0.000008 < 0.000008 < 0.000008 < 0.000008 < 0.000008 < 0.000008 < 0.000008 < 0.000008 < 0.000008Naphthalene g/m3 < 0.00004 0.00004 0.00004 < 0.00004 < 0.00004 < 0.00004 < 0.00004 0.00005 < 0.00004 < 0.00004 < 0.00004 < 0.00004Phenanthrene g/m3 < 0.000008 < 0.000008 < 0.000008 < 0.000008 < 0.000008 < 0.000008 < 0.000008 < 0.000008 < 0.000008 < 0.000008 < 0.000008 < 0.000008Pyrene g/m3 0.000013 0.000018 0.000033 0.000022 0.000009 < 0.000008 < 0.000008 0.000019 0.000024 0.000023 0.000009 < 0.000008Total Petroleum Hydrocarbons in Water 8015C6 - C9 g/m3 < 0.06 < 0.06 < 0.06 < 0.06 < 0.06 < 0.06 < 0.06 < 0.06 < 0.06 < 0.06 < 0.06 < 0.06C10 - C14 g/m3 < 0.04 0.05 0.06 < 0.04 < 0.04 < 0.04 < 0.04 < 0.04 < 0.04 < 0.04 < 0.04 < 0.04C15 - C36 g/m3 0.08 0.16 0.2 0.17 0.12 < 0.08 0.09 0.08 < 0.08 0.16 0.12 < 0.08Total hydrocarbons (C6 - C36) g/m3 < 0.2 0.2 0.3 < 0.2 < 0.2 < 0.2 < 0.2 < 0.2 < 0.2 < 0.2 < 0.2 < 0.2BTEX in VOC Water by Purge&Trap GC-MSBenzene g/m3 < 0.0005 < 0.0005 < 0.0005 < 0.0005 < 0.0005 < 0.0005 < 0.0005 < 0.0005 < 0.0005 < 0.0005 < 0.0005 < 0.0005Toluene g/m3 < 0.0010 < 0.0010 < 0.0010 < 0.0010 < 0.0010 < 0.0010 < 0.0010 < 0.0010 < 0.0010 < 0.0010 < 0.0010 < 0.0010Ethylbenzene g/m3 < 0.0005 < 0.0005 < 0.0005 < 0.0005 < 0.0005 < 0.0005 < 0.0005 < 0.0005 < 0.0005 < 0.0005 < 0.0005 < 0.0005m&p-Xylene g/m3 < 0.0005 0.0006 < 0.0005 < 0.0005 < 0.0005 < 0.0005 < 0.0005 < 0.0005 < 0.0005 < 0.0005 < 0.0005 < 0.0005o-Xylene g/m3 < 0.0005 < 0.0005 < 0.0005 < 0.0005 < 0.0005 < 0.0005 < 0.0005 < 0.0005 < 0.0005 < 0.0005 < 0.0005 < 0.0005
First Flush, first sample, 09-Dec-2010 First Flush, Peak Flow, 09-Dec-2010
ERD
C/CRR
EL TR-14-15
31
Halogenated Aliphatics in VOC Water by Purge&Trap GC-MSBromomethane g/m3 < 0.002 < 0.002 < 0.002 < 0.002 < 0.002 < 0.002 < 0.002 < 0.002 < 0.002 < 0.002 < 0.002 < 0.002Carbon tetrachloride g/m3 < 0.0005 < 0.0005 < 0.0005 < 0.0005 < 0.0005 < 0.0005 < 0.0005 < 0.0005 < 0.0005 < 0.0005 < 0.0005 < 0.0005Chloroethane g/m3 < 0.0005 < 0.0005 < 0.0005 < 0.0005 < 0.0005 < 0.0005 < 0.0005 < 0.0005 < 0.0005 < 0.0005 < 0.0005 < 0.0005Chloromethane g/m3 < 0.0005 < 0.0005 < 0.0005 < 0.0005 < 0.0005 < 0.0005 < 0.0005 < 0.0005 < 0.0005 < 0.0005 < 0.0005 < 0.00051,2-Dibromo-3-chloropropane g/m3 < 0.0005 < 0.0005 < 0.0005 < 0.0005 < 0.0005 < 0.0005 < 0.0005 < 0.0005 < 0.0005 < 0.0005 < 0.0005 < 0.00051,2-Dibromoethane (ethylene dibromide, EDB) g/m3 < 0.0004 < 0.0004 < 0.0004 < 0.0004 < 0.0004 < 0.0004 < 0.0004 < 0.0004 < 0.0004 < 0.0004 < 0.0004 < 0.0004Dibromomethane g/m3 < 0.0005 < 0.0005 < 0.0005 < 0.0005 < 0.0005 < 0.0005 < 0.0005 < 0.0005 < 0.0005 < 0.0005 < 0.0005 < 0.0005Dichlorodifluoromethane g/m3 < 0.0005 < 0.0005 < 0.0005 < 0.0005 < 0.0005 < 0.0005 < 0.0005 < 0.0005 < 0.0005 < 0.0005 < 0.0005 < 0.00051,1-Dichloroethane g/m3 < 0.0005 < 0.0005 < 0.0005 < 0.0005 < 0.0005 < 0.0005 < 0.0005 < 0.0005 < 0.0005 < 0.0005 < 0.0005 < 0.00051,2-Dichloroethane g/m3 < 0.0005 < 0.0005 < 0.0005 < 0.0005 < 0.0005 < 0.0005 < 0.0005 < 0.0005 < 0.0005 < 0.0005 < 0.0005 < 0.00051,1-Dichloroethene g/m3 < 0.0005 < 0.0005 < 0.0005 < 0.0005 < 0.0005 < 0.0005 < 0.0005 < 0.0005 < 0.0005 < 0.0005 < 0.0005 < 0.0005cis-1,2-Dichloroethene g/m3 < 0.0005 < 0.0005 < 0.0005 < 0.0005 < 0.0005 < 0.0005 < 0.0005 < 0.0005 < 0.0005 < 0.0005 < 0.0005 < 0.0005trans-1,2-Dichloroethene g/m3 < 0.0005 < 0.0005 < 0.0005 < 0.0005 < 0.0005 < 0.0005 < 0.0005 < 0.0005 < 0.0005 < 0.0005 < 0.0005 < 0.0005Dichloromethane (methylene chloride) g/m3 < 0.010 < 0.010 < 0.010 < 0.010 < 0.010 < 0.010 < 0.010 < 0.010 < 0.010 < 0.010 < 0.010 < 0.0101,2-Dichloropropane g/m3 < 0.0005 < 0.0005 < 0.0005 < 0.0005 < 0.0005 < 0.0005 < 0.0005 < 0.0005 < 0.0005 < 0.0005 < 0.0005 < 0.00051,3-Dichloropropane g/m3 < 0.0005 < 0.0005 < 0.0005 < 0.0005 < 0.0005 < 0.0005 < 0.0005 < 0.0005 < 0.0005 < 0.0005 < 0.0005 < 0.00052,2-Dichloropropane g/m3 < 0.0005 < 0.0005 < 0.0005 < 0.0005 < 0.0005 < 0.0005 < 0.0005 < 0.0005 < 0.0005 < 0.0005 < 0.0005 < 0.00051,1-Dichloropropene g/m3 < 0.0005 < 0.0005 < 0.0005 < 0.0005 < 0.0005 < 0.0005 < 0.0005 < 0.0005 < 0.0005 < 0.0005 < 0.0005 < 0.0005cis-1,3-Dichloropropene g/m3 < 0.0005 < 0.0005 < 0.0005 < 0.0005 < 0.0005 < 0.0005 < 0.0005 < 0.0005 < 0.0005 < 0.0005 < 0.0005 < 0.0005trans-1,3-Dichloropropene g/m3 < 0.0005 < 0.0005 < 0.0005 < 0.0005 < 0.0005 < 0.0005 < 0.0005 < 0.0005 < 0.0005 < 0.0005 < 0.0005 < 0.0005Hexachlorobutadiene g/m3 < 0.0005 < 0.0005 < 0.0005 < 0.0005 < 0.0005 < 0.0005 < 0.0005 < 0.0005 < 0.0005 < 0.0005 < 0.0005 < 0.00051,1,1,2-Tetrachloroethane g/m3 < 0.0005 < 0.0005 < 0.0005 < 0.0005 < 0.0005 < 0.0005 < 0.0005 < 0.0005 < 0.0005 < 0.0005 < 0.0005 < 0.00051,1,2,2-Tetrachloroethane g/m3 < 0.0005 < 0.0005 < 0.0005 < 0.0005 < 0.0005 < 0.0005 < 0.0005 < 0.0005 < 0.0005 < 0.0005 < 0.0005 < 0.0005Tetrachloroethene (tetrachloroethylene) g/m3 < 0.0005 < 0.0005 < 0.0005 < 0.0005 < 0.0005 < 0.0005 < 0.0005 < 0.0005 < 0.0005 < 0.0005 < 0.0005 < 0.00051,1,1-Trichloroethane g/m3 < 0.0005 < 0.0005 < 0.0005 < 0.0005 < 0.0005 < 0.0005 < 0.0005 < 0.0005 < 0.0005 < 0.0005 < 0.0005 < 0.00051,1,2-Trichloroethane g/m3 < 0.0005 < 0.0005 < 0.0005 < 0.0005 < 0.0005 < 0.0005 < 0.0005 < 0.0005 < 0.0005 < 0.0005 < 0.0005 < 0.0005Trichloroethene (trichloroethylene) g/m3 < 0.0005 < 0.0005 < 0.0005 < 0.0005 < 0.0005 < 0.0005 < 0.0005 < 0.0005 < 0.0005 < 0.0005 < 0.0005 < 0.0005Trichlorofluoromethane g/m3 < 0.0005 < 0.0005 < 0.0005 < 0.0005 < 0.0005 < 0.0005 < 0.0005 < 0.0005 < 0.0005 < 0.0005 < 0.0005 < 0.00051,2,3-Trichloropropane g/m3 < 0.0005 < 0.0005 < 0.0005 < 0.0005 < 0.0005 < 0.0005 < 0.0005 < 0.0005 < 0.0005 < 0.0005 < 0.0005 < 0.00051,1,2-Trichlorotrifluoroethane (Freon 113) g/m3 < 0.004 < 0.004 < 0.004 < 0.004 < 0.004 < 0.004 < 0.004 < 0.004 < 0.004 < 0.004 < 0.004 < 0.004Vinyl chloride g/m3 < 0.0005 < 0.0005 < 0.0005 < 0.0005 < 0.0005 < 0.0005 < 0.0005 < 0.0005 < 0.0005 < 0.0005 < 0.0005 < 0.0005Halogenated Aromatics in VOC Water by Purge&Trap GC-MSBromobenzene g/m3 < 0.0005 < 0.0005 < 0.0005 < 0.0005 < 0.0005 < 0.0005 < 0.0005 < 0.0005 < 0.0005 < 0.0005 < 0.0005 < 0.0005Chlorobenzene (monochlorobenzene) g/m3 < 0.0005 < 0.0005 < 0.0005 < 0.0005 < 0.0005 < 0.0005 < 0.0005 < 0.0005 < 0.0005 < 0.0005 < 0.0005 < 0.00052-Chlorotoluene g/m3 < 0.0005 < 0.0005 < 0.0005 < 0.0005 < 0.0005 < 0.0005 < 0.0005 < 0.0005 < 0.0005 < 0.0005 < 0.0005 < 0.00054-Chlorotoluene g/m3 < 0.0005 < 0.0005 < 0.0005 < 0.0005 < 0.0005 < 0.0005 < 0.0005 < 0.0005 < 0.0005 < 0.0005 < 0.0005 < 0.00051,2-Dichlorobenzene g/m3 < 0.0005 < 0.0005 < 0.0005 < 0.0005 < 0.0005 < 0.0005 < 0.0005 < 0.0005 < 0.0005 < 0.0005 < 0.0005 < 0.00051,3-Dichlorobenzene g/m3 < 0.0005 < 0.0005 < 0.0005 < 0.0005 < 0.0005 < 0.0005 < 0.0005 < 0.0005 < 0.0005 < 0.0005 < 0.0005 < 0.00051,4-Dichlorobenzene g/m3 < 0.0005 < 0.0005 < 0.0005 < 0.0005 < 0.0005 < 0.0005 < 0.0005 < 0.0005 < 0.0005 < 0.0005 < 0.0005 < 0.00051,2,3-Trichlorobenzene g/m3 < 0.0005 < 0.0005 < 0.0005 < 0.0005 < 0.0005 < 0.0005 < 0.0005 < 0.0005 < 0.0005 < 0.0005 < 0.0005 < 0.00051,2,4-Trichlorobenzene g/m3 < 0.0005 < 0.0005 < 0.0005 < 0.0005 < 0.0005 < 0.0005 < 0.0005 < 0.0005 < 0.0005 < 0.0005 < 0.0005 < 0.00051,3,5-Trichlorobenzene g/m3 < 0.0005 < 0.0005 < 0.0005 < 0.0005 < 0.0005 < 0.0005 < 0.0005 < 0.0005 < 0.0005 < 0.0005 < 0.0005 < 0.0005
ERD
C/CRR
EL TR-14-15
32
Monoaromatic Hydrocarbons in VOC Water by Purge&Trap GC-MSn-Butylbenzene g/m3 < 0.0005 < 0.0005 < 0.0005 < 0.0005 < 0.0005 < 0.0005 < 0.0005 < 0.0005 < 0.0005 < 0.0005 < 0.0005 < 0.0005tert-Butylbenzene g/m3 < 0.0005 < 0.0005 < 0.0005 < 0.0005 < 0.0005 < 0.0005 < 0.0005 < 0.0005 < 0.0005 < 0.0005 < 0.0005 < 0.0005Isopropylbenzene (Cumene) g/m3 < 0.0005 < 0.0005 < 0.0005 < 0.0005 < 0.0005 < 0.0005 < 0.0005 < 0.0005 < 0.0005 < 0.0005 < 0.0005 < 0.00054-Isopropyltoluene (p-Cymene) g/m3 < 0.0005 < 0.0005 < 0.0005 < 0.0005 < 0.0005 < 0.0005 < 0.0005 < 0.0005 < 0.0005 < 0.0005 < 0.0005 < 0.0005n-Propylbenzene g/m3 < 0.0005 < 0.0005 < 0.0005 < 0.0005 < 0.0005 < 0.0005 < 0.0005 < 0.0005 < 0.0005 < 0.0005 < 0.0005 < 0.0005sec-Butylbenzene g/m3 < 0.0005 < 0.0005 < 0.0005 < 0.0005 < 0.0005 < 0.0005 < 0.0005 < 0.0005 < 0.0005 < 0.0005 < 0.0005 < 0.0005Styrene g/m3 < 0.0005 < 0.0005 < 0.0005 < 0.0005 < 0.0005 < 0.0005 < 0.0005 < 0.0005 < 0.0005 < 0.0005 < 0.0005 < 0.00051,2,4-Trimethylbenzene g/m3 < 0.0005 0.0017 < 0.0005 < 0.0005 < 0.0005 < 0.0005 < 0.0005 < 0.0005 < 0.0005 < 0.0005 < 0.0005 < 0.00051,3,5-Trimethylbenzene g/m3 < 0.0005 0.0005 < 0.0005 < 0.0005 < 0.0005 < 0.0005 < 0.0005 < 0.0005 < 0.0005 < 0.0005 < 0.0005 < 0.0005Ketones in VOC Water by Purge&Trap GC-MSAcetone g/m3 < 0.05 < 0.05 < 0.05 < 0.05 < 0.05 < 0.05 < 0.05 < 0.05 < 0.05 < 0.05 < 0.05 < 0.052-Butanone (MEK) g/m3 < 0.005 < 0.005 < 0.005 < 0.005 < 0.005 < 0.005 < 0.005 < 0.005 < 0.005 < 0.005 < 0.005 < 0.005Methyl tert-butylether (MTBE) g/m3 < 0.005 < 0.005 < 0.005 < 0.005 < 0.005 < 0.005 < 0.005 < 0.005 < 0.005 < 0.005 < 0.005 < 0.0054-Methylpentan-2-one (MIBK) g/m3 < 0.005 < 0.005 < 0.005 < 0.005 < 0.005 < 0.005 < 0.005 < 0.005 < 0.005 < 0.005 < 0.005 < 0.005Trihalomethanes in VOC Water by Purge&Trap GC-MSBromodichloromethane g/m3 < 0.0005 < 0.0005 < 0.0005 < 0.0005 < 0.0005 < 0.0005 < 0.0005 < 0.0005 < 0.0005 < 0.0005 < 0.0005 < 0.0005Bromoform (tribromomethane) g/m3 < 0.0005 < 0.0005 < 0.0005 < 0.0005 < 0.0005 < 0.0005 < 0.0005 < 0.0005 < 0.0005 < 0.0005 < 0.0005 < 0.0005Chloroform (Trichloromethane) g/m3 < 0.0005 < 0.0005 < 0.0005 < 0.0005 < 0.0005 < 0.0005 < 0.0005 < 0.0005 < 0.0005 < 0.0005 < 0.0005 < 0.0005Dibromochloromethane g/m3 < 0.0005 < 0.0005 < 0.0005 < 0.0005 < 0.0005 < 0.0005 < 0.0005 < 0.0005 < 0.0005 < 0.0005 < 0.0005 < 0.0005Other VOC in Water by Purge&Trap GC-MSCarbon disulphide g/m3 < 0.005 < 0.005 < 0.005 < 0.005 < 0.005 < 0.005 < 0.005 < 0.005 < 0.005 < 0.005 < 0.005 < 0.005Naphthalene g/m3 < 0.0005 0.0011 < 0.0005 < 0.0005 < 0.0005 < 0.0005 < 0.0005 0.0007 < 0.0005 < 0.0005 < 0.0005 < 0.0005System monitoring Compounds for VOC - % Recovery4-Bromofluorobenzene % 101 101 102 106 98 102 98 104 103 101 101 104Toluene-d8 % 102 101 100 103 105 99 99 102 102 102 101 101

ERD
C/CRR
EL TR-14-15
33
Table B3. First Peak Flow of the Season, 14 December 2010.
EventLocal Time 7:05 PM 7:10 PM 7:25 PM 7:30 PM 8:00 PM 8:05 PM 8:20 PM 8:25 PM 8:35 PM 8:40 PM
Location S3A S3A-Dup S2C S2C-Dup S1 S1-Dup S6 S6-Dup S7 S7-DupHeavy metals, totals, trace As,Cd,Cr,Cu,Ni,Pb,ZnTotal Arsenic g/m3 0.0067 0.0067 0.006 0.009 0.0099 0.011 0.0041 0.004 < 0.0011 < 0.0011Total Cadmium g/m3 0.00088 0.00114 0.0008 0.0013 0.0008 0.00084 0.00058 0.00044 0.000147 0.000108Total Chromium g/m3 0.04 0.04 0.022 0.039 0.065 0.068 0.0111 0.0097 0.0031 0.0024Total Copper g/m3 0.084 0.106 0.053 0.101 0.119 0.125 0.033 0.03 0.0071 0.006Total Lead g/m3 0.064 0.087 0.0194 0.041 0.029 0.03 0.0092 0.0083 0.0026 0.00199Total Nickel g/m3 0.091 0.129 0.065 0.13 0.132 0.139 0.022 0.0194 0.0055 0.0041Total Zinc g/m3 0.29 0.41 0.135 0.26 0.3 0.31 0.072 0.063 0.025 0.021Polycyclic Aromatic Hydrocarbons Trace in Water, By Liq/LiqAcenaphthene g/m3 0.000103 0.000083 0.000033 0.000036 < 0.000008 < 0.000008 < 0.000008 < 0.000008 < 0.000008 < 0.000008Acenaphthylene g/m3 < 0.000008 < 0.000008 < 0.000008 < 0.000008 < 0.000008 < 0.000008 < 0.000008 < 0.000008 < 0.000008 < 0.000008Anthracene g/m3 < 0.000008 < 0.000008 < 0.000008 < 0.000008 < 0.000008 < 0.000008 < 0.000008 < 0.000008 < 0.000008 < 0.000008Benzo[a]anthracene g/m3 < 0.000008 < 0.000008 < 0.000008 < 0.000008 < 0.000008 < 0.000008 < 0.000008 < 0.000008 < 0.000008 < 0.000008Benzo[a]pyrene (BAP) g/m3 < 0.000008 < 0.000008 < 0.000008 < 0.000008 < 0.000008 < 0.000008 < 0.000008 < 0.000008 < 0.000008 < 0.000008Benzo[b]fluoranthene + Benzo[j]fluoranthene g/m3 < 0.000008 < 0.000008 < 0.000008 < 0.000008 < 0.000008 < 0.000008 < 0.000008 < 0.000008 < 0.000008 < 0.000008Benzo[g,h,i]perylene g/m3 < 0.000008 < 0.000008 < 0.000008 < 0.000008 < 0.000008 < 0.000008 < 0.000008 < 0.000008 < 0.000008 < 0.000008Benzo[k]fluoranthene g/m3 < 0.000008 < 0.000008 < 0.000008 < 0.000008 < 0.000008 < 0.000008 < 0.000008 < 0.000008 < 0.000008 < 0.000008Chrysene g/m3 < 0.000008 < 0.000008 < 0.000008 < 0.000008 < 0.000008 < 0.000008 < 0.000008 < 0.000008 < 0.000008 < 0.000008Dibenzo[a,h]anthracene g/m3 < 0.000008 < 0.000008 < 0.000008 < 0.000008 < 0.000008 < 0.000008 < 0.000008 < 0.000008 < 0.000008 < 0.000008Fluoranthene g/m3 0.000072 0.000076 0.00002 0.000022 < 0.000008 < 0.000008 < 0.000008 < 0.000008 < 0.000008 < 0.000008Fluorene g/m3 0.000052 0.000049 0.000022 0.000024 < 0.000008 < 0.000008 < 0.000008 < 0.000008 < 0.000008 < 0.000008Indeno(1,2,3-c,d)pyrene g/m3 < 0.000008 < 0.000008 < 0.000008 < 0.000008 < 0.000008 < 0.000008 < 0.000008 < 0.000008 < 0.000008 < 0.000008Naphthalene g/m3 0.00007 0.00007 0.00004 0.00005 0.00005 0.00006 < 0.00004 < 0.00004 < 0.00004 < 0.00004Phenanthrene g/m3 0.000064 0.000058 < 0.000008 0.000009 < 0.000008 < 0.000008 < 0.000008 < 0.000008 < 0.000008 < 0.000008Pyrene g/m3 0.000099 0.000082 0.000026 0.000032 < 0.000008 < 0.000008 0.000014 0.000013 < 0.000008 < 0.000008Total Petroleum Hydrocarbons in Water 8015C6 - C9 g/m3 < 0.06 < 0.06 < 0.06 < 0.06 < 0.06 < 0.06 < 0.06 < 0.06 < 0.06 < 0.06C10 - C14 g/m3 < 0.04 0.04 0.04 0.05 < 0.04 < 0.04 < 0.04 < 0.04 < 0.04 < 0.04C15 - C36 g/m3 < 0.08 < 0.08 0.13 0.13 < 0.08 < 0.08 < 0.08 0.24 < 0.08 < 0.08Total hydrocarbons (C6 - C36) g/m3 < 0.2 < 0.2 < 0.2 < 0.2 < 0.2 < 0.2 < 0.2 0.2 < 0.2 < 0.2BTEX in VOC Water by Purge&Trap GC-MSBenzene g/m3 < 0.0005 < 0.0005 < 0.0005 < 0.0005 < 0.0005 < 0.0005 < 0.0005 < 0.0005 < 0.0005 < 0.0005Toluene g/m3 < 0.0010 < 0.0010 < 0.0010 < 0.0010 < 0.0010 < 0.0010 < 0.0010 < 0.0010 < 0.0010 < 0.0010Ethylbenzene g/m3 < 0.0005 < 0.0005 < 0.0005 < 0.0005 < 0.0005 < 0.0005 < 0.0005 < 0.0005 < 0.0005 < 0.0005m&p-Xylene g/m3 < 0.0005 < 0.0005 < 0.0005 < 0.0005 < 0.0005 < 0.0005 < 0.0005 < 0.0005 < 0.0005 < 0.0005o-Xylene g/m3 < 0.0005 < 0.0005 < 0.0005 < 0.0005 < 0.0005 < 0.0005 < 0.0005 < 0.0005 < 0.0005 < 0.0005
First Peak Flow of the Season, 14-Dec-2010

ERD
C/CRR
EL TR-14-15
34
Halogenated Aliphatics in VOC Water by Purge&Trap GC-MSBromomethane g/m3 < 0.002 < 0.002 < 0.002 < 0.002 < 0.002 < 0.002 < 0.002 < 0.002 < 0.002 < 0.002Carbon tetrachloride g/m3 < 0.0005 < 0.0005 < 0.0005 < 0.0005 < 0.0005 < 0.0005 < 0.0005 < 0.0005 < 0.0005 < 0.0005Chloroethane g/m3 < 0.0005 < 0.0005 < 0.0005 < 0.0005 < 0.0005 < 0.0005 < 0.0005 < 0.0005 < 0.0005 < 0.0005Chloromethane g/m3 < 0.0005 < 0.0005 < 0.0005 < 0.0005 < 0.0005 < 0.0005 < 0.0005 < 0.0005 < 0.0005 < 0.00051,2-Dibromo-3-chloropropane g/m3 < 0.0005 < 0.0005 < 0.0005 < 0.0005 < 0.0005 < 0.0005 < 0.0005 < 0.0005 < 0.0005 < 0.00051,2-Dibromoethane (ethylene dibromide, EDB) g/m3 < 0.0004 < 0.0004 < 0.0004 < 0.0004 < 0.0004 < 0.0004 < 0.0004 < 0.0004 < 0.0004 < 0.0004Dibromomethane g/m3 < 0.0005 < 0.0005 < 0.0005 < 0.0005 < 0.0005 < 0.0005 < 0.0005 < 0.0005 < 0.0005 < 0.0005Dichlorodifluoromethane g/m3 < 0.0005 < 0.0005 < 0.0005 < 0.0005 < 0.0005 < 0.0005 < 0.0005 < 0.0005 < 0.0005 < 0.00051,1-Dichloroethane g/m3 < 0.0005 < 0.0005 < 0.0005 < 0.0005 < 0.0005 < 0.0005 < 0.0005 < 0.0005 < 0.0005 < 0.00051,2-Dichloroethane g/m3 < 0.0005 < 0.0005 < 0.0005 < 0.0005 < 0.0005 < 0.0005 < 0.0005 < 0.0005 < 0.0005 < 0.00051,1-Dichloroethene g/m3 < 0.0005 < 0.0005 < 0.0005 < 0.0005 < 0.0005 < 0.0005 < 0.0005 < 0.0005 < 0.0005 < 0.0005cis-1,2-Dichloroethene g/m3 < 0.0005 < 0.0005 < 0.0005 < 0.0005 < 0.0005 < 0.0005 < 0.0005 < 0.0005 < 0.0005 < 0.0005trans-1,2-Dichloroethene g/m3 < 0.0005 < 0.0005 < 0.0005 < 0.0005 < 0.0005 < 0.0005 < 0.0005 < 0.0005 < 0.0005 < 0.0005Dichloromethane (methylene chloride) g/m3 < 0.010 < 0.010 < 0.010 < 0.010 < 0.010 < 0.010 < 0.010 < 0.010 < 0.010 < 0.0101,2-Dichloropropane g/m3 < 0.0005 < 0.0005 < 0.0005 < 0.0005 < 0.0005 < 0.0005 < 0.0005 < 0.0005 < 0.0005 < 0.00051,3-Dichloropropane g/m3 < 0.0005 < 0.0005 < 0.0005 < 0.0005 < 0.0005 < 0.0005 < 0.0005 < 0.0005 < 0.0005 < 0.00052,2-Dichloropropane g/m3 < 0.0005 < 0.0005 < 0.0005 < 0.0005 < 0.0005 < 0.0005 < 0.0005 < 0.0005 < 0.0005 < 0.00051,1-Dichloropropene g/m3 < 0.0005 < 0.0005 < 0.0005 < 0.0005 < 0.0005 < 0.0005 < 0.0005 < 0.0005 < 0.0005 < 0.0005cis-1,3-Dichloropropene g/m3 < 0.0005 < 0.0005 < 0.0005 < 0.0005 < 0.0005 < 0.0005 < 0.0005 < 0.0005 < 0.0005 < 0.0005trans-1,3-Dichloropropene g/m3 < 0.0005 < 0.0005 < 0.0005 < 0.0005 < 0.0005 < 0.0005 < 0.0005 < 0.0005 < 0.0005 < 0.0005Hexachlorobutadiene g/m3 < 0.0005 < 0.0005 < 0.0005 < 0.0005 < 0.0005 < 0.0005 < 0.0005 < 0.0005 < 0.0005 < 0.00051,1,1,2-Tetrachloroethane g/m3 < 0.0005 < 0.0005 < 0.0005 < 0.0005 < 0.0005 < 0.0005 < 0.0005 < 0.0005 < 0.0005 < 0.00051,1,2,2-Tetrachloroethane g/m3 < 0.0005 < 0.0005 < 0.0005 < 0.0005 < 0.0005 < 0.0005 < 0.0005 < 0.0005 < 0.0005 < 0.0005Tetrachloroethene (tetrachloroethylene) g/m3 < 0.0005 < 0.0005 < 0.0005 < 0.0005 < 0.0005 < 0.0005 < 0.0005 < 0.0005 < 0.0005 < 0.00051,1,1-Trichloroethane g/m3 < 0.0005 < 0.0005 < 0.0005 < 0.0005 < 0.0005 < 0.0005 < 0.0005 < 0.0005 < 0.0005 < 0.00051,1,2-Trichloroethane g/m3 < 0.0005 < 0.0005 < 0.0005 < 0.0005 < 0.0005 < 0.0005 < 0.0005 < 0.0005 < 0.0005 < 0.0005Trichloroethene (trichloroethylene) g/m3 < 0.0005 < 0.0005 < 0.0005 < 0.0005 < 0.0005 < 0.0005 < 0.0005 < 0.0005 < 0.0005 < 0.0005Trichlorofluoromethane g/m3 < 0.0005 < 0.0005 < 0.0005 < 0.0005 < 0.0005 < 0.0005 < 0.0005 < 0.0005 < 0.0005 < 0.00051,2,3-Trichloropropane g/m3 < 0.0005 < 0.0005 < 0.0005 < 0.0005 < 0.0005 < 0.0005 < 0.0005 < 0.0005 < 0.0005 < 0.00051,1,2-Trichlorotrifluoroethane (Freon 113) g/m3 < 0.004 < 0.004 < 0.004 < 0.004 < 0.004 < 0.004 < 0.004 < 0.004 < 0.004 < 0.004Vinyl chloride g/m3 < 0.0005 < 0.0005 < 0.0005 < 0.0005 < 0.0005 < 0.0005 < 0.0005 < 0.0005 < 0.0005 < 0.0005Halogenated Aromatics in VOC Water by Purge&Trap GC-MSBromobenzene g/m3 < 0.0005 < 0.0005 < 0.0005 < 0.0005 < 0.0005 < 0.0005 < 0.0005 < 0.0005 < 0.0005 < 0.0005Chlorobenzene (monochlorobenzene) g/m3 < 0.0005 < 0.0005 < 0.0005 < 0.0005 < 0.0005 < 0.0005 < 0.0005 < 0.0005 < 0.0005 < 0.00052-Chlorotoluene g/m3 < 0.0005 < 0.0005 < 0.0005 < 0.0005 < 0.0005 < 0.0005 < 0.0005 < 0.0005 < 0.0005 < 0.00054-Chlorotoluene g/m3 < 0.0005 < 0.0005 < 0.0005 < 0.0005 < 0.0005 < 0.0005 < 0.0005 < 0.0005 < 0.0005 < 0.00051,2-Dichlorobenzene g/m3 < 0.0005 < 0.0005 < 0.0005 < 0.0005 < 0.0005 < 0.0005 < 0.0005 < 0.0005 < 0.0005 < 0.00051,3-Dichlorobenzene g/m3 < 0.0005 < 0.0005 < 0.0005 < 0.0005 < 0.0005 < 0.0005 < 0.0005 < 0.0005 < 0.0005 < 0.00051,4-Dichlorobenzene g/m3 < 0.0005 < 0.0005 < 0.0005 < 0.0005 < 0.0005 < 0.0005 < 0.0005 < 0.0005 < 0.0005 < 0.00051,2,3-Trichlorobenzene g/m3 < 0.0005 < 0.0005 < 0.0005 < 0.0005 < 0.0005 < 0.0005 < 0.0005 < 0.0005 < 0.0005 < 0.00051,2,4-Trichlorobenzene g/m3 < 0.0005 < 0.0005 < 0.0005 < 0.0005 < 0.0005 < 0.0005 < 0.0005 < 0.0005 < 0.0005 < 0.00051,3,5-Trichlorobenzene g/m3 < 0.0005 < 0.0005 < 0.0005 < 0.0005 < 0.0005 < 0.0005 < 0.0005 < 0.0005 < 0.0005 < 0.0005

ERD
C/CRR
EL TR-14-15
35
Monoaromatic Hydrocarbons in VOC Water by Purge&Trap GC-MSn-Butylbenzene g/m3 < 0.0005 < 0.0005 < 0.0005 < 0.0005 < 0.0005 < 0.0005 < 0.0005 < 0.0005 < 0.0005 < 0.0005tert-Butylbenzene g/m3 < 0.0005 < 0.0005 < 0.0005 < 0.0005 < 0.0005 < 0.0005 < 0.0005 < 0.0005 < 0.0005 < 0.0005Isopropylbenzene (Cumene) g/m3 < 0.0005 < 0.0005 < 0.0005 < 0.0005 < 0.0005 < 0.0005 < 0.0005 < 0.0005 < 0.0005 < 0.00054-Isopropyltoluene (p-Cymene) g/m3 < 0.0005 < 0.0005 < 0.0005 < 0.0005 < 0.0005 < 0.0005 < 0.0005 < 0.0005 < 0.0005 < 0.0005n-Propylbenzene g/m3 < 0.0005 < 0.0005 < 0.0005 < 0.0005 < 0.0005 < 0.0005 < 0.0005 < 0.0005 < 0.0005 < 0.0005sec-Butylbenzene g/m3 < 0.0005 < 0.0005 < 0.0005 < 0.0005 < 0.0005 < 0.0005 < 0.0005 < 0.0005 < 0.0005 < 0.0005Styrene g/m3 < 0.0005 < 0.0005 < 0.0005 < 0.0005 < 0.0005 < 0.0005 < 0.0005 < 0.0005 < 0.0005 < 0.00051,2,4-Trimethylbenzene g/m3 0.0007 0.0006 < 0.0005 0.0008 < 0.0005 < 0.0005 < 0.0005 < 0.0005 < 0.0005 < 0.00051,3,5-Trimethylbenzene g/m3 < 0.0005 < 0.0005 < 0.0005 < 0.0005 < 0.0005 < 0.0005 < 0.0005 < 0.0005 < 0.0005 < 0.0005Ketones in VOC Water by Purge&Trap GC-MSAcetone g/m3 < 0.05 < 0.05 < 0.05 < 0.05 < 0.05 < 0.05 < 0.05 < 0.05 < 0.05 < 0.052-Butanone (MEK) g/m3 < 0.005 < 0.005 < 0.005 < 0.005 < 0.005 < 0.005 < 0.005 < 0.005 < 0.005 < 0.005Methyl tert-butylether (MTBE) g/m3 < 0.005 < 0.005 < 0.005 < 0.005 < 0.005 < 0.005 < 0.005 < 0.005 < 0.005 < 0.0054-Methylpentan-2-one (MIBK) g/m3 < 0.005 < 0.005 < 0.005 < 0.005 < 0.005 < 0.005 < 0.005 < 0.005 < 0.005 < 0.005Trihalomethanes in VOC Water by Purge&Trap GC-MSBromodichloromethane g/m3 < 0.0005 < 0.0005 < 0.0005 < 0.0005 < 0.0005 < 0.0005 < 0.0005 < 0.0005 < 0.0005 < 0.0005Bromoform (tribromomethane) g/m3 < 0.0005 < 0.0005 < 0.0005 < 0.0005 < 0.0005 < 0.0005 < 0.0005 < 0.0005 < 0.0005 < 0.0005Chloroform (Trichloromethane) g/m3 < 0.0005 < 0.0005 < 0.0005 < 0.0005 < 0.0005 < 0.0005 < 0.0005 < 0.0005 < 0.0005 < 0.0005Dibromochloromethane g/m3 < 0.0005 < 0.0005 < 0.0005 < 0.0005 < 0.0005 < 0.0005 < 0.0005 < 0.0005 < 0.0005 < 0.0005Other VOC in Water by Purge&Trap GC-MSCarbon disulphide g/m3 < 0.005 < 0.005 < 0.005 < 0.005 < 0.005 < 0.005 < 0.005 < 0.005 < 0.005 < 0.005Naphthalene g/m3 < 0.0005 < 0.0005 < 0.0005 < 0.0005 < 0.0005 < 0.0005 < 0.0005 < 0.0005 < 0.0005 < 0.0005System monitoring Compounds for VOC - % Recovery4-Bromofluorobenzene % 104 101 109 81 108 103 101 101 101 101Toluene-d8 % 102 104 102 103 104 102 102 102 103 102
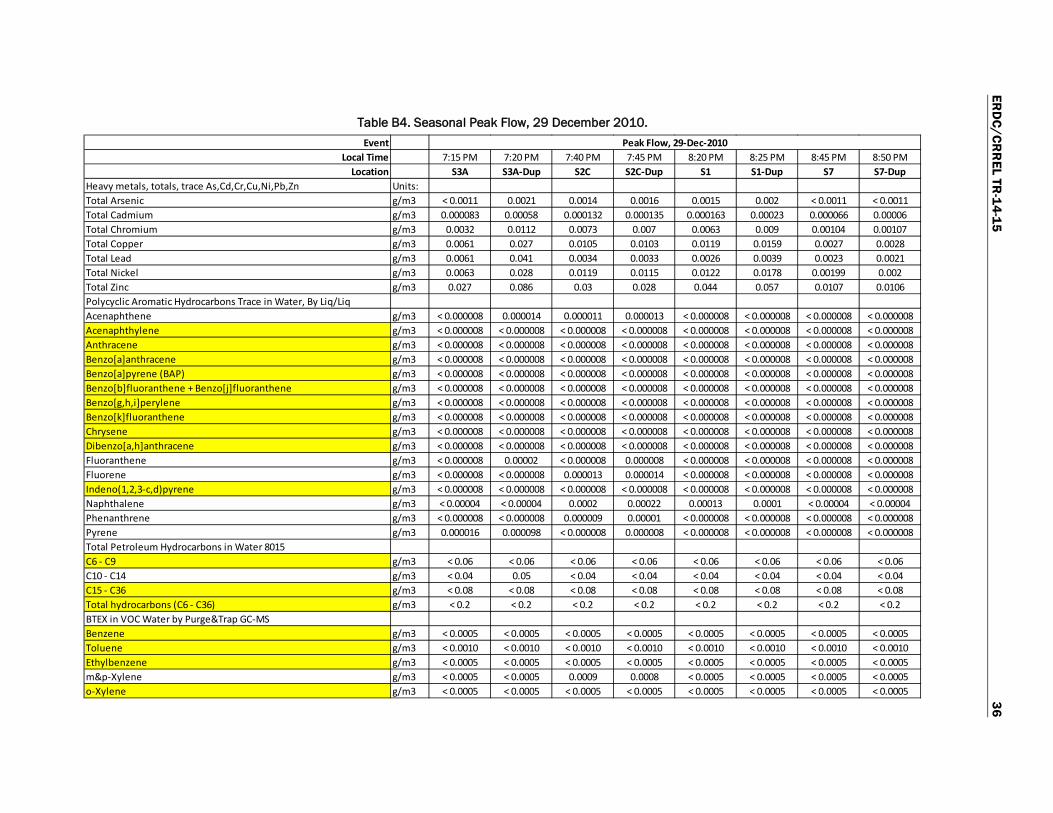
ERD
C/CRR
EL TR-14-15
36
Table B4. Seasonal Peak Flow, 29 December 2010.
EventLocal Time 7:15 PM 7:20 PM 7:40 PM 7:45 PM 8:20 PM 8:25 PM 8:45 PM 8:50 PM
Location S3A S3A-Dup S2C S2C-Dup S1 S1-Dup S7 S7-DupHeavy metals, totals, trace As,Cd,Cr,Cu,Ni,Pb,Zn Units:Total Arsenic g/m3 < 0.0011 0.0021 0.0014 0.0016 0.0015 0.002 < 0.0011 < 0.0011Total Cadmium g/m3 0.000083 0.00058 0.000132 0.000135 0.000163 0.00023 0.000066 0.00006Total Chromium g/m3 0.0032 0.0112 0.0073 0.007 0.0063 0.009 0.00104 0.00107Total Copper g/m3 0.0061 0.027 0.0105 0.0103 0.0119 0.0159 0.0027 0.0028Total Lead g/m3 0.0061 0.041 0.0034 0.0033 0.0026 0.0039 0.0023 0.0021Total Nickel g/m3 0.0063 0.028 0.0119 0.0115 0.0122 0.0178 0.00199 0.002Total Zinc g/m3 0.027 0.086 0.03 0.028 0.044 0.057 0.0107 0.0106Polycyclic Aromatic Hydrocarbons Trace in Water, By Liq/LiqAcenaphthene g/m3 < 0.000008 0.000014 0.000011 0.000013 < 0.000008 < 0.000008 < 0.000008 < 0.000008Acenaphthylene g/m3 < 0.000008 < 0.000008 < 0.000008 < 0.000008 < 0.000008 < 0.000008 < 0.000008 < 0.000008Anthracene g/m3 < 0.000008 < 0.000008 < 0.000008 < 0.000008 < 0.000008 < 0.000008 < 0.000008 < 0.000008Benzo[a]anthracene g/m3 < 0.000008 < 0.000008 < 0.000008 < 0.000008 < 0.000008 < 0.000008 < 0.000008 < 0.000008Benzo[a]pyrene (BAP) g/m3 < 0.000008 < 0.000008 < 0.000008 < 0.000008 < 0.000008 < 0.000008 < 0.000008 < 0.000008Benzo[b]fluoranthene + Benzo[j]fluoranthene g/m3 < 0.000008 < 0.000008 < 0.000008 < 0.000008 < 0.000008 < 0.000008 < 0.000008 < 0.000008Benzo[g,h,i]perylene g/m3 < 0.000008 < 0.000008 < 0.000008 < 0.000008 < 0.000008 < 0.000008 < 0.000008 < 0.000008Benzo[k]fluoranthene g/m3 < 0.000008 < 0.000008 < 0.000008 < 0.000008 < 0.000008 < 0.000008 < 0.000008 < 0.000008Chrysene g/m3 < 0.000008 < 0.000008 < 0.000008 < 0.000008 < 0.000008 < 0.000008 < 0.000008 < 0.000008Dibenzo[a,h]anthracene g/m3 < 0.000008 < 0.000008 < 0.000008 < 0.000008 < 0.000008 < 0.000008 < 0.000008 < 0.000008Fluoranthene g/m3 < 0.000008 0.00002 < 0.000008 0.000008 < 0.000008 < 0.000008 < 0.000008 < 0.000008Fluorene g/m3 < 0.000008 < 0.000008 0.000013 0.000014 < 0.000008 < 0.000008 < 0.000008 < 0.000008Indeno(1,2,3-c,d)pyrene g/m3 < 0.000008 < 0.000008 < 0.000008 < 0.000008 < 0.000008 < 0.000008 < 0.000008 < 0.000008Naphthalene g/m3 < 0.00004 < 0.00004 0.0002 0.00022 0.00013 0.0001 < 0.00004 < 0.00004Phenanthrene g/m3 < 0.000008 < 0.000008 0.000009 0.00001 < 0.000008 < 0.000008 < 0.000008 < 0.000008Pyrene g/m3 0.000016 0.000098 < 0.000008 0.000008 < 0.000008 < 0.000008 < 0.000008 < 0.000008Total Petroleum Hydrocarbons in Water 8015C6 - C9 g/m3 < 0.06 < 0.06 < 0.06 < 0.06 < 0.06 < 0.06 < 0.06 < 0.06C10 - C14 g/m3 < 0.04 0.05 < 0.04 < 0.04 < 0.04 < 0.04 < 0.04 < 0.04C15 - C36 g/m3 < 0.08 < 0.08 < 0.08 < 0.08 < 0.08 < 0.08 < 0.08 < 0.08Total hydrocarbons (C6 - C36) g/m3 < 0.2 < 0.2 < 0.2 < 0.2 < 0.2 < 0.2 < 0.2 < 0.2BTEX in VOC Water by Purge&Trap GC-MSBenzene g/m3 < 0.0005 < 0.0005 < 0.0005 < 0.0005 < 0.0005 < 0.0005 < 0.0005 < 0.0005Toluene g/m3 < 0.0010 < 0.0010 < 0.0010 < 0.0010 < 0.0010 < 0.0010 < 0.0010 < 0.0010Ethylbenzene g/m3 < 0.0005 < 0.0005 < 0.0005 < 0.0005 < 0.0005 < 0.0005 < 0.0005 < 0.0005m&p-Xylene g/m3 < 0.0005 < 0.0005 0.0009 0.0008 < 0.0005 < 0.0005 < 0.0005 < 0.0005o-Xylene g/m3 < 0.0005 < 0.0005 < 0.0005 < 0.0005 < 0.0005 < 0.0005 < 0.0005 < 0.0005
Peak Flow, 29-Dec-2010

ERD
C/CRR
EL TR-14-15
37
Halogenated Aliphatics in VOC Water by Purge&Trap GC-MSBromomethane g/m3 < 0.002 < 0.002 < 0.002 < 0.002 < 0.002 < 0.002 < 0.002 < 0.002Carbon tetrachloride g/m3 < 0.0005 < 0.0005 < 0.0005 < 0.0005 < 0.0005 < 0.0005 < 0.0005 < 0.0005Chloroethane g/m3 < 0.0005 < 0.0005 < 0.0005 < 0.0005 < 0.0005 < 0.0005 < 0.0005 < 0.0005Chloromethane g/m3 < 0.0005 < 0.0005 < 0.0005 < 0.0005 < 0.0005 < 0.0005 < 0.0005 < 0.00051,2-Dibromo-3-chloropropane g/m3 < 0.0005 < 0.0005 < 0.0005 < 0.0005 < 0.0005 < 0.0005 < 0.0005 < 0.00051,2-Dibromoethane (ethylene dibromide, EDB) g/m3 < 0.0004 < 0.0004 < 0.0004 < 0.0004 < 0.0004 < 0.0004 < 0.0004 < 0.0004Dibromomethane g/m3 < 0.0005 < 0.0005 < 0.0005 < 0.0005 < 0.0005 < 0.0005 < 0.0005 < 0.0005Dichlorodifluoromethane g/m3 < 0.0005 < 0.0005 < 0.0005 < 0.0005 < 0.0005 < 0.0005 < 0.0005 < 0.00051,1-Dichloroethane g/m3 < 0.0005 < 0.0005 < 0.0005 < 0.0005 < 0.0005 < 0.0005 < 0.0005 < 0.00051,2-Dichloroethane g/m3 < 0.0005 < 0.0005 < 0.0005 < 0.0005 < 0.0005 < 0.0005 < 0.0005 < 0.00051,1-Dichloroethene g/m3 < 0.0005 < 0.0005 < 0.0005 < 0.0005 < 0.0005 < 0.0005 < 0.0005 < 0.0005cis-1,2-Dichloroethene g/m3 < 0.0005 < 0.0005 < 0.0005 < 0.0005 < 0.0005 < 0.0005 < 0.0005 < 0.0005trans-1,2-Dichloroethene g/m3 < 0.0005 < 0.0005 < 0.0005 < 0.0005 < 0.0005 < 0.0005 < 0.0005 < 0.0005Dichloromethane (methylene chloride) g/m3 < 0.010 < 0.010 < 0.010 < 0.010 < 0.010 < 0.010 < 0.010 < 0.0101,2-Dichloropropane g/m3 < 0.0005 < 0.0005 < 0.0005 < 0.0005 < 0.0005 < 0.0005 < 0.0005 < 0.00051,3-Dichloropropane g/m3 < 0.0005 < 0.0005 < 0.0005 < 0.0005 < 0.0005 < 0.0005 < 0.0005 < 0.00052,2-Dichloropropane g/m3 < 0.0005 < 0.0005 < 0.0005 < 0.0005 < 0.0005 < 0.0005 < 0.0005 < 0.00051,1-Dichloropropene g/m3 < 0.0005 < 0.0005 < 0.0005 < 0.0005 < 0.0005 < 0.0005 < 0.0005 < 0.0005cis-1,3-Dichloropropene g/m3 < 0.0005 < 0.0005 < 0.0005 < 0.0005 < 0.0005 < 0.0005 < 0.0005 < 0.0005trans-1,3-Dichloropropene g/m3 < 0.0005 < 0.0005 < 0.0005 < 0.0005 < 0.0005 < 0.0005 < 0.0005 < 0.0005Hexachlorobutadiene g/m3 < 0.0005 < 0.0005 < 0.0005 < 0.0005 < 0.0005 < 0.0005 < 0.0005 < 0.00051,1,1,2-Tetrachloroethane g/m3 < 0.0005 < 0.0005 < 0.0005 < 0.0005 < 0.0005 < 0.0005 < 0.0005 < 0.00051,1,2,2-Tetrachloroethane g/m3 < 0.0005 < 0.0005 < 0.0005 < 0.0005 < 0.0005 < 0.0005 < 0.0005 < 0.0005Tetrachloroethene (tetrachloroethylene) g/m3 < 0.0005 < 0.0005 < 0.0005 < 0.0005 < 0.0005 < 0.0005 < 0.0005 < 0.00051,1,1-Trichloroethane g/m3 < 0.0005 < 0.0005 < 0.0005 < 0.0005 < 0.0005 < 0.0005 < 0.0005 < 0.00051,1,2-Trichloroethane g/m3 < 0.0005 < 0.0005 < 0.0005 < 0.0005 < 0.0005 < 0.0005 < 0.0005 < 0.0005Trichloroethene (trichloroethylene) g/m3 < 0.0005 < 0.0005 < 0.0005 < 0.0005 < 0.0005 < 0.0005 < 0.0005 < 0.0005Trichlorofluoromethane g/m3 < 0.0005 < 0.0005 < 0.0005 < 0.0005 < 0.0005 < 0.0005 < 0.0005 < 0.00051,2,3-Trichloropropane g/m3 < 0.0005 < 0.0005 < 0.0005 < 0.0005 < 0.0005 < 0.0005 < 0.0005 < 0.00051,1,2-Trichlorotrifluoroethane (Freon 113) g/m3 < 0.004 < 0.004 < 0.004 < 0.004 < 0.004 < 0.004 < 0.004 < 0.004Vinyl chloride g/m3 < 0.0005 < 0.0005 < 0.0005 < 0.0005 < 0.0005 < 0.0005 < 0.0005 < 0.0005
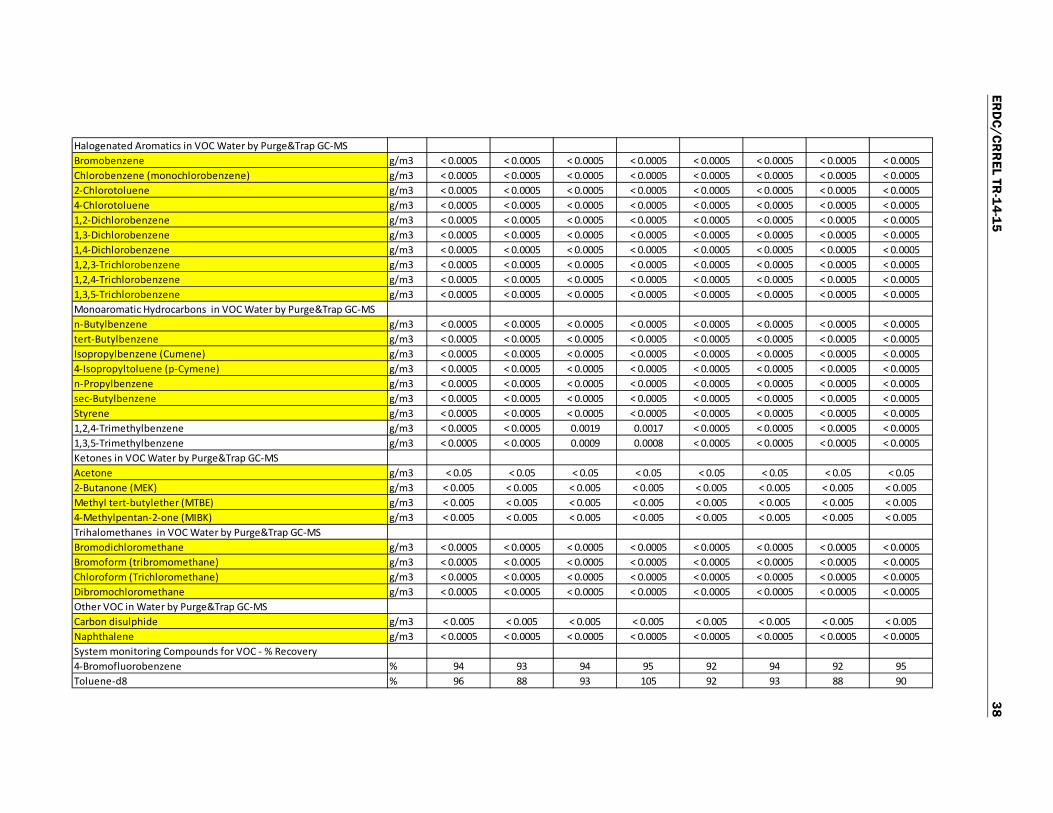
ERD
C/CRR
EL TR-14-15
38
Halogenated Aromatics in VOC Water by Purge&Trap GC-MSBromobenzene g/m3 < 0.0005 < 0.0005 < 0.0005 < 0.0005 < 0.0005 < 0.0005 < 0.0005 < 0.0005Chlorobenzene (monochlorobenzene) g/m3 < 0.0005 < 0.0005 < 0.0005 < 0.0005 < 0.0005 < 0.0005 < 0.0005 < 0.00052-Chlorotoluene g/m3 < 0.0005 < 0.0005 < 0.0005 < 0.0005 < 0.0005 < 0.0005 < 0.0005 < 0.00054-Chlorotoluene g/m3 < 0.0005 < 0.0005 < 0.0005 < 0.0005 < 0.0005 < 0.0005 < 0.0005 < 0.00051,2-Dichlorobenzene g/m3 < 0.0005 < 0.0005 < 0.0005 < 0.0005 < 0.0005 < 0.0005 < 0.0005 < 0.00051,3-Dichlorobenzene g/m3 < 0.0005 < 0.0005 < 0.0005 < 0.0005 < 0.0005 < 0.0005 < 0.0005 < 0.00051,4-Dichlorobenzene g/m3 < 0.0005 < 0.0005 < 0.0005 < 0.0005 < 0.0005 < 0.0005 < 0.0005 < 0.00051,2,3-Trichlorobenzene g/m3 < 0.0005 < 0.0005 < 0.0005 < 0.0005 < 0.0005 < 0.0005 < 0.0005 < 0.00051,2,4-Trichlorobenzene g/m3 < 0.0005 < 0.0005 < 0.0005 < 0.0005 < 0.0005 < 0.0005 < 0.0005 < 0.00051,3,5-Trichlorobenzene g/m3 < 0.0005 < 0.0005 < 0.0005 < 0.0005 < 0.0005 < 0.0005 < 0.0005 < 0.0005Monoaromatic Hydrocarbons in VOC Water by Purge&Trap GC-MSn-Butylbenzene g/m3 < 0.0005 < 0.0005 < 0.0005 < 0.0005 < 0.0005 < 0.0005 < 0.0005 < 0.0005tert-Butylbenzene g/m3 < 0.0005 < 0.0005 < 0.0005 < 0.0005 < 0.0005 < 0.0005 < 0.0005 < 0.0005Isopropylbenzene (Cumene) g/m3 < 0.0005 < 0.0005 < 0.0005 < 0.0005 < 0.0005 < 0.0005 < 0.0005 < 0.00054-Isopropyltoluene (p-Cymene) g/m3 < 0.0005 < 0.0005 < 0.0005 < 0.0005 < 0.0005 < 0.0005 < 0.0005 < 0.0005n-Propylbenzene g/m3 < 0.0005 < 0.0005 < 0.0005 < 0.0005 < 0.0005 < 0.0005 < 0.0005 < 0.0005sec-Butylbenzene g/m3 < 0.0005 < 0.0005 < 0.0005 < 0.0005 < 0.0005 < 0.0005 < 0.0005 < 0.0005Styrene g/m3 < 0.0005 < 0.0005 < 0.0005 < 0.0005 < 0.0005 < 0.0005 < 0.0005 < 0.00051,2,4-Trimethylbenzene g/m3 < 0.0005 < 0.0005 0.0019 0.0017 < 0.0005 < 0.0005 < 0.0005 < 0.00051,3,5-Trimethylbenzene g/m3 < 0.0005 < 0.0005 0.0009 0.0008 < 0.0005 < 0.0005 < 0.0005 < 0.0005Ketones in VOC Water by Purge&Trap GC-MSAcetone g/m3 < 0.05 < 0.05 < 0.05 < 0.05 < 0.05 < 0.05 < 0.05 < 0.052-Butanone (MEK) g/m3 < 0.005 < 0.005 < 0.005 < 0.005 < 0.005 < 0.005 < 0.005 < 0.005Methyl tert-butylether (MTBE) g/m3 < 0.005 < 0.005 < 0.005 < 0.005 < 0.005 < 0.005 < 0.005 < 0.0054-Methylpentan-2-one (MIBK) g/m3 < 0.005 < 0.005 < 0.005 < 0.005 < 0.005 < 0.005 < 0.005 < 0.005Trihalomethanes in VOC Water by Purge&Trap GC-MSBromodichloromethane g/m3 < 0.0005 < 0.0005 < 0.0005 < 0.0005 < 0.0005 < 0.0005 < 0.0005 < 0.0005Bromoform (tribromomethane) g/m3 < 0.0005 < 0.0005 < 0.0005 < 0.0005 < 0.0005 < 0.0005 < 0.0005 < 0.0005Chloroform (Trichloromethane) g/m3 < 0.0005 < 0.0005 < 0.0005 < 0.0005 < 0.0005 < 0.0005 < 0.0005 < 0.0005Dibromochloromethane g/m3 < 0.0005 < 0.0005 < 0.0005 < 0.0005 < 0.0005 < 0.0005 < 0.0005 < 0.0005Other VOC in Water by Purge&Trap GC-MSCarbon disulphide g/m3 < 0.005 < 0.005 < 0.005 < 0.005 < 0.005 < 0.005 < 0.005 < 0.005Naphthalene g/m3 < 0.0005 < 0.0005 < 0.0005 < 0.0005 < 0.0005 < 0.0005 < 0.0005 < 0.0005System monitoring Compounds for VOC - % Recovery4-Bromofluorobenzene % 94 93 94 95 92 94 92 95Toluene-d8 % 96 88 93 105 92 93 88 90

ERD
C/CRR
EL TR-14-15
39
Table B5. Seasonal Peak Flow, 17 January 2010.
EventLocal Time 8:07 PM 8:12 PM 8:27 PM 8:32 PM 8:45 PM 8:50 PM 9:20 PM 9:25 PM
Location S3A S3A-Dup S2C S2C-Dup S2B S2B-Dup S1 S1-DupHeavy metals, totals, trace As,Cd,Cr,Cu,Ni,Pb,Zn Units:Total Arsenic g/m3 0.0016 0.0019 0.0022 0.002 0.0016 0.0019 0.0019 0.0019Total Cadmium g/m3 0.00022 0.00021 0.000174 0.000143 0.000164 0.000171 0.000182 0.000171Total Chromium g/m3 0.0104 0.0103 0.0088 0.0079 0.0081 0.0089 0.0079 0.0075Total Copper g/m3 0.0162 0.0161 0.0133 0.0134 0.0163 0.0131 0.0123 0.0124Total Lead g/m3 0.0052 0.0052 0.0033 0.0031 0.0039 0.0071 0.0026 0.0026Total Nickel g/m3 0.0171 0.0175 0.0143 0.014 0.0147 0.0142 0.0124 0.0131Total Zinc g/m3 0.062 0.061 0.037 0.035 0.051 0.05 0.06 0.062Polycyclic Aromatic Hydrocarbons Trace in Water, By Liq/LiqAcenaphthene g/m3 < 0.000008 < 0.000008 0.00002 0.000021 < 0.000008 < 0.000008 < 0.000008 < 0.000008Acenaphthylene g/m3 < 0.000008 < 0.000008 < 0.000008 < 0.000008 < 0.000008 < 0.000008 < 0.000008 < 0.000008Anthracene g/m3 < 0.000008 < 0.000008 < 0.000008 < 0.000008 < 0.000008 < 0.000008 < 0.000008 < 0.000008Benzo[a]anthracene g/m3 < 0.000008 < 0.000008 < 0.000008 < 0.000008 < 0.000008 < 0.000008 < 0.000008 < 0.000008Benzo[a]pyrene (BAP) g/m3 < 0.000008 < 0.000008 < 0.000008 < 0.000008 < 0.000008 < 0.000008 < 0.000008 < 0.000008Benzo[b]fluoranthene + Benzo[j]fluoranthene g/m3 < 0.000008 < 0.000008 < 0.000008 < 0.000008 < 0.000008 < 0.000008 < 0.000008 < 0.000008Benzo[g,h,i]perylene g/m3 < 0.000008 < 0.000008 < 0.000008 < 0.000008 < 0.000008 < 0.000008 < 0.000008 < 0.000008Benzo[k]fluoranthene g/m3 < 0.000008 < 0.000008 < 0.000008 < 0.000008 < 0.000008 < 0.000008 < 0.000008 < 0.000008Chrysene g/m3 < 0.000008 < 0.000008 < 0.000008 < 0.000008 < 0.000008 < 0.000008 < 0.000008 < 0.000008Dibenzo[a,h]anthracene g/m3 < 0.000008 < 0.000008 < 0.000008 < 0.000008 < 0.000008 < 0.000008 < 0.000008 < 0.000008Fluoranthene g/m3 < 0.000008 < 0.000008 0.000012 0.000012 < 0.000008 < 0.000008 < 0.000008 < 0.000008Fluorene g/m3 < 0.000008 < 0.000008 0.000016 0.000017 < 0.000008 < 0.000008 < 0.000008 < 0.000008Indeno(1,2,3-c,d)pyrene g/m3 < 0.000008 < 0.000008 < 0.000008 < 0.000008 < 0.000008 < 0.000008 < 0.000008 < 0.000008Naphthalene g/m3 < 0.00004 < 0.00004 0.00009 0.00009 < 0.00004 < 0.00004 0.00005 0.00006Phenanthrene g/m3 < 0.000008 < 0.000008 0.000015 0.000015 < 0.000008 < 0.000008 < 0.000008 < 0.000008Pyrene g/m3 < 0.000008 0.000009 0.000011 0.000012 0.000012 0.000012 < 0.000008 < 0.000008Total Petroleum Hydrocarbons in Water 8015C6 - C9 g/m3 < 0.06 < 0.06 < 0.06 < 0.06 < 0.06 < 0.06 < 0.06 < 0.06C10 - C14 g/m3 < 0.04 < 0.04 < 0.04 < 0.04 < 0.04 < 0.04 < 0.04 0.05C15 - C36 g/m3 < 0.08 < 0.08 < 0.08 < 0.08 < 0.08 < 0.08 < 0.08 < 0.08Total hydrocarbons (C6 - C36) g/m3 < 0.2 < 0.2 < 0.2 < 0.2 < 0.2 < 0.2 < 0.2 < 0.2BTEX in VOC Water by Purge&Trap GC-MSBenzene g/m3 < 0.0005 < 0.0005 < 0.0005 < 0.0005 < 0.0005 < 0.0005 < 0.0005 < 0.0005Toluene g/m3 < 0.0010 < 0.0010 < 0.0010 < 0.0010 < 0.0010 < 0.0010 < 0.0010 < 0.0010Ethylbenzene g/m3 < 0.0005 < 0.0005 < 0.0005 < 0.0005 < 0.0005 < 0.0005 < 0.0005 < 0.0005m&p-Xylene g/m3 < 0.0005 < 0.0005 < 0.0005 < 0.0005 < 0.0005 < 0.0005 < 0.0005 < 0.0005o-Xylene g/m3 < 0.0005 < 0.0005 < 0.0005 < 0.0005 < 0.0005 < 0.0005 < 0.0005 < 0.0005
Peak Flow, 17-Jan-2011
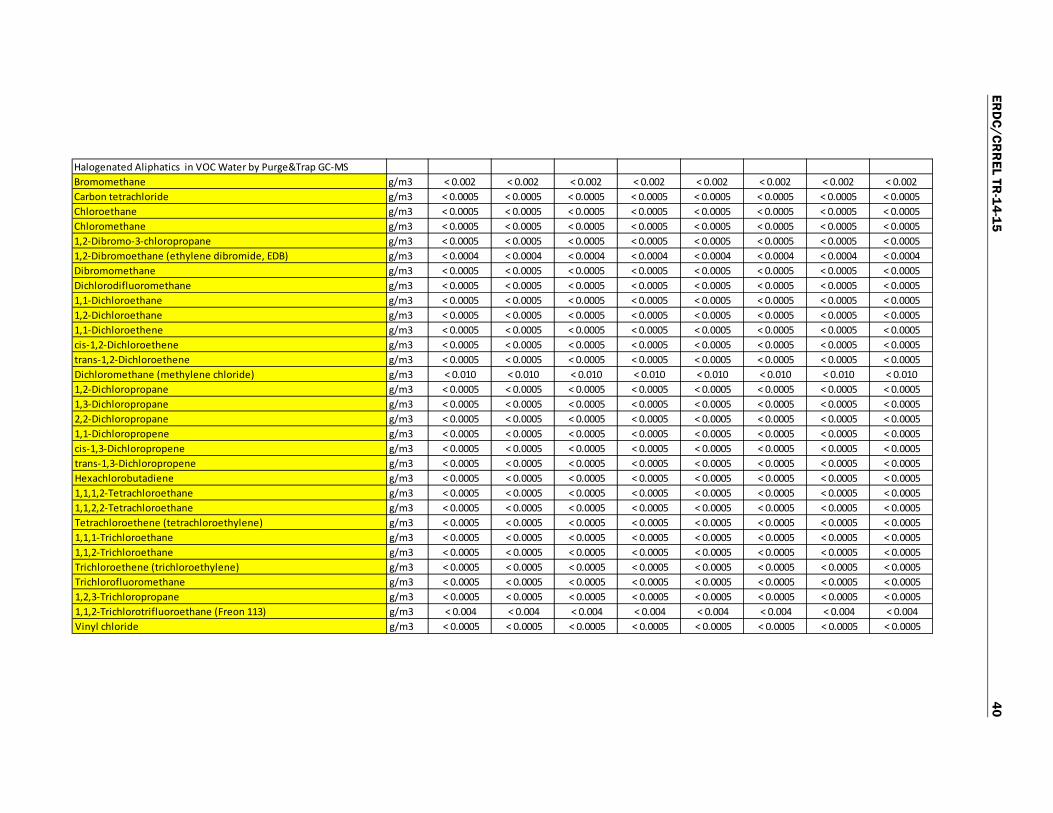
ERD
C/CRR
EL TR-14-15
40
Halogenated Aliphatics in VOC Water by Purge&Trap GC-MSBromomethane g/m3 < 0.002 < 0.002 < 0.002 < 0.002 < 0.002 < 0.002 < 0.002 < 0.002Carbon tetrachloride g/m3 < 0.0005 < 0.0005 < 0.0005 < 0.0005 < 0.0005 < 0.0005 < 0.0005 < 0.0005Chloroethane g/m3 < 0.0005 < 0.0005 < 0.0005 < 0.0005 < 0.0005 < 0.0005 < 0.0005 < 0.0005Chloromethane g/m3 < 0.0005 < 0.0005 < 0.0005 < 0.0005 < 0.0005 < 0.0005 < 0.0005 < 0.00051,2-Dibromo-3-chloropropane g/m3 < 0.0005 < 0.0005 < 0.0005 < 0.0005 < 0.0005 < 0.0005 < 0.0005 < 0.00051,2-Dibromoethane (ethylene dibromide, EDB) g/m3 < 0.0004 < 0.0004 < 0.0004 < 0.0004 < 0.0004 < 0.0004 < 0.0004 < 0.0004Dibromomethane g/m3 < 0.0005 < 0.0005 < 0.0005 < 0.0005 < 0.0005 < 0.0005 < 0.0005 < 0.0005Dichlorodifluoromethane g/m3 < 0.0005 < 0.0005 < 0.0005 < 0.0005 < 0.0005 < 0.0005 < 0.0005 < 0.00051,1-Dichloroethane g/m3 < 0.0005 < 0.0005 < 0.0005 < 0.0005 < 0.0005 < 0.0005 < 0.0005 < 0.00051,2-Dichloroethane g/m3 < 0.0005 < 0.0005 < 0.0005 < 0.0005 < 0.0005 < 0.0005 < 0.0005 < 0.00051,1-Dichloroethene g/m3 < 0.0005 < 0.0005 < 0.0005 < 0.0005 < 0.0005 < 0.0005 < 0.0005 < 0.0005cis-1,2-Dichloroethene g/m3 < 0.0005 < 0.0005 < 0.0005 < 0.0005 < 0.0005 < 0.0005 < 0.0005 < 0.0005trans-1,2-Dichloroethene g/m3 < 0.0005 < 0.0005 < 0.0005 < 0.0005 < 0.0005 < 0.0005 < 0.0005 < 0.0005Dichloromethane (methylene chloride) g/m3 < 0.010 < 0.010 < 0.010 < 0.010 < 0.010 < 0.010 < 0.010 < 0.0101,2-Dichloropropane g/m3 < 0.0005 < 0.0005 < 0.0005 < 0.0005 < 0.0005 < 0.0005 < 0.0005 < 0.00051,3-Dichloropropane g/m3 < 0.0005 < 0.0005 < 0.0005 < 0.0005 < 0.0005 < 0.0005 < 0.0005 < 0.00052,2-Dichloropropane g/m3 < 0.0005 < 0.0005 < 0.0005 < 0.0005 < 0.0005 < 0.0005 < 0.0005 < 0.00051,1-Dichloropropene g/m3 < 0.0005 < 0.0005 < 0.0005 < 0.0005 < 0.0005 < 0.0005 < 0.0005 < 0.0005cis-1,3-Dichloropropene g/m3 < 0.0005 < 0.0005 < 0.0005 < 0.0005 < 0.0005 < 0.0005 < 0.0005 < 0.0005trans-1,3-Dichloropropene g/m3 < 0.0005 < 0.0005 < 0.0005 < 0.0005 < 0.0005 < 0.0005 < 0.0005 < 0.0005Hexachlorobutadiene g/m3 < 0.0005 < 0.0005 < 0.0005 < 0.0005 < 0.0005 < 0.0005 < 0.0005 < 0.00051,1,1,2-Tetrachloroethane g/m3 < 0.0005 < 0.0005 < 0.0005 < 0.0005 < 0.0005 < 0.0005 < 0.0005 < 0.00051,1,2,2-Tetrachloroethane g/m3 < 0.0005 < 0.0005 < 0.0005 < 0.0005 < 0.0005 < 0.0005 < 0.0005 < 0.0005Tetrachloroethene (tetrachloroethylene) g/m3 < 0.0005 < 0.0005 < 0.0005 < 0.0005 < 0.0005 < 0.0005 < 0.0005 < 0.00051,1,1-Trichloroethane g/m3 < 0.0005 < 0.0005 < 0.0005 < 0.0005 < 0.0005 < 0.0005 < 0.0005 < 0.00051,1,2-Trichloroethane g/m3 < 0.0005 < 0.0005 < 0.0005 < 0.0005 < 0.0005 < 0.0005 < 0.0005 < 0.0005Trichloroethene (trichloroethylene) g/m3 < 0.0005 < 0.0005 < 0.0005 < 0.0005 < 0.0005 < 0.0005 < 0.0005 < 0.0005Trichlorofluoromethane g/m3 < 0.0005 < 0.0005 < 0.0005 < 0.0005 < 0.0005 < 0.0005 < 0.0005 < 0.00051,2,3-Trichloropropane g/m3 < 0.0005 < 0.0005 < 0.0005 < 0.0005 < 0.0005 < 0.0005 < 0.0005 < 0.00051,1,2-Trichlorotrifluoroethane (Freon 113) g/m3 < 0.004 < 0.004 < 0.004 < 0.004 < 0.004 < 0.004 < 0.004 < 0.004Vinyl chloride g/m3 < 0.0005 < 0.0005 < 0.0005 < 0.0005 < 0.0005 < 0.0005 < 0.0005 < 0.0005

ERD
C/CRR
EL TR-14-15
41
Halogenated Aromatics in VOC Water by Purge&Trap GC-MSBromobenzene g/m3 < 0.0005 < 0.0005 < 0.0005 < 0.0005 < 0.0005 < 0.0005 < 0.0005 < 0.0005Chlorobenzene (monochlorobenzene) g/m3 < 0.0005 < 0.0005 < 0.0005 < 0.0005 < 0.0005 < 0.0005 < 0.0005 < 0.00052-Chlorotoluene g/m3 < 0.0005 < 0.0005 < 0.0005 < 0.0005 < 0.0005 < 0.0005 < 0.0005 < 0.00054-Chlorotoluene g/m3 < 0.0005 < 0.0005 < 0.0005 < 0.0005 < 0.0005 < 0.0005 < 0.0005 < 0.00051,2-Dichlorobenzene g/m3 < 0.0005 < 0.0005 < 0.0005 < 0.0005 < 0.0005 < 0.0005 < 0.0005 < 0.00051,3-Dichlorobenzene g/m3 < 0.0005 < 0.0005 < 0.0005 < 0.0005 < 0.0005 < 0.0005 < 0.0005 < 0.00051,4-Dichlorobenzene g/m3 < 0.0005 < 0.0005 < 0.0005 < 0.0005 < 0.0005 < 0.0005 < 0.0005 < 0.00051,2,3-Trichlorobenzene g/m3 < 0.0005 < 0.0005 < 0.0005 < 0.0005 < 0.0005 < 0.0005 < 0.0005 < 0.00051,2,4-Trichlorobenzene g/m3 < 0.0005 < 0.0005 < 0.0005 < 0.0005 < 0.0005 < 0.0005 < 0.0005 < 0.00051,3,5-Trichlorobenzene g/m3 < 0.0005 < 0.0005 < 0.0005 < 0.0005 < 0.0005 < 0.0005 < 0.0005 < 0.0005Monoaromatic Hydrocarbons in VOC Water by Purge&Trap GC-MSn-Butylbenzene g/m3 < 0.0005 < 0.0005 < 0.0005 < 0.0005 < 0.0005 < 0.0005 < 0.0005 < 0.0005tert-Butylbenzene g/m3 < 0.0005 < 0.0005 < 0.0005 < 0.0005 < 0.0005 < 0.0005 < 0.0005 < 0.0005Isopropylbenzene (Cumene) g/m3 < 0.0005 < 0.0005 < 0.0005 < 0.0005 < 0.0005 < 0.0005 < 0.0005 < 0.00054-Isopropyltoluene (p-Cymene) g/m3 < 0.0005 < 0.0005 < 0.0005 < 0.0005 < 0.0005 < 0.0005 < 0.0005 < 0.0005n-Propylbenzene g/m3 < 0.0005 < 0.0005 < 0.0005 < 0.0005 < 0.0005 < 0.0005 < 0.0005 < 0.0005sec-Butylbenzene g/m3 < 0.0005 < 0.0005 < 0.0005 < 0.0005 < 0.0005 < 0.0005 < 0.0005 < 0.0005Styrene g/m3 < 0.0005 < 0.0005 < 0.0005 < 0.0005 < 0.0005 < 0.0005 < 0.0005 < 0.00051,2,4-Trimethylbenzene g/m3 < 0.0005 < 0.0005 < 0.0005 < 0.0005 < 0.0005 < 0.0005 < 0.0005 < 0.00051,3,5-Trimethylbenzene g/m3 < 0.0005 < 0.0005 < 0.0005 < 0.0005 < 0.0005 < 0.0005 < 0.0005 < 0.0005Ketones in VOC Water by Purge&Trap GC-MSAcetone g/m3 < 0.05 < 0.05 < 0.05 < 0.05 < 0.05 < 0.05 < 0.05 < 0.052-Butanone (MEK) g/m3 < 0.005 < 0.005 < 0.005 < 0.005 < 0.005 < 0.005 < 0.005 < 0.005Methyl tert-butylether (MTBE) g/m3 < 0.005 < 0.005 < 0.005 < 0.005 < 0.005 < 0.005 < 0.005 < 0.0054-Methylpentan-2-one (MIBK) g/m3 < 0.005 < 0.005 < 0.005 < 0.005 < 0.005 < 0.005 < 0.005 < 0.005Trihalomethanes in VOC Water by Purge&Trap GC-MSBromodichloromethane g/m3 < 0.0005 < 0.0005 < 0.0005 < 0.0005 < 0.0005 < 0.0005 < 0.0005 < 0.0005Bromoform (tribromomethane) g/m3 < 0.0005 < 0.0005 < 0.0005 < 0.0005 < 0.0005 < 0.0005 < 0.0005 < 0.0005Chloroform (Trichloromethane) g/m3 < 0.0005 < 0.0005 < 0.0005 < 0.0005 < 0.0005 < 0.0005 < 0.0005 < 0.0005Dibromochloromethane g/m3 < 0.0005 < 0.0005 < 0.0005 < 0.0005 < 0.0005 < 0.0005 < 0.0005 < 0.0005Other VOC in Water by Purge&Trap GC-MSCarbon disulphide g/m3 < 0.005 < 0.005 < 0.005 < 0.005 < 0.005 < 0.005 < 0.005 < 0.005Naphthalene g/m3 < 0.0005 < 0.0005 < 0.0005 < 0.0005 < 0.0005 < 0.0005 < 0.0005 < 0.0005System monitoring Compounds for VOC - % Recovery4-Bromofluorobenzene % 99 98 97 97 96 97 96 98Toluene-d8 % 100 101 100 101 102 101 96 102

ERD
C/CRR
EL TR-14-15
42
Table B6. Seasonal Peak Flow, 21 January 2010.
EventLocal Time 8:00 PM 8:07 PM 8:25 PM 8:30 PM 8:40 PM 8:45 PM 9:00 PM 9:15 PM
Location S3A S3A-Dup S2C S2C-Dup S2B S2B-Dup S1 S1-DupHeavy metals, totals, trace As,Cd,Cr,Cu,Ni,Pb,Zn Units:Total Arsenic g/m3 0.0014 0.0012 0.0023 0.0024 0.0017 0.0013 0.003 0.003Total Cadmium g/m3 0.000088 0.000093 0.000168 0.000119 0.000101 0.000118 0.000179 0.00027Total Chromium g/m3 0.0073 0.0072 0.0134 0.0137 0.0087 0.0073 0.0127 0.0156Total Copper g/m3 0.0122 0.012 0.0194 0.0192 0.0132 0.0117 0.021 0.026Total Lead g/m3 0.0043 0.004 0.0048 0.0048 0.0042 0.004 0.0046 0.0058Total Nickel g/m3 0.0134 0.013 0.023 0.024 0.0153 0.0134 0.025 0.032Total Zinc g/m3 0.05 0.05 0.055 0.054 0.054 0.046 0.098 0.116Polycyclic Aromatic Hydrocarbons Trace in Water, By Liq/LiqAcenaphthene g/m3 < 0.000008 < 0.000008 0.00001 0.00001 < 0.000008 < 0.000008 < 0.000008 < 0.000008Acenaphthylene g/m3 < 0.000008 < 0.000008 < 0.000008 < 0.000008 < 0.000008 < 0.000008 < 0.000008 < 0.000008Anthracene g/m3 < 0.000008 < 0.000008 < 0.000008 < 0.000008 < 0.000008 < 0.000008 < 0.000008 < 0.000008Benzo[a]anthracene g/m3 < 0.000008 < 0.000008 < 0.000008 < 0.000008 < 0.000008 < 0.000008 < 0.000008 < 0.000008Benzo[a]pyrene (BAP) g/m3 < 0.000008 < 0.000008 < 0.000008 < 0.000008 < 0.000008 < 0.000008 < 0.000008 < 0.000008Benzo[b]fluoranthene + Benzo[j]fluoranthene g/m3 < 0.000008 < 0.000008 < 0.000008 < 0.000008 < 0.000008 < 0.000008 < 0.000008 < 0.000008Benzo[g,h,i]perylene g/m3 < 0.000008 < 0.000008 < 0.000008 < 0.000008 < 0.000008 < 0.000008 < 0.000008 < 0.000008Benzo[k]fluoranthene g/m3 < 0.000008 < 0.000008 < 0.000008 < 0.000008 < 0.000008 < 0.000008 < 0.000008 < 0.000008Chrysene g/m3 < 0.000008 < 0.000008 < 0.000008 < 0.000008 < 0.000008 < 0.000008 < 0.000008 < 0.000008Dibenzo[a,h]anthracene g/m3 < 0.000008 < 0.000008 < 0.000008 < 0.000008 < 0.000008 < 0.000008 < 0.000008 < 0.000008Fluoranthene g/m3 < 0.000008 < 0.000008 < 0.000008 < 0.000008 < 0.000008 < 0.000008 < 0.000008 < 0.000008Fluorene g/m3 < 0.000008 < 0.000008 0.000009 0.000008 < 0.000008 < 0.000008 < 0.000008 < 0.000008Indeno(1,2,3-c,d)pyrene g/m3 < 0.000008 < 0.000008 < 0.000008 < 0.000008 < 0.000008 < 0.000008 < 0.000008 < 0.000008Naphthalene g/m3 < 0.00004 < 0.00004 0.00024 0.00019 < 0.00004 < 0.00004 < 0.00004 < 0.00004Phenanthrene g/m3 < 0.000008 < 0.000008 0.000008 0.000009 < 0.000008 < 0.000008 < 0.000008 < 0.000008Pyrene g/m3 0.00001 0.000008 < 0.000008 < 0.000008 0.000009 0.000009 < 0.000008 < 0.000008Total Petroleum Hydrocarbons in Water 8015C6 - C9 g/m3 < 0.06 < 0.06 < 0.06 < 0.06 < 0.06 < 0.06 < 0.06 < 0.06C10 - C14 g/m3 < 0.04 < 0.04 < 0.04 < 0.04 < 0.04 < 0.04 < 0.04 < 0.04C15 - C36 g/m3 < 0.08 < 0.08 < 0.08 < 0.08 < 0.08 < 0.08 < 0.08 < 0.08Total hydrocarbons (C6 - C36) g/m3 < 0.2 < 0.2 < 0.2 < 0.2 < 0.2 < 0.2 < 0.2 < 0.2BTEX in VOC Water by Purge&Trap GC-MSBenzene g/m3 < 0.0005 < 0.0005 < 0.0005 < 0.0005 < 0.0005 < 0.0005 < 0.0005 < 0.0005Toluene g/m3 < 0.0010 < 0.0010 < 0.0010 < 0.0010 < 0.0010 < 0.0010 < 0.0010 < 0.0010Ethylbenzene g/m3 < 0.0005 < 0.0005 < 0.0005 < 0.0005 < 0.0005 < 0.0005 < 0.0005 < 0.0005m&p-Xylene g/m3 < 0.0005 < 0.0005 < 0.0005 < 0.0005 < 0.0005 < 0.0005 < 0.0005 < 0.0005o-Xylene g/m3 < 0.0005 < 0.0005 < 0.0005 < 0.0005 < 0.0005 < 0.0005 < 0.0005 < 0.0005
Peak Flow, 21-Jan-2011

ERD
C/CRR
EL TR-14-15
43
Halogenated Aliphatics in VOC Water by Purge&Trap GC-MSBromomethane g/m3 < 0.002 < 0.002 < 0.002 < 0.002 < 0.002 < 0.002 < 0.002 < 0.002Carbon tetrachloride g/m3 < 0.0005 < 0.0005 < 0.0005 < 0.0005 < 0.0005 < 0.0005 < 0.0005 < 0.0005Chloroethane g/m3 < 0.0005 < 0.0005 < 0.0005 < 0.0005 < 0.0005 < 0.0005 < 0.0005 < 0.0005Chloromethane g/m3 < 0.0005 < 0.0005 < 0.0005 < 0.0005 < 0.0005 < 0.0005 < 0.0005 < 0.00051,2-Dibromo-3-chloropropane g/m3 < 0.0005 < 0.0005 < 0.0005 < 0.0005 < 0.0005 < 0.0005 < 0.0005 < 0.00051,2-Dibromoethane (ethylene dibromide, EDB) g/m3 < 0.0004 < 0.0004 < 0.0004 < 0.0004 < 0.0004 < 0.0004 < 0.0004 < 0.0004Dibromomethane g/m3 < 0.0005 < 0.0005 < 0.0005 < 0.0005 < 0.0005 < 0.0005 < 0.0005 < 0.0005Dichlorodifluoromethane g/m3 < 0.0005 < 0.0005 < 0.0005 < 0.0005 < 0.0005 < 0.0005 < 0.0005 < 0.00051,1-Dichloroethane g/m3 < 0.0005 < 0.0005 < 0.0005 < 0.0005 < 0.0005 < 0.0005 < 0.0005 < 0.00051,2-Dichloroethane g/m3 < 0.0005 < 0.0005 < 0.0005 < 0.0005 < 0.0005 < 0.0005 < 0.0005 < 0.00051,1-Dichloroethene g/m3 < 0.0005 < 0.0005 < 0.0005 < 0.0005 < 0.0005 < 0.0005 < 0.0005 < 0.0005cis-1,2-Dichloroethene g/m3 < 0.0005 < 0.0005 < 0.0005 < 0.0005 < 0.0005 < 0.0005 < 0.0005 < 0.0005trans-1,2-Dichloroethene g/m3 < 0.0005 < 0.0005 < 0.0005 < 0.0005 < 0.0005 < 0.0005 < 0.0005 < 0.0005Dichloromethane (methylene chloride) g/m3 < 0.010 < 0.010 < 0.010 < 0.010 < 0.010 < 0.010 < 0.010 < 0.0101,2-Dichloropropane g/m3 < 0.0005 < 0.0005 < 0.0005 < 0.0005 < 0.0005 < 0.0005 < 0.0005 < 0.00051,3-Dichloropropane g/m3 < 0.0005 < 0.0005 < 0.0005 < 0.0005 < 0.0005 < 0.0005 < 0.0005 < 0.00052,2-Dichloropropane g/m3 < 0.0005 < 0.0005 < 0.0005 < 0.0005 < 0.0005 < 0.0005 < 0.0005 < 0.00051,1-Dichloropropene g/m3 < 0.0005 < 0.0005 < 0.0005 < 0.0005 < 0.0005 < 0.0005 < 0.0005 < 0.0005cis-1,3-Dichloropropene g/m3 < 0.0005 < 0.0005 < 0.0005 < 0.0005 < 0.0005 < 0.0005 < 0.0005 < 0.0005trans-1,3-Dichloropropene g/m3 < 0.0005 < 0.0005 < 0.0005 < 0.0005 < 0.0005 < 0.0005 < 0.0005 < 0.0005Hexachlorobutadiene g/m3 < 0.0005 < 0.0005 < 0.0005 < 0.0005 < 0.0005 < 0.0005 < 0.0005 < 0.00051,1,1,2-Tetrachloroethane g/m3 < 0.0005 < 0.0005 < 0.0005 < 0.0005 < 0.0005 < 0.0005 < 0.0005 < 0.00051,1,2,2-Tetrachloroethane g/m3 < 0.0005 < 0.0005 < 0.0005 < 0.0005 < 0.0005 < 0.0005 < 0.0005 < 0.0005Tetrachloroethene (tetrachloroethylene) g/m3 < 0.0005 < 0.0005 < 0.0005 < 0.0005 < 0.0005 < 0.0005 < 0.0005 < 0.00051,1,1-Trichloroethane g/m3 < 0.0005 < 0.0005 < 0.0005 < 0.0005 < 0.0005 < 0.0005 < 0.0005 < 0.00051,1,2-Trichloroethane g/m3 < 0.0005 < 0.0005 < 0.0005 < 0.0005 < 0.0005 < 0.0005 < 0.0005 < 0.0005Trichloroethene (trichloroethylene) g/m3 < 0.0005 < 0.0005 < 0.0005 < 0.0005 < 0.0005 < 0.0005 < 0.0005 < 0.0005Trichlorofluoromethane g/m3 < 0.0005 < 0.0005 < 0.0005 < 0.0005 < 0.0005 < 0.0005 < 0.0005 < 0.00051,2,3-Trichloropropane g/m3 < 0.0005 < 0.0005 < 0.0005 < 0.0005 < 0.0005 < 0.0005 < 0.0005 < 0.00051,1,2-Trichlorotrifluoroethane (Freon 113) g/m3 < 0.004 < 0.004 < 0.004 < 0.004 < 0.004 < 0.004 < 0.004 < 0.004Vinyl chloride g/m3 < 0.0005 < 0.0005 < 0.0005 < 0.0005 < 0.0005 < 0.0005 < 0.0005 < 0.0005

ERD
C/CRR
EL TR-14-15
44
Halogenated Aromatics in VOC Water by Purge&Trap GC-MSBromobenzene g/m3 < 0.0005 < 0.0005 < 0.0005 < 0.0005 < 0.0005 < 0.0005 < 0.0005 < 0.0005Chlorobenzene (monochlorobenzene) g/m3 < 0.0005 < 0.0005 < 0.0005 < 0.0005 < 0.0005 < 0.0005 < 0.0005 < 0.00052-Chlorotoluene g/m3 < 0.0005 < 0.0005 < 0.0005 < 0.0005 < 0.0005 < 0.0005 < 0.0005 < 0.00054-Chlorotoluene g/m3 < 0.0005 < 0.0005 < 0.0005 < 0.0005 < 0.0005 < 0.0005 < 0.0005 < 0.00051,2-Dichlorobenzene g/m3 < 0.0005 < 0.0005 < 0.0005 < 0.0005 < 0.0005 < 0.0005 < 0.0005 < 0.00051,3-Dichlorobenzene g/m3 < 0.0005 < 0.0005 < 0.0005 < 0.0005 < 0.0005 < 0.0005 < 0.0005 < 0.00051,4-Dichlorobenzene g/m3 < 0.0005 < 0.0005 < 0.0005 < 0.0005 < 0.0005 < 0.0005 < 0.0005 < 0.00051,2,3-Trichlorobenzene g/m3 < 0.0005 < 0.0005 < 0.0005 < 0.0005 < 0.0005 < 0.0005 < 0.0005 < 0.00051,2,4-Trichlorobenzene g/m3 < 0.0005 < 0.0005 < 0.0005 < 0.0005 < 0.0005 < 0.0005 < 0.0005 < 0.00051,3,5-Trichlorobenzene g/m3 < 0.0005 < 0.0005 < 0.0005 < 0.0005 < 0.0005 < 0.0005 < 0.0005 < 0.0005Monoaromatic Hydrocarbons in VOC Water by Purge&Trap GC-MSn-Butylbenzene g/m3 < 0.0005 < 0.0005 < 0.0005 < 0.0005 < 0.0005 < 0.0005 < 0.0005 < 0.0005tert-Butylbenzene g/m3 < 0.0005 < 0.0005 < 0.0005 < 0.0005 < 0.0005 < 0.0005 < 0.0005 < 0.0005Isopropylbenzene (Cumene) g/m3 < 0.0005 < 0.0005 < 0.0005 < 0.0005 < 0.0005 < 0.0005 < 0.0005 < 0.00054-Isopropyltoluene (p-Cymene) g/m3 < 0.0005 < 0.0005 < 0.0005 < 0.0005 < 0.0005 < 0.0005 < 0.0005 < 0.0005n-Propylbenzene g/m3 < 0.0005 < 0.0005 < 0.0005 < 0.0005 < 0.0005 < 0.0005 < 0.0005 < 0.0005sec-Butylbenzene g/m3 < 0.0005 < 0.0005 < 0.0005 < 0.0005 < 0.0005 < 0.0005 < 0.0005 < 0.0005Styrene g/m3 < 0.0005 < 0.0005 < 0.0005 < 0.0005 < 0.0005 < 0.0005 < 0.0005 < 0.00051,2,4-Trimethylbenzene g/m3 < 0.0005 < 0.0005 0.0013 0.0012 0.0005 < 0.0005 < 0.0005 < 0.00051,3,5-Trimethylbenzene g/m3 < 0.0005 < 0.0005 0.0006 0.0005 < 0.0005 < 0.0005 < 0.0005 < 0.0005Ketones in VOC Water by Purge&Trap GC-MSAcetone g/m3 < 0.05 < 0.05 < 0.05 < 0.05 < 0.05 < 0.05 < 0.05 < 0.052-Butanone (MEK) g/m3 < 0.005 < 0.005 < 0.005 < 0.005 < 0.005 < 0.005 < 0.005 < 0.005Methyl tert-butylether (MTBE) g/m3 < 0.005 < 0.005 < 0.005 < 0.005 < 0.005 < 0.005 < 0.005 < 0.0054-Methylpentan-2-one (MIBK) g/m3 < 0.005 < 0.005 < 0.005 < 0.005 < 0.005 < 0.005 < 0.005 < 0.005Trihalomethanes in VOC Water by Purge&Trap GC-MSBromodichloromethane g/m3 < 0.0005 < 0.0005 < 0.0005 < 0.0005 < 0.0005 < 0.0005 < 0.0005 < 0.0005Bromoform (tribromomethane) g/m3 < 0.0005 < 0.0005 < 0.0005 < 0.0005 < 0.0005 < 0.0005 < 0.0005 < 0.0005Chloroform (Trichloromethane) g/m3 < 0.0005 < 0.0005 < 0.0005 < 0.0005 < 0.0005 < 0.0005 < 0.0005 < 0.0005Dibromochloromethane g/m3 < 0.0005 < 0.0005 < 0.0005 < 0.0005 < 0.0005 < 0.0005 < 0.0005 < 0.0005Other VOC in Water by Purge&Trap GC-MSCarbon disulphide g/m3 < 0.005 < 0.005 < 0.005 < 0.005 < 0.005 < 0.005 < 0.005 < 0.005Naphthalene g/m3 < 0.0005 < 0.0005 < 0.0005 < 0.0005 < 0.0005 < 0.0005 < 0.0005 < 0.0005System monitoring Compounds for VOC - % Recovery4-Bromofluorobenzene % 95 95 95 95 96 96 94 93Toluene-d8 % 99 100 99 100 98 99 98 98

REPORT DOCUMENTATION PAGE Form Approved OMB No. 0704-0188
Public reporting burden for this collection of information is estimated to average 1 hour per response, including the time for reviewing instructions, searching existing data sources, gathering and maintaining the data needed, and completing and reviewing this collection of information. Send comments regarding this burden estimate or any other aspect of this collection of information, including suggestions for reducing this burden to Department of Defense, Washington Headquarters Services, Directorate for Information Operations and Reports (0704-0188), 1215 Jefferson Davis Highway, Suite 1204, Arlington, VA 22202-4302. Respondents should be aware that notwithstanding any other provision of law, no person shall be subject to any penalty for failing to comply with a collection of information if it does not display a currently valid OMB control number. PLEASE DO NOT RETURN YOUR FORM TO THE ABOVE ADDRESS. 1. REPORT DATE (DD-MM-YYYY)
25-08-2014 2. REPORT TYPE
Technical Report/Final 3. DATES COVERED (From - To)
4. TITLE AND SUBTITLE Pollutant Concentration in Runoff at McMurdo Station, Antarctica
5a. CONTRACT NUMBER
5b. GRANT NUMBER
5c. PROGRAM ELEMENT
6. AUTHOR(S) Rosa T. Affleck , Meredith Carr , Laura Elliot , Corey Chan , and Margaret Knuth
5d. PROJECT NUMBER
5e. TASK NUMBER EP-ANT-11-04
5f. WORK UNIT NUMBER
7. PERFORMING ORGANIZATION NAME(S) AND ADDRESS(ES) U.S. Army Engineer Research and Development Center (ERDC) Cold Regions Research and Engineering Laboratory (CRREL) 72 Lyme Road, Hanover, NH 03755-1290
8. PERFORMING ORGANIZATION REPORT NUMBER
ERDC/CRREL TR-14-15
9. SPONSORING / MONITORING AGENCY NAME(S) AND ADDRESS(ES) 10. SPONSOR/MONITOR'S ACRONYM(S) NSF National Science Foundation, Division of Polar Programs
Antarctic Infrastructure and Logistics Arlington, VA 22230
11. SPONSOR/MONITOR’S REPORT NUMBER(S)
12. DISTRIBUTION / AVAILABILITY STATEMENT Approved for public release; distribution is unlimited.
13. SUPPLEMENTARY NOTES
Engineering for Polar Operations, Logistics, and Research (EPOLAR)
14. ABSTRACT
Accidental spills and chemical contamination from leaking fuel and materials (lubricants, paints, etc.) at McMurdo Station have caused environmental concerns, and snowmelt runoff may tend to transport these contaminants. Therefore, the objective of our study was to quantify the pollutant types and levels in the runoff throughout a season. To understand what types of analytes were present and being carried by the runoff into Winter Quarters Bay, we collected water samples from the runoff at major flow arteries at McMurdo Station six times during various flow events in austral summer 2010–2011. Pollutants analyzed included heavy metals, polycyclic aromatic hydrocarbons (PAHs), total hydrocarbons, and volatile organic compounds. Results showed that concentrations for heavy metals were elevated during the first flush when flow began in receiving channels where significant operational or day-to-day activities occurred. In other places, elevated values occurred during the first significant flow; and the concentrations for selected PAHs were elevated during the first peak flow. Given that the snowmelt runoff contained significant concentration of heavy metals and certain PAHs, some of which were above the thresholds for chronic limits for aquatic water quality in saltwater, prevention and mitigation are crucial for re-ducing contamination at McMurdo Station.
15. SUBJECT TERMS Contaminants, drainage, EPOLAR, erosion, heavy metals, hydrocarbons, NSF, snowmelt
16. SECURITY CLASSIFICATION OF: 17. LIMITATION OF ABSTRACT
18. NUMBER OF PAGES
19a. NAME OF RESPONSIBLE PERSON
a. REPORT Unclassified
b. ABSTRACT Unclassified
c. THIS PAGE Unclassified SAR 55
19b. TELEPHONE NUMBER (include area code)
NSN 7540-01-280-5500 Standard Form 298 (Rev. 8-98)
Prescribed by ANSI Std. 239.1 Report Documentation Page (SF 298)