a dynamical investigation of the may 2004 mcmurdo...
TRANSCRIPT

A Dynamical Investigation of the May 2004 McMurdo Antarctica Severe Wind EventUsing AMPS*
DANIEL F. STEINHOFF, DAVID H. BROMWICH, AND MICHELLE LAMBERTSON
Polar Meteorology Group, Byrd Polar Research Center, and Atmospheric Sciences Program, Department of Geography,The Ohio State University, Columbus, Ohio
SHELLEY L. KNUTH AND MATTHEW A. LAZZARA
Antarctic Meteorological Research Center, Space Science and Engineering Center, University of Wisconsin—Madison,Madison, Wisconsin
(Manuscript received 21 August 2006, in final form 12 April 2007)
ABSTRACT
On 15–16 May 2004 a severe windstorm struck McMurdo, Antarctica. The Antarctic Mesoscale Predic-tion System (AMPS) is used, along with available observations, to analyze the storm. A synoptic-scalecyclone weakens as it propagates across the Ross Ice Shelf toward McMurdo. Flow associated with thecyclone initiates a barrier jet along the Transantarctic Mountains. Forcing terms from the horizontalequations of motion are computed in the barrier wind to show that the local time tendency and momentumadvection terms are key components of the force balance. The barrier jet interacts with a preexistingnear-surface radiation inversion over the Ross Ice Shelf to set up conditions favorable for the developmentof large-amplitude mountain waves, leading to a downslope windstorm in the Ross Island area. Hydraulictheory can explain the structure of the downslope windstorms, with amplification of the mountain wavespossibly caused by wave-breaking events. The underestimation of AMPS wind speed at McMurdo is causedby the misplacement of a hydraulic jump downstream of the downslope windstorms. The dynamics asso-ciated with the cyclone, barrier jet, and downslope windstorms are analyzed to determine the role of eachin development of the severe winds.
1. Introduction
During 15–16 May 2004, a severe windstorm struckMcMurdo Station, Antarctica. Official observations arelacking because the anemometer was blown away; how-ever, observations from McMurdo Building 71 re-corded a maximum wind speed of 71.5 m s�1 and sus-tained wind speeds of 35–50 m s�1 between 1800 UTC15 May and 0000 UTC 16 May (Dalrymple 2004). Ob-servations from nearby Arrival Heights and Black Is-land recorded maximum speeds of 84 and 64 m s�1,respectively, and sustained winds of 35 and 48 m s�1,
respectively, during the same time period. McMurdoStation suffered structural damage to buildings and ve-hicles [see Dalrymple (2004) for more detailed damagedescription], as did neighboring Scott Base (New Zea-land).
Figure 1 features a series of maps designed to famil-iarize the reader with Antarctic geography and stationlocations on the Ross Ice Shelf and in the McMurdoarea. Climatologically, the strongest wind regimes inAntarctica are located along steep coastal slopes, suchas Cape Denison, which is associated with the broad-scale convergence of katabatic flow from the continen-tal interior to a restricted coastal zone (Schwerdtfeger1984). Katabatic effects occasionally reach McMurdodirectly from Siple Coast (Bromwich et al. 1992) andsources along the Transantarctic Mountains (Liu andBromwich 1993). For this case, the complex topographyof the region (Figs. 1b,c) modifies preexisting synoptic-scale and mesoscale features to produce wind speedsrivaling those found in the strongest katabatic zones.
* Byrd Polar Research Center Contribution Number 1350.
Corresponding author address: Daniel F. Steinhoff, Polar Me-teorology Group, Byrd Polar Research Center, The Ohio StateUniversity, 1090 Carmack Road, Columbus, OH 43210.E-mail: [email protected]
JANUARY 2008 S T E I N H O F F E T A L . 7
DOI: 10.1175/2007MWR1999.1
© 2008 American Meteorological Society
MWR3529

Accurate forecasting is critical for base operations atMcMurdo. McMurdo is the logistical hub and the larg-est base of the U.S. Antarctic Program (USAP). Duringthe main field season (October–February), McMurdosupports a population of over 1000 people; however,several hundred people remain at McMurdo duringwinter for operations and various research endeavors.Airstrips at McMurdo handle intercontinental flights toand from Christchurch, New Zealand, along with flightsto and from the South Pole and other continental loca-tions.
The primary goal of this paper is to analyze the at-mospheric dynamics involved in producing the severe
winds at McMurdo. The minimum central pressure of alower-tropospheric cyclone that tracks just east of Mc-Murdo after 1800 UTC 15 May is increasing during theprevious 12 h. Also, wind speed observations awayfrom the McMurdo area (Ferrell, Gill, Schwerdtfeger,and Marilyn) never exceed 30 m s�1. The dynamicalprocesses involved in producing severe winds in thevicinity of a weakening cyclone, and in a localized area,are explored in this paper.
Forecast guidance for McMurdo and all of Antarcticais provided by the Antarctic Mesoscale Prediction Sys-tem (AMPS; Powers et al. 2003), an experimental, real-time numerical weather prediction system developed
FIG. 1. (a) Map of the Antarctic continent with AMPSterrain contours (shaded, 500-m interval). (b) Inset of (a)showing the Ross Ice Shelf region with AMPS terrain con-tours (shaded, 500-m interval). (c) Inset of (b) showing theRoss Island region with AMPS terrain contours (shaded,250-m interval). Filled boxes indicate station locations.
8 M O N T H L Y W E A T H E R R E V I E W VOLUME 136

for the USAP. A more detailed description of AMPS isprovided in the next section. Another goal of this casestudy is to analyze errors in AMPS forecasts of windspeeds during the storm. Between 1800 UTC 15 Mayand 0000 UTC 16 May, the AMPS 3.3-km grid providesa credible forecast for most of the Ross Island region,except for the immediate McMurdo area, where theAMPS wind speed forecasts never exceed 25 m s�1.Figure 2 shows McMurdo area wind speed observationsand the 3.3-km AMPS wind speed forecast for Mc-Murdo during the storm. At 2300 UTC 15 May, whenobserved wind speeds exceed 35 m s�1 at McMurdo(Dalrymple 2004) and 30 m s�1 in the surrounding re-gion (Fig. 2), the AMPS forecasted wind speed at Mc-Murdo is under 5 m s�1. However, Fig. 3 shows thatAMPS forecasts high wind speeds just 20 km upstream(south) of McMurdo at 2300 UTC. The reasons forthese errors in wind speed magnitude and location areinvestigated.
The following section features a description ofAMPS, along with information about automaticweather station (AWS) data and Moderate ResolutionImaging Spectroradiometer (MODIS) imagery used inthis case study. A synoptic overview follows in section
3. Section 4 describes the characteristics and forcing ofa barrier wind regime along the Transantarctic Moun-tains that is a precursor to the strong winds at Mc-Murdo. Section 5 contains an analysis of hydraulictheory as an analog to the downslope windstorms thatimpact the McMurdo area, along with discussion ofother mountain-wave theories and their application tothis case. Errors in AMPS wind speed forecasts areanalyzed in section 6, and in section 7 the study con-cludes with a general event analysis, and a discussion ofthe impact of recent improvements in AMPS in relationto this event and future research needs.
2. Model configuration and data
AMPS is a joint effort between the Mesoscale andMicroscale Meteorology (MMM) Division of the Na-tional Center for Atmospheric Research (NCAR) andthe Polar Meteorology Group of the Byrd Polar Re-search Center at The Ohio State University (OSU).AMPS employs the Polar fifth-generation PennsylvaniaState University–NCAR Mesoscale Model (MM5;Grell et al. 1995), a version optimized for use in polarregions by OSU (Bromwich et al. 2001; Cassano et al.
FIG. 2. Wind speed (m s�1) at Black Island (dashed–dotted, small filled circles), ArrivalHeights (solid line, filled squares), Williams Field (dotted line, filled triangles), Pegasus North(dashed line, filled diamonds), and McMurdo AMPS (heavy solid line, large filled circles)between 1800 UTC 15 May 2004 and 0000 UTC 16 May 2004.
JANUARY 2008 S T E I N H O F F E T A L . 9

2001). Polar MM5 includes a modified parameteriza-tion for the prediction of ice cloud fraction, improvedcloud–radiation interactions, an optimal stable bound-ary layer treatment, improved calculation of heat trans-fer through snow and ice surfaces, and the addition of afractional sea ice surface type (Bromwich et al. 2001).
The AMPS Polar MM5 consists of five polar stereo-graphic domains. Domains 2 (30-km resolution), 3 (10-km resolution), and 5 (3.3-km resolution) are used inthis analysis. There are 31 vertical half-sigma levels,with 11 levels in the lowest 1000 m to capture the com-plex interactions in the planetary boundary layer. Thelowest half-sigma level is about 13 m above the surface.The model output is archived on the mass storage sys-tem (MSS) at NCAR.
The AMPS Polar MM5 is initialized twice daily at0000 and 1200 UTC. The initial and boundary condi-tions are derived from the National Centers for Envi-ronmental Prediction Global Forecasting System(GFS) model. The GFS first-guess field is objectivelyreanalyzed with the available observations using a mul-tiquadric technique (Nuss and Titley 1994). The obser-vations available for assimilation into AMPS includereports from radiosondes, Synoptic Surface Observa-tion (SYNOP) reports, AWS observations, ship re-ports, and buoys. Satellite-derived cloud-track winds
are also assimilated in the 90-km grid. AMPS ingestssea ice data daily from the National Snow and Ice DataCenter for its fractional sea ice depiction.
Guo et al. (2003) evaluate Polar MM5 performanceover Antarctica for a 1-yr period (1993) on a 60-kmresolution domain and show that the intra- and in-terseasonal variability in pressure, temperature, wind,and moisture are well resolved. Bromwich et al. (2005)evaluate 2-yr of AMPS Polar MM5 forecasts on the30-km domain and show that the same variables arewell resolved at synoptic time scales as well. Therefore,we consider the quality of the model forecasts to besuitable for use in this study.
For AMPS 30- and 10-km grids, 12–21-h forecasts areused at 3-h intervals. For example, between 1200 and2100 UTC 15 May, forecasts from the 0000 UTC 15May model run are used. For the 3.3-km grid, forecastsare at 1-h intervals, with the 0000 UTC 15 May modelrun used prior to 2100 UTC 15 May and the 1200 UTC15 May model run used from 2100 UTC 15 May on-ward. This is done because forecasts from the 1200UTC 15 May model run provide more realistic repre-sentations of actual conditions than forecasts from the0000 UTC 15 May model run during the most crucialtime period of the case study. Forecasts from 12 h on-ward are used to allow sufficient time for the spinup ofmodel fields. All AMPS forecasts for specific stationlocations use the 3.3-km grid. For all figures, the 30-kmgrid is used unless otherwise indicated, and representa-tions of surface variables are done at the lowest half-sigma level.
Surface observations are obtained from the AntarcticMeteorological Research Center (AMRC) at the Uni-versity of Wisconsin—Madison (UW; http://amrc.ssec.wisc.edu). Data from UW-AWS sites and Space andNaval Warfare Systems Center (SPAWAR)-AWS sitesare archived at AMRC and are used in this case study.Station pressure values are adjusted to mean sea levelto facilitate analysis. Temperature, wind speed, andwind direction observations at a height of 3 m are alsoused in analysis. UW-AWS observations are instanta-neous at a 10-min frequency; SPAWAR AWS obser-vations are averages of 2-min observations at a 15-minfrequency. Further information regarding UW auto-matic weather stations can be found in Stearns et al.(1993). MODIS imagery from the Terra and Aqua sat-ellites of the Earth Observing System (EOS) at 5- and1-km resolution is obtained from the Goddard EarthScience (GES) Distributed Active Archive Center(DAAC; http://daac.gsfc.nasa.gov). Raw data imagesare combined and remapped using Man computer In-teractive Data Access System (McIDAS) software.
FIG. 3. Surface wind speed (m s�1) and wind vectors (whitearrows) from AMPS 3.3-km grid at 2300 UTC 15 May 2004. Con-tour and shade interval is 5 m s�1. Black triangle indicates loca-tion of McMurdo.
10 M O N T H L Y W E A T H E R R E V I E W VOLUME 136

MODIS band 31, at a wavelength of approximately11.03 �m, is used for this case study. MODIS imagery isused primarily for cyclone tracking throughout the casestudy.
3. Synoptic overview
a. Cyclone track
According to AMPS (AWS coverage is insufficientand a satellite gap prevents use of MODIS imagery) thecyclone of interest for this case study moves onto MarieByrd Land from the Amundsen Sea after 1200 UTC 14May and descends onto the Ross Ice Shelf near theSiple Coast after 0300 UTC 15 May. Figure 4 shows atrack comparison of the cyclone between AMPS andAWS/MODIS, along with the minimum sea level pres-sure of the cyclone in AMPS. From 0600 UTC 15 Mayuntil 0000 UTC 16 May, the minimum central pressureof the cyclone increases by 45 hPa in AMPS, which is anaverage rate of 2.5 hPa h�1 for the 18 h. Analysis ofAWS sea level adjusted pressure values show generalagreement with AMPS in regards to pressure tenden-cies through 2100 UTC 15 May, with AWS values hav-ing similar tendencies, but being 1–4 hPa lower thanAMPS during this time. AMPS places the cyclone far-ther south and several hours ahead (about 3 h at 0600UTC to under an hour by 1800 UTC) of the observedcyclone throughout the case study. It is unclear if thetrack difference has any effect on cyclone strength, or ifthe AMPS bias can be attributed to analysis error.
b. 500-hPa analysis
Figures 5a–c show the 500-hPa geopotential heightdistribution and horizontal advection of absolute vor-ticity at 6-h intervals between 0600 and 1800 UTC 15May. At 0600 UTC (Fig. 5a) the surface cyclone is col-located with a region of weak anticyclonic vorticity ad-vection aloft, implying downward vertical motion. At1200 UTC (Fig. 5b) the cyclone is collocated with aregion of weak cyclonic vorticity advection, meaningthat upward vertical motion should be supporting cy-clone intensification. At 1800 UTC (Fig. 5c) there isnegligible vorticity advection in the vicinity of the cy-clone. Figures 5a–c show that vorticity advection at 500hPa is dominated by weak and transient short waveslocated between two deeper troughs that are associatedwith the geopotential minimum to the north over theRoss Sea and that upper-level forcing is weak overall.To determine the robustness of vorticity advection withthe presence of topography upstream, potential vortic-ity (PV) advection on the 288-K isentropic level inAMPS was plotted (not shown), and the advection pat-
terns are similar to those on the 500-hPa vorticity ad-vection plot.
c. Low-level analysis
At the surface, a large potential temperature contrastis present between the warm air over West Antarctica(east of the cyclone) and the cold air over the north-central Ross Ice Shelf (west of the cyclone) at 0000UTC 15 May (Fig. 6a). The latter appears to form dueto radiational cooling over the previous 12 h. The ther-mal contrast is strongest at the surface, as the region ofcold air over the Ross Ice Shelf is shallow and restrictedto the layer beneath 850 hPa. At 0600 UTC (Fig. 6b),the cold air is wrapping around the eastern side of thecyclone, while the source of warm air southeast of thecyclone is being cut off by the Transantarctic Moun-tains and the Ellsworth Mountains over the continentalinterior. At 1200 UTC (Fig. 6c), the warm air has beencut off, and the potential temperature distribution re-sembles an occlusion, with cold air wrapping aroundthe entire cyclone. Warm air over the TransantarcticMountains persists but does not interact with cold air atlower elevations over the Ross Ice Shelf. By 1800 UTC(Fig. 6d) the thermal contrast around the cyclone hasweakened compared with previous analysis times. Theweakening of the thermal gradient around the cyclonein Figs. 6a–d is the primary cause of the rises in mini-mum central pressure of the cyclone. Fundamental tothe development and maintenance of cyclones is pro-duction of a low-level thermal ridge downstream of thecyclone, which is achieved through lower-tropospheric
FIG. 4. Cyclone track for AMPS (A) and observed (AWS/MODIS, L). Italicized numbers in parentheses indicate minimumsea level pressure of cyclone. Times are in UTC for 15 May 2004unless otherwise indicated.
JANUARY 2008 S T E I N H O F F E T A L . 11

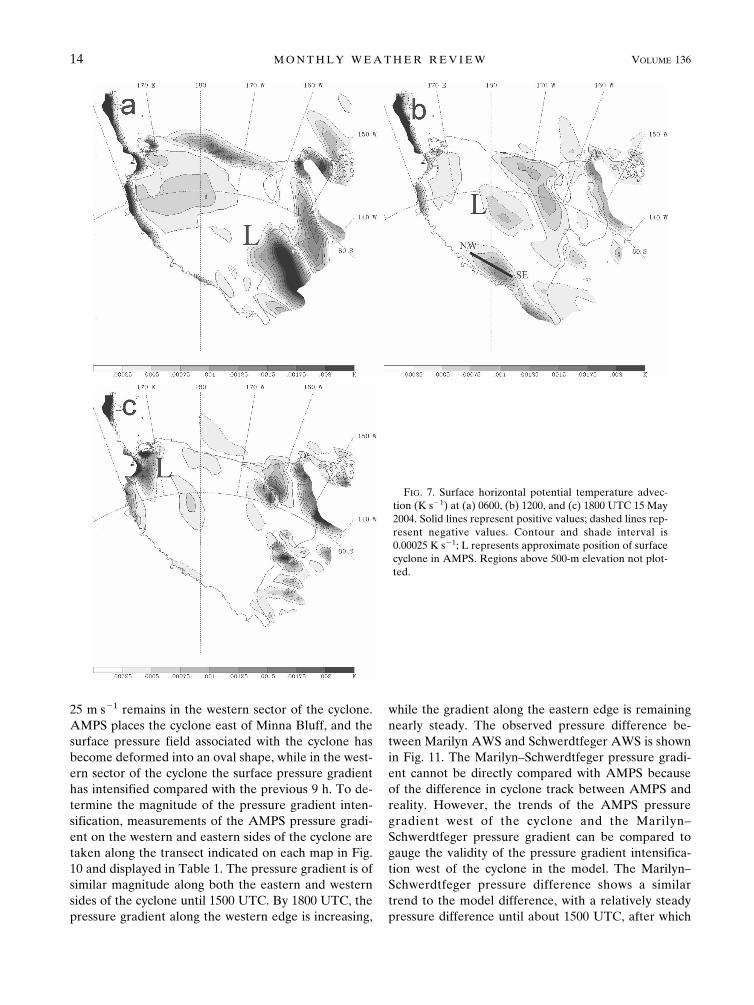
warm air advection. Figure 7a shows that at 0600 UTC,there is a broad region of warm air advection down-stream (northwest) of the cyclone and a region of coldair advection upstream (southeast) of the cyclone, im-plying a favorable setup at the surface for cyclone de-velopment. Potential temperature advection at 1200UTC (Fig. 7b) shows that the region of warm air ad-vection downstream of the cyclone has shrunk andweakened in the past 6 h because of the blocking of thewarm air source region by the Transantarctic andEllsworth Mountains. Two regions of cold air advectionare present, centered just east of the international dateline. The southernmost region of cold air advection isrotating around the cyclone and is located downstreamof the cyclone by 1800 UTC (Fig. 7c). A region of warm
air advection is located upstream of the cyclone, so thatin the 12 h between 0600 and 1800 UTC the low-levelthermal advection pattern completely reverses orienta-tion. To determine the vertical structure above the re-gion of surface cold air advection, a cross section istaken along the flow and through the aforementionedcold air advection region at 1200 UTC, indicated in Fig.7b and shown in Fig. 8. Cold air advection at the sur-face, coupled with a thermal maximum at about 850hPa, results in a stable lower-tropospheric environmentthat hinders upward vertical motions. The cessation ofwarm air advection downstream of the cyclone, com-bined with the lack of upper-tropospheric support, isthe likely cause of cyclolysis after 0600 UTC.
Given the large increase in minimum surface pres-
FIG. 5. The 500-hPa absolute vorticity advection (10�5
s�2) at (a) 0600, (b) 1200, and (c) 1800 UTC 15 May 2004.Solid lines represent regions of cyclonic vorticity advection;dashed lines represent regions of anticyclonic vorticity ad-vection. Contour and shade interval is 0.000 315 � 10�5 s�2;L represents approximate position of surface cyclone inAMPS. Absolute vorticity advection not plotted for regionsabove 500-m elevation for clarity.
12 M O N T H L Y W E A T H E R R E V I E W VOLUME 136

sure of the cyclone during the case study period, theisallobaric wind is analyzed to assess the influence ofthe pressure change field on large-scale forcing. Theisallobaric wind,
Visal � �1
f 2 ���
�t, �1�
is the component of the ageostrophic wind that is pro-portional to the gradient of geopotential tendency (on aconstant pressure surface), directed toward regions ofmaximum height falls. Figure 9 shows the simulatedactual wind at 0900 UTC and the isallobaric wind com-puted with the time tendency between 0900 and 1200UTC over the Ross Ice Shelf at 925 hPa in AMPS. Inthe southwestern quadrant of the cyclone, the isallo-baric wind has a similar orientation to the actual wind,as expected with northwestward propagation of the cy-clone. The gradients of the pressure change field are a
key component of the large-scale forcing in the south-western quadrant of the cyclone. The isallobaric windhas decreasing influence with proximity to the Trans-antarctic Mountains, implying that topographic effectsprovide additional forcing for strong winds in this re-gion.
4. Barrier wind
a. Identification
Northwestward propagation of the cyclone across theRoss Ice Shelf between 0900 and 1800 UTC 15 May isshown at 3-h intervals in Figs. 10a–d. Wind speeds inthe western sector of the cyclone along the base of theTransantarctic Mountains exceed 30 m s�1, higher thanwind speeds in the eastern sector of the cyclone, whichnever exceed 20 m s�1 after 0900 UTC (Figs. 10a–c). By1800 UTC (Fig. 10d), a core of wind speeds greater than
FIG. 6. Surface potential temperature (contoured and shaded, interval 5 K) and wind barbs (full barb � 5 m s�1) at (a) 0000, (b)0600, (c) 1200, and (d) 1800 UTC 15 May 2004; L represents approximate position of surface cyclone in AMPS.
JANUARY 2008 S T E I N H O F F E T A L . 13
25 m s�1 remains in the western sector of the cyclone.AMPS places the cyclone east of Minna Bluff, and thesurface pressure field associated with the cyclone hasbecome deformed into an oval shape, while in the west-ern sector of the cyclone the surface pressure gradienthas intensified compared with the previous 9 h. To de-termine the magnitude of the pressure gradient inten-sification, measurements of the AMPS pressure gradi-ent on the western and eastern sides of the cyclone aretaken along the transect indicated on each map in Fig.10 and displayed in Table 1. The pressure gradient is ofsimilar magnitude along both the eastern and westernsides of the cyclone until 1500 UTC. By 1800 UTC, thepressure gradient along the western edge is increasing,
while the gradient along the eastern edge is remainingnearly steady. The observed pressure difference be-tween Marilyn AWS and Schwerdtfeger AWS is shownin Fig. 11. The Marilyn–Schwerdtfeger pressure gradi-ent cannot be directly compared with AMPS becauseof the difference in cyclone track between AMPS andreality. However, the trends of the AMPS pressuregradient west of the cyclone and the Marilyn–Schwerdtfeger pressure gradient can be compared togauge the validity of the pressure gradient intensifica-tion west of the cyclone in the model. The Marilyn–Schwerdtfeger pressure difference shows a similartrend to the model difference, with a relatively steadypressure difference until about 1500 UTC, after which
FIG. 7. Surface horizontal potential temperature advec-tion (K s�1) at (a) 0600, (b) 1200, and (c) 1800 UTC 15 May2004. Solid lines represent positive values; dashed lines rep-resent negative values. Contour and shade interval is0.00025 K s�1; L represents approximate position of surfacecyclone in AMPS. Regions above 500-m elevation not plot-ted.
14 M O N T H L Y W E A T H E R R E V I E W VOLUME 136

it increases. At 2100 UTC (not shown) the pressuregradient along the western edge is 3 times the size ofthe gradient along the eastern edge for both the 30- and10-km grid forecasts in AMPS.
The intensification of the pressure gradient and re-sulting core of strong winds in the western sector of thecyclone are caused by a barrier wind. As the cyclonemoves onto the Ross Ice Shelf, northerly flow in thesoutheastern quadrant of the cyclone impinges uponthe Transantarctic Mountains at the southern tip of theRoss Ice Shelf by 0900 UTC (Fig. 10a). Flow directedorthogonal to the Transantarctic Mountains will eitherhave sufficient momentum to flow over the topographyor will be forced around. The resulting flow regime willdepend upon the wind speed, the height of the barrier,and the stability of the layer in front of the barrier(O’Connor et al. 1994). Whether the flow will traversethe topography or be deflected around can be deter-mined from the Froude number:
Fr � U0�gH��
� ��1�2
, �2�
where U0 is the wind speed, g is the gravitational ac-celeration (9.8 m s�2), H is the height of the obstacle,�� is the increase in potential temperature between thesurface and the top of the obstacle, and � is the averagepotential temperature of the layer between the surfaceand the height of the obstacle. If Fr � 1, the flow willhave sufficient kinetic energy to traverse the topogra-phy, whereas Fr 1 indicates a lack of kinetic energy totraverse the topography, and flow will be forced
around. Using representative values from the AMPSforecast for the Transantarctic Mountains at the south-ern end of the Ross Ice Shelf at 0900 UTC 15 May,U0 � 17.5 m s�1, H � 2000 m, �� � 16 K, � � 270 K,and Fr 0.51. Since Fr 1, the flow will not havesufficient kinetic energy to traverse the TransantarcticMountains. Typically, a layer of cold air at the base ofthe mountain deepens, causing the pressure gradient tostrengthen. However, in this case, air at the surface iswarmer at the base of the mountain compared withconditions upwind (to the north), as indicated in Fig.10a, due to cold air advection from the north. Evenwithout the cold pool at the base of the mountains, thestratification and terrain height are sufficient to causeblocking. A mesoscale pressure gradient develops, di-rected perpendicular to and away from the mountains.A force balance is created between the pressure gradi-ent force and the Coriolis force (directed to the left inthe Southern Hemisphere). The result is a barrier windthat flows with the barrier to the left side (southerly forthis case).
Identification of a barrier wind along the Transant-arctic Mountains is obscured by storm motion. From0600 until 1800 UTC 15 May the cyclone moves rapidlynorthwestward, nearly parallel to the TransantarcticMountains. Removal of storm motion allows for cleareridentification of barrier wind effects. Storm-relativewind vectors are plotted over the sea level isobars inFigs. 12a–d. At 0900 UTC (Fig. 12a), storm-relativewinds between the cyclone and the TransantarcticMountains are southerly to southeasterly and down-slope off of the Transantarctic Mountains. At 1200 UTC(Fig. 12b) flow along the base of the TransantarcticMountains is transitioning from south-southeasterly to
FIG. 9. Actual (black) and isallobaric (gray) wind barbs (fullbarb � 5 m s�1) at 925 hPa. Actual wind is at 0900 UTC 15 May;isallobaric wind computed from pressure change tendency be-tween 0900 and 1200 UTC 15 May.
FIG. 8. Cross section of potential temperature (2-K contourinterval) and along cross-section wind vectors (arrows) alongtransect indicated in Fig. 7b.
JANUARY 2008 S T E I N H O F F E T A L . 15

a southeasterly flow, indicating the initiation of barrierwind forcing. By 1500 UTC (Fig. 12c), southeasterlystorm-relative wind speeds greater than 20 m s�1 north-west of 180° along the Transantarctic Mountains indi-cate that downslope wind forcing has been shut off bythe synoptic pressure gradient associated with the cy-clone and has been replaced by the barrier wind. The1800 UTC analysis (Fig. 12d) shows the barrier windextending north of 80°S. Storm motion has slowed con-siderably, while storm-relative wind speeds in the west-
ern sector of the cyclone increase and become strongerthan wind speeds in the eastern sector of the cyclone.The approximate 6-h lag period between barrier-perpendicular pressure gradient forcing (0900 UTC)and barrier wind response (1500 UTC) is justified for asynoptic-scale barrier wind event (O’Connor et al.1994).
Another possible explanation for the core of highwind speeds along the western edge of the cyclone is anincrease in the synoptic pressure gradient to the west.
FIG. 10. Sea level pressure (contoured, 2-hPa contour interval), surface potential temperature (shaded, interval 5 K), and surface windbarbs (full barb � 5 m s�1) from AMPS 30-km grid at (a) 0900, (b) 1200, and (c) 1500 UTC 15 May 2004, and (d) from the AMPS 10-kmgrid at 1800 UTC 15 May 2004. Thick black line represents transect used for pressure gradient magnitude calculation in Table 1. Blackdots represent locations of Schwerdtfeger and Marilyn AWS sites.
16 M O N T H L Y W E A T H E R R E V I E W VOLUME 136

The 500-hPa geopotential height field can be used overthe high-altitude regions west of the Ross Ice Shelf todetermine near-surface effects, as sea level pressure ad-justment is unreliable there. A moderate geopotentialheight gradient does exist south of the Ross Ice Shelfand over East Antarctica, although the gradient doesnot increase in magnitude between 0600 (Fig. 13a) and1800 UTC (Fig. 13b), it actually weakens, implying thatthe synoptic pressure gradient is not causing the in-crease in the pressure gradient in the western sector ofthe cyclone between 1500 and 2100 UTC. However,Fig. 13a illustrates the influence of the large-scale geo-potential height gradient on the formation of the bar-rier wind. The strong gradient in geopotential heightsoutheast of the Ross Ice Shelf in Fig. 13a originatesfrom a ridge over the Weddell Sea (not shown). Thenear-surface ridge of geopotential height over the con-tinental interior and the presence of the cyclone overthe central Ross Ice Shelf cause a strong surface pres-sure gradient to form over the southeastern Ross IceShelf, as shown in Figs. 10a and 10b. This pressure gra-dient results in wind speeds of 20 m s�1 to impingeupon the Transantarctic Mountains through 1200 UTC15 May.
b. Momentum forcing
Despite the clear presence of a barrier wind along theTransantarctic Mountains, the momentum forcingwithin the region between the cyclone and the Trans-antarctic Mountains is also influenced by the evolvinghorizontal pressure gradient (due to the interactionsbetween mass accumulation and the synoptic-scalepressure gradient associated with the cyclone) and ac-celerations (due to flow curvature and momentum ad-vection). An analysis of the terms in the equations ofmotion is done to better understand the physical forc-ing associated with the strong winds in the barrier windregion. Terms from the model-based x- and y-component equations of motion are computed on the925-hPa isobaric surface. The 925-hPa isobaric surface
is used so that the effects of friction are reduced, whilebarrier wind effects can still be represented and theanalysis remains above the surface in the region of in-terest. The analysis is done on a constant pressure sur-face rather than a sigma surface to facilitate interpre-tation, as terms in the isobaric equations of motion aremore familiar than those in the sigma coordinate equa-tions. Since the analysis is taken over a relatively flatsurface, isobars will be approximately parallel to modelsigma levels in the vertical, so that significant differ-ences would not be expected between coordinate sys-tems. Variables are interpolated to 925 hPa from thetwo bounding sigma surfaces. A logarithmic interpola-tion routine is used for geopotential height and a linearinterpolation routine is used for the other variables.The x–y coordinate system is rotated so that the equa-tion of motion in the along-flow (y) direction is
�m��
�y� fu �
��
�t� V · �� � Ry �3�
and the equation of motion in the cross-flow (x) direc-tion is
�m��
�x� f� �
�u
�t� V · �u � Rx , �4�
where
V · �A � mu�A
�x� m�
�A
�y� �
�A
�p, �5�
m is a map factor based on the polar stereographicprojection used in the model, Rx and Ry are the residualterms (which include friction), and the rest of the termshave their usual meteorological meaning. From a scaleanalysis of both horizontal momentum equations, cur-vature terms and the vertical components of the Corio-lis force are neglected. Horizontal partial derivativesare estimated using a fourth-order centered-difference
FIG. 11. Sea level pressure (hPa) difference between MarilynAWS and Schwerdtfeger AWS between 0900 and 1800 UTC 15May 2004.
TABLE 1. Sea level pressure difference [hPa (100 km)�1] for thewest and east sides of the cyclone from AMPS 30-km grid be-tween 0900 and 1500 UTC 15 May 2004 and AMPS 10-km grid at1800 UTC 15 May 2004. Distance refers to transect specified inFig. 10 at corresponding time for pressure gradient calculation.
Time(UTC)
Distance(km)
West[hPa (100 km)�1]
East[hPa (100 km)�1]
0900 240 5 51200 175 6 41500 140 6 41800 190 10.5 4.5
JANUARY 2008 S T E I N H O F F E T A L . 17

scheme, described in Haltiner and Williams (1980,chapter 5); partial derivatives in time are estimatedwith a time step of 1 h; and partial derivatives in thevertical are estimated over a 30-hPa vertical layer, cen-tered on 925 hPa.
Terms are grouped together as follows: the first termin (3) and (4) is the height gradient force term (HGF).The next term is the Coriolis force term (COR), whichis zero by definition in the along-flow direction (exceptfor the neglected vertical component). The next term in
FIG. 12. Sea level pressure (hPa) and surface storm-relative winds (relative to a path of storm motion 3 h before to 3 h after, andmagnitude of 17.1 m s�1) at (a) 0900 UTC 15 May 2004. (b) Storm motion of 19.2 m s�1 at 1200 UTC 15 May 2004. (c) Storm motionof 12 m s�1 at 1500 UTC 15 May 2004. (d) Storm motion of 2.9 m s�1 at 1800 UTC 15 May 2004 using AMPS 10-km grid. Contourinterval is 2 hPa and full barb � 5 m s�1.
18 M O N T H L Y W E A T H E R R E V I E W VOLUME 136

each equation is the local time tendency of the velocity(LC). The following term represents the advection ofmomentum, expanded in (5), and grouped as (ADV).The residual is a combination of friction and error.With along- and cross-flow components at each gridpoint, values are averaged in four 5 � 5 grid boxes toobtain a more robust result for the region of interest.Two averaging boxes (A and B) are computed at 1500UTC and shown in Fig. 14a, and two (C and D) arecomputed at 1800 UTC and shown in Fig. 14b. Thelocations for each box were chosen in an attempt tolimit spurious effects from the terrain to the west whileremaining within the barrier jet. Results of the compu-tations for each box are shown in Table 2. Box A has
been chosen to represent the developing barrier windregime at 1500 UTC, where flow is accelerating downthe height gradient in the along-flow direction, while inthe cross-flow direction there is nearly geostrophic bal-ance, with ADV countering the excess HGF. Box Brepresents flow at the leading edge of the barrier wind.The along-flow ADV term is larger than in box A, andan approximate balance is forged between LC (due tochanges in flow direction with time) and ADV (positivemomentum advection), indicating that upstream bar-rier wind effects are beginning to impact this region.There is approximate geostrophic balance in the cross-flow direction. Box C is in the same location as box Band is chosen to represent the developing barrier wind
FIG. 14. The 925-hPa geopotential height (m) and wind barbs at (a) 1500 and (b) 1800 UTC 15 May 2004. Contour interval is 10 m.Full barb � 5 m s�1. Boxes described in text.
FIG. 13. The 500-hPa geopotential height (m) at (a) 0600 and (b) 1800 UTC 15 May 2004. Contour interval is 15 m.
JANUARY 2008 S T E I N H O F F E T A L . 19

at 1800 UTC. Forcing in the along-flow direction isweaker compared with box B; however, the cross-flowHGF is larger and an approximate geostrophic balanceis no longer valid. The increase in HGF is due to thecontinued mass accumulation against the Transantarc-tic Mountains, forced by flow into the barrier in thesouthern sector of the cyclone. HGF is countered byboth COR and ADV, where the latter has increased inmagnitude since 1500 UTC from negative momentumadvection due to the effects of cyclonic curvature to theeast. In a typical barrier wind event, an approximategeostrophic balance develops between the mesoscalepressure gradient force and the Coriolis force. The cy-clonic curvature in this region will cause flow to besubgeostrophic. The increase in magnitude of �u /�x and�u /�y in the cross-flow advection term, due to the com-bined effects of cyclonic curvature and the barrier wind,causes a further departure from geostrophic balance.The large residual values for this box are attributed toerrors in finite differencing due to the large degree offlow curvature. Box D features an along-flow balancebetween the retarding HGF and positive ADV terms,and the cross-flow balance is similar to box C exceptthat ADV is smaller. Overall, the barrier wind systemdevelops substantially between 1500 and 1800 UTC,evidenced by the increase in cross-flow HGF. Contraryto typical barrier wind events, an approximate geo-strophic balance is not valid for the regions described at1800 UTC, as negative momentum advection due toflow curvature forces a three-way balance in the cross-flow direction between the height gradient force, Co-riolis force, and momentum advection.
c. Effects of barrier wind at McMurdo
Wind speeds of 25–35 m s�1 associated with the bar-rier wind are not directly responsible for the intensewindstorm at McMurdo. However, the barrier wind isan important component to the McMurdo windstorm.The intensification of the pressure gradient between80°S and Minna Bluff allows for strong wind speeds topersist past the region of barrier wind formation. With-out the barrier wind intensification of the synoptic pres-
sure gradient, wind speeds approaching Minna Bluffwould decrease as the flow adjusts to the weaker pres-sure gradient associated with the cyclone. Furthermore,without the barrier wind forcing, wind speeds in thewestern sector of the dissipating cyclone would be simi-lar to those found in the eastern sector, between 10 and15 m s�1 at 1800 UTC. Froude number calculations forMinna Bluff from AMPS at 1800 UTC using U0 � 12.5m s�1, H � 1000 m, �� � 4 K, and � � 256 K give Fr 1.01. Minna Bluff and Black Island would both causeblocking effects for wind speeds under 12.5 m s�1. Aswill be shown in the next section, continual overridingof Minna Bluff and Black Island due to strong barrierwinds and a Froude number greater than one are im-portant for development of the windstorm at Mc-Murdo. Last, the barrier wind enhances low-level coldair advection. Figure 10 shows that cold potential tem-perature air at the surface over the north-central RossIce Shelf at 0900 UTC (Fig. 10a) is entrained into thecyclonic circulation and approaches Minna Bluff by1800 UTC (Fig. 10d). Without the barrier wind, thecore of cold air would not reach the region by 1800UTC. The cold air near the surface increases low-levelstability and is shown to be an important feature ofdownslope windstorms in the next section.
5. Downslope windstorms
a. Hydraulic theory
AMPS indicates that southerly barrier winds havesufficient kinetic energy to traverse both Minna Bluffand Black Island after 1800 UTC 15 May, as U0 � 20m s�1, H � 1000 m (approximate for both terrain fea-tures), � � 252 K, and �� � 3 K gives Fr � 1.85. AMPSindicates wind speeds of approximately 50 m s�1 at2300 UTC (Fig. 3) and AWS observations indicate windspeeds upward of 60 m s�1 at 2000 UTC and around 40m s�1 at 2300 UTC (Fig. 2). Acceleration on the leeslope of Black Island indicates a downslope windstorm.Downslope windstorms are the result of verticallypropagating large-amplitude mountain waves. The pri-mary generation mechanism for downslope windstorms
TABLE 2. Magnitude of components (�10�4 m s�2) of horizontal momentum equation at 925 hPa. Location corresponds toaveraging box in Figs. 14a and 14b. Cross-flow components are positive to right of flow.
Time(UTC) Box
Along Cross
HGF COR LC ADV RES HGF COR LC ADV RES
1500 A 20 0 �24 8 4 64 �58 3 �18 �91500 B 13 0 �38 32 6 45 �46 6 �13 �81800 C 3 0 19 3 25 77 �49 9 �52 �151800 D �21 0 �3 40 16 75 �51 1 �27 �3
20 M O N T H L Y W E A T H E R R E V I E W VOLUME 136

is a transition of flow regimes at the top of the moun-tain, based on shallow-water hydraulic theory (Long1953; Durran 1986). Hydraulic theory and the shallow-water model provide a simplified model for downslopewindstorms, in that effects from a continuously strati-fied atmosphere and the vertical propagation of energyare neglected. Quantitative analysis of downslope ef-fects is not permissible for this case because of the com-plex topography, variable upstream conditions, and thelack of upper-air observations. An idealized, high-resolution modeling study of downslope windstorms forthe Ross Island region is beyond the scope of this pa-per. However, a qualitative analysis of AMPS outputcan provide insight into the role that downslope wind-storms have in producing strong winds in the McMurdoarea.
The acceleration of flow on the lee slope is the resultof subcritical (Fr 1) flow upstream of the obstacletransitioning to supercritical (Fr 1) flow on the leeslope. In this case the application of the Froude numberdiffers from that of a barrier wind diagnosis, where theratio is a function of terrain height. Instead, the Froudenumber is applied to a hydraulic layer, which in thiscase is a stable layer underlying a less stable layerabove. The Froude number can be defined as the ratioof fluid velocity to the propagation speed of shallow-water gravity waves. Because wave propagation speedis a function of fluid depth, the Froude number can beinterpreted as the ratio of fluid velocity to layer depth:
Fr �u
�gD, �6�
where u is the fluid velocity and D is the fluid thickness.Dynamically, the Froude number represents the ratioof the magnitude of nonlinear advection to the magni-tude of the pressure gradient generated by changes influid depth (Durran 1990):
u�u
�x�g�D
�x� �Fr2. �7�
The shallow-water momentum equation,
u�u
�x� g
�D
�x� g
�h
�x� 0, �8�
with the aid of the shallow-water continuity equation,
�uD
�x� 0, �9�
can be rearranged to show that changes in the depth ofthe fluid depend on the Froude number and on theterrain height:
�1 � Fr�2���D � h�
�x�
�h
�x, �10�
where h is the terrain height. With subcritical flow, andh increasing on the upslope, the fluid thickness willdecrease (the quantity D � h will decrease as well), andthe shallow-water continuity equation dictates that thefluid velocity must increase. Integration of (8) results in
u2
2� g�D � h� � 0, �11�
which shows that the sum of kinetic energy (first termon lhs) and potential energy (second term on lhs) re-main constant with the motion (Holton 1992). There-fore, for subcritical flow along the upslope (h increas-ing, D decreasing, D � h decreasing, and u increasing),potential energy will be converted to kinetic energy. Ifthe increase in fluid velocity and the decrease in thick-ness are sufficient to force the Froude number to ex-ceed unity, the flow will become supercritical at thecrest. Nonlinear effects will prevent the generation of ahorizontal pressure gradient that is capable of deceler-ating the flow along the lee slope. Using (7) it can beshown that the fluid will continue to accelerate alongthe downslope as potential energy continues to be con-verted to kinetic energy.
Figure 15 shows the wave structure over Minna Bluffand Black Island based on the wind speed and verticalpotential temperature distributions at 2100 UTC 15May. The structure of the potential temperature andwind fields in Figs. 15 and 16 (taken 2 h later at 2300UTC) show a qualitative resemblance to those seen inother observational and modeling studies of downslopewindstorms, such as the 11 January 1972 Boulder wind-storm (Klemp and Lilly 1975; Doyle et al. 2000) andthose observed in the Mesoscale Alpine Programme(MAP) in the central Alps (Jiang and Doyle 2004).Common features include an upstream lower-tropospheric inversion layer, a downward-sloping po-tential temperature field on the lee slope, strong windsalong the lee slope, and a hydraulic jump downstreamof the topography. In Fig. 15, there is a stability inter-face located at an altitude of about 2 km upstream ofMinna Bluff. Calculation of the Froude number withinthe hydraulic layer, as is done in idealized simulations,is not desirable for this case because the upstream sta-bility and wind speed are not uniform in either space ortime, terrain effects change with wind directionchanges, and because of influences originating outsideof the hydraulic layer. However, it is clear from a quali-tative perspective that the depth of the fluid layer de-creases on the upslope of Minna Bluff while the windspeed increases. On the downslope, acceleration con-
JANUARY 2008 S T E I N H O F F E T A L . 21

tinues, suggesting that flow has transitioned from sub-critical to supercritical flow at the crest. The layer thick-ness has decreased to about 1.5 km. Figure 15 indicatesthat acceleration also occurs on the downslope of BlackIsland, although not to the extent as on the downslopeof Minna Bluff. Downslope of Black Island the layerthickness has decreased to about 600 m. The core ofmaximum wind speeds extends about 30 km down-stream of Black Island.
b. Alternative theories
Hydraulic theory fails to take into account energypropagation through the top of the hydraulic layer,which has led to alternative theories for the develop-ment of downslope windstorms. These theories involvereflection of upward-directed wave energy back towardthe ground, leading to amplification of the wave system.Amplification can decrease the thickness of the hydrau-lic layer at the crest, leading to a transition to super-critical flow there. Klemp and Lilly (1975) show thatupward-propagating linear gravity waves can be re-flected downward from regions where the Scorer pa-rameter changes rapidly. The downward-reflectedwaves can superimpose with the upward-propagatingwaves, leading to amplification, when there is a one-
half vertical wavelength shift between the ground andtropopause. The vertical wavelength is
i 2
Ni
Ui � Ui�1
2, �12�
where U and N are wind speed and Brunt–Väisälä fre-quency, respectively, for layer i. Using generalized val-ues of N � 0.02 s�1 and U � 25 m s�1 for the bottomlayer, N � 0.01 s�1 and U � 15 m s�1 for the top layer,and U � 10 m s�1 above the tropopause, the tropo-pause would need to be at an altitude of about 3.5 kmfor optimal superposition of waves. Therefore it is un-likely that reflection of linear gravity waves leads towave amplification. Another possible wave amplifica-tion mechanism results from wave-breaking episodes(Clark and Peltier 1977, 1984; Peltier and Clark 1979,1983; Clark and Farley 1984). “Wave-induced criticallayers” are regions of mixing and reversed flow causedby breaking waves. Upward-propagating waves can re-flect downward from a critical layer and amplify thewave system. Figure 15 shows a region of steep isen-tropes and weak flow at about 6-km altitude over thedownslope of Black Island, indicative of wave-breakingthere. Figure 16 shows that the wave-breaking regionover the downslope of Black Island has descended to
FIG. 15. Cross section of potential temperature (contoured, interval 2 K) and horizontalwind speed (shaded, interval 6 m s�1) from �79.0°S, 166.0°E to �77.5°S, 167.0°E from AMPS3.3-km grid at 2100 UTC 15 May 2004. MB represents Minna Bluff, BI represents BlackIsland, and McM represents McMurdo.
22 M O N T H L Y W E A T H E R R E V I E W VOLUME 136

4.5 km and extends downward and downstream. Thesecritical layers set up by wave breaking may lead to waveamplification over Black Island.
Figure 16 also shows a region downstream of BlackIsland, between the surface and 3-km altitude, wherethe isentropes rise steeply and the wind speeds decreasesharply within a distance of about 10 km. Along withstrong upward vertical motion, these conditions arecharacteristic of a hydraulic jump. The hydraulic jumpoccurs as the flow transitions from supercritical flow tosubcritical flow downstream of Black Island. Notice inFig. 16 that the hydraulic jump is occurring upstream ofMcMurdo, so that the “shooting” flow from the down-slope windstorm does not reach McMurdo. The up-stream placement of the hydraulic jump is likely thereason that wind speeds are too low at McMurdo inAMPS.
6. AMPS errors
AMPS underestimates surface wind speed values inthe McMurdo area, as forecasts of wind speed for Mc-Murdo never exceed 25 m s�1, when observed windspeeds at Arrival Heights are upward of 40 m s�1 andwind speeds at Williams Field and Pegasus North areupward of 30 m s�1 (Fig. 2). The microscale processesleading to differences in wind speeds between Mc-
Murdo area reporting sites cannot be resolved withAMPS or observations. However, it can be shown thatmesoscale features in AMPS, supported by observa-tions and previous studies, can infer the cause of un-derestimated wind speed forecasts in the McMurdoarea.
The primary cause for the wind speed deficit inAMPS appears to result from a discrepancy in flowdirection upstream of McMurdo. Throughout thestrong wind event, wind directions at Minna Bluff aresouthwesterly in AMPS. As flow reaches Ross Island inAMPS, it is blocked and must flow around. Mass con-vergence leads to generation of a mesoscale pressuregradient and an associated deflection zone that is cen-tered near McMurdo, as shown in Fig. 17. However,AWS observations show wind directions southerly tosouth-southwesterly at Minna Bluff, and as flow isblocked by Ross Island, a mesoscale high pressure re-gion instead forms over Windless Bight, as shown inSlotten and Stearns (1987), O’Connor and Bromwich(1988), and Seefeldt et al. (2003). Unlike in AMPS, thedeflection zone does not extend to McMurdo, so thatflow will not split just upstream of there. The locationof the hydraulic jump is collocated with the strong pres-sure gradient associated with the southern edge of themesoscale high pressure region. Based on the hydraulicmodel discussed in section 5a, the pressure gradient
FIG. 16. Same as in Fig. 15 but for 2300 UTC 15 May 2004.
JANUARY 2008 S T E I N H O F F E T A L . 23

acts to decelerate the wind by counterbalancing non-linear advection. Without the mesoscale high pressureregion upstream of Ross Island, deceleration by thehorizontal pressure gradient cannot otherwise occur be-cause changes in hydraulic layer thickness cannot gen-erate a pressure gradient capable of counterbalancingnonlinear advection (Durran 1986). The transition offlow regimes from supercritical to subcritical results ina turbulent hydraulic jump. As the pressure gradientshifts location, so does the hydraulic jump. Therefore inreality the hydraulic jump (and the downstream edge ofthe shooting flow) will shift northward, so that thedownslope windstorm extends to McMurdo.
7. Conclusions and discussion
a. Event analysis and forecast assessment
The McMurdo 15–16 May 2004 windstorm originatesfrom a lower-tropospheric cyclone tracking from theSiple Coast onto the Ross Ice Shelf. Easterly winds inthe southern sector of the cyclone cannot traverse theTransantarctic Mountains, and a barrier wind develops,flowing northward. Wind speeds of 20–30 m s�1 alongthe western side of the cyclone are produced by south-erly barrier winds. Cold air at the surface is entrainedinto the cyclone and barrier wind, setting up a largevertical temperature gradient just south of Ross Islandby 1800 UTC 15 May. The strong low-level stability andhigh wind speeds result in downslope windstorms overMinna Bluff and Black Island that produce severe winddamage at McMurdo.
Downslope windstorms along the lee slopes of MinnaBluff, Black Island, and White Island appear to be com-mon whenever there are southerly winds greater thanabout 15 m s�1 and when low-level inversion conditionsare present. This case is unique in that the strong windsalong the lee slopes propagate past the bottom of thelee slope. Maximum wind speeds over 70 m s�1 at Mc-Murdo Building 71 and Arrival Heights appear to becaused by downslope effects off of local topographicfeatures in the area (Observation Hill and Crater Hill).The low-level inversion caused by the shooting flowfrom the downslope windstorm off of Black Islandwould set up favorable conditions for additional down-slope windstorms in the McMurdo area. However, amicroscale observation network would be necessary toproperly observe such effects.
AMPS is vital for diagnosing the physical processesinvolved in producing the windstorm at McMurdo. Er-rors in cyclone position and timing in AMPS lead torelatively minor biases at most AWS sites. The complextopography of the McMurdo area, along with the sen-sitivity of the mountain wave system to upstream con-ditions, cause errors to be amplified during the times ofpeak wind speeds. The amplification of errors, com-bined with important effects below the resolution of themodel and observations, illustrate the challenges to nu-merical modeling present in this case study.
b. Model improvements and future research
As of this writing, AMPS is transitioning from theMM5 to the Weather Research and Forecasting model(WRF; Skamarock et al. 2005). The higher-order nu-merics of WRF, along with the increased resolution ofthe Ross Island grid in AMPS (3.3 to 2.2 km), shouldimprove model representations of mesoscale featureslike mountain waves. Model errors away from areas ofcomplex terrain appear to originate from inaccuraciesin the storm track. Storm-track errors are likely causedby the limited observational coverage over continentalAntarctica. A three-dimensional variational data as-similation (3DVAR) system (Barker et al. 2004) hassince been implemented in the operational version ofAMPS, and current research involving 3DVAR in theAdvanced Research version of WRF shows great prom-ise for improvements in the initial conditions forAMPS. Specifically for this event, Powers (2007) showsthat the assimilation of filtered MODIS cloud-trackwinds in WRF AMPS improves the trajectory and tim-ing of the synoptic-scale cyclone featured in this casecompared with MM5 AMPS and WRF AMPS, leadingto more realistic wind speed forecasts for the McMurdoarea.
FIG. 17. Surface streamlines and sea level pressure (shaded,interval 4 hPa) from AMPS 3.3-km grid at 0000 UTC 16 May2004.
24 M O N T H L Y W E A T H E R R E V I E W VOLUME 136

Several mesoscale effects illustrated in this study re-quire further research. Barrier winds along the Trans-antarctic Mountains are often associated with the RossIce Shelf airstream (RAS; Parish et al. 2006). Analysisof the 15–16 May 2004 severe wind event in regard tothe RAS has been done by Adams (2005). This studyand future studies of the RAS will aid in placing thissevere wind event in the proper synoptic-scale and cli-matological perspective. Although not necessarilypoorly handled by AMPS, downslope windstorms inthe Ross Island region require further study. The au-thors are not aware of any observational or modelingstudies focused on downslope windstorms and the sub-sequent impact on McMurdo. A modeling study utiliz-ing higher horizontal resolution could better analyzethe effects of errors in background conditions on moun-tain wave representation. Increased resolution in thevertical would also be necessary to identify strato-spheric wave-breaking events and their effects on waveformation.
Acknowledgments. This research is supported by theNational Aeronautics and Space Administration(Grant NNG04GM26G) and the National ScienceFoundation, Office of Polar Programs (Grant 0230361and UCAR Subcontract S01-22901). We thank the Ital-ian Antarctic Program (Andrea Pellegrini) for provid-ing additional AWS data, the Space and Naval WarfareSystems Center (Art Cayette and Bob Vehorn) for ad-ditional information on their AWS sites in the Mc-Murdo area, and Andy Monaghan of BPRC/Ohio Statefor his logistical support throughout the project.
REFERENCES
Adams, A. S., 2005: The relationship between topography and theRoss Ice Shelf air stream. Ph.D. dissertation, University ofWisconsin—Madison, 125 pp.
Barker, D. M., W. Huang, Y.-R. Guo, A. J. Bourgeois, and Q. N.Xiao, 2004: A three-dimensional variational data assimilationsystem for MM5: Implementation and initial results. Mon.Wea. Rev., 132, 897–914.
Bromwich, D. H., J. F. Carrasco, and C. R. Stearns, 1992: Satelliteobservations of katabatic-wind propagation for great dis-tances across the Ross Ice Shelf. Mon. Wea. Rev., 120, 1940–1949.
——, J. J. Cassano, T. Klein, G. Heinemann, K. M. Hines, K.Steffen, and J. E. Box, 2001: Mesoscale modeling of katabaticwinds over Greenland with the Polar MM5. Mon. Wea. Rev.,129, 2290–2309.
——, A. J. Monaghan, K. W. Manning, and J. G. Powers, 2005:Real-time forecasting for the Antarctic: An evaluation of theAntarctic Mesoscale Prediction System (AMPS). Mon. Wea.Rev., 133, 579–603.
Cassano, J. J., J. E. Box, D. H. Bromwich, L. Li, and K. Steffen,2001: Evaluation of Polar MM5 simulations of Greenland’satmospheric circulation. J. Geophys. Res., 106, 33 867–33 890.
Clark, T. L., and W. R. Peltier, 1977: On the evolution and sta-bility of finite-amplitude mountain waves. J. Atmos. Sci., 34,1715–1730.
——, and R. D. Farley, 1984: Severe downslope windstorm calcu-lations in two and three spatial dimensions using anelasticinteractive grid nesting: A possible mechanism for gustiness.J. Atmos. Sci., 41, 329–350.
——, and W. R. Peltier, 1984: Critical level reflection and theresonant growth of nonlinear mountain waves. J. Atmos. Sci.,41, 3122–3134.
Dalrymple, P., 2004: A wicked storm. Antarctician Society News-letter, Vols. 4–5, No. 1, 7–10. [Available from AntarcticianSociety Newsletter, Box 325, Port Clyde, ME 04855.]
Doyle, J. D., and Coauthors, 2000: An intercomparison of model-predicted wave breaking for the 11 January 1972 Boulderwindstorm. Mon. Wea. Rev., 128, 901–914.
Durran, D. R., 1986: Another look at downslope windstorms. PartI: The development of analogs to supercritical flow in aninfinitely deep, continuously stratified fluid. J. Atmos. Sci.,43, 2527–2543.
——, 1990: Mountain waves and downslope winds. AtmosphericProcesses over Complex Terrain, Meteor. Monogr., No. 45,Amer. Meteor. Soc., 59–82.
Grell, G. A., J. Dudhia, and D. R. Stauffer, 1995: A description ofthe fifth-generation Penn State/NCAR Mesoscale Model(MM5). NCAR Tech. Note NCAR/TN-398�STR, 122 pp.
Guo, Z., D. H. Bromwich, and J. J. Cassano, 2003: Evaluation ofPolar MM5 simulations of Antarctic atmospheric circulation.Mon. Wea. Rev., 131, 384–411.
Haltiner, G. J., and R. T. Williams, 1980: Numerical Predictionand Dynamic Meteorology. 2nd ed. John Wiley & Sons, 477pp.
Holton, J. R., 1992: An Introduction to Dynamic Meteorology. 3rded. Academic Press, 511 pp.
Jiang, Q., and J. D. Doyle, 2004: Gravity wave breaking over thecentral Alps: Role of complex terrain. J. Atmos. Sci., 61,2249–2266.
Klemp, J. B., and D. R. Lilly, 1975: The dynamics of wave-induceddownslope winds. J. Atmos. Sci., 32, 320–339.
Liu, Z., and D. H. Bromwich, 1993: Acoustic remote sensing ofplanetary boundary layer dynamics near Ross Island, Ant-arctica. J. Appl. Meteor., 32, 1867–1882.
Long, R. R., 1953: Some aspects of the flow of stratified fluids I:A theoretical investigation. Tellus, 5, 42–58.
Nuss, W. A., and D. W. Titley, 1994: Use of multiquadric inter-polation for meteorological objective analysis. Mon. Wea.Rev., 122, 1611–1631.
O’Connor, W. P., and D. H. Bromwich, 1988: Surface airflowaround Windless Bight, Ross Island, Antarctica. Quart. J.Roy. Meteor. Soc., 114, 917–938.
——, ——, and J. F. Carrasco, 1994: Cyclonically forced barrierwinds along the Transantarctic Mountains near Ross Island.Mon. Wea. Rev., 122, 137–150.
Parish, T. R., J. J. Cassano, and M. W. Seefeldt, 2006: Character-istics of the Ross Ice Shelf air stream as depicted in AntarcticMesoscale Prediction System simulations. J. Geophys. Res.,111, D12109, doi:10.1029/2005JD006185.
Peltier, W. R., and T. L. Clark, 1979: The evolution and stabilityof finite-amplitude mountain waves. Part II: Surface wavedrag and severe downslope winds. J. Atmos. Sci., 36, 1498–1529.
——, and ——, 1983: Nonlinear mountain waves in two and threespatial dimensions. Quart. J. Roy. Meteor. Soc., 109, 527–548.
JANUARY 2008 S T E I N H O F F E T A L . 25

Powers, J. G., 2007: Numerical prediction of an Antarctic severewind event with the Weather Research and Forecasting(WRF) model. Mon. Wea. Rev., 135, 3134–3157.
——, A. J. Monaghan, A. M. Cayette, D. H. Bromwich, Y.-H.Kuo, and K. W. Manning, 2003: Real-time mesoscale model-ing over Antarctica: The Antarctic Mesoscale Prediction Sys-tem. Bull. Amer. Meteor. Soc., 84, 1533–1545.
Schwerdtfeger, W., 1984: Weather and Climate of the Antarctic.Elsevier, 261 pp.
Seefeldt, M. W., G. J. Tripoli, and C. R. Stearns, 2003: A high-resolution numerical simulation of the wind flow in the RossIsland region, Antarctica. Mon. Wea. Rev., 131, 435–458.
Skamarock, W. C., J. B. Klemp, J. Dudhia, D. O. Gill, D. M.
Barker, W. Wang, and J. G. Powers, 2005: A description ofthe Advanced Research WRF version 2. NCAR Tech. NoteNCAR/TN-468�STR, 88 pp.
Slotten, H. R., and C. R. Stearns, 1987: Observations of the dy-namics and kinematics of the atmospheric surface layer onthe Ross Ice Shelf, Antarctica. J. Climate Appl. Meteor., 26,1731–1745.
Stearns, C. R., L. M. Keller, G. A. Weidner, and M. Sievers, 1993:Monthly mean climatic data for Antarctic automatic weatherstations. Antarctic Meteorology and Climatology: StudiesBased on Automatic Weather Stations, Antarctic ResearchSeries, Vol. 61, D. H. Bromwich and C. R. Stearns, Eds.,Amer. Geophys. Union, 1–21.
26 M O N T H L Y W E A T H E R R E V I E W VOLUME 136
