political connections and government subsidies: …...political connections and government...
TRANSCRIPT

Political Connections and Government Subsidies:
State-level Evidence
Daniel Aobdia [email protected]
Kellogg School of Management Northwestern University
Allison Koester [email protected] McDonough School of Business
Georgetown University
Reining Petacchi [email protected] McDonough School of Business
Georgetown University
March 2018
Keywords: government subsidies; corporate political connections; quid pro quo Acknowledgements: We thank Laura Wellman (discussant), and workshop participants at Georgetown Law’s Tax Law and Public Finance Workshop, University of Maryland, and the 2018 FARS midyear meeting for helpful comments. We are grateful to Philip Mattera at Good Jobs First for state corporate subsidies data, Edwin Bender and Greg Schneider at the National Institute on Money in State Politics for state campaign contributions data, and Giuseppe Lombardo and Chris Olson for excellent research assistance.

Political Connections and Government Subsidies:
State-level Evidence
ABSTRACT
This paper examines whether corporate political connections are associated with government-awarded subsidies, and how this relation impacts subsidy effectiveness in spurring state future economic growth. Subsidies relate to foregone government revenues through income, sales, property, and payroll tax credits/abatements, and to government resource transfers through grants and cost reimbursement programs. Using novel datasets to identify state-awarded corporate subsidies and corporate contributions to state political candidates, we find that political contributions increase both the likelihood a company is awarded a state subsidy and the dollar value of subsidy awarded. Companies contributing to a greater number of candidates, to both Republican and Democratic Party candidates, and to both gubernatorial and legislative candidates reap the greatest subsidy benefits. Importantly, we find that subsidies are positively associated with a state’s future intra-industry jobs growth, but only for subsidies awarded to politically unconnected companies. This finding suggests quid pro quo behavior in the state subsidy award process results in a less effective allocation of government resources.

1
I. INTRODUCTION
Prior research documents a positive relation between corporate political connections and
firm value (e.g., Fisman, 2001; Faccio, 2006; Faccio and Parsley, 2009; Goldman et al., 2009;
Cooper et al., 2010) and several benefits of being politically connected.1 An emerging literature
suggests that companies use political connections as a tax planning strategy to reduce corporate
taxes paid. Studies in this area provide evidence that companies with federal political connections
pay less income tax (e.g., Kim and Zhang, 2016; Brown et al., 2015; Chen et al., 2018). However,
interpretations of this evidence have been limited largely due to the difficulty of identifying firm-
specific tax benefits. Preferential tax treatment at the federal level is typically granted to specific
industries or activities, not specific companies.2 Since federal tax preferences are also enjoyed by
peer firms, examining political connections at the federal level does not provide a direct link
between firm-specific political activities and tax benefits, nor does it pinpoint to the exact
mechanisms through which political connections reduce corporate taxes (Faccio, 2016).
To bridge this gap, we examine the relation between state-level corporate political
connections and corporate subsidies. U.S. state governments have a long history of awarding
financial subsidies to individual corporations. Multi-million dollar subsidies have been awarded
to well-known U.S. companies like Amazon, Boeing, Exxon Mobil, and General Motors, as well
as well-known foreign companies like Royal Dutch Shell, Sasol, Toyota, and Volkswagen. A New
1 These benefits include better access to credit (Khwaja and Mian 2005; Houston, Jiang, Lin, and Ma 2014), government procurement contracts (Goldman, Rocholl, and So 2013), government financial assistance (Faccio, Masulis, and McConnell 2006; Duchin and Sosyura 2012), and weaker regulatory monitoring (Kroszner and Stratmann 1998, Yu and Yu 2011) and enforcement (Correia, 2014). 2 Examples of corporate federal tax preferences include the income tax credit for qualified research and experimentation activities (available to corporations in all industries) and income tax deductions for domestic production activities (available to corporations with qualified manufacturing activities). Chen et al. (2018) identify 55 publicly traded firms that received firm specific federal tax benefits as the result of the 1986 Tax Reform Act. While such firm specific federal tax benefits are still possible, both the U.S. Senate and House have adopted procedural rules that make such provisions more difficult and generally politically unpalatable (Evans, 2008).

2
York Times article notes that “for local governments, [economic] incentives have become the cost
of doing business with almost every business” (Story, 2012). The stated goal of these incentive
programs is to create jobs and stimulate local economic growth. We consider the economic impact
of political connections beyond the firm by studying how political connections impact subsidy
effectiveness in spurring future economic growth within the state.
Proponents of state-provided corporate subsidies view the practice as a win-win for both
taxpayers and shareholders. From a taxpayer’s perspective, state-provided economic incentives
encourage corporations to make investments in local human capital and infrastructure, which spur
economic development and generates a larger future tax base (e.g., Cobb, 1993; Jenkins et al.,
2006; Baybeck et al., 2011). From a corporation’s perspective, state-provided subsidies lower the
cost of doing business – generally with few strings attached.3 Critics argue that state-provided
corporate subsidies are one side of a quid pro quo relationship built on “insidious cronyism”
(Brunori, 2014) and pay-to-play policies that favor those with political connections (e.g.,
Schlozman and Tierney, 1986; Baumgartner and Leech, 1998). For example, when a close friend
of New Jersey Republican Governor Chris Christie oversaw the New Jersey Economic
Development Authority, more than $1 billion of subsidies were awarded to 21 companies with
close ties to Governor Christie and the Republican Party, while only one company with strong
Democratic Party ties was awarded a subsidy (Swain, 2014).
It is not clear whether quid pro quo behavior in the subsidy granting process leads to more
or less effective allocation of government resources. Some theoretical work suggests quid pro quo
behavior in government results in ineffective allocation of taxpayer funds, as funds are not
allocated on a project’s merits (e.g., Stigler, 1971; Banerjee, 1997). In contrast, others suggest
3 While many states have added “clawback” provisions to subsidies in recent years, the provisions are not strictly enforced in every state and program (Mattera et al., 2012).

3
political connections reduce information asymmetries between politicians and companies, which
leads to better project and investment identifications and greater allocation effectiveness (e.g.,
Downs, 1957). Thus, whether awarding subsidies to politically connected companies a better or
worse use of taxpayer money, relative to awarding subsidies to companies without political
connections, is an empirical question.
We identify state-awarded corporate subsidies using a novel dataset from Good Jobs First,
a national policy resource center promoting corporate and government accountability. Our sample
is comprised of publicly traded companies that receive a subsidy from at least one state during
2000 through 2014. We find that the majority of state-awarded subsidies relate to foregone
government revenues through income, sales, property, and payroll tax abatements and credits.
Subsidies can also relate to resources transfers from the state government to the company through
grants, low-cost loans, and employee training and other cost reimbursement programs. We
measure political connections using state-level candidate campaign contributions by corporations
and their corporate-sponsored political action committees (PACs). These data are obtained from
the campaign finance watchdog agency National Institute of Money in State Politics.4
Our unit of observation is a company-year-state. We exploit the panel structure of our
sample and employ an extensive set of fixed effects to strengthen identification. We include
company-year fixed effects, which allow us to compare the relation between political contributions
and subsidies within a given company-year across states. This means that anything about a
company at a point in time that does not vary across states cannot affect our inferences. In addition,
we include state-industry-year fixed effects, which address the concern that a state interested in
4 A political action committee (PAC) is an organization that solicits contributions from individuals and corporations for use in supporting or opposing political candidates, ballot initiatives, and legislation. Corporate-sponsored PACs often solicit employees for personal financial contributions; these contributions are then used to support candidates with policies favorable to the corporation (Conlin and Lozada, 2015).

4
stimulating an industry at a point in time happens to award subsidies to a politically active industry.
These two extensive sets of fixed effects not only reduce the likelihood that inferences are driven
by correlated omitted variables, but also mitigate the concern that time-varying company-level
control variables induce inconsistent estimates (Gormley and Matsa, 2014). Our final sample
includes 545,345 company-year-state observations, of which 8,676 are classified as state subsidy
awardees and 44,060 are classified as politically connected at the state level.
Our analyses reveal a robust positive relation between state-level corporate political
connections and corporate subsidies. A corporation is more likely to receive a state-provided
subsidy when the corporation (1) makes a financial contribution to political candidates in the state,
(2) contributes a larger dollar amount to these state-level candidates, and (3) contributes to a greater
number of state-level candidates. These three factors are also associated with receiving a larger
subsidy amount. Companies contributing to a greater number of candidates, to both Republican
and Democratic Party candidates, and to both gubernatorial and legislative candidates reap the
greatest subsidy benefits. We exploit time-series variation in subsidies and political contribution
within a company in a given state. We continue to find a positive association between corporate
political contributions and state-awarded corporate subsidies. These findings are consistent with
critics’ concerns of cronyism and the pay-to-play nature of state government subsidies.
However, the positive relation between political contributions and state subsidies does not
address whether awarding subsidies to politically connected firms harms taxpayers. Subsidy
proponents argue that considering economic growth beyond the subsidy-receiving company paints
a more complete picture in assessing subsidy effectiveness (e.g., Klein and Moretti, 2013; Dolan,
2015). We examine the relation between subsidy awards and industry jobs growth, and whether
politically connected subsidy-receiving companies are more or less effective in contributing to this

5
growth. We find evidence that subsidies are positively associated with a state’s future intra-
industry jobs growth, but only for subsidies awarded to politically unconnected companies. This
finding suggests that quid pro quo behavior in the subsidy award process results in a less effective
allocation of government resources, consistent with taxpayers being harmed by pay-to-play
cronyism.
Our findings have important implications for accounting standards setters. In recent years,
both the Governmental Accounting Standards Board (GASB) and the Financial Accounting
Standards Board (FASB) are grappling with what governmental entities and public companies
should disclose regarding government-awarded corporate subsidies. In 2015, the FASB issued
Proposed Accounting Standards Update (ASU) ‘Government Assistance (Topic 832): Disclosures
by Business Entities about Government Assistance.’ This proposed ASU would require companies
to disclose the nature, significant terms and conditions, and financial statement impact of
government subsidy awards (FASB, 2015).5 Also in 2015, the GASB issued Statement No. 77
‘Tax Abatement Disclosures’ to increase public awareness of corporate subsidies granted by state
and local governments. Although the standard requires state and local governments to disclose the
annual aggregate dollar value of subsidies granted, recipient names and per-recipient amounts are
not required to be disclosed (GASB, 2015). Critics argue that aggregate disclosure will fail to
generate the transparency needed to discipline the subsidy-granting process, as taxpayers cannot
determine which companies are receiving subsidies (and whether these companies are politically
connected).6 Our finding that subsidies awarded to politically connected firms are a less effective
5 While in June 2016 the FASB decided to exclude income-tax related subsidies from the proposed ASU, the Board added income-tax related subsidy disclosure to an income-tax specific proposed ASU one month later (FASB, 2016). 6 We find that more than half of the 301 comment letters in response to GASB Statement No. 77 recommend disclosure of per-recipient dollar amounts and/or recipient names.

6
use of government fund speaks to the importance of a more granular level of disclosure on the
names of the companies receiving subsidies.
The remainder of this paper proceeds as follows. Second 2 provides institutional details
regarding the state subsidy granting process and the potential effect of subsides on future economic
growth. Section 3 discusses the data sources. Section 4 presents the analyses of the relation
between state subsidies and political contributions and Section 5 the effectiveness of state
subsidies. Section 6 concludes.
II. INSTITUTIONAL DETAILS
State subsidy granting process
While the subsidy granting process can differ by state, there are several common elements.
State governments have commerce departments and/or economic development agencies focused
on growing their state’s economy, primarily by retaining existing and generating new jobs and
businesses in their state. These departments and agencies can be part of the governor’s office, or
operate as a quasi-governmental agency overseen by the governor’s office or state legislature.
States often advertise their business-friendly practices through press releases and popular press
interviews. For example, in March 2017 the Baltimore affiliate of CBS aired a story featuring
Maryland Secretary of Commerce Mike Gill, the political appointee responsible for overseeing
Maryland Governor Larry Hogan’s economic growth agenda. Gill noted that “…the key to success
in economic development is growth through retention…we gotta get out there and tell and sell the
Maryland story” (CBS, 2017). Larger corporate economic incentive packages are often tailored to
specific companies, and generally require special approval from a state’s governor and/or
legislature. An article by Ernst & Young notes that “to act more boldly and swiftly, governors and

7
economic development leaders increasingly have access to more closing funds, which can not only
speed the process but also lead to some flexible or creative opportunities” (EY, 2016, p.6).
To illustrate, during Rick Perry’ 15 year tenure as governor of Texas, he used the Texas
Enterprise Fund to award more than $500 million in economic incentives to corporations interested
in relocating to or expand operations within Texas. This fund was created in 2003 by the Texas
state legislature at Perry’s request and permitted Perry (with sign-off required by the lieutenant
governor and state House speaker) to grant economic incentive packages to individual
corporations. However, some allege that Perry used the fund as a “political slush fund, …The
governor has collected millions of dollars in campaign contributions from … companies that have
received Enterprise Fund awards…Perry's office has vehemently denied that such contributions
influence the governor's decision-making” (Ura, 2014).
Companies seeking subsidies can also proactively contact state officials and economic
development agencies (CBS, 2017). Companies interested in relocating or expanding their
operations often hire site location consultants, who in turn solicit subsidy offers from states’
economic development agencies.7 A former General Motors real estate manager justifies the
location-shopping practice by noting that “management owes it to their stockholders to try to get
the best economic deal that they can” (Story, 2012).8 Ultimately, the subsidy process is a two-way
street, with Maryland Secretary of Commerce Gill noting that “economic development is a team
sport, it takes everybody trying to go in the same direction to make things happen” (CBS, 2017).
7 For more information on the role of site location consultants, see http://www.goodjobsfirst.org/corporate-subsidy-watch/site-location-consultants (last accessed March 10, 2017). 8 On occasion even CEOs of companies that receive state subsidies acknowledge that the incentives are not a government’s sharpest tool to stimulate long-term job growth. Hallmark is the recipient of more than $7 million in subsidies from Missouri and $1 million in subsidies from Kansas (GJF, 2013), and Hallmark CEO Donald Hall Jr. notes that “…this use of incentives is really transferring money from education to business” (Story, 2012).

8
Although the popular press emphasizes the quid pro quo behavior in the subsidy granting
process, there are several reasons why we may fail to find a positive association between state
subsidies and corporate political connections. First, laws regulating political campaign
contributions are enacted to help attenuate the link between money and political influence (Witko,
2005). Second, politicians may want to avoid negative publicity related to perceived cronyism,
and take steps so subsidies are not awarded to politically connected companies. Third, politicians
may place greater value on the generally positive press associated with attracting new and retaining
existing companies in their district than on financial contributions. To illustrate, when Wisconsin
Governor Scott Walker attracted Foxconn to the state with a $3 billion subsidy package in 2017
(the largest corporate subsidy in Wisconsin’s history), political pundits referred to the deal as “the
pinnacle of Walker’s time as governor” (AP, 2017a). Walker then announced his third-term re-
election bid at a manufacturing plant 15 miles from the expected Foxconn location (AP, 2017b).
Whether political contributions are systematically associated with a corporation receiving a state-
awarded subsidy is an empirical question.
The relation between subsidies and future economic growth
Subsidy-related economic growth fueled by companies other than the subsidy-receiving
company can take many forms. For example, if subsidies provide incentives to the recipient
company to expand operations within a state, then this company’s supply chain partners also have
incentives to expand operations within the state. In addition, complementary businesses may flock
to the region to better harness the subsidy-receiving company’s products and industry knowledge.
An article discussing the $3 billion subsidy Wisconsin awarded Foxconn illustrates this point:
“Wooing Foxconn wasn’t just about winning one factory….[it was about] Foxconn attracting new

9
companies working on developing applications for the LCD technology in medicine, security, and
advanced manufacturing” (Zumbach, 2017).
Economic growth can also occur in industries completely unrelated to the subsidy-
receiving company. For example, local stores and restaurants could expand their operations to
meet the growing needs of additional or higher salary workers. As 2016 Kentucky gubernatorial
candidate Drew Curtis notes “…when Toyota moved to central Kentucky, hundreds of other
companies set up shop here as well. Magnified positive network effects are what I’m looking for
if I’m going to offer tax incentives to a company” (Sonka, 2015). Similarly, an article discussing
the $1.6 billion automotive plant that Toyota and Mazda are expected to build in Alabama notes
that “….the impact of an auto assembly plant extends beyond its immediate economic impact, and
that’s why states offer robust incentives….it creates a halo effect that in turn helps attract other
projects” (Shepardson and Woodall, 2018).
In spite of the anecdotal evidence, prior research provides mixed evidence on whether
government subsidies or tax incentives provide a meaningfully positive impact on the local
economy. For example, using California enterprise zone data, Neumark and Kolko (2008) find no
evidence of increased employment, while Bostic and Prohofsky (2006) document at least a short-
term positive impact on wages. Even though frequently used as a means to attract business, Buss
(2001) noted that state and local governments rarely evaluate the cost and benefit tradeoffs in their
subsidy packages. Most of the prior studies on the effectiveness of government subsidies focus on
a single state program or type of program. We aim to extend the literature by examining a variety
of subsidy types awarded across all states and distinguishing the effect based on whether the
receiving companies are politically connected.
III. DATA SOURCES

10
Data on state subsidies to corporations
We obtain state-awarded subsidies to corporations from Good Jobs First (GJF), a national
policy resource center promoting corporate and government accountability. GJF created the
Subsidy Tracker 3.0 dataset (“the GJF data”) by compiling subsidy-related information from (i)
state and local government disclosures via reports and websites, (ii) direct data requests to
government agencies through Freedom of Information Act (FOIA) requests, (iii) government and
corporate press releases, (iv) newspaper articles, and (v) reports on specific projects by academics,
government agencies, and non-profit organizations (GJF, 2013).9 Since states may vary in their
voluntary disclosure of company-specific subsidies, in our research design, we include state-
industry-year fixed effects to mitigate potential bias from differences in disclosure across states,
or within a state across time.
We focus our analyses on corporate subsidies awarded by state governments as opposed to
municipalities, because subsidy data at the local municipality level is not as comprehensive as at
the state level; more than half of the nation’s 50 largest cities and counties fail to disclose the
names of companies receiving locally provided subsidies.10 More importantly, we are unaware of
U.S. municipalities being subject to systematic campaign finance reporting requirements, or an
organization that collects campaign contribution information across all U.S. municipalities. This
data limitation prevents us from establishing a link between corporate campaign contributions and
subsidy awards at the municipality level.
9 A complete list of data sources GJF relied on when creating the Subsidy Tracker 3.0 dataset is available on the GJF website (http://www.goodjobsfirst.org/subsidy-tracker-state-data-sources; last accessed February 18, 2016). 10 http://www.goodjobsfirst.org/blog/study-most-big-localities-still-fail-disclose-tax-break-recipients (last accessed January 30, 2018).

11
We start our sample period in 2000 because our state campaign contributions data are more
reliable after 2000. We end the sample period in 2014 because the frequency of the subsidies is
disproportionally low in 2015 and 2016, suggesting the data may be incomplete in these final two
years.11 As of January 25, 2016, the GJF data identifies 1,723 public and private parent companies
associated with 31,904 unique state-awarded subsidies from 2000 through 2014.12 Parent
companies include 71 of the Fortune 100 and 653 of the Fortune 1000, suggesting an economically
important group of companies receive government subsidies.
Subsidies can be awarded directly to the parent company or indirectly through its
subsidiaries. We aggregate all the subsidies granted to the subsidiaries to the parent company level.
We then link the GJF data to Compustat by parent company name. All possible matches were
manually reviewed for accuracy. Of the 1,723 parent companies in the GJF dataset, we identify
1,194 as publicly traded companies with Compustat data. We focus on publicly traded companies
because we require a measure of a state’s economic importance to a company that relies on
information in Form 10-K filed with the Securities Exchange Commission (SEC), which is
unavailable for privately held companies. This measure is critical in our analyses, because a
company is more likely to seek subsidies and establish political connections in states it has more
extensive operations. Given that we draw our inferences by comparing a given company-year
across states, not controlling for this variable can lead to an omitted variable problem. There are
25,261 state level subsidies awarded to these 1,194 public companies during our sample period.
11 Subsidies awarded in 2015 and 2016 represent merely 2.6% of the sample. The version of the Subsidy Tracker dataset we obtained from the GJF is January 2016. The lower data frequency in 2015 and 2016 suggests that the data collected in these two years are likely not comprehensive. 12 GJF notes that these parent companies “come from matching efforts involving all the companies on the following lists: the Fortune 1000, the Fortune Global 500, the companies listed on the New York Stock Exchange, the S&P 500, the Forbes list of the 224 largest private companies in the United States, the Uniworld list of the 1,000 largest foreign firms operating in the United States, and the Private Equity International list of the 50 largest private equity firms” (GJF, 2016).

12
One limitation of the GJF data is that it matches a subsidiary company that receives state
subsidies in a given year to its ultimate parent company based on the parent-subsidiary ownership
as of 2014. Thus, it is possible that a parent company actually did not own the subsidiary company
when the subsidy was awarded. Since both state subsidies and corporate political activities are
time varying, it is critical to precisely match a subsidy-receiving subsidiary company to its ultimate
parent company as of the award date. To remedy this, we manually verify the parent-subsidiary
relation for the 25,261 state subsidies for the 1,194 public companies, and remove 3,242 subsidies
(13% of the sample) awarded to a subsidiary not owned by the identified parent company as of the
award date. We find that the majority of these companies were privately held when the subsidy
was awarded. For the remaining 22,019 state subsidies, we further remove 3,674 with missing
subsidy values, leaving 18,345 subsidies representing 1,077 public companies in our final sample.
Table 1 shows that most state subsidies are in the form of tax incentives, including credits
and rebates related to income, sales, property, and payroll taxes. The distribution of these
incentives is highly skewed, with a mean value of $1.67 million, but a median of about $164,000.13
The next frequent state subsidies are cost reimbursement programs, usually relating to training
new or existing employees. The magnitude of these subsidies is relatively small, with a median
value of approximately $29,000. Subsidies can also take the form of grants, either outright cash or
forgivable loans. Although less frequent, the median dollar value of these grants is similar to that
of tax incentives. The “Other” category consists of 13 unique cases, including tax increment
financing programs, industrial revenue bonds, and infrastructure assistance programs. The large
subsidy value in this category is attributable to the 8 industrial revenue bond offerings by
13 Multi-year subsidies are recorded as the nominal amount, and not present-valued. Estimating discount rate for each company is subjective. We also do not have the data on the number of years the subsidy being awarded. We mitigate the influence of extreme values through winsorization and log transformation of the subsidy amount in our empirical analyses. However, we acknowledge that the subsidy amount is the upper bound of total subsidies a company received.

13
Wisconsin, Missouri, and Oklahoma. The proceeds of these offerings were awarded to companies
for development purpose. Appendix A provides examples of state subsidies from the GJF database.
Figure 1 presents subsidy frequency and average dollar value by year (Panel A), by industry
(Panel B), and by state (Panel C). Panel A shows that subsidy frequency has increased over time,
from a low of 105 awards in 2001 to a high of 2,971 awards in 2013. The dollar value of subsidy
awarded is high in the early years, but stabilizes to an average amount of around $1.2 million in
2007 and onwards. Panel B shows that companies across all industries receive state subsidies. The
agricultural industry on average receives the largest amount of state subsidies, followed by the
banking and other equipment & machinery industries. Panel C shows there is significant variation
in subsidies awarded by state. All states excluding Hawaii and Wyoming award at least one subsidy
to a publicly traded company during our sample period. The five states that on average award the
largest subsidies are New Jersey, Connecticut, Michigan, Texas, and Georgia. These states differ
significantly in terms of population, geographic location, industry concentration, political leanings,
and corporate tax policies, illustrating that corporate subsidies are an economic lever used by many
“types” of states. Overall, these panels highlight the importance of including state-industry-year
fixed effects to control for all time-varying and time-invariant state and industry heterogeneity in
the analyses.
Data on state political campaign contributions
Following the literature (e.g., Cooper et al., 2010; Wellman 2017; Chen et al., 2018), we
rely on company campaign contributions to capture a firm’s political connections. Financial
contributions provide an observable proxy for the firm’s access to politicians (Wellman 2017),
and we are interested in whether this access enhances the firm’s chance of obtaining subsidies
from the government. Prior studies find that companies generally contribute below the contribution

14
limit, and suggest that establishing a meaningful political connection with politicians requires
involvement beyond hard money campaign contributions (Ansolabehere et al. 2003; Cooper et al.
2010). However, these other activities are not systematically observable for all firms in all years.
Following Cooper et al. (2010), we use the number of candidates (as opposed to dollar amount)
the company contributes to as our primary proxy for the firm’s political connections. As long as
other types of political support are correlated with hard money campaign contributions, the number
of candidates the firm contributes to captures the overall political connections of the company.
There is significant variation in the extent to which state campaign finance law regulates
corporate direct and indirect political contributions to candidates pursuing a state government
office. For interested readers, Appendix B provides a list of which states permit direct and indirect
political contributions by corporations to candidates pursuing a state government office as of
2016.14 Although the stringency varies across states, all states permit indirect corporate
contributions to state office political candidates through corporate-sponsored PACs.15 Thus,
corporations can contribute either directly or indirectly through PACs to political candidates in all
50 states.16
14 Source: NCSL state limits on Contributions to Candidate, 2015-2016 Cycle (http://www.ncsl.org/Portals/1/documents/legismgt/elect/ContributionLimitstoCandidates2015-2016.pdf; last accessed January 28, 2018). 15 Corporate-sponsored PACs are only permitted to solicit voluntary financial contributions (up to $5,000 per year) from salaried employees with decision-making capacity, shareholders, and these two groups’ families (Jacobs et al., 2016). All donors must be U.S. citizens or green card holders. The corporation is permitted to pay all of the PAC’s administrative, legal, and solicitation costs so 100 percent of contributions can be used to support candidates with company-favorable policies. Employees are solicited via email and direct mail, and can receive small company perks for contributions. For example, British Petroleum employees who contribute at least 2.5 percent of their salary to the company’s corporate-sponsored PAC receive choice parking spots, and Wal-Mart employees who contribute to the company’s corporate-sponsored PAC receive a two-for-one match to Wal-Mart’s internal social services program for employees in need (Conlin and Lozada, 2015). 16 As of 2010, federal law permits corporations to make unlimited contributions to Super PACs, and state agencies and courts generally follow federal law on this issue (Covington, 2016). We do not study Super PACs because donations to Super PACs do not have to be disclosed (which is why Super PAC contributions are often referred to as a type of “dark money”) (https://www.opensecrets.org/dark-money/basics; last accessed May 12, 2017).

15
We identify state-level political campaign contributions by corporations and corporate-
sponsored PACs using data from the National Institute on Money in State Politics (NIMSP).
NIMSP is a non-partisan organization that collects and organizes data from campaign finance
reports required to be submitted to disclosure agencies in all 50 states by all candidates for state-
wide office. While reporting requirements vary by state, all 50 states mandate some form of
campaign contribution disclosure, and most states require annual reporting.17 We include state-
industry-year fixed effects in our analyses to alleviate concerns from potential differences in
campaign disclosure rules across states, and within a state across industries and years. We link the
NIMSP campaign contributions database to the GJF database by company name. Since a
contribution can be made by a subsidiary, our matching algorithm incorporates both parent
company and subsidiary company names.18 Of the 1077 public companies that receive state aids,
549 (51%) companies made campaign contributions to state officials from 2000 to 2014.
Table 2 provides descriptive information on state-level campaign contributions. We have
22,846 firm-state-election cycle observations. Panel A shows that the average dollar value of total
corporate contributions to state candidates in a state election cycle is $18,800. On average,
Republicans receive slightly larger contributions than Democrats. House candidates receive on
average $9,633 from each firm, while Senate candidates receive $5,996. To put these dollar values
in context, winning candidates in state Senate elections in 2010 raised an average of $188,105
(Osorio, 2012). Therefore, these contributions should be large enough to capture state politicians’
attention.
17 See details on each state’s reporting and disclosure requirements on the National Conference of State Legislatures (http://www.ncsl.org/research/elections-and-campaigns/disclosure-and-reporting-requirements.aspx) and the Campaign Finance Institute (http://www.cfinst.org/law/stateLinks.aspx) websites (last accessed March 3, 2017). 18 We thank Greg Schneider at NIMSP for help with this matching procedure.
16
Panel B shows that on average a firm supports a total of 18 state candidates, 11 Republicans
and 7 Democrats, in an election cycle. The high standard deviation suggests large variation in the
number of candidates a firm supports. Untabulated analysis suggests that the minimum number of
candidates a firm supports is 1, while the maximum is 124. On average a firm contributes slightly
above $1,000 (=$18,799.92/18) to each candidate in an election cycle.
Panel C presents average contribution dollar amount per candidate per election cycle by
state, along with each state’s campaign finance limits on corporate PAC contributions.19 Consistent
with prior research examining federal-level political connections (Ansolabehere et al., 2003;
Cooper et al. 2010), we find that state corporate political contribution limits are not binding on
corporate donations. This finding suggests that political contribution is a proxy for overall political
connection, which likely includes unobserved interaction between the firm and politician.
Data on state-level future jobs growth
We obtain annual total employment and annual payroll within an industry for each of the
50 states from the Census Bureau’s County Business Patterns (CBP) database. We focus on
outcomes related to labor growth because most state subsidies aim to create jobs. The CBP
database provides aggregated industry-level data on all businesses with paid employees within the
U.S. Industries are defined using six-digit NAICS values.20
19 These limits are as of the 2015-2016 election cycle. Source: NCSL state limits on Contributions to Candidate, 2015-2016 Cycle (http://www.ncsl.org/Portals/1/documents/legismgt/elect/ContributionLimitstoCandidates2015-2016.pdf; last accessed January 28, 2018). Limits are per election cycle, unless otherwise stated. 20 CBP data undergo automated and analytical edits that remove anomalies and validate geographic coding, addresses, and industry classification. CBP excludes (and therefore our analyses omit) the following NAICS industries: crop and animal production; rail transportation; National Postal Service; pension, health, welfare, and vacation funds; trusts, estates, and agency accounts; private households; and public administration. In addition, CBP excludes most establishments reporting government employees. CBP data can be accessed at https://www.census.gov/programs-surveys/cbp/data/datasets.html (last accessed 1/29/2018)

17
IV. POLITICAL CONNECTIONS AND STATE SUBSIDIES
Research design
Our empirical strategy consists of studying differences in state-awarded subsidies for a
specific company in a given year in states where the company makes political contributions
relative to states where the company makes no (or less) political contributions. Using a firm-year
as its own control mitigates the concern that firm-year heterogeneity is driving the results. The
model takes the following form:
Subjtk = α + β1PoliticalContribjtk + β2StateImportancejtk + FixedEffects + εjtk [1]
where j indexes the company, t indexes the year, and k indexes the state. Our unit of analysis is at
the company-year-state level, so all subsidies awarded to company j in year t by state k are
aggregated into one observation. We measure Sub using two variables. Subsidy is an indicator set
equal to one if state k awards a subsidy to company j in year t, and zero otherwise. SubsidyAmt is
the natural log of one plus the dollar amount of subsidy state k awards to company j in year t. We
log transform the variable because Table 1 shows that subsidy dollar value is highly skewed.
Collectively, Subsidy and SubsidyAmt capture whether and to what extent a company receives a
subsidy from a state in a given year.
PoliticalContrib is one of three variables (Contrib, ContribAmt, ContribCandCnt) that
measures corporate contributions to state-level political candidates. Since companies often seek to
establish long-term relationships with politicians (Snyder 1992), we follow Cooper et al. (2010)
and use a five-year window to measure corporate contributions. Because state election cycles are
every two or four years (depending on the state and office), a five-year measurement window also
ensure each PoliticalContrib variable captures all corporate contributions related to the most recent
18
election cycle. Contrib is an indicator set equal to one if company j contributes to a state k political
candidate in years t-4 through t, and zero otherwise. ContribAmt is the natural log of one plus the
dollar amount that company j contributes to state k political candidates in years t-4 through t. Given
that campaign contribution amount does not capture the total support a company provides for a
candidate, we caution readers from interpreting the coefficient magnitude of ContribAmt as a
“return on political investment.” To capture the extent of a company’s relationship-building, we
follow Cooper et al. (2010) and consider the number of political candidates a company contributes
to. ContribCandCnt is the natural log of one plus the number of state k political candidates that
company j contributes to in years t-4 through t.
It is possible that a company is more likely to contribute to a political candidate and more
likely to seek a subsidy in a state that is economically important to the company. To control for a
state’s economic importance, we follow Garcia and Norli (2012) and count the number of times a
state is mentioned in the company’s Form 10-K.21 The intuition is that the more times a state is
mentioned, the more likely the company has operations in the state. We consider a state to be
economically important to a company if the state’s percentage of mentions is more than 50 percent
of all U.S. state mentions in the company’s Form 10-K. StateImportance is measured as the number
of years state k is an economically important state to company j during years t-4 through t.
We include fixed effects for each company-year combination and each state-industry-year
combination, where industry is defined according to the Fama-French 12 industry classifications.
Including company-year fixed effects allows us to compare the relation between political
contributions and subsidies for a given company-year across states. Including state-industry-year
21 See Garcia and Norli (2012) for details on the methodology. We thank Diego Garcia and Oyvind Norli providing us with this measure for years before 2008. We estimate the measure following the procedure in Garcia and Norli (2012) for the remaining sample period.

19
fixed effects addresses the concern that a state awards subsidies to companies in an industry for
reasons unrelated to political activity (e.g., the state is interested in stimulating a specific industry
in a given year). These two extensive sets of fixed effects control for all time-varying and time-
invariant company, state, and industry characteristics with the potential to affect the contribution-
subsidy relation, making it unlikely that our inferences are affected by correlated omitted variables.
We estimate equation [1] using an OLS regression.22 We cluster standard errors by
company and state to correct for possible correlations across observations of a given company and
of a given state. Appendix C lists detailed variable definitions.
Main Results
Our sample is comprised of publicly traded companies that receive a subsidy from at least
one state during our 15-year sample period (2000 through 2014), yielding a final sample of 545,345
company-year-state observations. We require our sample firms receive at least one subsidy from
one state to mitigate the concern that we compare companies selected to receive a subsidy to
companies unlikely to be selected by any state to receive a subsidy due to factors that are
unobservable or difficult to measure. In addition, we ensure that the same parent-subsidiary
matches in the GJF data are used to identify state-level corporate political contributions by NIMSP.
That is, we similarly identified parent-subsidiary relations when creating both our dependent
variable (state-awarded subsidies) and our independent variable of interest (corporate
contributions to state political candidates).
Table 3 panel A shows that 1.6 percent of the sample (8,676 observations) receives a state
subsidy in the year, and 8.1 percent of the sample (44,060 observations) makes a contribution to a
22 Equation [1] has an extensive set of fixed effects. Greene (2004) illustrates that estimating a nonlinear model such as logit or probit model with an extensive set of categorical variables (e.g., fixed effects) can lead to biased inferences.

20
state politician in the recent five years. Untabulated analysis suggests that the average dollar value
of subsidy awarded for the 8,676 firm-state-year observations is $2.3 million, and the average
number of candidates the 44,060 observations make contribution to in the recent 5 years is 35.
Both the likelihood of receiving a state subsidy (Subsidy) and the subsidy amount (SubsidyAmt)
are positively correlated with the three contribution variables (Contrib, ContribAmt,
ContribCandCnt) at the one percent level.
Table 3 panel B presents the regression results on the relation between the likelihood of
receiving state subsidies and political contributions. We find that in a given year when a company
contributes to a state political candidate, the company is four percent more likely to receive a
subsidy from that state, relative to all the other states the company does not make campaign
contributions (Column 1). Larger contribution amounts (Column 2) and contributing to a greater
number of candidates (Column 3) also increase the probability of receiving a subsidy.
Panel C shows that the presence of a political contribution, the dollar value of
contributions, and the number of candidates supported are all associated with receiving a large
amount of state subsidy. The coefficient estimate on column [3] indicates that a one percent
increase in the number of candidates a firm contributes to in the recent 5 years increases current
year subsidy amount by 0.236%. Given that the average number of candidates a firm contributes
to in the recent 5 years is 35 and the average subsidy value for a given firm-state-year is $2.6
million, the estimate suggests that a firm can approximately obtain additional $18,000 by
contributing to one additional state politicians in a 5-year window.23
Overall, these results support our prediction that political connections a company
establishes with state officials are positively associated with the likelihood and amount of subsidies
23 One additional candidate is about a 3% increase in the average number of candidates a firm makes campaign contributions in the recent 5 years. 0.236%*3*$2.6M = $18,408

21
the company receives from the state government. We further find that companies are more likely
to be awarded a subsidy in states in which they have material operations. The coefficient on
StateImportance is positive and significant across all columns in both panels.
Robustness checks and additional analyses
Government incentive packages sometimes require companies commit to generate a certain
number of jobs and make a certain amount of capital investment once the subsidy is awarded. If
large, politically active companies are more likely to be awarded with subsidies with these
requirements, we have an omitted variable problem. To address this issue, we limit our sample to
state subsidies awarded in the current year (i.e., the 8,676 observations with Subsidy=1), because
subsidy characteristics are only relevant when a subsidy is awarded. We then regress the subsidy
amount on our political contribution variables, controlling for job and capital requirements.
We define CommitJobs (CommitCapital) as the natural log of one plus the number of jobs
(capital investment dollars) a company commits to in exchange for a state subsidy. Frequently, the
subsidy disclosure fails to include information about specific jobs and capital requirements. In this
case, we set CommitJobs (CommitCapital) equal to zero and the indicator variable
CommitJobsMissing (CommitCapitalMissing) equal to one. Due to limited variation within each
company-year in this sub-sample, we replace the company-year fixed effects with three time-
varying company characteristics: total assets (Size), leverage (Leverage), and cash effective tax
rate (CashETR). These company characteristics are chosen because prior research finds they are
associated with tax planning and the majority of subsidies relate to tax abatements and credits.
Table 4 shows that the three contribution variable coefficients continue to be positive and
significant – larger subsidy values are awarded when a company makes political contributions,
makes larger political contributions, and contributes to a greater number of candidates. We again

22
find larger subsidy awards for larger companies, and in states that are economically important to
the companies receiving the award, as indicated by the positive coefficients on Size and
StateImportance. The CommitJobs and CommitCapital coefficients are positive and significant in
all three columns, consistent with states awarding larger subsidies when companies are willing to
commit to greater human and capital investment. Importantly, these results show that political
contributions are incremental to jobs and capital commitment.24
Our next set of analyses consider time-series variation in the relation between a company’s
political contributions and subsidies within a given state. To exploit this variation, we replace the
company-year fixed effects with company-state fixed effects to control for any stationary attributes
of a company’s relation with state officials. We include Size, Leverage, and CashETR to capture
time-varying company characteristics.
Table 5 reports the results. We find that the presence of political contributions, the amount
contributed, and the number of candidates supported are all associated with a higher likelihood of
a company being awarded a state subsidy (panel A) and a higher subsidy amount (panel B). The
control variables are not significant, suggesting these variables have little variation across years.
This time-series within-state evidence suggests that our earlier finding is not simply a “headquarter
effect.” That is companies do not just seek government subsidies using political connections in the
headquarter state.
We conduct two additional sets of analyses. To conserve space, we do not tabulate these
results; all results are available upon request. First, we check whether our results are sensitive to
the extent a firm operates in a state. We repeat our analyses on two subsamples. The first subsample
24 Over half (three-fourths) of the subsidies have missing jobs (capital investment) commitment information. Limiting the sample to the 1,799 observations with non-missing CommitJobs and CommitCapital continues to indicate that larger subsidy amounts are positively associated with larger political contributions, jobs commitments, and capital commitments (untabulated).

23
focuses on states where a company is more likely to have operations by dropping states where the
company never mentioned in prior year 10-K. This requirement reduces the sample to 123,928
observations. The second subsample focuses on states where a company is more likely to have
material operations by requiring the state comprising ten percent of the state mentions in a
company’s prior year 10-K.25 This requirement reduces the sample to 27,131 observations. We
continue to find a positive relation between our three political contribution variables (Contrib,
ContribAmt, ContribCandCnt) and the likelihood of receiving a state subsidy, as well as the
subsidy amount. Importantly, the coefficient estimates of the political contribution variables are of
similar magnitude of those reported in Table 3. The fact that the magnitude estimates do not vary
across state presence requirements suggests our full sample results are not driven by a spurious
relation due to no state presence.
The analyses thus far measure political contributions over a five year period (t-4 through
t). In the second analysis we measure contributions by year during the five year period to test for
a “recency” effect. We find highly significant coefficients for each of the five annual contribution
variables in all specifications. The magnitude of these coefficient estimates is not statistically
different from each other. This result is consistent with a long-term political connections strategy
(e.g., Snyder, 1992; Brown et al. 2015) in securing state subsidies.26
Considering type of political contribution
We next consider how cross-sectional variation in the type of political contributions affects
the likelihood of being awarded a subsidy and the dollar value of the awarded subsidy. We first
examine if a company that contributes to only a few candidates has the same likelihood of receiving
25 Results are robust to requiring that the company mention a state above the sample median state mentions of 3.3%. 26 Inferences are also robust to including future political contributions measured from t+1 through t+4 (untabulated).

24
a subsidy or receives a subsidy of similar size as a company that contributes to many more
candidates. We divide observations with ContribCandCnt=1 into four mutually exclusive groups.
ContribCand1 is an indicator variable set equal to one if a company makes political contributions
to only one candidate in a state in years t-4 through t, and zero otherwise. Analogously,
ContribCand2-5 (ContribCand6-10) [ContribCand11] is an indicator variable set equal to one if
a company supports two to five (six to ten) [11 or more] state candidates, and zero otherwise. All
four variables are set equal to zero when ContribCandCnt=0. This analysis tells us whether there
is an incremental advantage (or disadvantage) of making contributions beyond a certain number
of candidates.
Table 6 panel A reveals that supporting any number of candidates – even only one –
increases the likelihood of being awarded a subsidy and the subsidy value. Within each column,
coefficient values monotonically increase as the number of candidates supported increases. F-
statistics confirm that coefficient values between adjacent groups (i.e., ContribCand1 versus
ContribCand2-5; ContribCand2-5 versus ContribCand6-10; and ContribCand6-10 versus
ContribCand11) are statistically different. These findings indicate that while contributing to only
one political candidate is beneficial, showering many candidates with contributions is most
advantageous.
We next consider the impact of candidates’ political affiliation on subsidy outcomes. Panel
B shows that supporting only Democratic Party candidates (ContribDemOnly=1) or only
Republican Party candidates (ContribRepubOnly=1) is positively associated with subsidy
outcomes. F-tests indicate that the ContribDemOnly and ContribRepubOnly coefficients are
statistically indistinguishable from one another in both columns [1] and [2]. Thus, contributing to
candidates from only one political party yields similar benefits, regardless of which political party

25
is supported. This finding suggests that both major political parties engage in similar amounts of
quid-pro-quo cronyism regarding corporate subsidy awards. Contributing to candidates from both
political parties (ContribDem&Repub=1) is also positively associated with subsidy outcomes. F-
tests reveal that the ContribDem&Repub coefficient is statistically larger than the
ContribDemOnly or ContribRepubOnly coefficient in both columns. This finding suggests that
showering candidates from both political parties with financial contributions is most advantageous
in securing state subsidies.
Our final analyses consider the impact of candidates’ branch of government on subsidy
outcomes. Panel C shows that contributing to only gubernatorial candidates (ContribGubOnly=1)
or only legislative candidates (ContribLegOnly=1) is positively associated with subsidy outcomes.
F-tests indicate that the ContribGubOnly and ContribLegOnly coefficients are statistically
indistinguishable from one another in both columns. This finding suggests that both branches of
government engage in similar amounts of quid-pro-quo cronyism in the subsidy award process.
We further find that contributing to both gubernatorial and legislative candidates
(ContribGub&Leg) yields the greatest payoff. F-tests indicate that the ContribGub&Leg
coefficient is statistically larger than the ContribGubOnly or ContribLegOnly coefficient in each
column.
V. STATE SUBSIDIES AND FUTURE JOB GROWTH
Research design
Our second research question examines the relation between a state’s subsidy awards and
future jobs growth, and whether subsidies awarded to politically connected companies are more or
less effective in contributing to this growth. We focus on future jobs growth because the goal of

26
most state incentive packages is to stimulate local jobs. If politicians use subsidies solely to
advance their political careers, companies awarded subsidies are not selected on merit, but through
political patronage. In this case, subsidies awarded to politically connected companies will
generate low or insignificant jobs growth, a result consistent with politically motivated subsidy
awards being a less useful allocation of taxpayer funds.
Information asymmetry is the key reason for why resource allocations or investment
decisions could be inefficient (Myers and Majluf 1984). Information asymmetry exists between
politicians and firms competing for state subsidies, hindering politicians from identifying the most
competent companies to receive state incentive packages. If political connections mitigate the
adverse effect of information asymmetry, they would facilitate politicians to better identify the
projects suitable for the state. In addition, given that only large firms can afford being politically
active (Cooper et al. 2010), political connections may serve as a signal, helping politicians to
identify firms more capable of stimulating local economy. Under these scenario, awarding
subsidies to politically connected companies should generate more jobs growth relative to
awarding subsidies to politically unconnected companies.
We employ the following regression model to investigate whether political connections
affect the effectiveness of state subsidies in stimulating future jobs growth:
JobsGrowthkit+n = α + β1StateSubkit + FixedEffects + εkit+n [2a]
JobsGrowthkit+n = α + β1StateSub_NoContribkit + β2StateSub_Contribkit + FixedEffects + εkit+n [2b]
where k indexes the state, i indexes the industry, and t indexes the year. The dependent variable
JobsGrowth is measured as the one, two, and three-year percentage change in employees
(%ΔEmployees) or payroll (%Δpayroll) within state k and industry i. The variable StateSub in
equation [2a] captures total subsidies awarded within an industry in the state. We measure StateSub

27
using two variables. StateSubAmt is the natural log of one plus the total dollar amount of subsidies
awarded by state k within industry i in year t; and StateSubCnt is the total number of subsidies
awarded by state k within industry i in year t.
In equation [2b], we separately measure the amount and number of subsidies awarded to
non-politically connected (StateSub_NoContrib) and politically connected (StateSub_Contrib)
firms. StateSubAmt_NoContrib (StateSubAmt_Contrib) is defined as the natural log of one plus
the total dollar amount of subsidies awarded by state k within industry i in year t to not politically
connected (politically connected) firms. The variable StateSubCnt_NoContrib
(StateSubCnt_Contrib) is defined as the total number of subsidies awarded by state k within
industry i in year t to not politically connected (politically connected) firms.
We include industry-year and state-year fixed effects in equations [2a] and [2b] to control
for all time-varying and time-invariant factors at the state and industry level that could affect
employee and payroll growth. We cluster standard errors by industry and by state to correct for
possible correlations across observations within an industry and within a state.
Results
Table 7 panel A shows that on average the growth in employees hired within an industry
is decreasing over a one, two, and three-year windows in our sample period. The growth in payroll
is negative in a one year window, but positive in a three-year window. Panels B and C report
regression results from estimating equations (2a) and (2b). These panels show that, on average,
there is a positive relation between the dollar amount of subsidies a state grants within an industry
and future intra-industry jobs growth. StateSubAmt is positively associated with both future
employee growth (Panel B) and wage growth (Panel C). However, when subsidies are decomposed
into those awarded to politically connected versus politically unconnected companies, we find that

28
only subsidies awarded to politically unconnected companies contribute to this positive jobs
growth. We fail to find any relation between subsidies awarded to politically connected companies
and future intra-industry employee growth (Panel B) or wage growth (Panel C). In Table 8 we
repeat these analyses using the number of subsidies awarded instead of the amount of subsidies
awarded, and obtain similar inferences.
The fact that subsidies awarded to politically connected firms do not generate future job
growth suggests that the quid pro quo nature of state subsidy awards results in a less effective use
of taxpayer funds.
VI. CONCLUSION
This paper examines whether corporate contributions to politicians are associated with a
corporation receiving a government subsidy, and how the relation affects taxpayers. We test our
research question in the U.S. state setting. State-level analyses provide rich variation in corporate
political contributions and the amount of governmental subsidies awarded. We find robust
evidence that corporate political contributions increase both the likelihood a company is awarded
a state subsidy and the dollar value of subsidy awarded. Corporations contributing to more
candidates, to both Republican and Democratic Party state candidates, and to both gubernatorial
and state legislative candidates, reap the greatest benefits. Additional tests provide evidence that
subsidies are positively associated with a state’s future intra-industry jobs growth, but only for
subsidies awarded to politically unconnected companies.
Our findings are consistent with concerns that cronyism and pay-to-play policies result in
taxpayer funds being disproportionately transferred to politically connected companies, and that
this practice is detrimental to taxpayers. The fact that politically motivated state subsidies do not
lead to jobs growth suggests that the criticisms about the quit pro quo behavior in the subsidy

29
granting process need to be reconsidered. Our findings also have important implications for the
GASB and FASB as they consider the extent to which government-related subsidy awards are
disclosed by governmental entities and public companies.
30
REFERENCES
Ansolabehere, S., J.M. de Figueiredo, and J.M. Snyder Jr. 2003. Why is there so little money in U.S. politics? Journal of Economic Perspectives 17: 105–130.
Ahern, K., and J. Harford. 2013. The importance of industry links in merger waves. Journal of
Finance 69(2): 527-576. Aobdia, D., J. Caskey, and N.B. Ozel. 2014. Inter-industry network structure, information transfer,
and the cross-predictability of earnings and stock returns. Review of Accounting Studies 19(3): 1191-1224.
Associated Press (AP). 2017a. Foxconn news gives Wisconsin Gov. Scott Walker a major political
boost. Twin Cities Pioneer Press (July 26). http://www.twincities.com /2017/07/26/�ehavio-news-gives-wisconsin-gov-scott-walker-a-major-political-boost-and-none-too-soon/ (last accessed November 22, 2017).
Associated Press (AP). 2017b. Update: Governor Scott Walker announces re-election bid. WEAU
13 News (Nov 5). http://www.weau.com/content/news/Wisconsins-Walker-says-hell-run-on-plan-to-spread-wealth-455362913.html (last accessed February 12, 2018).
Banerjee, A. 1997. A theory of misgovernance. Quarterly Journal of Economics 112: 1289–1332. Bartik, T. 2002. Evaluating the impacts of local economic development policies on local economic
outcomes: What has been done and what is doable? Working Paper. Bartik, T. 2005. Solving the problems of economic development incentives. Growth and Change
36(2): 139-166. Baumgartner, F., and B. Leech. 1998. Basic instincts: The importance of groups in politics and in
political science. Princeton, NJ: Princeton University Press. Baybeck, B., W.D. Berry, and D.A. Siegel. 2011. A strategic theory of policy diffusion via
intergovernmental competition. Journal of Politics 73(1): 232-247. Bostic, R. W., and A. C. Prohofsky. 2006. Enterprise zones and individual welfare: A case study
of California. Journal of Regional Science 46:175-203.

31
Brown, J., Drake, K., and L. Wellman. 2015. The benefits of a relational approach to corporate political activity: evidence from political contributions to tax policymakers. Journal of the American Taxation Association 37(1): 69-102.
Brunori, D. 2014. Where is the outrage over corporate welfare? Forbes.com (Mar 14).
https://www.forbes.com/sites/taxanalysts/2014/03/14/where-is-the-outrage-over-corporate-welfare/#6692523427dd (last accessed March 8, 2017).
Bureau of Economic Analysis (BEA). 2016. Gross domestic product (GDP) by state (millions of
current dollars). http://www.bea.gov (last accessed March 2, 2016). Buss, T.F. 2001. The effect of state tax incentives on economic growth and firm location decisions:
An overview of the literature. Economic Development Quarterly 15(1): 90-105. CBS. 2017. Hogan Administration wants more big name companies in Maryland.
http://baltimore.cbslocal.com/2017/03/07/hogan-administration-wants-more-big-name-companies-in-maryland/ (last accessed March 9, 2017)
Chen, Z., S. Dyreng, and B. Li. 2018. Corporate political contributions and tax avoidance. Working
paper, Duke University. Cobb, J. 1993. The selling of the South: the southern crusade for industrial development, 1936-
1990. Urbana: University of Illinois Press. Conlin, M., and L.I. Lozado. 2015. The new U.S. office politics: funding your boss’s political
causes. Reuters Special Reports. http://www.reuters.com/article/usa-election-workers-id USL1N0XZ1XR20150511 (last accessed August 17, 2017).
Cooper, M., Gulen, H., and A. Ovtchinnikov. 2010. Corporate political contributions and stock
returns. Journal of Finance 65: 687-724. Correia, M. 2014. Political connections and SEC enforcement. Journal of Accounting and
Economics 57: 241-262. Covington, 2016. Forming and operating Super PACs: a practical guide for political consultants
in 2016 (May 23). https://www.cov.com/-/media/files/corporate/publications/2016/05/ forming_and_operating_super_pacs_a_practical_guide_for_political_consultants_in_2016.pdf (last accessed August 17, 2017).
32
De Figueiredo, J.M., and B.S. Silverman. 2006. Academic earmarks and the returns to lobbying. Journal of Law and Economics 49(2): 597-625.
Davis, W. 2016. Boeing PAC’s contributions to governors groups take off.
http://www.citizensforethics.org/boeing-pacs-contributions-governors-groups-take-off/(last accessed March 23, 2017).
Dolan, M. 2015. Tax-subsidy programs fuel budget deficits. Wall Street Journal (Feb 11).
https://www.wsj.com/articles/corporate-tax-incentives-generate-budget-problems-1423696411?mg=prod/accounts-wsj (last accessed January 1, 2018).
Downs, A. 1957. An economic theory of political action in a democracy. Journal of Political
Economy 65, 135–150. Duchin, R. and D. Sosyura. 2012. The politics of government investment. Journal of Financial
Economics 106: 24-48. Ernst & Young (EY). 2016. Location investment, credits and incentives survey.
http://www.ey.com/Publication/vwLUAssets/EY-location-investment-credits-and-incentives-survey/%24FILE/EY-location-investment-credits-and-incentives-survey.pdf (last accessed October 24, 2017).
Evans, M.W. 2008. The new rules for limited tax benefits in tax legislation. Tax Notes (May 12):
597-612 Faccio, M. 2006. Politically connected firms. American Economic Review 96: 369-386. Faccio, M. 2016. Discussion of corporate political connections and tax aggressiveness.
Contemporary Accounting Research 33 (1): 115-120. Faccio, M. and H. Hsu. 2017. Politically connected private equity and employment. Journal of
Finance 72 (2): 539-574. Faccio, M., Masulis, R., and J. McConnell. 2006. Political connections and corporate bailouts.
Journal of Finance 61 (6): 2597-2635. Faccio, M. and D. Parsley. 2009. Sudden deaths: Taking stock of geographic ties. Journal of
Financial and Quantitative Analysis 33: 683-718.

33
Faulhaber, L. 2017. Beyond Apple: State aid as a model of robust anti-subsidy rule. Georgetown Journal of International Law 48: 381-405.
Financial Accounting Standards Board (FASB). 2015. Exposure Draft to Proposed Accounting
Standard Update: Government Assistance (Topic 832). Disclosure by Business Entities about Government Assistance. Norwalk, CT (November 15).
Financial Accounting Standards Board (FASB). 2016. Exposure Draft: Proposed Accounting
Standards Update, Income Taxes (Topic 740) Disclosure Framework – Changes to the Disclosure Requirements for Income Taxes (July 2016).
Fisman, R. 2001. Estimating the value of political connections. American Economic Review 91:
1095-1102. Garcia, D. and O. Norli. 2012. Geographic dispersion and stock returns. Journal of Financial
Economics 106: 547-565. Goldman, E., Rocholl, J., and J. So. 2009. Do politically connected boards affect firm value?
Review of Financial Studies 22(6): 2331-2360. Goldman, E. Rocholl, J., and J. So. 2013. Politically connected boards of directors and the
allocation of procurement contracts. Review of Finance 17: 161-1648. Good Jobs First (GJF). 2013. Show us the local subsidies: cities and counties disclosing economic
development subsidies. http://www.goodjobsfirst.org/sites/default/files/docs/ pdf/showusthelocalsubsidies.pdf (last accessed February 17, 2016).
Good Jobs First (GJF). 2016. http://www.goodjobsfirst.org/parentcoverage (last accessed
February 17, 2016). Gormley, T.A. and D.A. Matsa. 2014. Common errors: how to (and not to) control for unobserved
heterogeneity. Review of Financial Studies 27(2): 617-61. Governmental Accounting Standards Board (GASB). 2015. Statement No. 77 ‘Tax abatement
disclosures.’ Norwalk, CT (August). Gramlich, J., and J. Whiteaker-Poe. 2013. Disappearing subsidiaries: The cases of Google and
Oracle. Available on SSRN: http://ssrn.com/abstract=2229576.
34
Greenbaum R. T. and Landers J. 2009. Why are state policy makers still proponents of enterprise zones? What explains their actions in the face of a preponderance of the research? International Regional Science Review 32(4): 466-479.
Greene, W. 2004. The �ehavior of the maximum likelihood estimator of limited dependent
variable models in the presence of fixed effects. The Econometrics Journal 7(1): 98-119. Gupta, S., and L .Mills. 2002. Corporate multistate tax planning: benefits of multiple jurisdictions.
Journal of Accounting and Economics 33: 117-139. Herbert, T., Olligs, P., and M. Overesch. 2015. Public disclosure of foreign subsidiaries and
aggressive international tax avoidance. Available at SSRN: http://ssrn.com/ abstract=2640552.
Houston, J., Jiang, L., Lin, C., and Y. Ma. 2014. Political connections and the cost of bank loans.
Journal of Accounting Research 52 (1): 193-243 Jacobs, R., L. Norton, J. Ryan, and M. Rohlfing. 2016. Forming a corporate political action
committee (Venable LLP – Political Law). https://www.venable.com/files/Publication/ 9d9e6115-a639-4060-afbf-df1fa813c66d/Presentation/PublicationAttachment/25855334-0011-4a00-b9ce-f0d8e70a09a4/Venable_Alert-Forming_a_Corporate_Political_Action_ Committee.pdf (last accessed August 17, 2017).
Jenkins, J., K. Craig, T. Leicht, and H. Wendt. 2006. Class forces, political institutions, and state
intervention: subnational economic development policy in the United States, 1971-1990. American Journal of Sociology 111(4): 1122-80.
Khwaja, A.I. and A. Mian. 2005. Do lenders favor politically connected firms? Rent provisions in
an emerging financial market. The Quarterly Journal of Economics 120(4): 1371-1411. Kim, C. and L. Zhang. 2016. Corporate political connections and tax aggressiveness.
Contemporary Accounting Research 33: 78-114. Klein, P. and E. Moretti. 2013. People, places and public policy: Some simple welfare economics
of local economic development programs. National Bureau of Economic Research Working Paper No. 19659, National Bureau of Economic Research. http://www.nber. Org/papers/w19659

35
Kroszner R. and T. Stratmann. 1998. Interest-group competition and the organization of congress: Theory and evidence from financial services’ political action committees. American Economic Review 88 (5): 1163-1187.
Mattera P., T. Cafcas, L. McIlvaine, A. Seifter, and K. Tarczynska. 2012. Money-back guarantees
for taxpayers: clawbacks and other enforcement safeguards in state economic development subsidy programs, http://www.goodjobsfirst.org/moneyback (last accessed January 22, 2018).
Myers, S., Majluf, N., 1984. Corporate financing and investment decisions when firms have
information that investors do not have. Journal of Financial Economics 13, 187–221. National Conference of State Legislatures (NCSL). 2016. http://www.ncsl.org/research/elections-
and-campaigns/campaign-contribution-limits-overview.aspx (last accessed August 17, 2017).
Neumark, D., and J. Kolko. 2008, December. Do enterprise zones create jobs? Evidence from
California’s enterprise zone program. NBER Working Paper Series. Osorio, D. 2012. The cost of winning a Senate race (May 9). https://dposorio.com/822/the-cost-
of-winning-a-senate-race/#table (last accessed January 17, 2018). Schlozman, K., and J. Tierney. 1986. Organized interests and American democracy. New York,
NY: Harper & Row Publishers. Shepardson, D. and B. Woodall. 2018. Toyota, Mazda to build $1.6 billion plant in Alabama:
sources. Reuters. https://www.reuters.com/article/us-usa-alabama-plant/toyota-mazda-to-build-1-6-billion-plant-in-alabama-sources-idUSKBN1EY2PF (last accessed January 10, 2018).
Shleifer, A., Vishny, R. 1994. Politicians and firms. Quarterly Journal of Economics 109, 995–
1025. Snyder Jr., J. 1992. Long-term investing in politicians; or, give early, give often. Journal of Law
and Economics 35: 15-43. Sonka, J. 2015. Kentucky has given $830 million in economic development tax incentives to
companies since 2012 (Sep 1). Insider Lousville. http://insiderlouisville.com/metro/ kentucky-given-830-million-economic-development-tax-incentives-companies-since-2012/ (last accessed December 28, 2017).
36
Stigler, G. 1971. The theory of economic regulation. Bell Journal of Economics 2, 3–21. Story, L. 2012. As companies seek tax deals, governments pay high price. New York Times (Dec
1). http://www.nytimes.com/2012/12/02/us/how-local-taxpayers-bankroll-corporations. Html?pagewanted=all (last accessed January 28, 2018).
Swain, J. 2014. New Jersey grants $1.25bn in public funds to firms that back Republicans. The
Guardian (Jun 26). http://www.theguardian.com/world/2014/jun/26/new-jersey-chris-christie-republican-backers (last accessed March 7, 2016).
Ura, A. 2014. Beyond Perry, future of deal-closing fund murky. The Texas Tribune (Jan 2).
https://www.texastribune.org/2014/01/02/future-tef-unclear-beyond-gov-rick-perrys-tenure/. (last accessed December 29, 2017).
Wellman, L. 2017. Mitigating political uncertainty. Review of Accounting Studies 22: 217-250. Witko, C. 2005. Measuring the stringency of state campaign finance regulation. State Politics &
Policy Quarterly 5 (3): 295–310. Yu, X., and F. Yu. 2011. Corporate lobbying and fraud detection. Journal of Financial and
Quantitative Analysis 46 (6): 1865-1891. Zumbach, L. 2017. After winning Foxconn, Southeast Wisconsin prepares for influx of jobs as
residents fear loss of peace and quiet. Chicago Tribune (Nov 21). http://www.chicago tribune.com/business/ct-biz-foxconn-mount-pleasant-1126-story.html (last accessed December 28, 2017).

37
APPENDIX A
State Subsidy Examples
Part I: Examples of subsidies of various types
1. In 2010, Washington awarded a $183,352 subsidy to ELDEC, a Crane Co. subsidiary, through the state’s “High Technology Business & Occupation Tax Credit” program. The subsidy incentivizes research and development activities in Washington in the fields of advanced computing, advance materials, biotechnology, electronic device technology, and environmental technology.
2. In 2014, Pennsylvania awarded a $183,052 subsidy to Comcast through the state’s “Research & Development Tax Credit” program. The subsidy incentivizes research and development activities.
3. In 2011, California reimbursed Sears $29,240 through its “Employment Training Panel” program. The program provides financial assistance to business to support employee training.
4. In 2013, North Carolina granted Caterpillar $162,000 through its “One North Carolina Fund,” a cash grant program targeting competitive job-creation projects.
Part II: Examples of larger subsidies. Holding state constant (Ohio) and varying the presence of corporate political connections.
1. In 2008, Ohio awarded NetJets (a subsidiary of Berkshire Hathaway) a subsidy package valued at more than $37 million. NetJets sells fractional ownership interests in private business jets. The company had a presence in Columbus, Ohio and wanted to expand operations by building a new aviation campus for another Berkshire subsidiary, FlightSafety International. FlightSafety is the world’s largest provider of aviation training in the US and Canada. The state of Ohio provided NetJets with a $37.4 million economic expansion incentive package that included workforce development, job credits, tax abatements, and other forms of direct assistance. The city of Columbus and Franklin County contributed an additional $22 million, and the Columbus Regional Airport Authority contributed another $8.2 million. In exchange for this incentive package, NetJets committed to constructing a $200 million aviation campus and generating 810 new jobs. Upon completion, the new aviation campus is expected to house the largest concentration of flight simulators in the US. In 2008, Berkshire Hathaway donated to two Ohio House of Representatives and two Ohio Senate candidates.

38
2. In 2011, Ohio awarded American Greetings Card (AGC) a subsidy package valued at more
than $146 million. AGC is a self-described “creator and manufacturer of innovative social expression products.” It was a Fortune 1000 firm with its headquarters in Brooklyn, Ohio (within the Cleveland metropolitan area) since the 1960s. On Jan 6, 2010 AGC announced interest in moving its headquarters, and was considering locations both within and outside of Ohio. Cities and states began competing for the new headquarter location, and the Ohio legislature and Ohio Department of Development began discussing an incentive package to keep AGC in Ohio. Ohio House Bill 58 offered AGC a variety of economic incentives, including a multi-year refundable jobs retention tax credit, a low-interest loan, and grants earmarked for construction costs and infrastructure improvements. In exchange for this incentive package, AGC committed to keeping the equivalent of 1,750 full-time jobs at its Ohio headquarters. AGC ended up moving its headquarters 15 miles down the road to Westlake, Ohio (also within the Cleveland metropolitan area). AGC did not make political contributions to any Ohio state political candidates prior to the incentive package being offered and accepted.

39
APPENDIX B
State Limits on Corporate Contributions to State Political Candidates
Direct Contributions Indirect Contributions (via PACs) Unlimited (6) Limited (23) Prohibited (21) Unlimited (14) Limited (36) Alabama Arkansas Alaska Alabama Alaska Missouri California Arizona Indiana Arizona Nebraska Delaware Colorado Iowa Arkansas Oregon Florida Connecticut Mississippi California Utah Georgia Iowa Missouri Colorado Virginia Hawaii Kentucky Nebraska Connecticut Idaho Massachusetts New Hampshire Delaware Illinois Michigan North Dakota Florida Indiana Minnesota Oregon Georgia Kansas Montana Pennsylvania Hawaii Louisiana North Carolina South Dakota Idaho Maine North Dakota Texas Illinois Maryland Ohio Utah Kansas Mississippi Oklahoma Virginia Kentucky Nevada Pennsylvania Louisiana New Hampshire Rhode Island Maine New Jersey South Dakota Maryland New Mexico Texas Massachusetts New York West Virginia Michigan South Carolina Wisconsin Minnesota Tennessee Wyoming Montana Vermont Nevada Washington New Jersey New Mexico New York North Carolina Ohio Oklahoma Rhode Island South Carolina Tennessee Vermont Washington West Virginia Wisconsin Wyoming

40
APPENDIX C
Variable Definitions
Variable Definition CashETR Tax paid (Compustat variable txpd) ÷ (pre-tax book income (pi) less special items
(spi)). Requires (pi – spi) > 0, and truncated at a lower (upper) bound of zero (one).
CommitCapital Natural log of one plus the amount of capital investment company j commits to make in state k when awarded a subsidy in state k. Set to zero when company j does not make an identifiable capital commitment to state k when receiving a subsidy from state k.
CommitCapitalMissing Indicator set to one when company j does not make an identifiable capital commitment to state k when receiving a subsidy from state k, and to zero otherwise.
CommitJobs Natural log of one plus the number of jobs company j commits to generate in state k when awarded a subsidy in state k. Set to zero when company j does not make an identifiable jobs commitment to state k when receiving a subsidy from state k.
CommitJobsMissing Indicator set to one when company j does not make an identifiable capital commitment to state k when receiving a subsidy from state k, and set to zero otherwise.
Contrib Indicator set equal to one if company j (or its corporate-sponsored PAC) contributes to a state k political candidate in years t-4 through t, and zero otherwise
ContribAmt Natural log of one plus the dollar amount that company j (or its corporate-sponsored PAC) contributes to state k political candidates in years t-4 through t.
ContribCandCnt Natural log of one plus the number of state k political candidates that company j (or its corporate-sponsored PAC) contributes to in years t-4 through t
ContribCand1 Indicator set equal to one if company j (or its corporate-sponsored PAC) contributes to only one state k political candidate in years t-4 through t, and zero otherwise
ContribCand2-5 Indicator set equal to one if company j (or its corporate-sponsored PAC) contributes to two to five state k political candidates in years t-4 through t, and zero otherwise
ContribCand6-10 Indicator set equal to one if company j (or its corporate-sponsored PAC) contributes to six through ten state k political candidates in years t-4 through t, and zero otherwise
ContribCand11 Indicator set equal to one if company j (or its corporate-sponsored PAC) contributes to eleven or more state k political candidates in years t-4 through t, and zero otherwise
ContribDemOnly Indicator set equal to one if company j (or its corporate-sponsored PAC) contributes only to state k political candidates from the Democratic Party in years t-4 through t, and zero otherwise

41
ContribDem&Repub Indicator set equal to one if company j (or its corporate-sponsored PAC) contributes to state k political candidates from the Democratic Party and Republican Party in years t-4 through t, and zero otherwise
ContribRepubOnly Indicator set equal to one if company j (or its corporate-sponsored PAC) contributes only to state k political candidates from the Republican Party in years t-4 through t, and zero otherwise
ContribGubOnly Indicator set equal to one if company j (or its corporate-sponsored PAC) contributes only to state k gubernatorial political candidates in years t-4 through t, and zero otherwise
ContribGub&Leg Indicator set equal to one if company j (or its corporate-sponsored PAC) contributes to state k gubernatorial and legislature political candidates in years t-4 through t, and zero otherwise
ContribLegOnly Indicator set equal to one if company j (or its corporate-sponsored PAC) contributes only to state k legislative political candidates (house or senate) in years t-4 through t, and zero otherwise
JobsGrowth One of two state economic growth variables: %Δemployees or %Δpayroll
Leverage Total long-term debt (Compustat variable dltt) ÷ total assets (at)
PoliticalContrib One of three corporate political contributions-related variables: Contrib, ContribAmt, or ContribCandCnt
Size Natural log of one plus total assets (Compustat variable at)
StateImportance Number of years mentions of state k are more than 50 percent of all U.S. stat mentions in company j Form 10-K (Item 1: Business, Item 2: Properties, Item 6: Consolidated Financial Data, and Item 7: Management Discussion and Analysis) during years t-4 through t.
StateSubAmt Natural log of 1 + the amount of subsidies awarded by state k in year t and industry i StateSubAmt_NoContrib Natural log of 1 + the amount of subsidies awarded by state k in year t and industry i
to politically unconnected firms
StateSubAmt_Contrib Natural log of 1 + the amount of subsidies awarded by state k in year t and industry i to politically connected firms
StateSubCnt Total number of subsidies awarded by state k in year t and industry i
StateSubCnt_NoContrib Total number of subsidies awarded by state k in year t and industry i to firms not politically connected
StateSubCnt_Contrib Total number of subsidies awarded by state k in year t and industry i to firms politically connected.

42
Sub One of two subsidy-related variables: Subsidy or SubsidyAmt
Subsidy Indicator set equal to one if company j receives a subsidy in year t from state k, and zero otherwise
SubsidyAmt Natural log of one plus the dollar amount of subsidy received by company j in year t from state k
%Δemployees Percentage change in the number of business establishment employees in state k and industry i from year t to year t+n
%Δpayroll Percentage change in the annual amount of business establishment payroll in state k and industry i from year t to year t+n

43
FIGURE 1: State subsidy frequency and average dollar value
This figure presents state subsidy frequency and average dollar value by year (Panel A), by industry (Panel B), and by state (Panel C).
Panel A: State subsidy frequency and average amount by year
$0
$1,000,000
$2,000,000
$3,000,000
$4,000,000
$5,000,000
$6,000,000
$7,000,000
0
500
1000
1500
2000
2500
3000
3500
2000 2001 2002 2003 2004 2005 2006 2007 2008 2009 2010 2011 2012 2013 2014
Frequency Average SubsidyAmount

44
Panel B: State subsidy frequency and average amount by industry
$0
$500,000
$1,000,000
$1,500,000
$2,000,000
$2,500,000
$3,000,000
0
500
1000
1500
2000
2500
3000
01-09,Agriculture 10-19,Mining&Construction
20-27,Food,Paper&FinishedGoods
28-29,Chemicals&Pharmaceuticals
30-34,Rubber,Leather,andMetal
Works
35-36,Machinery&Electronics
37-39,OtherEquipment&Machinery
40-49,Transportation,
Telecom&Utilities
50-51,Wholesalers 52-59,Retailers 60-69,Banks 70-79,Personal&BusinessServices
80-99,Miscellaneous&OtherServices
Frequency Average SubsidyAmount

45
Panel C: State subsidy average dollar value (in thousands) by state
702
2524
80751596
198
4488683

46
Table 1: Descriptive statistics on state subsidies
This table provides descriptive information on state awarded subsidies from 2000 to 2014 for publicly traded companies with Compustat data.
Type n Mean Median Std Dev Tax Incentives 10,945 1,665,793 164,126 5,782,937 Cost reimbursements 4,025 194,690 28,500 951,251 Grants 3,362 1,131,314 160,885 3,657,120 Other 13 9,750,528 4,000,000 11,597,650

47
Table 2: Descriptive statistics on corporate campaign contributions to state candidates
This table presents descriptive information on corporate campaign contributions to state candidates for our sample firms. The sample include 22,846 firm-state-election cycle contributions. Panel A reports information on contribution dollar amount, Panel B on the number of candidates a firm contributes to, and Panel C on average contribution amount per candidate across states.
Panel A: Corporate campaign contribution amount per state-election cycle
Mean Median Std Dev Total contributions $18,799.92 5,550 35,229.22 Contribution by party Democrats 7,591.81 1,500 16,708.75 Republicans 10,853.46 3,000 20,455.83 Other 32.51 0 189.83 Contribution by race Gubernatorial 2,770.40 0 7,195.56 Senate 5,996.32 1,500 11,741.02 House 9,633.14 2,075 19,759.84
Panel B: The number of candidates a firm contributes to per state-election cycle
Mean Median Std Dev Total number of supported candidates 18 7 24.70 Number of candidates by party Democrats 7 2 11.32 Republicans 11 4 15.30 Other 0 0 0.27 Number of candidates by race Gubernatorial 1 0 0.91 Senate 5 2 7.35 House 12 4 18.41
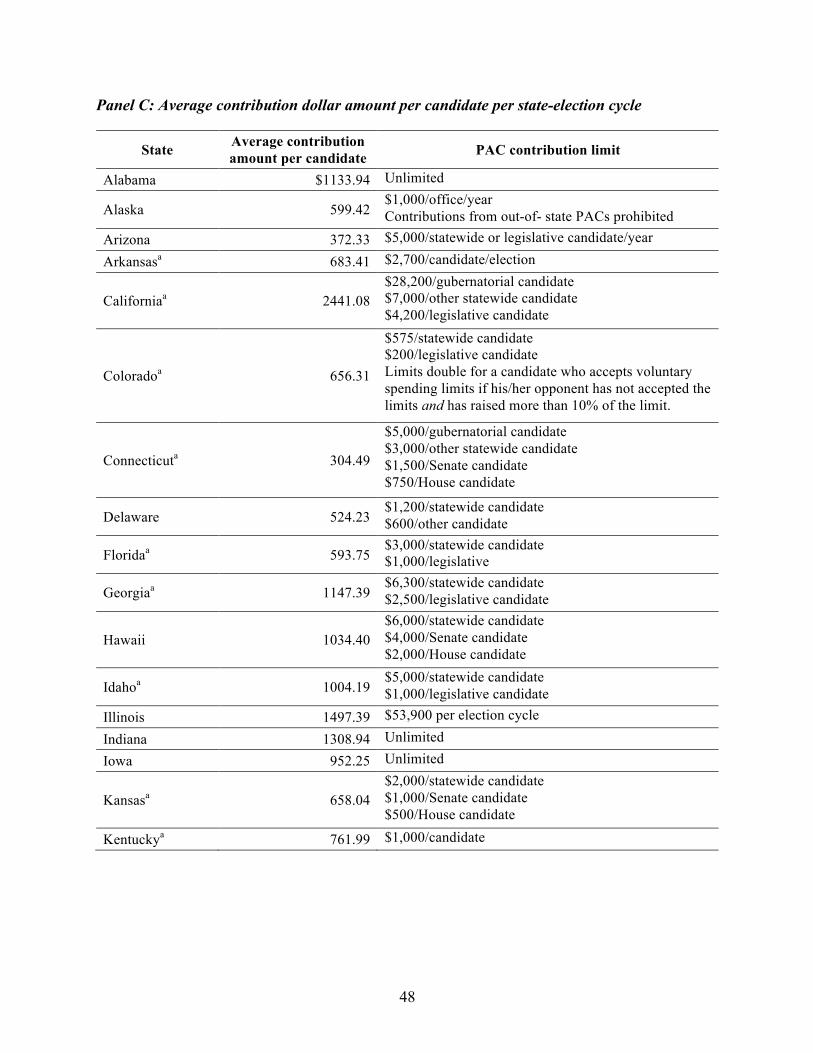
48
Panel C: Average contribution dollar amount per candidate per state-election cycle
State Average contribution amount per candidate PAC contribution limit
Alabama $1133.94 Unlimited
Alaska 599.42 $1,000/office/year Contributions from out-of- state PACs prohibited
Arizona 372.33 $5,000/statewide or legislative candidate/year
Arkansasa 683.41 $2,700/candidate/election
Californiaa 2441.08 $28,200/gubernatorial candidate $7,000/other statewide candidate $4,200/legislative candidate
Coloradoa 656.31
$575/statewide candidate $200/legislative candidate Limits double for a candidate who accepts voluntary spending limits if his/her opponent has not accepted the limits and has raised more than 10% of the limit.
Connecticuta 304.49
$5,000/gubernatorial candidate $3,000/other statewide candidate $1,500/Senate candidate $750/House candidate
Delaware 524.23 $1,200/statewide candidate $600/other candidate
Floridaa 593.75 $3,000/statewide candidate $1,000/legislative
Georgiaa 1147.39 $6,300/statewide candidate $2,500/legislative candidate
Hawaii 1034.40 $6,000/statewide candidate $4,000/Senate candidate $2,000/House candidate
Idahoa 1004.19 $5,000/statewide candidate $1,000/legislative candidate
Illinois 1497.39 $53,900 per election cycle
Indiana 1308.94 Unlimited
Iowa 952.25 Unlimited
Kansasa 658.04 $2,000/statewide candidate $1,000/Senate candidate $500/House candidate
Kentuckya 761.99 $1,000/candidate

49
Louisianaa 1250.70
Regular PACs: $5,000/statewide candidate $2,500/legislative candidate “Big” PACsb: Double the amount of the limits
Mainea 431.97 $1,575/gubernatorial candidate $375/legislative candidate
Maryland 1138.39 $6,000/candidate
Massachusetts 418.23 Regular PAC or People’s Committee:8 $500/candidate Amounts per calendar year.
Michigan 656.63 $6,800/statewide candidate $2,000/Senate candidate $1,000/House candidate
Minnesotac 293.16
Election segment limits: $4,000/gubernatorial candidate $1,000/legislative candidate Nonelection segment limits: $2,000/gubernatorial candidate $1,000/Senate candidate n/a for House candidates
Mississippi 1035.90 Unlimited
Missouri 874.74 Unlimited
Montanaa 255.07 $650/gubernatorial slate $170/legislative candidate
Nebraska 1814.68 Unlimited
Nevadaa 1448.10 $5,000/candidate
New Hampshirea 1063.08
$1,000/candidate to candidates not agreeing to abide by spending limits; Unlimited to candidates who agree to expenditure limits
New Jerseya 1119.25 $8,200/candidate
New Mexicoa 1427.21 $5,400/candidate
New York 1437.73
Primary: $6,500-$19,700/statewide $6,500/Senate candidate $4,100/Assembly candidate General: $41,100/statewide candidate $10,300/Senate candidate $4,100/Assembly candidate

50
North Carolinaa 1005.30 $5,000/candidate
North Dakota 1302.05 Unlimited
Ohioa 1320.22 $12,532.52/candidate
Oklahoma 900.80 $5,000/candidate/campaign
Oregon 1342.88 Unlimited
Pennsylvania 1489.66 Unlimited
Rhode Island 390.25 $1,000/candidate/ year
South Carolina 1097.69 $11,500/statewide candidate $7,600/legislative candidate
South Dakota 387.27 Unlimited
Tennesseea 905.69 $11,200/statewide candidate $11,200/Senate candidate $7,400/other candidates
Texas 1551.56 Unlimited
Utah 940.26 Unlimited
Vermont 834.27 $4,000/statewide candidate $1,500/State Senate $1,000/State House
Virginia 1436.59 Unlimited
Washingtona 770.47 $1,900/gubernatorial candidate $950/legislative candidate
West Virginiaa 710.51 $1,000/candidate
Wisconsin 1029.20 $43,128/gubernatorial candidate $1,000/Senate candidate $500/Assembly candidate
Wyominga 552.48 $7,500/statewide candidate $3,000/other candidate
Notes: a. The limit on contribution amount applies to each election. Primary and general elections are considered separate elections, so the amount limit is doubled for an election cycle with primary and general elections. b. A “Big PAC” is defined as a PAC with more than 250 members who each contributed over $50 to the PAC in the preceding calendar year. c. In 2013, Minnesota divided its election cycles into two-year “election segments,” and contribution limits are per election segment. For candidates serving a four- or six-year term, limits are higher in the two-year period during which an election is held.

51
Table 3: Relation between state subsidies and corporate political contributions
This table presents analysis on the relation between state subsidies and corporate political contributions. Panel A reports sample descriptive statistics, Panel B reports regression results on the likelihood of receiving state subsidies, and Panel C on the amount of state subsidies. All variables are defined in Appendix C. Reported in brackets are t-statistics calculated based on White heteroscedastic consistent standard errors and adjusted for clustering by firm and by state. ***, **, * represent a 1 percent, 5 percent, and 10 percent level of significance, respectively (two-tailed tests).
Panel A: Descriptive statistics
Variables N Mean Std. Dev. Median Subsidy 545,345 0.016 0.125 0 SubsidyAmt 545,345 0.193 1.548 0 Contrib 545,345 0.081 0.273 0 ContribAmt 545,345 0.703 2.423 0 ContribCandCnt 545,345 0.191 0.751 0 StateImportance 545,345 0.029 0.316 0
Panel B: Regression results on the likelihood of receiving state subsidies
Dependent variable = Subsidy Variables [1] [2] [3]
Contrib 0.041***
[7.470]
ContribAmt 0.005***
[7.637] ContribCandCnt 0.018***
[7.654] StateImportance 0.018*** 0.017*** 0.016***
[4.085] [4.052] [3.966]
Observations 545,345 545,345 545,345 Adjusted R2 0.094 0.095 0.095 Company-Year FE Y Y Y State-Industry-Year FE Y Y Y
.

52
Panel C: Regression results on the amount of state subsidies received
Dependent variable = SubsidyAmt Variables [1] [2] [3]
Contrib 0.537***
[7.295]
ContribAmt 0.071***
[7.433] ContribCandCnt 0.236***
[7.459] StateImportance 0.229*** 0.219*** 0.215***
[4.170] [4.138] [4.051]
Observations 545,345 545,345 545,345 Adjusted R2 0.093 0.094 0.095 Company-Year FE Y Y Y State-Industry-Year FE Y Y Y

53
Table 4: Relation between state subsidies and corporate political contributions: job and capital requirements
This table presents analysis on the relation between state subsidies and corporate political contributions, controlling for job and capital requirements. All variables are defined in Appendix C. Reported in brackets are t-statistics calculated based on White heteroscedastic consistent standard errors and adjusted for clustering by firm and by state. ***, **, * represent a 1 percent, 5 percent, and 10 percent level of significance, respectively (two-tailed tests). Dependent variable = SubsidyAmt Variables [1] [2] [3]
Contrib 0.507*** [7.167] ContribAmt 0.058*** [7.338] ContribCandCnt 0.185***
[6.364] CommitJobs 0.553*** 0.551*** 0.552***
[5.118] [5.129] [5.191] CommitCapital 0.438*** 0.437*** 0.438***
[6.377] [6.377] [6.362] CommitJobsMissing 2.306*** 2.287*** 2.280***
[3.759] [3.744] [3.765] CommitCapitalMissing 5.418*** 5.405*** 5.431***
[4.696] [4.694] [4.696] StateImportance 0.178*** 0.173*** 0.167***
[4.849] [4.760] [4.639] Size 0.157*** 0.152*** 0.150***
[4.687] [4.628] [4.641] Leverage 0.15 0.144 0.146
[0.585] [0.555] [0.560] CashETR -0.209* -0.205 -0.21
[-1.714] [-1.667] [-1.665]
Observations 8,676 8,676 8,676 Adjusted R2 0.568 0.569 0.57 Company-Year FE N N N State-Industry-Year FE Y Y Y

54
Table 5: Relation between state subsidies and corporate political contributions: time-series variation within a state
This table presents analysis on the relation between state subsidies and corporate political contributions within a given state over time. Panel A reports regression results on the likelihood of receiving state subsidies, and Panel B on the amount of state subsidies received. All variables are defined in Appendix C. Reported in brackets are t-statistics calculated based on White heteroscedastic consistent standard errors and adjusted for clustering by firm and by state. ***, **, * represent a 1 percent, 5 percent, and 10 percent level of significance, respectively (two-tailed tests).
Panel A: Regression results on the likelihood of receiving state subsidies
Dependent variable = Subsidy Variables [1] [2] [3]
Contrib 0.007** [2.071]
ContribAmt 0.001** [2.580]
ContribCandCnt 0.005** [2.362]
StateImportance -0.002 -0.002 -0.002 [-1.089] [-1.090] [-1.082]
Size 0.001 0.001 0.001 [0.654] [0.620] [0.607]
Leverage 0.005 0.005 0.005 [1.380] [1.371] [1.370]
CashETR 0 0 0 [0.170] [0.163] [0.175]
Observations 545,345 545,345 545,345 Adjusted R2 0.297 0.297 0.297 Company-State FE Y Y Y State-Indury-Year FE Y Y Y

55
Panel B: Regression results on the amount of state subsidies received
Dependent variable = SubsidyAmt Variables [1] [2] [3]
Contrib 0.082* [1.915]
ContribAmt 0.017** [2.405]
ContribCandCnt 0.064** [2.168]
StateImportance -0.036 -0.036 -0.036 [-1.105] [-1.106] [-1.099]
Size 0.011 0.011 0.01 [0.823] [0.789] [0.780]
Leverage 0.064 0.063 0.063 [1.461] [1.452] [1.452]
CashETR 0.007 0.007 0.007 [0.503] [0.497] [0.510]
Observations 545,345 545,345 545,345 Adjusted R2 0.297 0.297 0.297 Company-State FE Y Y Y State-Industry-Year FE Y Y Y

56
Table 6: Relation between state subsidies and corporate political contribution type
This table presents cross-sectional analyses on the relation between state subsidies and corporate political contributions. Panel A reports regression results based on the number of candidates, Panel B based on candidate political affiliations, and Panel C based on candidate branch of government. All variables are defined in Appendix C. Reported in brackets are t-statistics calculated based on White heteroscedastic consistent standard errors and adjusted for clustering by firm and by state. ***, **, * represent a 1 percent, 5 percent, and 10 percent level of significance, respectively (two-tailed tests).
Panel A: Number of candidates
Dependent variable Dependent variable
= Subsidy = SubsidyAmt Variables [1] [2]
ContribCand1 0.022*** 0.276***
[4.469] [4.517] ContribCand2-5 0.031*** 0.399***
[5.657] [5.563] ContribCand6-10 0.043*** 0.544***
[6.393] [6.277] ContribCand11 0.062*** 0.822***
[7.551] [7.356] StateImportance 0.017*** 0.219***
[4.009] [4.096]
F-statistics
ContribCand1 = ContribCand2-5 4.018** 4.895** ContribCand2-5 = ContribCand6-10 4.626** 4.288** ContribCand6-10 = ContribCand11 7.466*** 8.778***
Observations 545,345 545,345 Adjusted R2 0.0952 0.0941 Company-Year FE Y Y State-Industry-Year FE Y Y

57
Panel B: Candidate political affiliation
Dependent variable Dependent variable
= Subsidy = SubsidyAmt Variables [1] [2]
ContribDemOnly 0.021*** 0.270*** [4.163] [4.362]
ContribRepubOnly 0.024*** 0.304*** [5.367] [5.294]
ContribDem&Repub 0.056*** 0.740*** [7.775] [7.563]
StateImportance 0.017*** 0.222*** [4.034] [4.119]
F-statistic
ContribDemOnly = ContribRepubOnly 0.44 0.506 ContribDem&Repup = ContribDemOnly 30.68*** 34.67*** ContribDem&Repub = ContribRepubOnly 33.17*** 34.69***
Observations 545,345 545,345 Adjusted R2 0.095 0.094 Company-Year FE Y Y State-Industry-Year FE Y Y

58
Panel C: Candidate branch of government
Dependent variable Dependent variable
= Subsidy = SubsidyAmt Variables [1] [2]
CandGubOnly 0.026*** 0.321***
[4.133] [4.214] CandLegOnly 0.028*** 0.366***
[7.133] [7.112] CandGub&Leg 0.059*** 0.783***
[7.309] [7.093] StateImportance 0.017*** 0.222***
[4.080] [4.168]
F-statistic
CandGubOnly = CandLegOnly 0.114 0.524 CandGub&Leg = CandGubOnly 22.62*** 26.01*** CandGub&Leg = CandLegOnly 27.14*** 27.26***
Observations 545,345 545,345 Adjusted R2 0.095 0.094 Company-Yr FE Y Y State-Ind-Yr FE Y Y

59
Table 7: Relation between state subsidies amounts and future intra-industry jobs growth
This table presents analyses on the relation between state subsidies amounts and future jobs growth within the industry. Panel A reports descriptive information, Panel B reports regression results on the growth in number of employees, and Panel C on the growth in payrolls. All variables are defined in Appendix C. Reported in brackets are t-statistics calculated based on White heteroscedastic consistent standard errors and adjusted for clustering by industry and by state. ***, **, * represent a 1 percent, 5 percent, and 10 percent level of significance, respectively (two-tailed tests).
Panel A: Descriptive statistics
Variables N Mean Std. Dev. Median %ΔEmployeest+1 138,297 -0.071 0.34 -0.009
%ΔEmployeest+2 125,828 -0.076 0.412 -0.018
%ΔEmployeest+3 113,250 -0.074 0.472 -0.029
%ΔPayrollt+1 144,253 -0.028 0.351 0.02
%ΔPayrollt+2 130,905 0.001 0.456 0.038
%ΔPayrollt+3 117,461 0.037 0.551 0.054 StateSubAmt 144,253 0.42 2.286 0 StateSubAmt_NoContrib 144,253 0.313 1.963 0 StateSubAmt_Contrib 144,253 0.128 1.301 0 StateSubCnt 144,253 0.041 0.26 0 StateSubCnt_NoContrib 144,253 0.03 0.204 0 StateSubCnt_Contrib 144,253 0.011 0.129 0

60
Panel B: Regression results on growth in future employees
Dependent variable = %ΔEmployees [1] [2] [3] [4] [5] [6]
Variables t to t+1 t to t+1 t to t+2 t to t+2 t to t+3 t to t+3
StateSubAmt 0.001*** 0.001*** 0.001* [3.077] [2.778] [1.773]
StateSubAmt_NoContrib 0.001*** 0.002** 0.002* [3.045] [2.558] [1.876]
StateSubAmt_Contrib 0.000 0.000 -0.000 [0.632] [0.447] [-0.199]
Observations 138,297 138,297 125,828 125,828 113,250 113,250 Adjusted R2 0.163 0.163 0.199 0.199 0.227 0.227 State-Year FE Y Y Y Y Y Y Industry-Year FE Y Y Y Y Y Y
Panel C: Regression results on growth in future payrolls
Dependent variable = %ΔPayroll [1] [2] [3] [4] [5] [6]
Variables t to t+1 t to t+1 t to t+2 t to t+2 t to t+3 t to t+3
StateSubAmt 0.001** 0.001** 0.002** [2.061] [2.305] [2.558]
StateSubAmt_NoContrib 0.001** 0.001** 0.002** [2.068] [2.478] [2.336]
StateSubAmt_Contrib -0.000 -0.000 -0.000 [-0.081] [-0.578] [-0.179]
Observations 144,253 144,253 130,905 130,905 117,461 117,461 Adjusted R2 0.156 0.156 0.184 0.184 0.211 0.211 State-Year FE Y Y Y Y Y Y Industry-Year FE Y Y Y Y Y Y

61
Table 8: Relation between state subsidies counts and future intra-industry jobs growth
This table presents analyses on the relation between state subsidies counts and future jobs growth within the industry. Panel A reports regression results on the growth in number of employees, and Panel B on the growth in payrolls. All variables are defined in Appendix C. Reported in brackets are t-statistics calculated based on White heteroscedastic consistent standard errors and adjusted for clustering by industry and by state. ***, **, * represent a 1 percent, 5 percent, and 10 percent level of significance, respectively (two-tailed tests).
Panel A: Regression results on growth in future employees
Dependent variable = %ΔEmployees [1] [2] [3] [4] [5] [6]
Variables t to t+1 t to t+1 t to t+2 t to t+2 t to t+3 t to t+3
StateSubCnt 0.009*** 0.008* 0.009 [2.780] [1.971] [1.582]
StateSubCnt_NoContrib 0.013*** 0.013* 0.015* [2.744] [1.971] [1.737]
StateSubCnt_Contrib 0.002 -0.001 -0.004 [0.477] [-0.164] [-0.556]
Observations 138,297 138,297 125,828 125,828 113,250 113,250 Adjusted R2 0.163 0.163 0.199 0.199 0.227 0.227 State-Year FE Y Y Y Y Y Y Ind-Year FE Y Y Y Y Y Y

62
Panel C: Regression results on growth in future payrolls
Dependent variable = %ΔPayroll [1] [2] [3] [4] [5] [6]
Variables t to t+1 t to t+1 t to t+2 t to t+2 t to t+3 t to t+3
StateSubCnt 0.004 0.006 0.011*
[1.666] [1.554] [1.878]
StateSubCnt_NoContrib 0.007* 0.012** 0.020** [1.697] [2.622] [2.265]
StateSubCnt_Contrib 0 -0.008 -0.007 [-0.021] [-1.449] [-0.671]
Observations 144,253 144,253 130,905 130,905 117,461 117,461
Adjusted R2 0.155 0.155 0.184 0.184 0.211 0.211
State-Year FE Y Y Y Y Y Y Ind-Year FE Y Y Y Y Y Y