political connections and the allocation of procurement
TRANSCRIPT

1
Political Connections and the Allocation of Procurement Contracts
Eitan Goldman* Jörg Rocholl* Jongil So*
December, 2010
Abstract
This paper analyzes whether political connections of publicly traded corporations in the United
States affect the allocation of government procurement contracts. The paper classifies the political
affiliation of S&P 500 companies using hand-collected data that detail the past political position
of each of their board members. Using this classification, the study focuses on the change in
control of both House and Senate following the 1994 midterm election and on the change in the
Presidency following the 2000 election. An analysis of the change in the value of the procurement
contracts awarded to these companies before and after 1994 and 2000 indicates that companies
that are connected to the winning (losing) party are significantly more likely to experience an
increase (decrease) in procurement contracts. The results remain significant after controlling for
industry classifications, geographical location of the company, as well as for several other
company characteristics. In total, these findings suggest that the allocation of procurement
contracts is influenced in part by political connections. Thus, this study provides evidence on one
direct avenue through which political connections add value to U.S. companies.
*Contact details: Goldman is from Indiana University, Rocholl is from ESMT European School of
Management and Technology in Berlin, and So is from the University of Korea. Goldman can be contacted
at email: [email protected], Rocholl at email: [email protected], and So at email: [email protected]

2
1. Introduction
A growing body of research finds that political connections add value to the
corporation. Studies such as Roberts (1990), Fisman (2001), Faccio (2006), Jayachandran
(2006), and Goldman, Rocholl, and So (2009) use stock market data to demonstrate that
the value of politically connected companies is affected by changes in the political
landscape.1 However, while these studies point to the value of having political
connections, they remain silent about the exact source of this value. It is thus an
important open question how politicians can add value to corporations, and this question
is particularly relevant in light of the increased interaction between the political system
and the private sector following the financial and economic crisis.
The present study attempts to shed light on this question by analyzing the
allocation of government procurement contracts across the largest U.S. publicly traded
companies. Government procurement contracts total more than 3.1 trillion dollars over
the sample period between 1990 and 2004, and thus the allocation of these contracts is
perhaps the most direct way in which political connections may influence company
values.2 The goal of this study is to understand whether companies’ political connections
affect the value of procurement contracts that they receive. If political connections do
influence the awarding of government contracts, then companies that are connected to a
political party will receive more government contracts during periods in which that
political party has greater control relative to periods in which that party has less control.
In contrast, during the same time, companies that are connected to the opposing party will
receive fewer contracts. Thus, the empirical approach we take is to analyze changes in
contracts following changes in the political landscape.
To provide a specific example, consider the case of Phillips Petroleum and
Occidental Petroleum, two S&P500 companies that receive government procurement
1 Fisman, Fisman, Galef, and Khurana (2006) is a notable exception as they do not find the effect with
companies that are connected to Vice President Dick Cheney. 2 Studies by Khwaja and Mian (2005) and Faccio, Masulis, and McConnell (2006) also study how
politicians affect firm value. These studies, discussed below, look at companies in foreign countries and
focus on the impact of politicians on a company’s loans.
3
contracts during the 1990s and which are both in the Petroleum and Natural Gas
industry.3 Table 1 shows that Phillips Petroleum has several former Republicans on its
board of directors and no former Democrat while Occidental Petroleum has several
former Democrats on its board and no former Republican. For example, Phillips
Petroleum has on its board James Edwards who was the Energy Secretary under President
Reagan between 1981 and 1982. Occidental Petroleum has on its board Albert Gore who
was a Tennessee Senator with the Democratic Party until 1971. For our study, Phillips
Petroleum is defined as a Republican company and Occidental Petroleum as a
Democratic company.4
What happens then to the government contracts that these companies receive once
there is a change in the political landscape, as for example around the 1994 midterm
election in which control of the House and Senate changes from the Democratic to the
Republican Party? Table 1 shows that both companies experience big changes in their
government contracts around this time. Philips Petroleum’s government procurement
contracts increase from a total of $120.0 million during the 1990 to 1993 period to a total
of $289.3 million in the period between 1995 and 1998. In contrast, Occidental Petroleum
experiences a decrease in contracts from $169.5 million during the 1990 to 1993 period to
$143.7 million in the period between 1995 and 1998. Thus, while both companies operate
in the same industry and have similar characteristics, the company with a Republican
(Democratic) board experiences an increase (decrease) in its government contracts
following the election. This anecdotal case study demonstrates what we analyze more
rigorously in the remainder of the paper.
The paper looks at a sample of all companies that are in the S&P500 between the
years 1990 and 2004 with a focus on the years 1994 and 2000. The choice of 1994 and
2000 as the two focal points of the analysis is based on the fact that there is a shift in
political control from one party to another in both the 1994 midterm election and the
3 The industry classification is based on the Fama-French industry classification.
4 Note that Philips is based in Oklahoma while Occidental is based in California. Thus, our multivariate
analysis will also require controlling for the geographical state in which the firm is located.
4
2000 presidential election.5 Furthermore, the choice of both a midterm and a presidential
election is motivated by the consideration that the way in which politicians can influence
contract awards to specific companies is by its nature not a transparent one. As officials
in both the legislative branch and the administrative branch have capacity to influence
awards, it is important to consider political power changes in both branches. In particular,
the 1994 midterm election results in a shift of control in both the House and the Senate
from being majority controlled by Democrats to being majority controlled by
Republicans. The Republican Party gained a majority of seats in the House for the first
time since 1954. This election also changed control of the Senate from Democrats to
Republicans, for the first time since 1986. The 2000 presidential election results in a shift
of control of the presidency from Democratic to Republican. The two changes above
imply that the influence over the allocation of procurement contracts is likely to switch
from Democrats to Republicans.6
For each company, the study first identifies the political party to which the
company is connected, as measured by the political background of the individuals on the
board of directors. The study then calculates the change in the value of each company’s
procurement contracts surrounding the 1994 and the 2000 election. Specifically,
companies in the S&P500 in 1994 and in 2000 are classified in order to define those that
are connected to the Republicans and those that are connected to the Democrats. The
classification of political connections is based on hand-collected data detailing the past
political positions held by each of the board members of S&P500 companies in 1994 and
2000. A company is classified as being Republican (Democratic) if it has at least one
director with a past political position with the Republicans (Democrats) and no other
5 In principle, the analysis could be extended to other elections in which a power shift occurs. We face two
constraints though: First, we cannot analyze the presidential change in 1992 because the board data
(described in section 2.4.) are not available in the EDGAR database before 1993. Second, given the long-
term nature of procurement contracts (described in section 2.1.) we can only analyze elections with power
shifts that occur prior to 2004. These constraints result in the selection of the 1994 midterm election and
the 2000 presidential election as the two major shifts of control to be analyzed in this paper. 6 More generally, the situation in which companies succeed in influencing the allocation of government
contracts is one example of the case in which an interest group may use non-market interactions to achieve
certain goals (see Baron, 1999).

5
directors with any past political position with the Democrats (Republicans).7 Given the
above classification, for each company in the 1994 (2000) sample we calculate the
change in the total value of its procurement contracts between 1990 and 1993 (1996 and
1999) and between 1995 and 1998 (2001 and 2004). The procurement contracts that are
considered include all contracts awarded to the company itself and to any of its
subsidiaries.
The main findings for the 1994 sample are that companies connected to the
Republicans are more likely to experience an increase in the value of their procurement
contracts following the 1994 change in the political landscape. The paper also finds that
companies connected to the Democrats are more likely to experience a decrease in the
value of their procurement contracts following the 1994 change. These results are both
economically and statistically significant and remain significant after controlling for
several company characteristics such as size, book-to-market ratio, and capital
expenditure. In economic terms the dollar value of having connections to the winning
party in 1994 implies an additional average increase in contracts of close to $120 million
a year relative to other companies in the S&P500.
The results for the 2000 sample are qualitatively the same as for the 1994 sample.
In this case, again, the findings are that companies that are connected to the Republicans
are more likely to experience an increase in contracts while companies that are connected
to the Democrats are more likely to experience a decrease in contracts following the 2000
presidential election. The only difference here is that the decrease in contracts of the
Democratic companies is not statistically significant. The dollar value of having
connections to the winning party in 2000 is slightly smaller than in 1994 implying an
additional average increase in contracts of about $45 million a year relative to the
remaining S&P500 companies in our sample.8
7 In some of the multivariate analysis we add another group defined as “Both” to include companies with
political connections to both parties. 8 In the empirical specification, Republican companies are compared to all S&P 500 companies, and
Democratic companies are compared to all S&P500 companies. A simpler analysis that compares
Republican companies to Democrat companies yields even stronger and more pronounced results.

6
To fully exploit the panel nature of our data, we supplement the separate analysis
of the events of the 1994 and 2000 elections by using a difference-in-difference (DID)
methodology that combines in one regression the two events along with the two non-
events of the 1996 and 1998 elections. Specifically, we compute the four-year change in
contracts for each firm around the four events and then run a DID regression with a
dummy variable for the event years 1994 and 2000. The additional benefit of this
approach is that it allows us to control for the past change in government contracts for
each firm.9 The results using this approach are qualitatively the same as before. Here,
again, we find that increases (decreases) in contracts to Republican (Democrat)
companies are higher (lower) in the years in which Republicans gain control relative to
the years in which they do not. In addition, we find that while Democratic companies
loose contracts in the two event years, the loss is only significant around the 1994 event.
We explore next whether certain types of political connections are more valuable
than others. In our analysis of the heterogeneity of the effects of connections, we focus on
the sample of Republican firms and ask whether some of these firms do better than
others. For example, we ask whether Republican companies that hire individuals with a
more recent political appointment receive more contracts than companies that hire people
whose political job ended a long time ago; the idea being that connections of recent
politicians may be stronger than those of less recent ones. The findings show that the
increase is indeed larger for recent politicians but the difference fails to be significant.
The heterogeneity analysis does show that a company with political directors who have a
longer tenure with the company generate a larger increase in contracts. This evidence
suggests that cultivating relations between the company and government officials takes
time. Once the political director establishes these connections after a few years, she can
better exert her influence on government officials. The overall evidence is that some
political connections matter more than others, but the lack of statistical significance for
9 Note that we use overlapping time periods in order to maintain a four year window around each event.
The nature of government contracts requires us to consider time periods longer than one or two years. This
is because contract awards are given over several years. In addition, shorter time periods may not take into
account the fact that the increase or decrease in contracts following the political power shift may occur with
a different delay for different companies.
7
many of these connection types indicates that establishing political connections is a first-
order effect, while the type of connections is of secondary importance. This result is
consistent with the evidence in Goldman, Rocholl, and So (2009).
The paper addresses several interpretations of the results. First, one might ask
whether companies that are defined as Republican simply have preferences that are
naturally aligned with the Republican agenda and, therefore, also receive more contracts
when Republicans are in power. This argument especially has merit on an industry level
as Republicans tend to favor certain industries while Democrats tend to favor others (e.g.
oil companies likely have a preference for the Republican agenda). Thus, Republican
directors may simply serve in companies in those industries that stand to benefit from a
Republican win due to the Republican political platform, regardless of whether the
company itself is politically connected. The analysis is thus repeated after controlling for
the increase in government contracts for firms in the same industry with industry
dummies. The results remain unaffected by these controls. Furthermore, a direct test of
the distribution of Democratic and Republican companies across the Fama-French 30
industries (Figure 1) suggests that the two distributions are not statistically different from
each other. Thus, political board members represent connections rather than industry-
level preferences.10
A second question, related to the above point, is whether the results are due to the
fact that Republican companies are on a different trajectory than Democratic companies
and are thus inherently different. Therefore, the analysis is repeated after controlling for a
number of company characteristics including companies’ past sales growth (as well as
past growth in procurement contracts and company size). Controlling for these trends
does not affect the results. A more general approach that captures any possible
unobserved difference in trends between Republican and Democratic companies is the
DID test which, as reported, yields similar findings. Thus, the results are due to the
political connection of the board and the specific change in the political landscape.
10
The fact that board connections do not represent industry preferences has also been established in
Goldman, Rocholl, and So (2009) who show that post election stock returns of companies connected to
the winning (losing) party go up (down) above those of their industry.

8
Third, as argued in Roberts (1990) and in Cohen, Coval, and Malloy (2010), the
geographical location (e.g. state) at which the firm is located may impact its government
contracts. Thus, in our analysis we control for the state in which the firm is headquartered
and whether or not the state is a Republican or a Democratic state based on its elected
senators and find that the results remain robust.
Fourth, the present study focuses on individual connections of the board of
directors as a form of obtaining government access. Past studies in the political science
literature have argued that companies use political donations as well as lobbying in much
the same way (see review of the existing studies below). Hence, our analysis is repeated
after controlling for political donations and lobbying. We find that companies’
preferences in donating more to Republicans or Democrats do not explain changes in
contract awards, while the political classification of the board of directors still remains
significant as before. The same is true for lobbying expenditures. These results can be
viewed as additional indication that board affiliations represent more than company
preferences for a certain political party. This is because companies with agendas that
correlate with a given party are also likely to donate to the political campaign of that
party. Thus, controlling for political donations is one way of controlling for any
unobserved company level political preferences.
Fifth, given our results that political connections are valuable in obtaining
government contracts one should ask why not all firms establish these connections.
Unlike political donations or lobbying activity, we argue that establishing political
connections via personal ties creates advantages for companies. While all firms can easily
lobby and make political donations, not all companies are able to attract former
politicians to sit on their boards. This is because former politicians who are both able and
willing to use their past connections are in limited supply. Descriptive statistics of the
timing of nominations suggest that political directors tend to join boards when their
supply increases (i.e. after their party loses control) as opposed to when the demand for
their services increases (i.e., when their former party gains control). Thus, it would seem
likely that not all companies can attract these individuals.
9
Sixth, while there are alternative ways to establish political connections, e.g. by
hiring a former politician as a consultant for specific contract applications, nominating an
individual to the board has several advantages. First of all, government contracts are just
one way in which political connections can add value. Thus, hiring a former politician to
the board allows a company to use her in a number of additional ways. Furthermore,
hiring a former politician as a consultant leaves the door open for her to consult with
other companies who may compete for these contracts. Thus, nominating her to the board
is more likely to bind her to the company. Moreover, a former politician may prefer to sit
on the board rather than to work as a consultant even though she may be able to extract
more surpluses from consulting. This may have to do with the idea that consulting for
several firms and using connections to obtain government contracts for more than one
company may expose her to increased criticism.11
Finally, related questions are whether a firm can use other means to increase its
government contracts and, if so, whether the value of the political connections measured
in this paper is above and beyond other types of connections? It is our contention that the
value of connections is relative to other firms in the S&P500 who may use other forms of
political connections that are not controlled for. To the extent that other firms have
alternative ways to gain political connections we show that board connections add value
relative to other types of connections. While it is impossible to control for all other ways
in which a firm can establish connections, we specifically control for lobbying
expenditures and political donations and thus capture something that is correlated with
other unobserved measures of connections.
In sum, the paper shows that companies that are connected to the winning party
experience a statistically and economically significant increase in their procurement
contracts upon changes in political control following major elections, while those
connected to the losing party suffer a decrease in contracts following these changes. The
results remain significant after controlling for industry, geography, and company
11
Note that it is possible that some firms use former politicians as consultants. To the extent that these
firms do not hire politicians to their boards our analysis shows that board members add value above and
beyond these unobserved alternative forms of connections.
10
characteristics. In this paper, we highlight one crucial way in which political connections
at the board level can have a direct influence on company value. However, we do not
argue whether these findings are a result of corruption and resource misallocation or of
companies benefiting from natural social connections.
Our paper builds on the literature that starts with Roberts (1990) and continues
with Fisman (2001), Faccio (2006), Jayachandran (2006), Goldman, Rocholl, and So
(2009), and Cooper, Gulen, and Ovtchinnikov (2010). These papers show that political
connections are valuable. The key to these studies is that they all measure changes in
stock returns as a way to proxy for the value of connections. This paper, in contrast,
identifies one direct, cash-flow related avenue through which connections matter -
namely, government contracts.
In this sense, the most closely related papers to our work are studies by Khwaja
and Mian (2005), Faccio, Masulis, and McConnell (2006), as well as by Mian, Sufi, and
Trebbi (2010). These papers all show the various direct ways in which companies may
benefit from having political connections.12
In particular, Khwaja and Mian (2005)
demonstrate that companies in Pakistan with political connections receive more loans and
default on these loans at a much higher rate relative to non-connected companies.
Similarly, Faccio, Masulis, and McConnell (2006) look at a cross-country sample of
bankrupt companies that are politically connected and show that these companies are
much more likely to get bailed out. Mian, Sufi and Trebbi (2010) show that higher
campaign contributions from the financial services industry lead to more favorable votes
on related legislation. While our study complements the above papers, it differs from
them in that it focuses on a direct measure of the value created by political connections in
the U.S. which is a country with a strong legal system and relatively low levels of
corruption.13
12
Shleifer and Vishny (1994) analyze theoretically the opposite case in which politicians use their
connections to a company in order to further their political objectives while Bertrand, Kramarz, Schoar,
and Thesmar (2006) show empirically that politically connected companies can help their politicians. 13
Karpoff, Lee, and Vendrzyk (1999) provide evidence on the treatment of companies who receive
government defense procurement contracts and then commit fraud in an attempt to deceive the
government. They show that the penalty incurred by these companies is much less severe if the company
is in the group of the top 100 government contractors.

11
The existing literature in political science has mostly focused on how political
donations and lobbying activity influence the government. For example, Snyder (1990)
shows that political donations are a form of corporate investment, while Ansolabehere, de
Figueirdo, and Snyder (2003) argue that patterns of political donations are not consistent
with an investment that aims to gain a financial return. Ansolabehere, Snyder, and Ueda
(2004), Aggrawal, Meschke, and Wang (2007), and Goldman, Rocholl, and So (2009) all
find evidence consistent with this view.14
In particular, Goldman, Rocholl, and So (2009)
find that companies that donate more to Republicans (Democrats) are in industries that
stand to benefit from a Republican (Democratic) regime. Finally, Stratmann (2005)
provides a summary of the literature which relates donations to indirect measures of firm
value. Looking at lobbying, Groseclose, Milyo, and Primo (2000) argue that companies’
expenditures on lobbying activities far outweigh their political donations. Work by,
among others, Wright (1990), Goldberg and Maggi (1999), de Figueiredo and Silverman
(2006), Drope and Hansen (2004), Bombardini and Trebbi (2009), and Mian, Sufi and
Trebbi (2010) all show that lobbying activity is used to influence the transfer of
government resources to various industry groups.15
We add to this literature by focusing on company-level rather than industry-level
connections. Furthermore, unlike most of the above work we explore the direct monetary
reward that accrues to the company (somewhat similar to De Figueiredo and Silverman
2006 who show this in the context of universities lobbying).
The rest of the paper is organized as follow. In Section 2 we describe the data and
the empirical methodology. In Section 3 we present the key findings and their
interpretation. Section 4 shows robustness tests; Section 5 concludes.
14
One notable exception are Cooper, Gulen, and Ovtchinnikov (2008) who show that the number of
individuals the company donates to can impact long-term stock returns. 15
See also the theoretical work of Grossman and Helpman (1994) that models the optimal lobbying
behavior of interest groups.
12
2. Data description
The analyses in this paper utilize elections in the period between 1990 and 2004
as well as two types of data. In particular, we focus on the 1994 midterm election and the
2000 presidential election. The first data set comprises information on all U.S.
government procurement contracts in the sample period between 1990 and 2004. The
second data set consists of original data containing information regarding the political
affiliation of each board member of all companies in the S&P500 at the end of 1994 and
at the end of 2000.16
Both data sets are described in more detail below. In addition, we
hand-collect information regarding the subsidiaries of all S&P500 companies in 1994 and
2000 and obtain CRSP and COMPUSTAT data as well as Fama-French and SIC industry
classification data. Finally, the SDC Platinum database by Thompson Financial is used
for checking merger and acquisition activities or divestitures by S&P500 companies in
the sample period.
2.1. Procurement process and data
The process of awarding government contracts begins when an agency of the
federal government identifies a need for a purchase of a good or service. Each agency
has a contracting officer who posts a solicitation on the Federal Business Opportunities
website, which is called a Request For Proposal (RFP). Companies then submit their
offers for review by agency personnel who evaluate the alternative offers and make the
final decision.17
While in theory government contracts are awarded based on the merits of each
proposal, in practice people in-the-know argue that personal connections and insider
information play an important role in affecting a firm’s likelihood of winning a bid. For
example, the executive director of Project on Government Oversight (a Washington
based non-profit organization) argued that “…relationships have become infinitely more
16
In some of the analyses, we also use data on the political affiliations of board members in 1996 and 1998. 17
For more details on this process see Halchin (2006).
13
important than a contractor being able to show that they are the best person for the job…”
(see Palmer, 2005).
In practice, connected companies have a leg-up on the competition. This can
happen in several ways: First, companies that are able to have one-on-one meetings with
the contracting agency before the RFP comes out are able to get more details on what the
government agency is looking for and hence are better able to design a proposals that will
fit these needs. Second, companies that have access to the contracting agency can also
affect the proposal itself and tailor it to be more suitable for their company. The
government actually encourages interactions between companies and the contracting
agency as a way to solicit information to help design a proposal that is feasible. Thus, a
firm that is able to get one-on-one time with the government agency has a higher chance
of winning the bid. Third, connections may also help in meeting with lawmakers and
attempting to increase funding for goods and services that the company is already
providing. A manager of Sprint’s government system division was quoted as saying that
talking to congress “…can be helpful. GSA [General Service Administration] certainly
listens to the Hill.” (see Palmer, 2005).
Finally, as one contracting consultant points out in her explanation of how to win
contract bids, “successful vendors know that… government buyers do business with
people they know…How do you get known and meet people? Use internal private
networks (like a corporate board).”18
The above discussion suggests that if former politicians who sit on the board of a
company are able to help their company meet and advise these government officials and
thus help shape the RFP, then they can increase the chances that their company would
win the contract.
Data on procurement contracts on the company level are available from the
Federal Procurement Data System – Next Generation (FPDS-NG).19
The FPDS-NG,
18
See article by Judy Bradt of Summit Insight at http://www.summitinsight.com/index.asp 19
A "procurement contract" is any of a number of documented legal interactions between the government
and a contractor including a "contract award" (the basic terms and conditions of the contract including
the goods and services to be provided), a "modification" (which may be an exercise of an option to
modify the contract), or an "order" (for example an order against a government-wide contract).

14
which is operated and maintained by Global Computer Enterprises, replaced the Federal
Procurement Data Center (FPDC).20
The FPDS-NG contains all procurement contracts
that are awarded by the U.S. Government and that exceed an individual transaction value
of $2,500.21
The largest exceptions to this reporting requirement are the U.S. Postal
Service and several legislative and judicial branch organizations.22
FPDS-NG reports
procurement contracts for each company that is a separate legal entity, independent of the
ultimate owner of that company. This means that procurement contracts for subsidiaries
of companies are not aggregated on the parent company level, which aggravates the use
of these data for the purpose of academic research. The exact matching procedure used in
this paper is described in detail below.
Table 2 shows the aggregate value and number of procurement contracts over the
sample period between 1990 and 2004. The yearly value increases substantially over the
sample period from $158 billion in 1990 to $351 billion in 2004. Similarly, the number of
procurement contracts increases from 371,514 in 1990 to 2,843,212 in 2004. In particular,
the value increases greatly after 2001 as a result of the increased spending following the
events of September 11, 2001.
The total number of procurement contracts in the sample period exceeds 11.5
million and the aggregate value is more than $3.1 trillion. Table 2 also shows which
departments award the major share of these procurement contracts. The defense
department is by far the largest contractor with an average share of 65% of the awarded
value, followed by the Energy Department with an average share of 10% and NASA with
an average share of 5%. Note that defense-related spending is broadly defined and can
include contracts with many non-defense companies such as IBM and Compaq. Other
departments comprise the remaining 20% share. The figures in Table 2 suggest that the
20
FPDC, implemented under Public Law 93-400, provides data for Congress, the Executive branch, the
private sector, and the public. FPDC was a part of the U.S. General Services Administration and operated
and maintained the original Federal Procurement Data System. FPDS-NG is the central repository of
statistical information on federal contracting. 21
The reporting threshold for individual transactions was $25,000 before 2004. 22
US Census Bureau reports total procurement amount annually in the Consolidated Federal Funds Report
(CFFR) but no detailed data on the company level are available. The total procurement amount in FPDS-
NG covers more than 85% of the total amount in CFFR over the sample period.

15
share of the Defense Department is relatively stable over time, with a maximum of 68.9%
in 2004 and a minimum of 58.8% in 1993; this is the year when NASA is awarded its
highest relative share in any of the sample years.
2.2. Subsidiary data
Many companies receive a substantial share of their procurement contracts
through their subsidiaries. As an example, Halliburton receives aggregate procurement
contracts of $7 million in 1998, while its subsidiary KBR receives procurement contracts
of $43 million in the same year. For this reason, we collect information on all subsidiaries
of S&P500 companies from Exhibit 21 (Subsidiaries of the Registrant) of their annual 10-
K reports. These are available in the EDGAR database of the SEC. S&P 500 companies
and their subsidiaries are then matched with the list of companies in the FPDS-NG
database.23
The procurement contracts of S&P500 companies and their subsidiaries are
finally summed up to obtain the aggregate value of procurement contracts for each
company in the S&P500 and for each year over the sample period.
2.3. Resulting sample
This procedure results in a total sample of 405 S&P500 companies that receive
procurement contracts in the period between 1990 and 1998 and a total sample of 417
companies that receive procurement contracts in the period between 1996 and 2004. For
the first event period, a number of companies are involved in substantial merger and
acquisition activities or divestitures over the sample period. To ensure consistency and
comparability of the procurement contracts of these companies over time, their
procurement contracts are adjusted in the following way. First, 22 companies in the
S&P500 are acquired by other companies in the S&P500 during the sample period. In this
case, the procurement contracts of the target company are added to those of the acquiring
23
The procurement data used in this paper are based on the September 2006 status of FPDS-NG.
16
company before the merger and are thus comparable to the procurement contracts of the
combined entity after the merger.24
Second, 45 companies in the S&P500 are acquired by
non-S&P500 companies and are thus excluded from the sample. Third, over the sample
period 8 S&P500 companies sell units or divisions in which the transaction value exceeds
one billion dollars. To ensure the comparability of the awarded government contracts,
these companies are excluded as well. The final sample for the first event period thus
consists of 330 companies.
For the second event period, the same criteria are applied. Out of the 407 sample
companies, 12 companies merge with other S&P500 companies, and thus the
procurement contracts of these target companies are added to those of the acquiring
companies. An additional 15 companies are further excluded; 8 companies merge with
non-S&P500 companies, and 7 companies sell units or divisions with a transaction value
of more than one billion dollars. After excluding these companies, the final sample results
in a total of 380 companies.
2.4. Board data
Board connections are derived by considering the composition of the board of
directors at the end of 1994 and 2000 of all S&P500 companies with procurement
contracts and analyzing the background of each board member.25
Section 14 of the
Securities and Exchange Commission (SEC) Act requires companies to file a definite
proxy statement (submission type Def 14a), containing information about their board
members. These filings, which are hand-collected from the EDGAR database of the SEC,
contain a brief description of each board member’s career background. Based on these
data, it is possible to identify whether board members are connected to the Republicans,
to the Democrats, or to neither. A board member is defined as being politically connected
if he or she at any time prior to 1994 and 2000, respectively, held a position such as
24
For these companies, the accounting variables such as sales, assets, EBITD, capital expenditure, and
book-to-market ratio are adjusted in the same way. 25
When using the difference in difference method we also collect board data for 1996 and 1998.

17
Senator, Member of the House of Representatives, Member of the Administration, or was
a Director of an organization such as the CIA, SEC, or FDA. A full list of these positions
is provided in Table 3.
Panel a) of Table 3 shows the descriptive statistics for the 330 sample companies
used in the analysis of the 1994 midterm election. According to the definition used in this
paper, 81 of the 330 companies are connected to the Republican Party as they have at
least one board member with a former political position with the Republicans, but no
board member with a former position with the Democratic Party. Similarly, 39 companies
are defined as being connected to the Democratic Party as they have at least one board
member connected to the Democrats, but no board member connected to the Republicans.
The remaining 210 companies are connected either to both parties (30 companies) or to
neither (180 companies). Note that the expectation is that companies connected to both
parties should not exhibit any change in contracts. This is true as long as the strength of
their connection to one party is the same as the strength of their connection to the other.
In the subsequent analysis, we discuss a number of alternative definitions of political
connections using our board data to separate out companies that are not connected from
companies that are connected to both parties. The descriptive statistics in Panel a) show
that, on average, companies that are connected to the Republicans tend to be larger than
those that are connected to the Democrats.
Panel b) of Table 3 presents the descriptive statistics for the 380 sample
companies used in the analysis of the 2000 presidential election. While 55 companies are
connected only to the Republicans, 39 companies are connected only to the Democrats.
The remaining 286 sample companies are either connected to both parties (23 companies)
or to neither (263 companies). Panel b) also confirms the evidence from Panel a) that
companies that are connected to the Republicans tend to be larger than companies that are
connected to the Democrats.
Figure 1 shows that the industry distribution of Republican and Democratic firms
is relatively evenly distributed in both years and this suggests that there is no major
concern about Republican or Democratic companies representing industry preferences

18
that are correlated with the agenda of one of the two parties. A chi-square test finds that
the two distributions are not statistically different from each other (p-values of 0.9 for
1994 and 0.6 for 2000). Finally, while not reported in the table there are only 5
companies that switch from being connected to one party in 1994 to another party in
2000. Thus, political connections seem to be long-term connections.
Table 4 provides descriptive statistics of the timing of nominations. Panel a) of
Table 4 shows that former politicians are hired long before either of the events studied.
On average, these directors are on the board more than five years before the elections.
Panel b) of Table 4 describes the timing of nominations relative to the presidential and
legislative cycles. In particular, the table shows several key points. First, most of the
nominations occur in a year following a presidential or a midterm election. More than
60% of the nominations (342 out of 550) occur in the year following a presidential or
midterm election. Second, while the number of nominations of Republican (Democratic)
board members is nearly the same under Republican or Democratic Presidents,
Republicans are much more likely to be nominated in times of Democratic control of
House and Senate. For example, under Republican Senate majority 83 out of 147
nominations are of Republican board members, representing 56% of the total. However,
under Democratic Senate majority 303 out of 403 nominations are of Republican board
members, representing 75% of the total. Thus, a higher percent of Republicans are
nominated during a period of Democratic majority.
The numbers above suggest that nominations are driven more by supply than by
demand. Demand-driven nominations would imply more Republican (Democratic)
nominations under Republican (Democratic) regimes, while supply-driven nominations
would potentially imply the opposite because the supply of former Republicans
(Democrats) is higher when Democrats (Republicans) win the majority. Thus, it would
seem that politicians do not get hired when they are most valuable (right at the beginning
of their party’s rule) but rather when they become available. This is consistent with a
situation in which there is a limited supply of politicians who companies view as both
able and willing to use their connections for the benefit of a specific company.

19
3. Empirical Results
The purpose of the empirical analysis is to determine whether the political
connections of the board influence the value of procurement contracts that companies
receive a) before and after the change in majority in House and Senate following the 1994
midterm election and b) before and after the change in Presidency following the 2000
presidential election. The analysis proceeds in two steps. First, we show univariate
results. Second, we present multivariate analyses that control for other variables.
3.1. Univariate Results
The two variables of interest are the change in the value of procurement contracts
a) between the four-year period before and the four-year period after the 1994 midterm
election and b) between the four-year period before and the four-year period after the
2000 presidential election. To minimize the impact of outliers in a specific year and to
take into account the long-term nature of public procurement contracts, the procurement
contracts for each sample company are aggregated over the two four-year periods and
then compared to each other. The first variable of interest, the change in the value of the
sum of procurement contracts between the two periods around the 1994 midterm election,
is defined as
1998 1993
, ,
1995 1990
- i i t i t
t t
C C C
where tiC , represents the dollar value of procurement contracts for company i in year t.26
Equivalently, the second variable of interest for the two periods around the 2000
presidential election is defined as
2004 1999
, ,
2001 1996
-i i t i t
t t
C C C
26
Note that the election year is not included in the calculation of the dependent variable to eliminate any
potential abnormal behavior in an election year. In a robustness test, we include the election years, and
the results do not materially change.
20
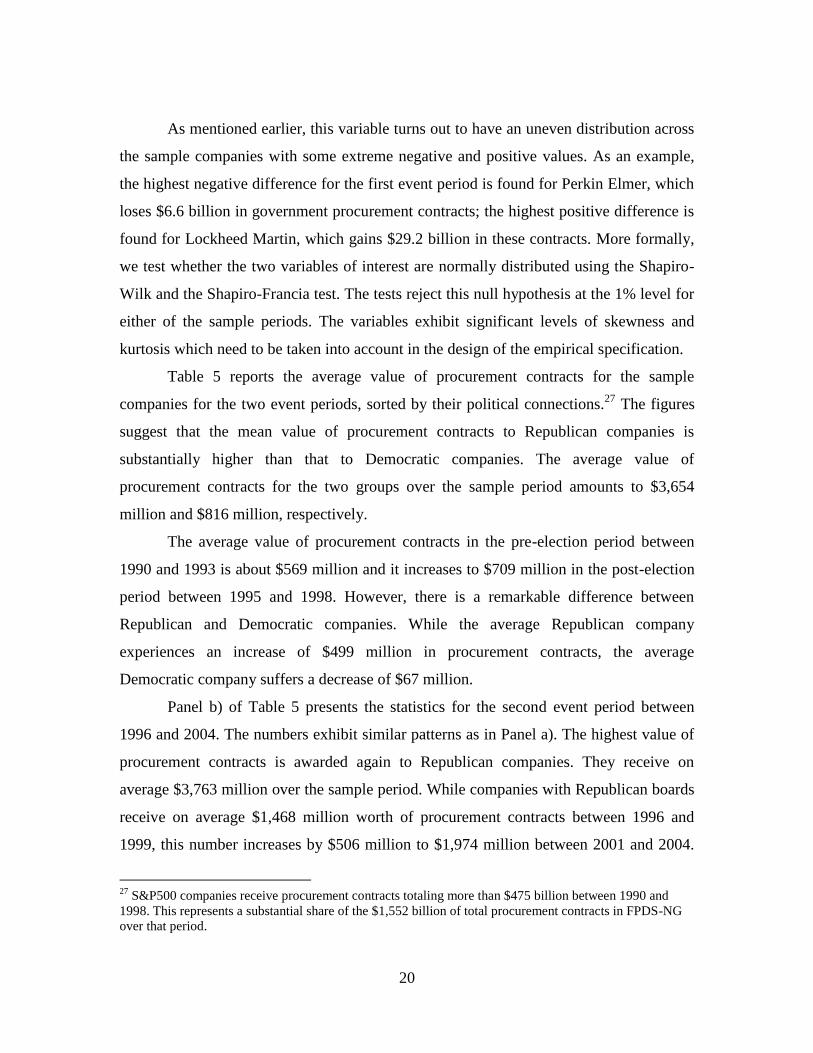
As mentioned earlier, this variable turns out to have an uneven distribution across
the sample companies with some extreme negative and positive values. As an example,
the highest negative difference for the first event period is found for Perkin Elmer, which
loses $6.6 billion in government procurement contracts; the highest positive difference is
found for Lockheed Martin, which gains $29.2 billion in these contracts. More formally,
we test whether the two variables of interest are normally distributed using the Shapiro-
Wilk and the Shapiro-Francia test. The tests reject this null hypothesis at the 1% level for
either of the sample periods. The variables exhibit significant levels of skewness and
kurtosis which need to be taken into account in the design of the empirical specification.
Table 5 reports the average value of procurement contracts for the sample
companies for the two event periods, sorted by their political connections.27
The figures
suggest that the mean value of procurement contracts to Republican companies is
substantially higher than that to Democratic companies. The average value of
procurement contracts for the two groups over the sample period amounts to $3,654
million and $816 million, respectively.
The average value of procurement contracts in the pre-election period between
1990 and 1993 is about $569 million and it increases to $709 million in the post-election
period between 1995 and 1998. However, there is a remarkable difference between
Republican and Democratic companies. While the average Republican company
experiences an increase of $499 million in procurement contracts, the average
Democratic company suffers a decrease of $67 million.
Panel b) of Table 5 presents the statistics for the second event period between
1996 and 2004. The numbers exhibit similar patterns as in Panel a). The highest value of
procurement contracts is awarded again to Republican companies. They receive on
average $3,763 million over the sample period. While companies with Republican boards
receive on average $1,468 million worth of procurement contracts between 1996 and
1999, this number increases by $506 million to $1,974 million between 2001 and 2004.
27
S&P500 companies receive procurement contracts totaling more than $475 billion between 1990 and
1998. This represents a substantial share of the $1,552 billion of total procurement contracts in FPDS-NG
over that period.
21
The dollar increase in procurement contracts is much higher than for Democratic
companies, who experience an increase of only $80 million from $359 million to $439
million. Overall, these figures provide the first piece of evidence suggesting that political
connections of companies may influence how procurement contracts are allocated.
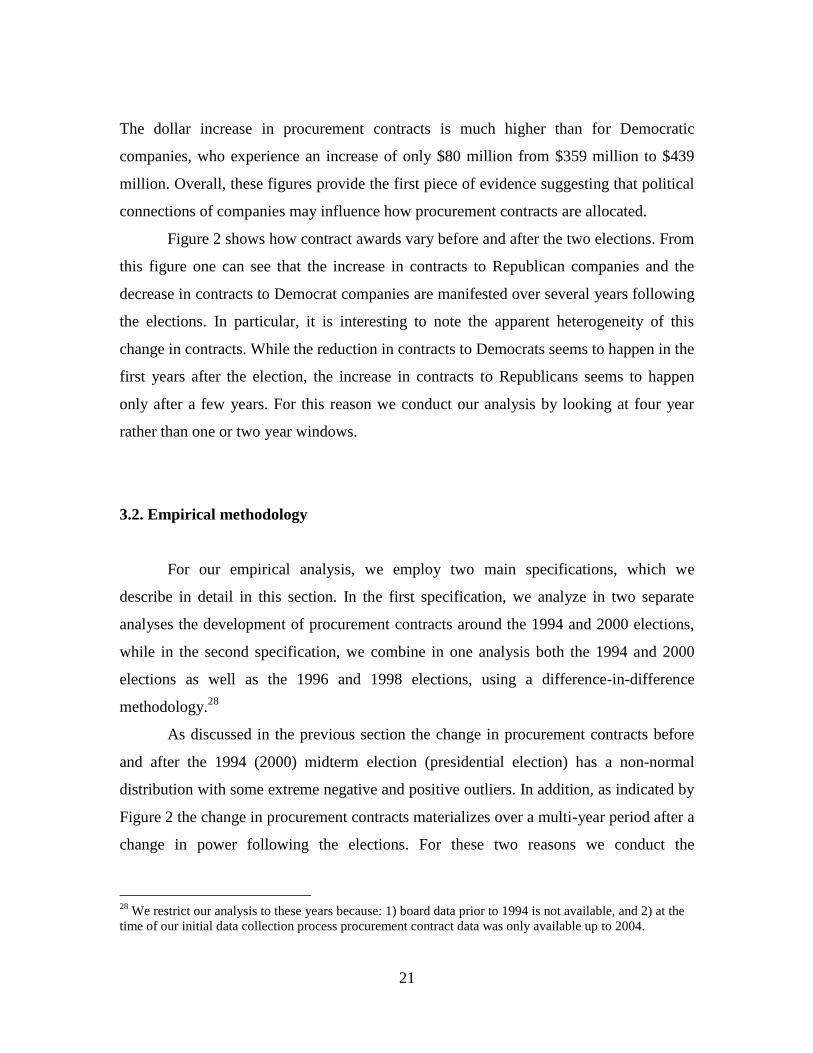
Figure 2 shows how contract awards vary before and after the two elections. From
this figure one can see that the increase in contracts to Republican companies and the
decrease in contracts to Democrat companies are manifested over several years following
the elections. In particular, it is interesting to note the apparent heterogeneity of this
change in contracts. While the reduction in contracts to Democrats seems to happen in the
first years after the election, the increase in contracts to Republicans seems to happen
only after a few years. For this reason we conduct our analysis by looking at four year
rather than one or two year windows.
3.2. Empirical methodology
For our empirical analysis, we employ two main specifications, which we
describe in detail in this section. In the first specification, we analyze in two separate
analyses the development of procurement contracts around the 1994 and 2000 elections,
while in the second specification, we combine in one analysis both the 1994 and 2000
elections as well as the 1996 and 1998 elections, using a difference-in-difference
methodology.28
As discussed in the previous section the change in procurement contracts before
and after the 1994 (2000) midterm election (presidential election) has a non-normal
distribution with some extreme negative and positive outliers. In addition, as indicated by
Figure 2 the change in procurement contracts materializes over a multi-year period after a
change in power following the elections. For these two reasons we conduct the
28
We restrict our analysis to these years because: 1) board data prior to 1994 is not available, and 2) at the
time of our initial data collection process procurement contract data was only available up to 2004.

22
multivariate analysis using as the dependent variable the log of the change in the sum of
procurement contracts between the four-year periods before and after any of the elections.
More specifically, we have for the 1994 midterm election:
1998 1993 1998 1993
, , , ,
1995 1990 1995 1990
1998 1993
, ,
1995 1990
,
log( - ) if - >1
log 0 if 1> - > -1
log[ (
i t i t i t i t
t t t t
i i t i t
t t
i
C C C C
C C C
C
1998 1993 1998 1993
, , ,
1995 1990 1995 1990
- )] if - < -1t i t i t i t
t t t t
C C C
The equivalent variable for the change in procurement contracts around the 2000
presidential election is defined as:
2004 1999 2004 1999
, , , ,
2001 1996 2001 1996
2004 1999
, ,
2001 1996
,
log( - ) if - >1
log 0 if 1> - >-1
log[ (
i t i t i t i t
t t t t
i i t i t
t t
i t
t
C C C C
C C C
C
2004 1999 2004 1999
, , ,
2001 1996 2001 1996
- )] if - <-1i t i t i t
t t t
C C C
For the second main specification, we also define accordingly the same variable
around the 1996 presidential election and the 1998 midterm election and use these two
elections as a natural control group.
The choice of the dependent variable above addresses the uneven distribution of
the raw variable, while it maintains its cardinality. Note also that this functional
transformation is well behaved in that it is a continuous function (in practice there are no
observations for which the change in the value of contracts is between 1 and -1).
The above dependent variable measures the log of the difference in contracts
rather than the difference of the log. This is because we wish to focus on the dollar value
23
of the change in contracts. In contrast, using the change in log values would focus on the
percentage change in contracts which would be less economically meaningful for our
question. Namely, it is our contention that connections are economically important in that
they generate additional dollars from government contracts regardless of the size of the
company’s existing contracts. For example, a company that first has government
contracts worth $1 million and then obtains contracts worth $2 million will - according to
the percentage measure - be viewed as a company with a larger increase than a company
that starts out with $100 million in contracts and then receives $150 million. But, we
believe that the latter company should be viewed as benefiting more from connections.
The independent variables of interest indicate whether or not a company is
politically connected through its board members. We employ three types of variables:
First, we use two dummy variables: dRep takes a value of one if a company has at least
one board member connected to the Republicans, but no board member connected to the
Democrats and a value of zero otherwise; dDem takes a value of one if a company has at
least one board member connected to the Democrats, but no board member connected to
the Republicans and a value of zero otherwise.
Second, we compute the ratio of the number of Republican board members to the
number of all connected board members as well as the ratio of Democratic board members to
the number of all connected board members and use these two ratios instead of the two
dummy variables. If there are only Republican or only Democratic board members in a given
company, then these two measures are identical to the two original dummy variables. These
measures are different from the dummy variables though when there are both Republican and
Democratic board members in a given company as they become positive fractions that are
less than one. Third, we use the number of Republican and the number of Democratic board
members as two final additional explanatory variables.
In addition, the paper uses a number of control variables. The first variable is
lnCap, which captures the log of the size of the company.29
The second variable, BM,
represents the company’s book-to-market ratio. The Herfindahl index (HHI) is included
in order to take into account the intensity of competition in the industry in which the
29
In the robustness section, we discuss controls that capture more flexible functional forms of size.

24
company operates. This index is calculated based on the sales of all competitors with the
same 2-digit SIC code. In order to control for the investment level and the cost structure
of the company, two accounting variables are included as further independent variables.
The first accounting variable CAPEX/Sales is the ratio of capital expenditure to sales,
which controls for the possibility that a company that has recently invested in its facilities
is expected to subsequently increase its production. The second accounting variable
CostGood/Sales is the ratio of cost of goods sold to sales, which is important to consider
as cost-efficient producers are more likely to be awarded with procurement contracts.
To control for the possibility that Republican and Democratic companies are
simply on different growth trajectories, are in industries that benefit from one of the two
Parties, or are in States which benefit from one of the two Parties, we control for the
growth in sales in the two-year period before the election (SalesGrowth), the industry of
the company, and whether or not the State at which the company is headquartered is
Republican, respectively.
More formally, we use variations of the following empirical specification, for
which results are reported in Table 6 and Table 7:
(1) 0 1 2 3 4
5 6 7
log (ln ) ( ) ( ) ( / )
( / ) ( ) ( )
i i i i i
i i i i i
C c Cap BM HHI CAPEX Sales
CostGood Sales dRep dDem
where log iC is the log of the change in the sum of procurement contracts between the
two periods before and after the 1994 (2000) midterm (presidential) election and i
represents an industry dummy and a dummy for whether the company is headquartered in
a Republican state.
For the second empirical specification of the difference-in-difference approach,
for which the results are reported in Table 8, we have variations of the following:
(2) , 0 1 , 2 , 3 ,log ( ) ( * ) ( * )
+
i t i t i t t i t t
i t i
C c Controls dRep dPow dDem dPow
25
where i and t represent company and year fixed effects.
Finally we run a multivariate test to explore the heterogeneity of the effect of the
increase in contracts to Republican companies. We analyze which characteristics of
politically connected Republican companies can explain the cross section of the increase
in contracts following the two elections. Namely, we ask why some Republican
companies benefit more than others.
3.3. Multivariate results
The multivariate analysis comprises three parts; the separate cross-sectional
analysis of the 1994 and 2000 elections, the difference-in-difference analysis of the 1994
and 2000 as well as 1996 and 1998 elections combined, and the cross-sectional analyses
of the heterogeneity of Republican companies.
3.3.1. Cross-sectional analysis of 1994 and 2000 events
The results for the first main empirical specifications, as outlined in equation (1),
are reported in Table 6 and Table 7. Table 6 reports the results of the cross-sectional
analysis for the 1994 midterm election. Model 1 and Model 2 include the Republican and
Democratic dummy variable, respectively, as well as the control variables. The
coefficient for the Republican dummy variable is positive and significant at the 5% level,
while the coefficient for the Democratic dummy variable is negative and significant at the
1% level. This suggests that Republican companies are more likely to experience an
increase in government contracts in the post-election period, while Democratic
companies are more likely to experience a decrease in government contracts in this
period. Model 3 includes both political dummy variables at the same time showing that
they remain significant.30
30
Note that the two variables are negatively correlated with a correlation coefficient of -0.2046 (p-value =
0.0002).

26
Model 4 also includes the growth in sales as an additional control variable. The
coefficient for this control variable is significant at the 10% level and thus suggests that
companies that are on a growth trajectory before the election increase their government
procurement awards after the election. The more important result for the purpose of this
study is that the Republican and Democratic dummy variables remain significant at the
5% level even after controlling for the pre-election sales growth. Similarly, in Model 5
we test whether the value of procurement contracts before the election has an impact on
the change in procurement contracts after the election, and we find that companies with a
high starting value lose significantly more than companies with a low starting value.
However, the results are not driven by the size of the initial contract.
The paper has so far focused on board members as the source for political
connections. However, there are also several other ways in which a company may
become politically connected, e.g. through indirect ways such as lobbyists and
consultants, or through other direct ways such as donations. As mentioned in the
introduction, existing studies provide at best mixed evidence on whether donations help
companies in becoming politically connected. Furthermore, even if they do, Jayachandran
(2006) raises the question whether donations have a causal effect on firm value or simply
represent industry preferences. Consistent with the latter argument, Goldman, Rocholl,
and So (2009) show that donations lose their explanatory power once the industry effect
is taken into account. To test more formally for the impact of donations, we include in
Model 6 controls for the political donations made by each company through contributions
from company-related individuals and political action committees (PACs). The
underlying data are from the Center for Responsive Politics (CRP), a non-partisan
research organization that collects and aggregates information on these types of corporate
donations to the Republican and Democratic Party. Specifically, we use these data to
create two dummy variables dDonation_Rep and dDonation_Dem for the 1994 election.
The first (second) variable takes a value of 1 if the company donates more to Republicans
(Democrats) than to Democrats (Republicans) and zero otherwise. Model 6 shows that
donations do not have any impact on contract awards, while the significance for the

27
coefficients for board affiliations remains unchanged.31
Thus, the inclusion of further
controls and, in particular, the donation variables does not change the main statement that
Republican companies are more likely to see an increase in the value of their
procurement contracts after the 1994 midterm election, while Democratic companies are
more likely to lose contracts.
Finally, in Model 7 and Model 8, we control for the donation variables as well as
two variations for the independent variables of interest. In Model 7, instead of using the
dummy variables for political connections, we incorporate the ratios of the number of
Republican and Democratic board members to the number of all connected board members.
The results show that the coefficients for both variables go in the same direction as before.
Companies with a higher percentage of Republican board members enjoy an increase in
procurement contracts, while companies with a higher percentage of Democratic board
members face a decrease in contracts. The coefficients are significant respectively at the 10%
and 1% level and are thus in line with the results before.
In Model 8, we use the second variation of the key explanatory variables by
incorporating the number of Republican and the number of Democratic board members. The
results are again similar to those before and show that companies with Republican board
connections see a significant increase, while those with Democratic board connections see a
significant decrease in procurement contracts after the election. The overall results thus hold
for a variety of different specifications for the key explanatory variables and stress the
robustness of the observed patterns.
For the control variables, the coefficient for the Herfindahl index is positive and
significant throughout the different models. This suggests that the lower is the level of
competition in the industry in which a company operates the more likely the company is
to gain more government contracts. Thus, it is easier for a company to gain government
contracts in a less competitive industry.
In addition to controlling for the variables described above, it is also important to
rule out the possibility that Republican and Democratic companies happen to be in certain
31
As a further robustness test, we create a continuous donation variable, which records for each company
the percentage amount donated to Republicans out of the total political donations made by that company.
The results, available upon request, remain the same.

28
industries or to be located in certain states that benefit from an increase or suffer from a
decrease in government spending. In this case, the observed pattern would not be due to a
company’s political affiliation, but simply due to the industry in which it operates or the
state in which it is headquartered.
To address both the industry and geography components more formally, each
model in Table 6 contains both an industry and a state dummy variable. The industry
dummy variable is unique for each SIC 2 digit industry; while the state dummy variable
takes a value of one if the company is headquartered in a state with a Republican senator
and a value of zero otherwise. The observed results that the key political explanatory
variables remain significant even after controlling for industry and geography thus
suggest that the patterns are indeed driven by political connections.
Table 7 reports the results for the estimation of the second event period, which
captures the time before and after the 2000 presidential election. The explanatory
variables are the same variables as in Table 6 including again controls for industry and
geography effects. In addition, we now add controls for company-level lobbying
expenses which are available for the 2000 sample from the Center for Responsive
Politics. Similar to donations, lobbying expenditures represent another potential avenue
through which companies can generate political connections. We use two variations to
control for lobbying by including either the ratio of lobbying expenses over sales or the
absolute dollar amount of lobbying.
The overall results in Table 7 suggest that Republican companies significantly
increase their government procurement contracts after the 2000 presidential election. The
coefficient for the Republican dummy variable is significant for each specification. At the
same time, the coefficient for the Democratic companies fails to be statistically
significant.
The coefficients for the lobbying variables in Models 7 to 10 fail to be significant
suggesting that lobbying does not affect the change in procurement contracts before and
after the 2000 election. More importantly, the coefficients for the board connection
variables are robust to the inclusion of these additional political connection variables.
29
Taken together the results are consistent with the results for the 1994 midterm
election and suggest that the observed effect is not driven by specific industries, specific
states, or a specific definition of the political connection of the board. At the same time
the results indicate that board connections are significant in explaining the allocation of
procurement contracts while donations and lobbying expenses are not.
The comparison of the two event periods shows that the coefficients for
Republican companies tend to be similar in the 1994 and 2000 event while the
coefficients for Democratic companies tend to be less negative in the 2000 event,
implying a smaller decrease in contracts to Democratic companies following 2000. These
results are consistent with the fact that the change in power from Democrats to the
Republicans following 1994 was more pronounced relative to the change in the political
landscape following the 2000 elections. In 2000, Republicans took over the presidency
and kept their control of House and Senate. However, Senator Jeffords’ resignation from
the Republican Party in May 2001 resulted in a shift of the Senate majority to the
Democrats for one and a half years until the 2002 midterm election. Thus, there was a
partially and temporary offsetting effect to the shift in presidential power in the post-
election period.
Overall, the empirical results suggest that companies that are connected to the
Republican Party benefit from the Republican win in the 1994 midterm election as well
as the Republican win in the 2000 presidential election. They receive more government
contracts following the two respective elections. By contrast, companies connected to the
Democratic Party lose government contracts after the elections. These results are robust
to a number of control factors that capture company-, industry- and geography-specific
characteristics and thus seem to be driven by political affiliations.
3.3.2. Difference-in-difference analysis
The results for the second main empirical specification as outlined in equation (2)
are reported in Table 8. Here we make explicit use of the panel nature of our data and
follow companies through time and across different electoral cycles. The dependent and
30
explanatory variables are the same ones as in Table 6 and Table 7, and they are calculated
around the 1994, 1996, 1998, and 2000 elections. As a company may thus appear more
than once, we control for firm fixed effects throughout the different models. We also
control for various time, industry, and geography fixed effects, along with their
interactions. The key variables of interest are the interaction variables dRep*dPow,
dDem*dPow, and dBoth*dPow. The variable dPow takes the value of one for the years
1994 and 2000 and the value of zero for the years 1996 and 1998 in which there was no
shift in power.
Model 1 tests the explanatory power of the three key variables of interest, using
the main control variables as well as year and firm fixed effects. The results show that
dRep*dPow is positive and highly significant at the 1% level. For dDem*dPow, the
coefficient is negative and fails to be significant, while the coefficient for dBoth*dPow is
positive and fails to be significant. The results are thus in line with the results in Table 6
and Table 7 in which Republican companies significantly gain procurement contracts in
both the 1994 and 2000 elections, while Democratic companies significantly lose
contracts in the 1994 election and tend to lose contracts in the 2000 election. Here,
Republican companies gain procurement contracts when the Republicans win elections,
while Democratic companies simultaneously tend to lose procurement contracts.
Model 2 controls in addition for the amount of procurement contracts in the four-
year period before each election, and the results are very similar to those in Model 1.
Model 3 includes industry fixed effects, using the Fama-French 30-industry
classification. The results are again very similar to those before, with Republican
companies seeing a significant increase in procurement contracts and Democratic
companies seeing a significant decrease. Model 4 and Model 5 employ two further
variations to control for industry effects by including dummy variables for each SIC 1
digit and each SIC 2 digit industry, respectively. The coefficients for the variables of
interest do not change much.
In Model 6 we include dummy variables for the geographical state in which the
company is headquartered. The results, again, are unaffected by this added control. To
31
further explore this issue Model 7 controls for the possibility that certain states are
particularly important in certain years according to the electoral cycle. To test for this
possibility the model includes interaction fixed effects of states and time. To further
control for industries effects that may vary over the election cycle we control in Model 8,
9, and 10 for an interaction term of industry and time fixed effects.
Finally, we can use the difference-in-difference methodology to further separate
the impact of the 1994 event from that of the 2000 event by inter-acting the board
connections dummy with a 1994 time dummy and a 2000 time dummy, separately. In
Model 9 we include the interaction effects of political connections to the Republican and
Democratic parties and the 1994 and 2000 cycles, while in Model 10 we also include the
respective interaction effects of companies with connections to both parties. The results
are very similar to those reported in Table 6 and 7 and also help explain the previous
results in Table 8.
The results indicate that the Republican company dummy is significant both for
the 1994 and 2000 events and thus in line with the previous results. For the Democratic
companies we find that the interaction variable for 1994 is negative and significant, while
for 2000 it is negative but fails to be significant, again, consistent with the results in
Table 6 and Table 7. The results for companies with connections to both parties are
negative and insignificant for 1994, while they are positive and significant for 2000. This
suggests that relations to both parties help in particular after the 2000 election, perhaps
due to the overall increase in military spending after 2001 and the heavy representation of
companies with these relations in this sector.
To sum up, the results of the difference in difference approach confirm the earlier
event study findings reported in Table 6 and Table 7.
3.3.3. Heterogeneity of effects
One important open question is whether or not some political connections matter
more than others. To explore this issue we next focus on companies with connections to
the Republican Party and analyze whether some forms of connections lead to a larger

32
increase in contracts relative to other forms of connections. The results for the
heterogeneity of these effects are reported in Table 9.
In Model 1, we test whether the specific nature of a political connection makes a
difference. We follow the notion of relatedness in Goldman, Rocholl, and So (2009) and sort
former politicians into those whose political experience is related to the industry of the
company for which they work and those for whom this criterion does not apply. For example,
if a former senator had previous political experience in finance (by say sitting on a respective
committee) and is now on the board of a financial company then we define this connection as
related. The findings here are that related connections appear to provide a larger increase in
contracts relative to non-related connections but the difference fails to be statistically
significant.
In Model 2, we analyze specifically those companies in which the Republican
board member had a political career in the defense sector; this includes all the former
Republican politicians who worked for the department of defense. Here, again, the results
show that connections to the defense department provide a larger but statistically
insignificant increase.
In Model 3, we analyze companies in which the Republican board member was a
member of the government, which is particularly relevant for the 2000 presidential
election. Likewise, in Model 4, the variable of interest focuses on companies in which the
Republican board member was a congressman or senator. This is particularly important
for the 1994 midterm election. The results show that none of these variables proves to be
significant.
In Model 5, we test whether the number of years a board member has served on
the board matters. Here we find that longer serving political directors do obtain larger
increases in contracts which suggest that it takes time for the politically connected
director to interact with government officials before she is able to affect contract awards.
In Model 6 we analyze the effect of the time that has passed since the end of an
individual’s political career. Here we find that companies with directors who had a
political appointment more recently experience a large but insignificant increase in
contracts.
33
Finally, models 7 and 8 show how past contract size (Model 7) and timing of past
contracts (Model 8) affect the increase in contracts post election. The results indicate that
Republican companies that start with larger amounts of contracts tend to have a lower but
insignificant increase in contracts while companies whose contracts arrive mostly in the
two year period before the elections tend to see a large increase in contracts post election
where this increase is statistically different than that of other Republican companies. This
last result suggests that connections matter more when the company also has a legitimate
existing relation with the contracting agencies. Namely, this seems to be sort of a
leverage effect where the fact that you are already increasing your contracts with the
government having a connection allows this increase to be even larger.
Overall, the results provide some indication to the type of situations where
connections become more valuable. However, given the nature of the data one can only
conclude that the statistical power of the results lies in the fact that companies have a
political connection rather than in the exact extent and nature of this political connection.
4. Further tests and robustness
This section presents various robustness tests to be described in more detail
below.
4.1. Choice of the dependent variable
The dependent variable in the multivariate estimations is the log of the change in
the sum of procurement contracts between the two periods before and after the 1994
(2000) midterm (presidential) election. The choice of this dependent variable addresses
the issue of the existence of extreme negative and positive outliers in the raw variable,
while maintaining the cardinality of the observations.
34
An alternative estimation technique is to transfer the cardinal into an ordinal
variable. We use this technique by dividing the sample into five groups with the same
number of companies in each group. Companies are sorted into these five groups based
on the value of iC . For example, Group 1 comprises those companies with the lowest
iC implying that companies in this group have experienced the lowest increase or the
highest decrease in the value of their contracts. The multivariate estimations are then
rerun as ordered logit models where the dependent variable is now a number between 1
and 5 depending on which of the five iC groups the company falls in to. The rest of the
control variables are exactly the same variables as before. The results of this estimation,
which are available upon request, are the same as before. The Republican dummy
variable is positive and significant for both the 1994 and 2000 election, while the
Democratic dummy variable is negative for both elections, but significant only for the
1994 election. Thus, the results are robust to a different specification of the dependent
variable.
4.2. More flexible functional forms of size
In the empirical estimations, we control for various company-specific factors to
address the possibility that the observed differences in changes in procurement contracts
between Republican and Democratic companies might not be due to their political
connections, but rather due to the fact that these firms are different from each other and
on potentially different trajectories. In particular, we address the potential concern that
the results might be driven only by the largest companies. We perform an additional test
to address this concern by allowing for more flexible functional forms of size. Thus,
while we control for the size of the company in our estimations, it might be that only
certain size groups benefit or suffer from a change in procurement contracts. Therefore,
we create size quintiles (deciles) for our sample companies and include dummies for
35
these quintiles (deciles). The results, which are available upon request, do not materially
change. The sign and significance of the political explanatory variables remain the same,
which suggests that the results hold true also for more flexible forms of size.
4.3. First event period
One last point is that the period before the 1994 election comprises two different
presidencies: a Republican presidency until 1992 and a Democratic Presidency after
1992. However, this setting imposes an even higher hurdle to find any evidence for the
political influence on the allocation of procurement contracts. For robustness we repeat
the analysis using the years 1993 and 1994 as the pre-period and the years 1995 to 1998
as the post-period. As the two periods do not have the same duration, we use as the
dependent variable the log of the change in the average annual amount in contracts
between the period from 1993 to 1994 and the period from 1995 to 1998. The results on
the Republican and Democratic dummy variables remain as before.
5. Conclusion
Government involvement in the U.S. private sector and in particular in financial
markets seems to be increasing. As government intervention in economic activity can
result in a significant reallocation of resources, some companies have the incentive to
become politically connected. In previous studies, these political connections have been
shown to result in an increase in shareholder value as measured by changes in company
stock prices around different political events.
This paper takes a first step in disentangling the source of this value by
identifying one direct way in which political connections affect the value of the largest
U.S. publicly traded companies. Based on the analysis of the individuals who serve on the
board of directors of all S&P500 companies, the paper classifies these companies into

36
those that are connected to the Democrats and those that are connected to the
Republicans. The paper asks whether political connections affect the allocation of
procurement contracts awarded to these companies following the 1994 midterm election
in which majority control in House and Senate shifts from the Democratic to the
Republican Party and following the 2000 presidential election in which the Presidency
shifts from the Democratic to the Republican Party.
The main findings are that following the 1994 midterm election and the 2000
presidential election Republican companies are more likely to experience an increase in
the total value of their procurement contracts while Democratic companies are more
likely to experience a respective decrease. These results remain statistically significant
after controlling for company characteristics, geography, as well as the industry in which
the company operates.
The results suggest that, even within the confine of the strong legal system of the
U.S., political connections have a significant impact on the allocation of government
resources.
37
References
Aggarwal, Rajesh K., Felix Meschke, and Tracy Yue Wang, 2007, "Corporate Political
Contributions: Investment or Agency?", Working Paper.
Agrawal, Anup, and Charles Knoeber, 2001, “Do some outside directors play a political
role?” Journal of Law and Economics 44, 179-198.
Ansolabehere, Stephen D., John M. de Figueiredo, and James M. Snyder, 2003, "Why Is
There So Little Money in Politics?", Journal of Economic Perspectives 17, 105-130.
Ansolabehere, Stephen D., James M. Snyder, and Michiko Ueda, 2004, “Did firms profit
from soft money?”, Election Law Journal 3,193-198.
Baron, David, 1999, “Integrated market and non-market strategies in client and interest
group politics,” Business and Politics 1, 1-32.
Bertrand, Marianne, Francis Kramarz, Antoinette Schoar, and David Thesmar, 2006,
“Politicians, firms and the political business cycle: Evidence from France”, Working
Paper.
Bombardini and Trebbi, “Competition and Political Organization: Together or Alone in
Lobbying for Trade Policy,” 2010, working paper.
Cohen, Coval, and Malloy, “Do Powerful Politicians Cause Corporate Downsizing?
2010, working paper.
Cooper, Michael, Huseyin Gulen, and Alexei Ovtchinnikov, 2010, “Corporate Political
Contributions and Stock Returns”, Journal of Finance.
de Figueiredo, John M., and Brian S. Silverman, 2006, "Academic Earmarks and the
Returns to Lobbying," Journal of Law and Economics, 49(2) (October), 597-626.
Drope Jefferey, and Wendy Hansen, 2004, “Purchasing protection? The effect of political
spending on US trade policy”, Political Research Quarterly 57, 27-37.
Faccio, Mara, 2006, “Politically connected firms”, American Economic Review 96, 369-
386.
Faccio, Mara, Ronald W. Masulis, John J. McConnell, 2006, “Political connections and
corporate bailouts”, Journal of Finance 61, 2597-2635.
Faccio, Mara, and David Parsley, 2009, “Sudden Death: Taking stock of political
connections”, Journal of Financial and Quantitative Analysis.
38
Fisman, Raymond, 2001, “Estimating the value of political connections”, American
Economic Review 91, 1095-1102.
Fisman, David, Raymond Fisman, Julia Galef, and Rakesh Khurana, 2006, “Estimating
the value of connections to Vice-President Cheney”, Working Paper.
Goldberg, Pinelopi Koujianou, and Giovanni Maggi, 1999, “Protection for sale: An
empirical investigation” American Economic Review 89, 1135-1155.
Goldman, Eitan, Jörg Rocholl, and Jongil So, 2009, “Do politically connected boards
affect firm value”, Review of Financial Studies 22, 2331-2360.
Groseclose, Timothy, Jeff Milyo, and Daniel Primo, 2000, “Corporate PAC Campaign
Contributions in Perspective,” Business and Politics 2, 75-88.
Grossman, Gene M. and Elhanan Helpman, 1994, “Protection for Sale,” American
Economic Review 84, 833–50.
Halchin, L. Elaine, 2006, “Overview of the federal procurement process and resources”,
Congressional Research Service, The Library of Congress, Order Code RS22536
Hermalin, Benjamin, and Michael Weisbach, 2003, “Boards of Directors as an
Endogenously Determined Institution: A Survey of the Economic Literature”, Federal
Reserve Bank of New York Economic Policy Review 9, 7-26.
Jayachandran, Seema, 2006, “The Jeffords effect”, Journal of Law and Economics 49,
397-425.
Karpoff, Jonathan, Scott Lee, and Valaria Vendrzyk, 1999, “Defense procurement fraud,
penalties, and contractor influence”, Journal of Political Economy 107(4), 809-842.
Khwaja, Asim I., and Atif Mian, 2005, “Do lenders favor politically connected firms?
Rent provision in an emerging financial market”, Quarterly Journal of Economics 120,
1371-1411.
Kroszner, Randall, and Philip Strahan, 2001, “Bankers on Boards: Monitoring, Conflicts
of Interest, and Lender Liability”, Journal of Financial Economics 62, 415-452.
Mian, Sufi, and Trebbi, “The Political Economy of the U.S. Mortgage Default Crisis.”
2010, American Economic Review, Forthcoming
Palmer, Kimberly, 2005, “Schmooze or lose”, Government Executive Journal.

39
Roberts, Brian, 1990, “A dead Senator tells no lies: Seniority and the distribution of
federal benefits”, American Journal of Political Science 34, 31-58.
Shleifer, Andrei, and Robert W. Vishny, 1994, “Politicians and firms”, Quarterly Journal
of Economics 109, 995-1025.
Stratmann, Thomas, 2005, “Some talk: Money in politics. A (partial) review of the
literature”, Public Choice 124, 135–156.
Snyder, James, 1990, “Campaign Contributions as Investments: The U.S. House of
Representatives 1980-1986," Journal of Political Economy 98, 1195-1227.
Wright, John, 1990, “Contributions, Lobbying, and Committee Voting in the US House
of Representatives,” The American Political Science Review 84, 417-438.
Yermack, David, 2004, “Remuneration, retention, and reputation incentives for outside
directors”, Journal of Finance 59, 2281–2308.

40
Figure 1: Distribution of politically connected companies across the Fama-French 30 industries

41
Figure 2: Time trends in procurement contracts relative to event year
Figure 2 shows the ratio of procurement contract dollars for each year relative to the dollar amount of contract in the
event year (E). Contract amounts are aggregated for the two event years of 1994 and 2000. The ratio in year E+1
implies the sum of procurement contracts in 1995 and 2001 divided by the sum for 1994 and 2000. Reported ratios are
for all companies, for Republican companies, for Democrat companies, and for Other companies that are neither
Republican nor Democrat.
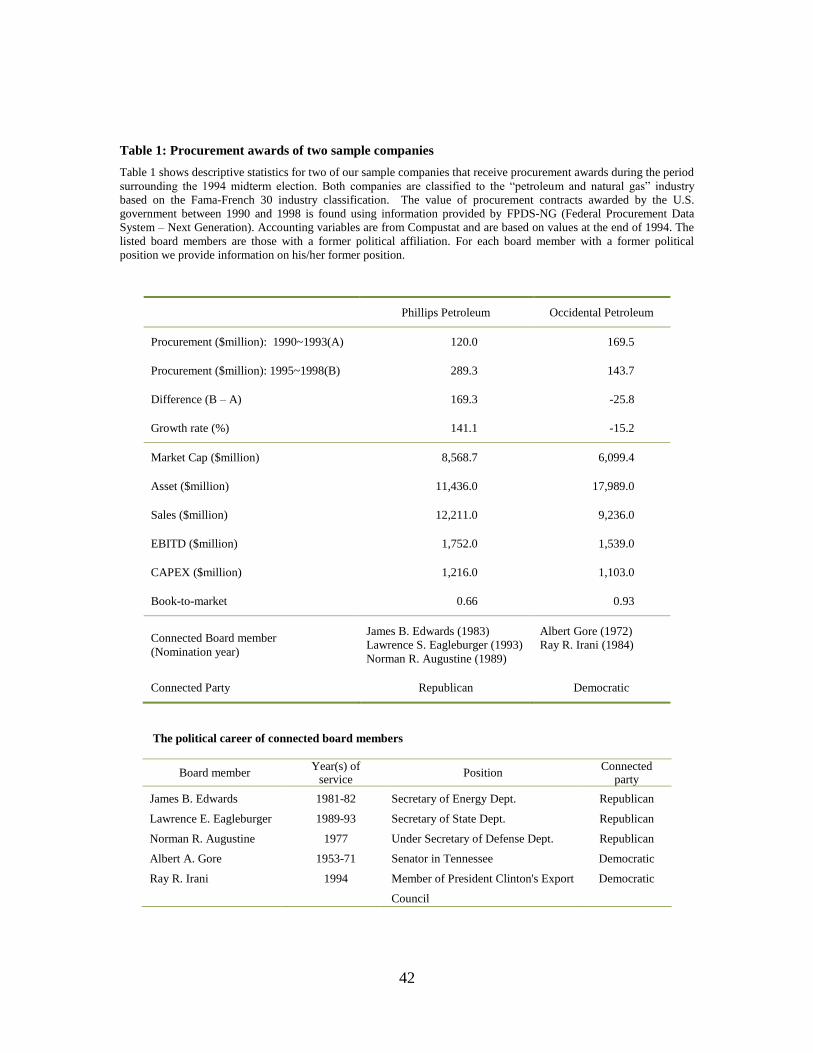
42
Table 1: Procurement awards of two sample companies
Table 1 shows descriptive statistics for two of our sample companies that receive procurement awards during the period
surrounding the 1994 midterm election. Both companies are classified to the “petroleum and natural gas” industry
based on the Fama-French 30 industry classification. The value of procurement contracts awarded by the U.S.
government between 1990 and 1998 is found using information provided by FPDS-NG (Federal Procurement Data
System – Next Generation). Accounting variables are from Compustat and are based on values at the end of 1994. The
listed board members are those with a former political affiliation. For each board member with a former political
position we provide information on his/her former position.
Phillips Petroleum Occidental Petroleum
Procurement ($million): 1990~1993(A) 120.0 169.5
Procurement ($million): 1995~1998(B) 289.3 143.7
Difference (B – A) 169.3 -25.8
Growth rate (%) 141.1 -15.2
Market Cap ($million) 8,568.7 6,099.4
Asset ($million) 11,436.0 17,989.0
Sales ($million) 12,211.0 9,236.0
EBITD ($million) 1,752.0 1,539.0
CAPEX ($million) 1,216.0 1,103.0
Book-to-market 0.66 0.93
Connected Board member
(Nomination year)
James B. Edwards (1983)
Lawrence S. Eagleburger (1993)
Norman R. Augustine (1989)
Albert Gore (1972)
Ray R. Irani (1984)
Connected Party Republican Democratic
The political career of connected board members
Board member Year(s) of
service Position
Connected party
James B. Edwards
Lawrence E. Eagleburger
Norman R. Augustine
Albert A. Gore
Ray R. Irani
1981-82
1989-93
1977
1953-71
1994
Secretary of Energy Dept.
Secretary of State Dept.
Under Secretary of Defense Dept.
Senator in Tennessee
Member of President Clinton's Export
Council
Republican
Republican
Republican
Democratic
Democratic
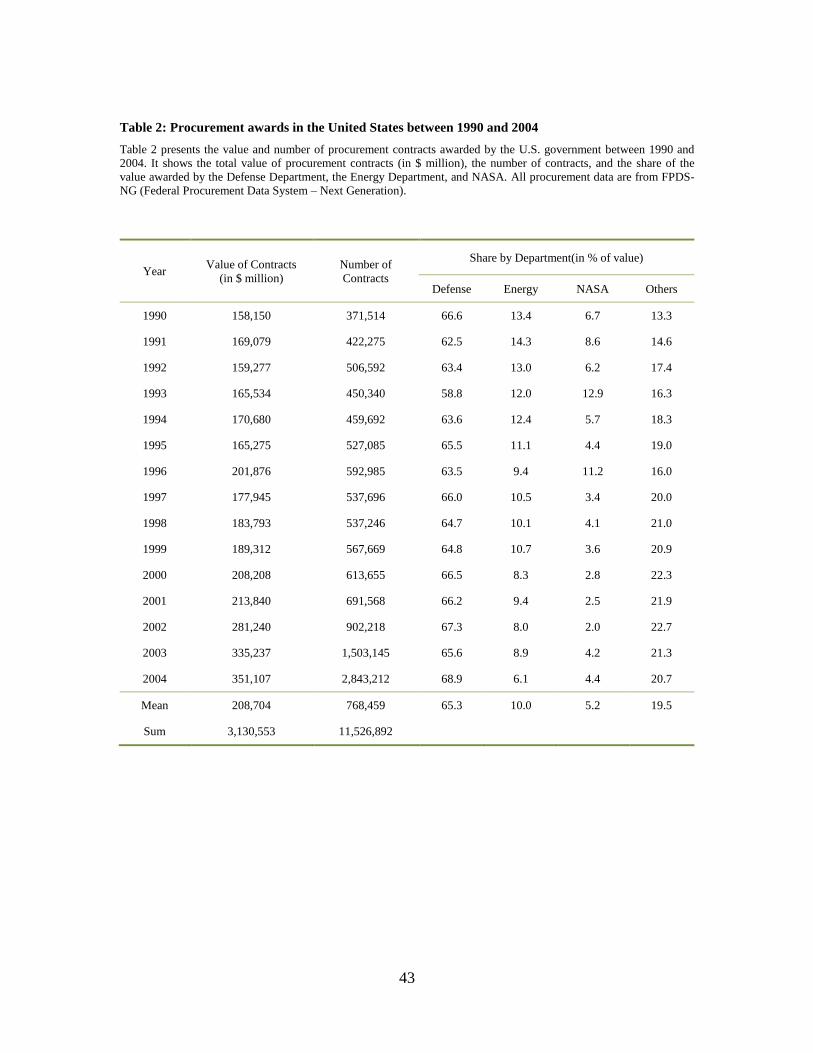
43
Table 2: Procurement awards in the United States between 1990 and 2004
Table 2 presents the value and number of procurement contracts awarded by the U.S. government between 1990 and
2004. It shows the total value of procurement contracts (in $ million), the number of contracts, and the share of the
value awarded by the Defense Department, the Energy Department, and NASA. All procurement data are from FPDS-
NG (Federal Procurement Data System – Next Generation).
Year Value of Contracts
(in $ million)
Number of
Contracts
Share by Department(in % of value)
Defense Energy NASA Others
1990 158,150 371,514 66.6 13.4 6.7 13.3
1991 169,079 422,275 62.5 14.3 8.6 14.6
1992 159,277 506,592 63.4 13.0 6.2 17.4
1993 165,534 450,340 58.8 12.0 12.9 16.3
1994 170,680 459,692 63.6 12.4 5.7 18.3
1995 165,275 527,085 65.5 11.1 4.4 19.0
1996 201,876 592,985 63.5 9.4 11.2 16.0
1997 177,945 537,696 66.0 10.5 3.4 20.0
1998 183,793 537,246 64.7 10.1 4.1 21.0
1999 189,312 567,669 64.8 10.7 3.6 20.9
2000 208,208 613,655 66.5 8.3 2.8 22.3
2001 213,840 691,568 66.2 9.4 2.5 21.9
2002 281,240 902,218 67.3 8.0 2.0 22.7
2003 335,237 1,503,145 65.6 8.9 4.2 21.3
2004 351,107 2,843,212 68.9 6.1 4.4 20.7
Mean 208,704 768,459 65.3 10.0 5.2 19.5
Sum 3,130,553 11,526,892
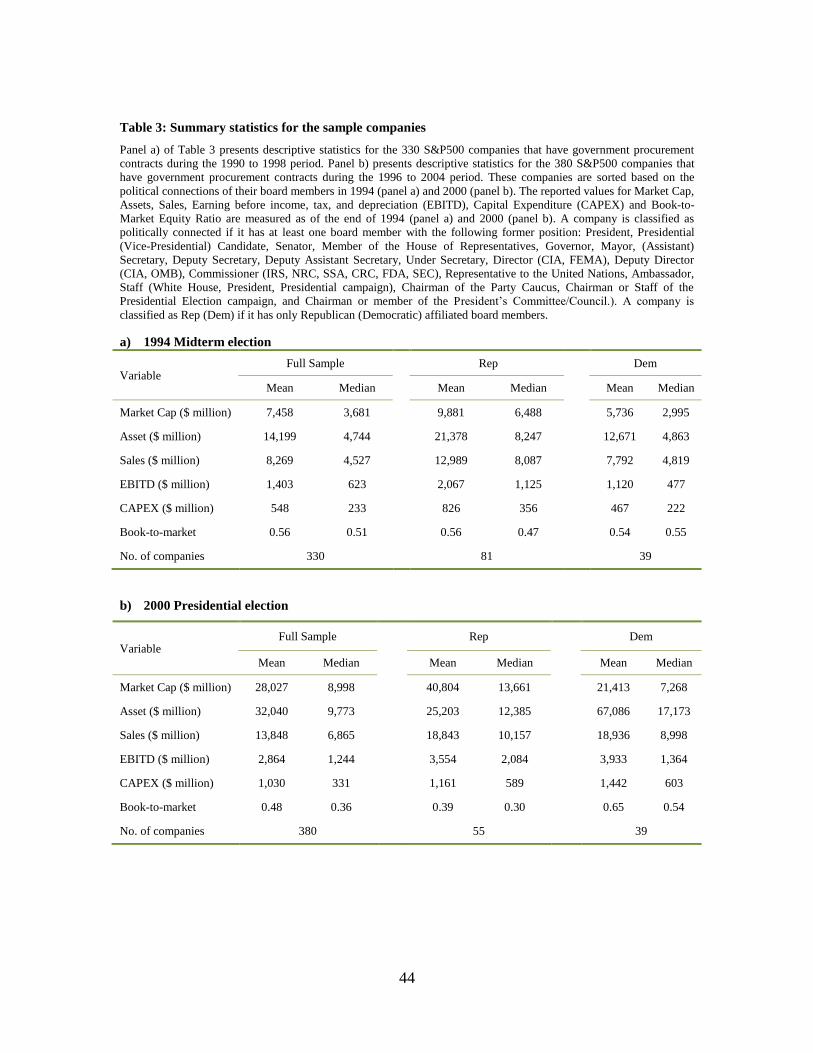
44
Table 3: Summary statistics for the sample companies
Panel a) of Table 3 presents descriptive statistics for the 330 S&P500 companies that have government procurement
contracts during the 1990 to 1998 period. Panel b) presents descriptive statistics for the 380 S&P500 companies that
have government procurement contracts during the 1996 to 2004 period. These companies are sorted based on the
political connections of their board members in 1994 (panel a) and 2000 (panel b). The reported values for Market Cap,
Assets, Sales, Earning before income, tax, and depreciation (EBITD), Capital Expenditure (CAPEX) and Book-to-
Market Equity Ratio are measured as of the end of 1994 (panel a) and 2000 (panel b). A company is classified as
politically connected if it has at least one board member with the following former position: President, Presidential
(Vice-Presidential) Candidate, Senator, Member of the House of Representatives, Governor, Mayor, (Assistant)
Secretary, Deputy Secretary, Deputy Assistant Secretary, Under Secretary, Director (CIA, FEMA), Deputy Director
(CIA, OMB), Commissioner (IRS, NRC, SSA, CRC, FDA, SEC), Representative to the United Nations, Ambassador,
Staff (White House, President, Presidential campaign), Chairman of the Party Caucus, Chairman or Staff of the
Presidential Election campaign, and Chairman or member of the President’s Committee/Council.). A company is
classified as Rep (Dem) if it has only Republican (Democratic) affiliated board members.
a) 1994 Midterm election
Variable Full Sample Rep Dem
Mean Median Mean Median Mean Median
Market Cap ($ million) 7,458 3,681 9,881 6,488 5,736 2,995
Asset ($ million) 14,199 4,744 21,378 8,247 12,671 4,863
Sales ($ million) 8,269 4,527 12,989 8,087 7,792 4,819
EBITD ($ million) 1,403 623 2,067 1,125 1,120 477
CAPEX ($ million) 548 233 826 356 467 222
Book-to-market 0.56 0.51 0.56 0.47 0.54 0.55
No. of companies 330 81 39
b) 2000 Presidential election
Variable Full Sample
Rep
Dem
Mean Median Mean Median Mean Median
Market Cap ($ million) 28,027 8,998 40,804 13,661 21,413 7,268
Asset ($ million) 32,040 9,773 25,203 12,385 67,086 17,173
Sales ($ million) 13,848 6,865 18,843 10,157 18,936 8,998
EBITD ($ million) 2,864 1,244 3,554 2,084 3,933 1,364
CAPEX ($ million) 1,030 331 1,161 589 1,442 603
Book-to-market 0.48 0.36 0.39 0.30 0.65 0.54
No. of companies 380 55 39

45
Table 4: Tenure and timing of nomination of political boards
Panel a) of Table 4 reports the mean, median, and maximum period of time (in years) between the nomination of a
politically connected board member and the 1994 midterm election and the 2000 presidential election, respectively.
Panel b) presents the number of nominations of politically connected board members in specific years. The first sorting
criterion is based on the year in a presidential cycle in which a politically connected board member is nominated. 1st
year refers to nominations in the next year after a presidential election (e.g. 1981, 1985, 1989); 2nd year refers to
nominations in the second year after a presidential election (e.g. 1982, 1986, 1990); 3rd year refers to nominations in the
third year after a presidential election (e.g. 1983, 1987, 1991), and 4th year refers to nominations in the fourth year after
a presidential election (e.g. 1984, 1988, 1992). The second sorting criterion is based on whether a board member is
nominated in an odd or an even year. The third sorting criterion is based on whether the incumbent President is from
the Republican or Democratic Party. The fourth and fifth criteria are based on whether the Republican or Democratic
Party holds the majority in the Senate and House, respectively. In election years, the calculation of the year starts on the
day after the election; in non-election years it starts on Nov. 11th.
a) Tenure of connected boards before the 1994 election and the 2000 election
1994 Election 2000 Election
All Rep Dem Total Rep Dem Total
Number of nominations of
connected board members 188 65 253 198 99 297 550
Mean 4.09 6.62 4.74 8.77 8.41 8.65 6.85
Tenure Median 3 4 3 7 7 7 6
Max 20 22 22 25 27 27 27
b) Nomination timing of connected boards
Nomination Rep Dem Total
Total 386 164 550
Year in presidential cycle
1st year 172 50 222
2nd
year 93 35 128
3rd
year 67 53 120
4th
year 54 26 80
Odd/Even Years
Odd Years 239 103 342
Even Years 147 61 208
President
Republican 194 88 282
Democratic 192 76 268
Senate Majority
Republican 83 64 147
Democratic 303 100 403
House Majority
Republican 38 36 74
Democratic 348 128 476

46
Table 5: Value of procurement contracts for sample companies
Panel a) of Table 5 summarizes the value of procurement contracts (in $million) for the sample of 330 S&P500
companies between 1990 and 1998. Panel b) summarizes the value of procurement contracts (in $million) for the
sample of 380 S&P500 companies between 1996 and 2004. A company is classified as Rep (Dem) if it has only
Republican (Democratic) affiliated board members.
a) 1994 Midterm election
Year Mean of procurement contracts ($ million)
Full Sample Rep Dem
1990~1998 1,434 3,654 816
1990~1993 (A) 569 1,394 391
1995~1998 (B) 709 1,893 323
Difference (B-A) 140 499 -67
Growth rate(%) 24.7 35.8 -17.3
No. of companies 330 81 39
b) 2000 Presidential election
Year Mean of procurement contracts ($ million)
Full Sample Rep Dem
1996~2004 2,010 3,763 922
1996~1999 (A) 720 1,468 359
2001~2004 (B) 1,072 1,974 439
Difference (B-A) 352 506 80
Growth rate(%) 48.9 34.5 22.2
No. of companies 380 55 39
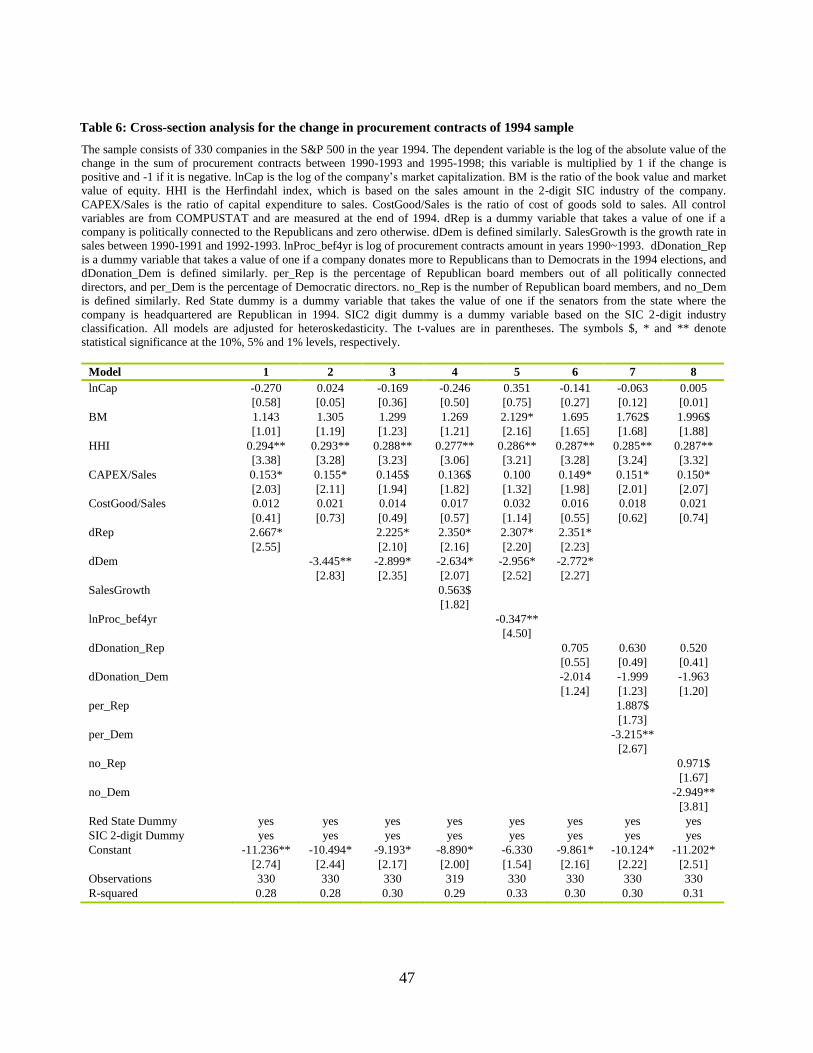
47
Table 6: Cross-section analysis for the change in procurement contracts of 1994 sample
The sample consists of 330 companies in the S&P 500 in the year 1994. The dependent variable is the log of the absolute value of the
change in the sum of procurement contracts between 1990-1993 and 1995-1998; this variable is multiplied by 1 if the change is
positive and -1 if it is negative. lnCap is the log of the company’s market capitalization. BM is the ratio of the book value and market
value of equity. HHI is the Herfindahl index, which is based on the sales amount in the 2-digit SIC industry of the company.
CAPEX/Sales is the ratio of capital expenditure to sales. CostGood/Sales is the ratio of cost of goods sold to sales. All control
variables are from COMPUSTAT and are measured at the end of 1994. dRep is a dummy variable that takes a value of one if a
company is politically connected to the Republicans and zero otherwise. dDem is defined similarly. SalesGrowth is the growth rate in
sales between 1990-1991 and 1992-1993. lnProc_bef4yr is log of procurement contracts amount in years 1990~1993. dDonation_Rep
is a dummy variable that takes a value of one if a company donates more to Republicans than to Democrats in the 1994 elections, and
dDonation_Dem is defined similarly. per_Rep is the percentage of Republican board members out of all politically connected
directors, and per_Dem is the percentage of Democratic directors. no_Rep is the number of Republican board members, and no_Dem
is defined similarly. Red State dummy is a dummy variable that takes the value of one if the senators from the state where the
company is headquartered are Republican in 1994. SIC2 digit dummy is a dummy variable based on the SIC 2-digit industry
classification. All models are adjusted for heteroskedasticity. The t-values are in parentheses. The symbols $, * and ** denote
statistical significance at the 10%, 5% and 1% levels, respectively.
Model 1 2 3 4 5 6 7 8
lnCap -0.270 0.024 -0.169 -0.246 0.351 -0.141 -0.063 0.005
[0.58] [0.05] [0.36] [0.50] [0.75] [0.27] [0.12] [0.01]
BM 1.143 1.305 1.299 1.269 2.129* 1.695 1.762$ 1.996$
[1.01] [1.19] [1.23] [1.21] [2.16] [1.65] [1.68] [1.88]
HHI 0.294** 0.293** 0.288** 0.277** 0.286** 0.287** 0.285** 0.287**
[3.38] [3.28] [3.23] [3.06] [3.21] [3.28] [3.24] [3.32]
CAPEX/Sales 0.153* 0.155* 0.145$ 0.136$ 0.100 0.149* 0.151* 0.150*
[2.03] [2.11] [1.94] [1.82] [1.32] [1.98] [2.01] [2.07]
CostGood/Sales 0.012 0.021 0.014 0.017 0.032 0.016 0.018 0.021
[0.41] [0.73] [0.49] [0.57] [1.14] [0.55] [0.62] [0.74]
dRep 2.667* 2.225* 2.350* 2.307* 2.351*
[2.55] [2.10] [2.16] [2.20] [2.23]
dDem -3.445** -2.899* -2.634* -2.956* -2.772*
[2.83] [2.35] [2.07] [2.52] [2.27]
SalesGrowth 0.563$
[1.82]
lnProc_bef4yr -0.347**
[4.50]
dDonation_Rep 0.705 0.630 0.520
[0.55] [0.49] [0.41]
dDonation_Dem -2.014 -1.999 -1.963
[1.24] [1.23] [1.20]
per_Rep 1.887$
[1.73]
per_Dem -3.215**
[2.67]
no_Rep 0.971$
[1.67]
no_Dem -2.949**
[3.81]
Red State Dummy yes yes yes yes yes yes yes yes
SIC 2-digit Dummy yes yes yes yes yes yes yes yes
Constant -11.236** -10.494* -9.193* -8.890* -6.330 -9.861* -10.124* -11.202*
[2.74] [2.44] [2.17] [2.00] [1.54] [2.16] [2.22] [2.51]
Observations 330 330 330 319 330 330 330 330
R-squared 0.28 0.28 0.30 0.29 0.33 0.30 0.30 0.31

48
Table 7: Cross-section analysis for the change in procurement contracts of 2000 sample
The sample consists of 380 companies in the S&P 500 in the year 2000. The dependent variable is the log of the absolute value of the
change in the sum of procurement contracts between 1996-1999 and 2001-2004; this figure is multiplied by 1 if the change is positive
and multiplied by -1 if it is negative. lnCap is the log of the company’s market capitalization. BM is the ratio of the book value and
market value of equity. HHI is the Herfindahl index, which is based on the sales amount in the 2-digit SIC industry of the company.
CAPEX/Sales is the ratio of capital expenditure to sales. CostGood/Sales is the ratio of cost of goods sold to sales. All control
variables are from COMPUSTAT and are measured at the end of 2000. dRep is a dummy variable that takes a value of one if a
company is politically connected to the Republicans and zero otherwise. dDem is defined similarly. SalesGrowth is the growth rate in
sales between 1996-1997 and 1998-1999. lnProc_bef4yr is log of procurement contracts amount in the years 1996~1999.
dDonation_Rep is a dummy variable that takes a value of one if a company donates more to Republicans than to Democrats in the
2000 elections, and dDonation_Dem is defined similarly. Lobby/Sales is the ratio of lobbying amounts to sales. Lobby is the dollar
amount (millions) spent on lobbying. per_Rep is the percentage of Republican board members out of all politically connected
directors on the board, and per_Dem is the percentage of Democratic directors. no_Rep is the number of Republican board members,
and no_Dem is defined similarly. Red State dummy is a dummy variable that takes the value of one if the senators from the state
where the company is headquartered are Republican in 2000. SIC2 digit dummy is a dummy variable based on SIC 2-digit industry
classification. All models are adjusted for heteroskedasticity. The t-values are in parentheses. The symbols $, * and ** denote
statistical significance at the 10%, 5% and 1% levels, respectively.
Model 1 2 3 4 5 6 7 8 9 10 11 12
lnCap -0.671$ -0.607 -0.680$ -0.241 -0.014 -0.799$ -0.136 -0.474 -0.130 -0.461 -0.882$ -0.921*
[1.74] [1.53] [1.72] [0.63] [0.04] [1.77] [0.28] [0.82] [0.24] [0.75] [1.95] [2.05]
BM -3.474* -3.628* -3.503* -3.414* -2.255$ -3.760* -1.995 -2.497 -1.937 -2.449 -3.826** -3.851**
[2.50] [2.54] [2.45] [2.56] [1.68] [2.56] [0.91] [1.11] [0.88] [1.07] [2.62] [2.70]
HHI 0.074 0.086 0.074 -0.055 0.063 0.076 0.133 0.103 0.134 0.105 0.073 0.079
[0.54] [0.63] [0.54] [0.39] [0.52] [0.54] [0.66] [0.51] [0.66] [0.52] [0.53] [0.58]
CAPEX/Sales -0.079 -0.093$ -0.080 -0.109* -0.093$ -0.078 -0.170** -0.172** -0.172** -0.174** -0.076 -0.081
[1.53] [1.78] [1.51] [2.09] [1.85] [1.48] [2.83] [2.88] [2.84] [2.88] [1.42] [1.51]
CostGood/Sales -0.030 -0.029 -0.030 -0.003 -0.009 -0.031 -0.058 -0.065 -0.059 -0.065 -0.033 -0.036
[1.07] [1.04] [1.09] [0.11] [0.35] [1.12] [1.43] [1.63] [1.44] [1.65] [1.20] [1.30]
dRep 2.416* 2.443* 2.773* 3.249** 2.332* 2.610$ 2.479$ 2.641$ 2.502$
[2.21] [2.21] [2.50] [3.02] [2.08] [1.84] [1.75] [1.84] [1.75]
dDem -0.168 0.228 -0.770 1.047 0.237 2.277 2.268 2.307 2.292
[0.10] [0.13] [0.51] [0.66] [0.14] [0.99] [0.99] [0.99] [0.99]
SalesGrowth 0.905*
[2.16]
lnProc_bef4yr -0.428**
[6.32]
dDonation_Rep 0.615 0.025 -0.034 0.502 0.431
[0.56] [0.02] [0.02] [0.46] [0.39]
dDonation_Dem 2.826 -0.846 -0.603 2.564 2.518
[1.22] [0.27] [0.20] [1.11] [1.12]
Lobby/Sales 23.954 24.415
[0.55] [0.53]
Lobby($million) 0.326 0.324
[1.09] [1.05]
per_Rep 3.01**
[2.75]
per_Dem 1.200
[0.76]
no_Rep 1.534*
[2.11]
no_Dem 1.158
[1.27]
Red State Dummy yes yes yes yes yes yes yes yes yes yes yes yes
SIC 2-digit Dummy yes yes yes yes yes yes yes yes yes yes yes yes
Constant 17.058** 16.674** 16.925** 13.139** 17.99** 15.219** 11.086* 14.969* 11.885$ 15.456* 15.360** 15.947**
[4.46] [4.21] [4.28] [3.34] [4.71] [3.39] [2.05] [2.44] [1.92] [2.40] [3.49] [3.73]
Observations 380 380 380 338 380 380 222 223 222 223 380 380
R-squared 0.22 0.21 0.22 0.24 0.30 0.22 0.29 0.29 0.29 0.29 0.23 0.23

49
Table 8: Panel data analysis for 1994 and 2000 event
The sample consists of all firms in the S&P500 having procurement contracts in the year 1994, 1996, 1998 and 2000, that is two event year, 1994 and 2000, two placebo event year 1996 and 1998. The dependent variable is the log of the absolute value of the change in the sum of procurement contracts between before and after the event year; this figure is multiplied by 1 if the change is positive and multiplied by -1 if it is negative. lnCap is the log of the company’s market capitalization. BM is the ratio of the book value and market value of equity. HHI is the Herfindahl index, which is based on the sales amount in the 2-digit SIC industry of the company. CAPEX/Sales is the ratio of capital expenditure to sales. CostGood/Sales is the ratio of cost of goods sold to sales. All control variables are from COMPUSTAT and are measured at the end of 1994, 1996, 1998, and 2000. lnProc_bef4yr is the log of the procurement contracts amount 4 years before the election (1990~1993, 1992~1995, 1994,~1997, 1996~1999). dRep is a dummy variable that takes a value of one if a company is politically connected to the Republicans and zero otherwise. dDem is defined similarly. dBoth is a dummy variable that takes a value of on if a company is politically connected to both parties. dPow is a dummy variable that takes a value of one for the event years 1994 and 2000. dRep*dPow is the interaction term of dRep and dPow; dDem*dPow is defined similarly. d94, d00 are dummy variables that take a value of one if the year is 1994 and 2000, respectively. dRep*d94 is the interaction term of dRep and d94. FF30 Ind Dummy includes dummy variables for each industry according to the Fama-French 30-industry classification. SIC 1-digit dummy is a dummy variable based on the SIC 1-digit industry classification. SIC 2-digit dummy is a dummy variable based on the SIC 2-digit industry classification. State Dummy is a dummy variable for each state in the United States. State*Year dummy is the interaction variable of State dummy and Year dummy. SIC 2dig*Year dummy is the interaction variable of SIC 2-digit dummy and Year dummy. All models are adjusted for heteroskedasticity. The t-values are in parentheses. The symbols $, * and ** denote statistical significance at the 10%, 5% and 1% levels, respectively.
Model 1 2 3 4 5 6 7 8 9 10
lnCap -0.432 0.122 -0.429 -0.674 -0.478 -0.432 -0.069 -0.080 -0.169 -0.486
[0.39] [0.11] [0.38] [0.60] [0.42] [0.39] [0.08] [0.08] [0.17] [0.49]
BM 0.165 1.285 1.994 1.030 1.911 0.165 0.169 2.362 2.421 2.010 [0.07] [0.55] [0.83] [0.43] [0.80] [0.07] [0.07] [1.02] [1.04] [0.86]
HHI 20.985 19.386 20.668 21.101 21.739 20.985 10.099 5.719 6.126 7.194
[1.19] [1.13] [1.18] [1.20] [1.25] [1.19] [0.55] [0.28] [0.30] [0.35] CAPEX/Sales 4.390 8.347 4.417 4.915 3.478 4.390 5.608 6.448 7.155 6.057
[0.46] [0.90] [0.47] [0.52] [0.37] [0.46] [0.59] [0.69] [0.77] [0.65]
CostGood/Sales -5.442 -1.067 -4.347 -2.846 -0.754 -5.442 -4.944 2.875 2.645 2.508 [0.60] [0.12] [0.48] [0.32] [0.08] [0.60] [0.53] [0.31] [0.28] [0.27]
lnProc_bef4yr -1.29**
[7.57] dRep*dPow 5.456** 4.678** 5.548** 5.256** 5.139** 5.456** 4.368** 4.832**
[2.99] [2.64] [3.04] [2.91] [2.85] [2.99] [2.59] [2.83]
dDem*dPow -1.653 -1.847 -1.425 -2.333 -2.647 -1.653 -3.093 -3.701 [0.74] [0.85] [0.64] [1.05] [1.17] [0.74] [1.42] [1.64]
dBoth*dPow 1.983 2.010 1.194 1.434 0.975 1.983 1.819 1.844
[0.77] [0.81] [0.47] [0.56] [0.38] [0.77] [0.72] [0.74] dRep*d94 4.976* 4.995*
[2.28] [2.29]
dDem*d94 -5.573$ -5.571$ [1.81] [1.81]
dBoth*d94 -2.799
[0.84] dRep*d00 4.495$ 4.542$
[1.85] [1.87]
dDem*d00 -2.030 -2.048 [0.67] [0.68]
dBoth*d00 7.105*
[1.99] Year Effect yes yes yes yes yes yes
Firm Fixed Effect yes yes yes yes yes yes yes yes yes yes
FF 30 Ind Dummy yes SIC 1-digit Dummy yes
SIC 2-digit Dummy yes
State Dummy yes State*Year Dummy yes
SIC 2-digit * Year Dummy yes yes yes Constant 6.190 17.225 17.254 -40.95* -37.24* 6.190 -395,908 -313,605 -218,483 -132,818
[0.50] [1.42] [0.80] [2.04] [1.97] [0.50] [0.02] [0.27] [0.19] [0.11]
Observations 1358 1358 1358 1358 1358 1358 1358 1358 1358 1358 Number of firm 456 456 456 456 456 456 456 456 456 456
R-squared 0.02 0.08 0.06 0.04 0.08 0.02 0.11 0.19 0.19 0.19

50
Table 9: Robustness test: Detailed analysis for Republican companies
The sample consists of only Republican firms in the S&P500 that have procurement contracts in the years 1994 and 2000. The dependent variable is the log of the absolute value of the change in the sum of procurement contracts between before and after the event year; this figure is multiplied by 1 if the change is positive and multiplied by -1 if it is negative. lnCap is the log of the company’s market capitalization. BM is the ratio of the book value and market value of equity. HHI is the Herfindahl index, which is based on the sales amount in the 2-digit SIC industry of the company. CAPEX/Sales is the ratio of capital expenditure to sales. CostGood/Sales is the ratio of cost of goods sold to sales. All control variables are from COMPUSTAT and are measured at the end of 1994 and 2000 respectively. dRelatedness is a dummy that takes a value of one if the former career of a connected board member is related to the current business of the company. dDefense is a dummy for board member with a defense career. dGovernment is a dummy for a board who was a government official. dCongress is a dummy for a board who was a congressman, Senate or House of representative. Tenure is the number of years for which the connected board member has been on the board of the company. Gap is the number of years between the last political appointment of the board member and his nomination to the board. dBig_contract_bef4year is a dummy that takes a value of one if the average procurement contract size for 4 years before the event year is greater than the median in the Republican companies in 1994 or 2000. % of 3rd & 4th year contract is the ratio of the 3rd and 4th year contract amount and the total 4-year period contract amount. Red State dummy is a dummy variable that takes the value of one if the senators from the state where the company is headquartered are Republican in 1994 and 2000, respectively. The SIC 1-digit dummy is a dummy variable based on the SIC 1-digit industry classification. All models are adjusted for heteroskedasticity. The t-values are in parentheses. The symbols $, * and ** denote statistical significance at the 10%, 5% and 1% levels, respectively.
Model 1 2 3 4 5 6 7 8
lnCap 0.279 0.248 0.288 0.288 -0.039 -0.462 0.486 0.202
[0.52] [0.47] [0.54] [0.54] [0.06] [0.71] [0.84] [0.37]
BM 0.888 1.071 0.953 0.953 -0.692 -1.771 1.198 1.175
[0.55] [0.68] [0.62] [0.62] [0.31] [0.91] [0.74] [0.64]
HHI -0.016 -0.023 -0.021 -0.021 -0.150 -0.057 -0.031 -0.062
[0.11] [0.16] [0.15] [0.15] [0.73] [0.28] [0.23] [0.44]
CAPEX/Sales -0.018 -0.016 -0.017 -0.017 -0.011 -0.081 -0.021 -0.021
[0.22] [0.20] [0.20] [0.20] [0.10] [0.81] [0.25] [0.25]
CostGood/Sales -0.053 -0.051 -0.052 -0.052 -0.034 -0.047 -0.040 -0.051
[1.45] [1.43] [1.40] [1.40] [0.68] [1.04] [1.12] [1.41]
dRelatedness 0.266
[0.22]
dDefense 1.473
[0.86]
dGovernment 0.035
[0.02]
dCongress -0.035
[0.02]
Tenure (years) 0.310*
[2.01]
Gap (years) -0.172
[1.24]
dBig_contract_bef4yr -1.356
[1.01]
% of 3rd & 4th year contracts 0.056* [2.02]
Red State Dummy yes yes yes yes yes yes yes yes
SIC 1-digit Dummy yes yes yes yes yes yes yes yes
Constant 8.828 8.589 8.761 8.796 -1.35 5.673 7.357 13.828*
[1.32] [1.28] [1.28] [1.31] [0.16] [0.74] [1.08] [2.12]
Observations 136 136 136 136 90 99 136 134
R-squared 0.08 0.09 0.08 0.08 0.16 0.16 0.09 0.12