property rights, political connections, and corporate...
TRANSCRIPT

Policy Research Working Paper 8973
Property Rights, Political Connections, and Corporate Investment
Meng MiaoDragon Yongjun Tang
Lixin Colin Xu
Development Economics Development Research GroupAugust 2019
Pub
lic D
iscl
osur
e A
utho
rized
Pub
lic D
iscl
osur
e A
utho
rized
Pub
lic D
iscl
osur
e A
utho
rized
Pub
lic D
iscl
osur
e A
utho
rized

Produced by the Research Support Team
Abstract
The Policy Research Working Paper Series disseminates the findings of work in progress to encourage the exchange of ideas about development issues. An objective of the series is to get the findings out quickly, even if the presentations are less than fully polished. The papers carry the names of the authors and should be cited accordingly. The findings, interpretations, and conclusions expressed in this paper are entirely those of the authors. They do not necessarily represent the views of the International Bank for Reconstruction and Development/World Bank and its affiliated organizations, or those of the Executive Directors of the World Bank or the governments they represent.
Policy Research Working Paper 8973
Despite the literature on rural land property rights, studies on urban land property rights are rare. This paper stud-ies the impact of an urban land titling program on firm investment. It finds that the program leads to increased investment rate for titling firms, and the positive effect holds only for politically connected firms. The effects are
likely causal, because they are more pronounced for firms that are more likely to benefit from strengthened property rights. Connected titling firms experienced fewer disputes than nonconnected titling firms after the program, and the results remain robust when using instrumental variable estimation.
This paper is a product of the Development Research Group, Development Economics. It is part of a larger effort by the World Bank to provide open access to its research and make a contribution to development policy discussions around the world. Policy Research Working Papers are also posted on the Web at http://www.worldbank.org/prwp. The authors may be contacted at [email protected].

Property Rights, Political Connections, and Corporate Investment
Meng Miao, Renmin University of China
Dragon Yongjun Tang, The University of Hong Kong
Lixin Colin Xu, World Bank
JEL codes: D22, G38. Key words: Property rights, political connections, investment, enforcement.
We thank Julian Atanassov, Warren Bailey, Zhiwu Chen, Nandini Gupta, Martin Reiser, Chenggang Xu, Yuanyuan Yi and the participants at the China International Conference in Finance for their useful comments. The views here are the authors’ own and do not implicate the World Bank or the countries it represents. The emails of the authors are [email protected] (Meng Miao), [email protected] (D.Y. Tang), and [email protected] (L.C. Xu).

2
1. Introduction
From its inception, the property rights paradigm has emphasized that the emergence and the
effect of property rights of an asset depend on the evolution of its value over time. Indeed, the
seminal Demsetz (1967) suggests that property rights become more well-defined when
technological and environmental changes result in significant rises in the value of the asset.
His example is the emergence of private land ownership after the development of commercial
fur trade among American Indians, which skyrocketed the value of the land.
The subsequent historical and empirical literature has often found positive effects of
strengthening property rights (Besley 1995; Acemoglu et al. 2001; Banerjee, Gertler and
Ghatak 2002; Jacoby, Roselle, and Li 2002; and McMillan et al. 2002). A puzzle is that reforms
in property rights often do not work (North 1993, Goldstein and Udry 2008). Some scholars
attribute this lack of positive effects of (presumably) beneficial institutional changes to
counteractions of powerful interest groups, who attempt to neutralize or reverse these changes’
effects to maintain their economic and political dominance (Rajan and Zingales 2003,
Acemoglu, Ticchi and Vindigni 2011, and Puga and Trefler 2014). Goldstein and Udry (2008)
offer solid evidence that the effects of better property rights in rural Ghana depend on whether
a farmer has access to power in the local community. Is this important insight that the effects
of property rights depend on access to power or political connections general? Does it apply in
the context of urban land rights? How do reforms in urban land property rights affect firm
behavior? And how does access to power by firms affect the effects of strengthening urban land
property rights? These are important questions since power figures prominently in developing
countries due partly to the lack of political competition (relative to the developed world).1
Moreover, rural Ghana, the context of Goldstein and Udry (2008), differs greatly from many
other developing countries in the importance of tribes in local governance, its relatively low
1 Power also figures prominently even in developed democratic countries such as the United States, as in the case of Robert Moses, who had never been elected in any positions, wielded as much power as any mayors and/or governors (Caro, 1974).
3
income, among others. In this paper, we examine the effects of property rights of urban land in
the most dynamic city in China (and possibly in the world as well), Shenzhen, and how the
effects of urban land property rights vary by political connections. China is unique in that it is
the most populous country in the world, with a much higher income than Africa, and political
power remains crucially important (McGregor 2010).
Shenzhen is an ideal place to test how rapid appreciation in asset value shapes property
rights. Being designated as the first Special Economic Zone in China when it was a town of
30,000 people in 1980, Shenzhen has since grown into the third largest Chinese city (behind
Beijing and Shanghai), surpassing the economic size (in terms of total GDP) of Hong Kong
SAR, China, and countries such as Vietnam and Portugal. Its population has grown slightly
less than 700-fold to about 20 million residents (including non-registered migrants). While the
average land price has doubled between 2005 to 2017 for cities other than the four mega-cities
(i.e., Beijing, Shanghai, Guangzhou, and Shenzhen), it has increased seven-fold in Shenzhen
(see Figure 1). With urban land price skyrocketing, the costs of misallocating urban land rise
drastically. Yet before 2012, there was a land category called allocated land (Allocated land
hereafter) that could not be traded by its owner: The user had user rights but did not have formal
ownership, and neither could they use the land as collateral. On the other hand, entitled land,
the prevalent form of land, has been associated with full tradability, formal ownership and
pledgeability as collateral. Table 1 compares the differences between Allocated land and
entitled land. For Allocated land, the costs of land misuses were not internalized by its
occupiers, and with skyrocketing land prices, it became efficient to alter its land rights and to
make it tradable. This need for change in property rights when experiencing significant changes
in underlying asset value is emphasized by Demsetz (1967), “It is my thesis … that the
emergence of new property rights takes place in response to the desires of the interacting
persons for adjustment to new benefit-cost possibilities” (p. 350, Demsetz 1967). Shenzhen is
also an ideal place to study the interaction between property rights reform and political

4
connections. Built from scratch since the reform began, the city has been perhaps the least
subject to traditional institutional and social constraints, which makes Shenzhen the most likely
place to implement radical reforms and succeed. Many scholars have worried that externally
imposed institutions are unlikely to succeed due to the lack of compatibility between the
existing and the newly imposed institutions (Hayek 1960; Acemoglu, Cantoni, Johnson, and
Robinson 2011). Given the fresh start of Shenzhen, the effects of urban property rights reform
should constitute the upper bound of the property rights effects in China.
Understanding the evolution of private property rights in urban China is of critical
importance for understanding the future of China’s economy. After four decades of economic
and institutional reforms, private entrepreneurs still do not feel secure about private property
rights, as illustrated by a recent well-known event. On 12th September 2018, an article named
“the private sector’s job is done, and it is time for its exit,” written by an entrepreneur of online
business named Wu Xiaoping, was widely circulated on the internet. He suggested that the
private sector had finished the job of assisting the development of the state sector and should
exit the economic arena in China. Given the widespread exposure of this article under the non-
trivial control of the media by the government (Qin et al. 2018), and the perception of insecurity
of private property rights, it is not surprising that the private corporate sector panicked in China.
On 1st November 2018, President Xi Jinping publicly announced that the private entrepreneurs
were “one of us” when he attended a symposium on the development of private enterprises. On
the next trading day, the Shanghai Stock Index went up 2.7%, reflecting relief from the anxiety
over the security of private property rights protection in China.
The urban land reform we consider is an Urban Renewal Program implemented in
Shenzhen. Under this program, all firms occupying Allocated land, a type of untitled land with
weak property rights protection, could obtain land titles to strengthen the protection of their
property rights. Two features of this program make it particularly suitable for studying urban
land property rights, and the interactions between political connections and property rights
5
protection. First, under this program, the statuses of the treatment and the control groups are
pre-determined. The participation in the treatment group (i.e., those firms that obtained land
titles for their Allocated land) was determined many years prior to the reform and was not
driven by investment opportunities. This feature mitigates concerns regarding endogeneity of
participating in the property rights reforms with respect to investment, our outcome variable.
Second, due to its legacy of a planned economy, China features an institutional setting with
clearly identified groups having access to power and political connections. Notably, state-
owned enterprises (SOEs) and other connected firms in China receive substantially more
favorable treatment from the government in various forms than privately owned firms.2
From the universe of publicly listed firms on the Chinese stock market, we identify titling
firms, our treatment group, as those Shenzhen firms that occupied Allocated land and that were
qualified to receive land titles under the Urban Renewal Program. Based on the law, all holders
of Allocated lands in Shenzhen at the time of the reform could obtain land titles after due
application procedures and government approval. The rest of the listed firms, who either
operate on entitled lands or are listed firms with Allocated Land in cities other than Shenzhen,
constitute the control group as their land rights are intact throughout the reform.3 We then
examine whether and how much the urban land titling program promotes firm investment.
Given China’s severe resource misallocation problem brought about by the weak property
rights protection (Cull and Xu, 2005) and state interventions (Bailey, Huang, and Yang, 2011),
we expect that urban land titling would incentivize firms to invest.
Our basic empirical strategy is difference in difference (DID). That is, we allow the
before-after changes in the investment rate to depend on the treatment status (i.e., land titling
for urban firms in Shenzhen), conditional on key covariates. The identifying assumption is that
conditional on firm fixed effects and the controlled covariates, the treatment status of Titling
2 See Lin, Cai and Li (1998); and Cull et al. (2015). 3 The owner of the collectively owned land, the other type of untitled land, may not receive land titles in the Urban Renewal Program. However, this is irrelevant for our empirical setting, as no listed firm in Shenzhen holds collectively owned land. All collectively owned land is held by peasants.

6
Firm is exogenous. We extensively examine the robustness of our results. We show that titling
firms (i.e., the treatment) and non-titling firms do not differ in key pre-treatment characteristics
and performance. We document that the treatment status was determined by initial state
ownership but not current characteristics. We also conduct the instrumental variable estimation
exploiting the fact that the titling status was determined by initial state ownership when the
firm was founded (or being relocated to Shenzhen), and obtain qualitatively and quantitatively
similar estimates.
We obtained many robust findings. The first is that these titling firms on average see their
investment rates higher by 30 percentage points than otherwise similar firms during the five-
year period following the announcement of the Urban Renewal Program, whether we use the
DID or the instrumental variable estimation. The result is unchanged if we limit our sample to
listed firms in Shenzhen. This finding is consistent with the conventional wisdom that
strengthening property rights protection increases corporate investment. Second, we find that
the effect of the urban land titling program becomes more pronounced as time goes by and as
firms become more aware of the procedure of this policy reform, consistent with the notion of
property rights capital, which is similar to the notion of democratic capital (i.e., the effects of
democracy become more positive over time as a result of learning, building trust in the system,
among others, see Tabellini 2008; Persson and Tabellini 2009). Third, we find that those titling
firms with weaker prior property rights protection, as measured by either expired tenure or
contested land usages at the time of the reform, are associated with higher investment effect. It
thus confirms that land titling is indeed the resource of additional investments. Fourth, and
perhaps most importantly, although the reform applies to all firms with Allocated land in
Shenzhen, we find that only politically connected firms, or those “insiders”—as measured by
either their ownership affiliation with the state or previous state-related experience of their
executives—benefit from the reform. Those “outsider” titling firms did not significantly
increase their investment rates at all.
7
We offer further evidence that, indeed, unconnected firms faced extra obstacles from
exploiting benefits from the titling program. Relative to connected titling firms, unconnected
titling firms encounter more obstacles in the application and titling process—they were more
often dragged into disputes over the land use rights that require arbitration. Moreover, their
applications for new construction were routinely returned for revisions, prolonging the
process.4 And the difference in post-treatment obstacles could not be explained by ex ante
differences in firm characteristics: Connected treatment firms and the rest of the sample firms
do not differ significantly in other firm characteristics such as their land holdings, cost of capital
and the extent of their financial constraints and corporate governance.
Why do politically connected firms react more positively in investment to de jure
formalization of land property rights? Even before the de jure property rights reform, the
government had weaker incentives to expropriate the SOEs, which it partially owned and
controlled; similarly, the government also benefit more from protecting other politically
connected firms. SOEs and other firms with political connections thus tend to face lower
expropriation risks and have stronger de facto property rights. Land titling then formalizes and
strengthens this protection and lengthens the horizon of protection of property rights. Political
connections, after all, are transient and thus can hardly be a full substitution of property rights
(Acemoglu et al. 2005), which provide long-term protection against expropriation. This is
especially true in China where the turnover of politicians is frequent. 5 SOEs, even as
beneficiaries of government favoritism, may be victims of political struggles and rivalry among
local government agencies, or of changes in faction composition in the government over time
(Shih et al. 2012). The government’s holding agents of SOEs, State Assets Administration
Committee (SAAC), may have conflicts of interest with the government’s holding agents of
4 Those are not unusual practices in China, see, e.g., Li, Meng, Wang, and Zhou (2008). Lu, Pan, and Zhang (2015) show that SOEs in China have higher chances of winning lawsuits than non-SOEs. 5 The average tenure of city mayors is around 2-3 years, and besides normal retirement, the key reasons for turnover are either being reassigned to another position or being removed because of corruption.
8
land resource, Ministry of Land and Resources (MLR), with the latter being more eager to take
back the unentitled land for other uses. A land title of SOEs would make the Ministry of Land
and Resources much less likely to meddle. Thus, making de facto property rights de jure for
connected firms may have strong positive effects on investment. In contrast, unconnected firms
do not have essential protection from the government both before and after land titling. While
it is obvious that nonconnected firms do not have the protection of their land rights before the
reform, why do they not enjoy protection after the de jure property rights reform? The first
reason is that non-connected firms are not “one of us” from the government’s point of view—
similar to the Yiddish word “mishpokhe”, indicating widespread demarcation of insiders and
outsiders in most societies (Burt 1998)—their leaders do not have the trust, the access to power,
the right ideology, among others, to be “one of us”, and thus they could be on the wrong end
of government enforcement. The second reason is that there is evidence that the legal system
tends to protect the SOEs (or the connected firms) more. Lu et al. (2015), for instance, provide
evidence that SOEs have better chances of winning lawsuits than non-SOEs in China. Both
factors contribute to the ineffectiveness of the titling program in spurring investment for non-
connected firms.
The implications of our findings are likely not China-specific. The disadvantages of
unconnected firms are ubiquitous, as self-interest-motivated officials and the absence of the
rule of law and accountable media supervision exist in many parts of the world (Fukuyama
2014). Our findings and the pioneering study of Goldstein and Udry (2008), spanning the
opposite spectrums of poor rural areas in Africa to the most dynamic city of Shenzhen in China,
suggest that where the insider-outsider chasm is large, reforms could have unintended
consequences to further strengthen insiders, resulting in greater inequality and inefficiency.
Our study contributes to understanding on how property rights changes affect corporate
investment. China enacted its first property rights law in 2007, which was welcomed by the
stock market (Berkowitz, Lin, and Ma, 2015). However, according to an international index,

9
actual property rights protection has improved very little.6 Consistent with this ranking, we
provide evidence that how laws are enforced plays a more important role than de jure laws.
Our paper is thus related to the literature of the role of de facto property rights protection on
firms’ investment, R&D, and corporate risk management (Johnson, McMillan and Woodruff
2002, Cull and Xu 2005, Lin, Lin and Song 2010, Lin, Lin and Zou 2012). We differ by
focusing on the effect of de jure land property rights and showing how the effects of de jure
property rights depend on a firm’s political connection, and how the property rights effects
accumulate over time, very much like “democracy capital” (Persson and Tabellini 2009).
Our paper also contributes to the microeconomic literature on the effects of property
rights. This literature has focused on the effects of rural land titling on investment and access
to credit in rural areas (Besley 1995; Alston et al. 1996; Banerjee et al. 2002; Jacoby et al. 2002;
Field 2005; Deininger and Jin 2006; Hornbeck 2010; Yi et al. 2014), or on transaction costs of
land (Libecap and Lueck 2011). The much more limited literature on urban land titling focuses
on the effects on household outcomes such as asset value (Jimenez 1984, Friedman et al. 1988;
Lanjouw and Levy 2002), responses in labor supply (Field 2007), changes in beliefs toward
being pro-market and pro-individual-effort (De Tella et al. 2007), and increases in physical and
human investment (Galiani and Schargrodsky 2010). We differ in offering evidence on the
effects on urban firms. Indeed, industrial and commercial lands are of great importance as it
provides greater value added to the land as reflected in the value of industrial/commercial land
compared with agricultural land. The minimum price of industrial land per mu of 0.5 million
RMB (i.e., 1.07 million USD per hectare) is 25-fold of the price of agricultural land of 20,000
RMB (i.e., 42,000 USD per hectare). Moreover, since non-agriculture accounts for an ever-
increasing share of the economy--the average scale of output from the non-agricultural sector
of OECD countries is around 98% of their total GDP—it becomes increasingly important to
6 See the data from http://internationalpropertyrightsindex.org/country?c=CHINA
10
understand the value of property rights in an urban setting, and how its working depends on
the underlying institutional context.
Relatedly, studies on how land property rights interact with local institutional context are
rare. An exception is Goldstein and Udry (2008), which documents how rural land property
rights are subject to influence of power in the local political hierarchy in Ghana. Our paper
complements Goldstein and Udry (2008) in showing the complementarity of de jure property
rights and de facto political power in the context of the urban land market in the most dynamic
Chinese city of Shenzhen. Ours is the first paper to demonstrate the importance of enforcement
in determining the effects of property rights for firm investment in the context of urban land
markets.
Our paper is finally related to the literature of political connections of firms. Political
connections are found to be widespread among firms in the world but especially in developing
countries, and are important resources for those firms.7 For instance, politically-connected
firms have better access to loans (Claessens et al., 2008; Cull et al. 2015; Fan et al., 2008; Li
et al., 2008), favorable access to equity markets (Boubakri et al., 2012; Francis et al., 2009),
more confidence in the legal system in transitional countries (Li et al., 2008), enjoy more
subsidies and tax benefits (Wu et al., 2012b; Lin et al., 2015; Shi et al., 2018), and are more
likely to be bailed out when facing financial stress (Faccio et al., 2006). Moreover, politically
connected firms tend to be less efficient than unconnected firms (Boubakri et al., 2008; Faccio,
2010; Fan et al., 2007; Hsieh and Klenow 2009; Luez and Oberholzer-Gee, 2006), and are less
innovative (Akcigit et al. 2018; Shi et al. 2018). Perhaps due to their advantages in access to
special resources, they tend to grow faster and survive longer (Akcigit et al. 2018; Shi et al.
2018). We add to this literature by offering novel evidence that political connections alter the
enforcement of property rights in favor of connected firms.
7 See Fisman (2001), Johnson and Mitton (2003), and Faccio (2006).

11
The remainder of this paper proceeds as follows. In section 2, we describe the land titling
program and firm-level political connections, and we derive the hypotheses. In Section 3, we
discuss our data and the samples of the treated and the control firms. In Section 4 we present
our findings about the effects of land titling on investment. In section 5, we present and discuss
evidence of how the titling effects differ by ownership and political connections. In Section 6
we conclude.
2. Institutional Background and Hypotheses
We now provide relevant institutional background, including property rights protection in
China, the role played by political connections, and the 2009 Urban Renewal Program in
Shenzhen. We then offer hypotheses on the effects of property rights reform on investment and
the role of political connections in shaping such effects.
2.A Property Rights in China
A prominent feature of the Chinese economy is weak property rights. Large-scale property
expropriations have happened before, such as the land reform movement and the formation of
collective units or “the People’s Commune” in the 1950s, during which privately owned land
was massively expropriated via nationalization (Xu 2011). Since the economic reform began
in 1978, efforts have been, and continue to be, made to overcome the adverse consequence of
weak property protections. Particularly notable is the passage of China’s first property law in
2007 (Berkowitz, Lin and Ma 2015). However, violations of property rights and the
expropriation of private assets remain common in China. According to the International
Property Rights Association, China ranked 55th of the 128 surveyed countries in property
rights protection, and there have been no major improvements in its property rights protection
in recent years. The lack of property rights protection, especially that of land, has led to social
unrest. More than 60% of rural petitions to the central government for administrative and legal

12
assistance were related to property expropriation without fair compensation.8
Frequent violations of property rights are no doubt largely attributable to the ambiguity
of the legal status of the land. For instance, users of Allocated land, a form of land that was
allocated to a user during the central planning regime, neither have formal ownership nor have
the rights to sell or use their land as collateral.9 Table 1 describes the differences in the legal
status between entitled land and Allocated land. Compared to fully titled land, Allocated land
is exposed to a higher risk of expropriation by the government. Indeed, Allocated land is
designed as state-owned land for temporary, free-of-charge usage by firms via an
administrative order, and the government retains the legal right to reclaim the Allocated land
without compensation to the current users.10 Although many local governments, such as the
Shenzhen government, stipulated a 30-year tenure for all Allocated land when the city was
established,11 the land tenure for these lands had either expired or was approaching their
expiration dates by 2009. Cases of local governments expropriating Allocated land are common.
For instance, the Shenzhen government reclaimed 12 plots of Allocated land without
compensation to current land users in one campaign aimed at improving land-use efficiency
during 2012.12 The serious concern before the 2009 Urban Renewal Program in Shenzhen is
that there were no formal procedures to negotiate and to extend the tenure of Allocated land.
In other words, the negotiation costs incurred by users of Allocated land to sell their land to
more efficient users of their land were prohibitive, inducing the pressure for reforming the land
rights system (Demsetz 1967).
8 See http://www.ce.cn/cysc/fdc/fc/201401/22/t20140122_2176546.shtml. 9 The Allocated land is a legacy of the centrally planned economic system that dominated China prior to the 1990s. In the centrally planned economy – in which all market-based land transactions were forbidden – the direct distribution from the government to SOEs was the only method of conveying land to its users. The legal status of Allocated land and corresponding weak property rights protections remained largely unchanged during the progressive land system reforms from the 1990s to the 2000s. 10 See article 47 of the “Interim Regulations of the People's Republic of China Concerning the Assignment and Transfer of the Right to the Use of the State-owned Land in Urban Areas”. 11 See “Provisional Regulations of Land Management for the Shenzhen Special Economic Zone” from the Shenzhen government in 1981. 12 See Huaxia News, March 16, 2013, http://sh.house.sina.com.cn/news/2013-03-16/08552392170.shtml.

13
2.B Political Connections in China
A legacy from the centrally planned economy in China is the importance of the SOE sector,
which comprised the entire economy before the reform beginning in 1978. SOEs remain
powerful and influential even after many rounds of reforms (Huang et al. 2017). An important
distinction between SOEs and non-SOEs is their political connections. Each SOE has an
administrative ranking (xingzhengjibie) to indicate its importance in the political hierarchy.
More prominent or strategically important SOEs are powerful entities in the economic and
political system (McGregor 2010; Chen and Kung 2018).13
Two features associated with SOEs play important roles in maintaining their political
connections. First, there is a “revolving door” for SOE managers and government officials. The
appointment of government officials and SOE executives of the same administrative ranking
are frequently decided by the same committee (i.e., the Organization Department of the
Communist Party). Many government officials are subsequently appointed as executives of
SOEs, and top managers of SOEs are also often appointed as government officials. Second, top
executives of SOEs are frequently representatives of the People’s Congress and regularly
attend the same meetings with government officials of similar administrative rankings. Their
direct communications provide opportunities and advantages in terms of information and
access for SOEs. SOEs’ political connections lead to preferential treatment in many areas,
including in tax treatment, access to finance by state-controlled banks, licenses and government
procurements (see, e.g., Calomiris, Fisman and Wang 2010; Cull et al., 2015).
The expropriation risk of land for SOEs is likely lower than that for none-SOEs, but it
remains significant. SOEs’ Allocated land could be expropriated out of political rivalry and
struggles between government agencies. Indeed, all SOEs are controlled by the State Assets
Administration Committee (SAAC), which pursues the long-run profits of SOEs as its main
target, while all the land is controlled by the Ministry of Land and Resources (MLR), which
13 For example, the CITIC Group is a ministerial-level firm founded by a former vice president of China.
14
focuses more on city landscape planning and profits from auctioning city land. The conflicts
between the two agencies could lead to land expropriation. Moreover, competition and shift in
power among SOEs may also lead to expropriation and re-distribution of Allocated land, as
demonstrated by ample anecdotal evidence.14
2.C The 2009 Shenzhen Urban Renewal Program
Our study exploits a unique policy change in the city of Shenzhen, the youngest metropolis
with the highest GDP per capita in China. Largely agricultural in 1979, the area now known as
Shenzhen was converted into a city as China’s first special economic zone for experimenting
with market-oriented reforms. Its subsequently spectacular growth led to a skyrocketing
increase in the value of properties, which makes the old property rights arrangements
inefficient. Farmers built constructions over their unentitled and collectively-owned land to
accommodate rapidly rising housing need of workers and factories, while existing firms built
new factories over Allocated land. By the end of 2009, of the 918 square kilometers of total
construction area of Shenzhen, 40 percent was illegally occupied by squatters, and another 24
percent was Allocated land, mostly used by SOEs or privatized SOEs.
The urban land titling program aimed to address the urgent need of land resources faced
by Shenzhen firms. Economic expansion led to quintupling of its construction area. However,
the total supply of land in Shenzhen has been limited. Shenzhen’s geographical boundary was
fixed by the central government in 1980, making it hard to expand by absorbing neighboring
farmland, as other Chinese cities do.15
To relieve land scarcity, on November 13, 2009, the Shenzhen government initiated the
Urban Renewal Plan. This program allowed all current users of untitled land who had been
operating on their land for many years to obtain the land title after paying a fee based on the
14 For instance, one listed SOE, the Yingli Corp, was forced to move one of its factories out of Baoding city due to the redistribution of Allocated land. 15 As a result, Shenzhen city has the highest land utilization ratio (i.e., the built-up land as a percentage of the total land) among cities, more than 50%. In comparison, the utilization ratio of Hong Kong SAR, China, is merely 20%.

15
land appraisal value.16 The primary target of the program was rural land property, which
accounted for most of the untitled land. However, Allocated Land was also included in the
titling program. Figure 2 describes the timing of events related to the land titling reform.
Although the reform started by the end of 2009, the land titling policy was not
implementable until the middle of 2012.17 The first draft of the reform did not have the
necessary details about the regulatory authority and qualifications for titling. It also lacked
explicit procedures on dispute resolution when multiple users lay claim to the same piece of
land. The problem was gradually resolved by the policy documents released in the subsequent
two years, especially the two guidelines on implementation released in 2012.
Several measures were taken to ensure that newly entitled land had better property rights
protections. The Shenzhen government established a registration system that ensured the
exclusive rights for its users. The registration bureau created a new file with user rights and a
history of transactions (including leasing) and related collateralization records to ensure
exclusivity. The new 30-year tenure was endorsed by a legal contract between the government
and land users rather than by a fiat order in the case of the Allocated land. The contract made
it more difficult to expropriate a piece of titled land before its tenure expires, and in case of
land appropriation, a large amount of compensation based on the market price of the land was
required. These measures greatly alleviated land users’ concerns regarding expropriation. With
less concern for the expropriation of the land of the firm, the firm with Allocated land should
have more confidence that their investment would have higher returns in the future, and the
firm would therefore increase their investment rate. We thus propose the property rights
16 Some requirements must be met by the land user to obtain the approval of the government. These requirements include the following: first, the land owner must submit a proposal for the renovation of the buildings above ground, which must be approved by the government; and second, approximately 15% of the total area of the land should be given to the government for public use. 17 For instance, a report by Shenzhen government suggests that the documents released in the middle of 2012 greatly accelerate the urban land titling program. More details are in http://zwgk.gz.gov.cn/550590033/5.0/201701/28ab055ec59f42f4aa8274b2bd30d4c7.shtml.

16
hypothesis: the land titling of Allocated land should increase the investment rate of those firms
being affected by the land titling program.
Whether a firm had Allocated land was determined by its history. In the 1980s, most
SOEs in the manufacturing sectors were granted with a piece of Allocated land. However,
Allocated land could have been sold, leased or confiscated in subsequent years of fast
development in this dynamic city, where industry upgrades, privatization and restructuring had
drastically changed its industrial landscape. The current ownership and industry affiliations of
firms therefore had little predictive power for whether a firm was in the land titling program.
Table 2 illustrates that the differences between the firms in the land titling sample and other
firms in their industry and ownership affiliations are statistically insignificant by the end of
2011.
The procedures to apply for land titles were time-consuming and non-trivial. The
applicants had to submit their land development proposals for evaluations and approvals to
several government departments, including the Urban Planning, Land and Resources
Commission (UPLRC), the Construction Commission, the Environmental Agency, and even
the local fire station. A third-party evaluation agency was required to assess land value before
the corresponding transfer fees were paid to the government in exchange for the title. Public
opinions were also solicited to ensure fairness among all stakeholders. The approval of UPLRC
normally required one year, and the entire procedures of approvals could take more than two
years, after which it could be further prolonged by disputes over the original ownership of the
land. The first batch of applicants submitted their proposals in early 2010. There are several
batches of applicants every year.
2.D. Property Rights Enforcement
All qualified firms would likely apply for land titles because the cost of doing so was limited,
and the benefits could be large. Indeed, the market was enthusiastic about this reform, and stock
prices for listed firms reacted positively, as we show later. Presumably stronger confidence

17
about their land property rights, higher collateral value of their land, and rising stock prices in
response to the titling program should encourage titling firms to invest more. However, several
factors might have weakened the linkage between property rights protection and firm
investments.
First, there was policy uncertainty associated with the titling reform. Historically many
policies instituted by the Chinese government had been proven to be unenforceable. For
instance, during an ambitious plan of privatization intended to sell some fractions of the
government’s remaining SOE share to non-state investors in 2001, the Chinese government
cancelled and reversed most transactions of state share sales after negative reactions of the
stock market and criticisms of selling state ownership too cheaply (Calomiris, Fisman and
Wang, 2010). Moreover, major institutional reforms typically need an extended period to
establish confidence among observers. It takes time for citizens and firm managers to establish
trust and confidence that the government and the legal system could be trusted in upholding
the respect for urban land property rights, much as the accumulation of “democracy capital”
requiring time (Tabellini 2008; Persson and Tabellini 2009). These considerations lead us to
propose the property rights capital hypothesis: the effect of the urban land property rights
reform would become more pronounced over time in the first few years.
Second, the prolonged and complicated procedures of title application provided a role for
political connections in the titling program. In many developing countries, (politically)
connected firms enjoy favorable enforcement for regulations (Cai et al. 2011, Hallward-
Driemeier and Pritchett 2015), and spend lower monetary and/or time costs for the same
permits and procedures. The laws could also be applied selectively. Perhaps due to these
reasons, political connections have been prevalent in China, and firms spend a large amount of
resources to establish relationships with government officials (Cai et al. 2011). We thus propose
the connection-rights complementarity hypothesis: politically-connected firms have stronger
property rights effect on investment rates than non-connected firms. For non-connected firms,
18
we are not sure whether the effect would be positive and pronounced or non-existent, and we
shall let the empirical results inform us.
3. Data and Sample Description
We first discuss how the sample is constructed, and how we define the titling and the non-
titling groups based on their land titling status. We then compare titling firms with non-titling
firms in pre-treatment characteristics, and their post-treatment difference in investment rates.
3A. Sample and Titling Firms
We employ two measures to identify whether a listed firm has Allocated land eligible for titling
under the land-titling program in Shenzhen. We first manually checked all self-disclosure
reports released within 15 trading days before and after the announcement of the land titling
program in search of disclosure of landholding status. We presume that since the land titling
program should have a major impact over an affected firm’s investment and future cash flows,
the announcement should have caused a stock market fluctuation that forces the firm to issue
self-disclosure report releasing relevant information.18 We find 17 listed firms disclosed their
land holdings status via special disclosure reports.
Although the regulatory authority did not require mandatory disclosure of firms’
landholding status, most firms provided enough details. Indeed, we largely find key details
about listed firms’ landholding: their location, area, the purpose of use (as an office, factory,
warehouse, and so on), and whether it was shared with other users. For example, Shenzhen Seg
(000058.SZ) disclosed that their firm had two pieces of land:19
18 Chinese financial regulations require that any listed company whose share price experiences more than 20% fluctuation within 3 trading days to issue a disclosure report clarifying the reason for the price fluctuation. See Regulations on Stock Listings on the Shenzhen Stock Exchange. 19 To ensure the accuracy of land titling information, we cross-checked our information with other resources on the land-holding status. For instance, Hua Chuang Securities, one of the top investment banks in China, released a special report on this land-titling program in Shenzhen and listed all potential beneficiaries. Most firms on our list overlap with Hua Chuang Securities’ list of beneficiaries of the land-titling program.

19
“… The first piece is located in Bagua Industry Park. It is a three-floor factory
with a construction area of 1,593 square meters. The tenure is from 1985 to 2015.
Currently it is leased out with an annual rent of 600,000 RMB… The second piece is
controlled by our subsidiary Sege Baohua. It is in Huaqiangbei Industry Park. The total
area is 2,213 square meters with a construction area of 10,509 square meters. The
tenure is from 1982 to 2012. Currently it is leased out with an annual rent of 25 million
RMB…”
The assumption that titling for firms should always be associated with a sharp fluctuation
in their share prices need not be satisfied: the market might lack relevant landholding
information of these firms, or the impact of titling could be viewed as trivial. To ensure that
we fully capture titling firms, we also used two other methods. First, we checked all post-2009
annual reports of listed companies that either were headquartered in Shenzhen or had branches
located in Shenzhen, in search of any mentioning of constructions related to the land titling
program. We further explore the name lists of listed firms whose construction applications on
land titling were approved by the government. We find another 26 firms that mentioned their
participation in the land titling program. The total number of treatment firms is thus 43. As a
comparison, the number of listed firms headquartered in Shenzhen when the titling program
was officially carried out in 2012 was 70.
Our empirical analysis starts with all domestically listed companies except those in the
financial industry in light of their difference in business nature. We obtain financial data,
including stock prices and information from financial statements, from the China Securities
Market and Accounting Research (CSMAR) database, the most comprehensive database of its
type that contains all trading prices and financial statement data for listed firms trading on both
the Shanghai and the Shenzhen exchanges. We also rely on land price in Shenzhen to estimate
the value of titling when Allocated land was converted.20
20 These land prices are found on the website of the “Urban Planning Land and Resources Commission of Shenzhen Municipality”, the government land agency, and “Soufan.com”, the largest online source of land

20
3B. Pre-Treatment Characteristics of Titling and Non-Titling Listed Firms
A concern is the selectivity of the treatment firms--the difference in the performance of those
titling firms relative to the non-titling firms may not be the result of the treatment, but from
pre-treatment differences in firm characteristics and/or momentum. To address this concern,
we compare the various pre-treatment (i.e., one year before the treatment year of 2012)
characteristics between the titling and the non-titling firms in Table 2. The pre-treatment
characteristics include firm size, the leverage ratio, profitability, the cash ratio, share of state
ownership, and industry affiliation. The differences in these observable characteristics are
always statistically insignificant, and the titling firms perform no better and/or worse than other
listed firms in China or in Shenzhen before the treatment. The similarity in pre-treatment
characteristics and performance should mitigate the concern that the titling effect merely
reflects selectivity.
3C. Post-Treatment Difference in Performance
To shed light on the post-treatment differences in the investment rate, Panel A of Figure 3
depicts the investment rate patterns of titling and non-titling firms between 2008 and 2017, a
ten-year period surrounding the event year of 2012. The average investment rate is measured
as the investment level as a percentage of PP&E. Before 2012 the investment rate of the titling
firms is roughly identical to that of the non-titling firms. After 2012, however, the investment
rate of the titling firms began to surpass that of the non-titling firms, especially from 2014 on.
The pattern is consistent with the conjecture that land titling improves firms’ investment. Panel
B of Figure 3 compares the investment rates over time among titling firms by ownership (i.e.,
SOEs vs non-SOEs). The rise in investment rate by SOEs is much more pronounced than that
by non-SOEs.
The real effect of the titling program is also reflected in its impact on stock market prices.
Because land titling induces investment – and these investments should be value-enhancing
information in China.

21
since otherwise firms would not have made them – the value of the stocks of these titling firms
should rise in response to the announcement of the titling program. Figure 4 presents the
Cumulative Abnormal Returns (CARs) of SOE and non-SOE titling firms for the 60 trading
days around the announcement of the policy. The CAR is estimated using the Fama-French
(1992) three-factor model with a beta estimation window of between 250 to 40 trading days
prior to the event. All titling firms, regardless of their ownership, experienced sharp increases
in their stock market values that were as high as 10%. This finding suggests that the market
anticipated that the titling program would benefit all firms with Allocated land, regardless of
their ownership. The effect was also long-lasting: the market value appreciation of titling firms
remained high, even 30 days after the event.
4. Property Rights Changes and Firm Investments
We now provide further evidence of the impact of the titling program on investment rates for
the titling firms. We first show that there is a significant difference between the titling and the
non-titling firms in their before-after difference in the investment rate. We then show that the
investment rate of titling firms started to accelerate after 2015 when firms became more aware
of the details and the results of the implementation of the reform. We provide evidence that
firms facing higher risks of expropriation and uncertainty of user rights before the titling
program are associated with more pronounced reactions after the tilting program.
4A. Baseline Regression Results and Sensitivity Checks
Our basic empirical strategy is difference in difference, that is, allowing the before-after
changes in the investment rate to depend on the treatment status (i.e., land titling for urban
firms in Shenzhen), conditional on the key covariates. The key identifying assumption of this
study is that conditional on firm fixed effects and the controlled covariates, the treatment
status of Titling Firm is exogenous. We consider endogeneity of the treatment status soon.
To implement the empirical strategy, we follow Bertrand et al. (2004) by collapsing the
year dimension into two periods to overcome the serial correlation in the error terms and to

22
avoid overstating estimation precision. The first period covers the years before 2012 (i.e., 2008-
2012), and the other covers the other years (i.e., 2013-2017). To explore the impact of titling
on the investment rate, we estimate the following baseline cross-sectional regression:
𝛥𝐼𝑛𝑣𝑒𝑠𝑡𝑚𝑒𝑛𝑡 𝛼 𝛽 𝑇𝑖𝑡𝑙𝑖𝑛𝑔 𝐹𝑖𝑟𝑚 𝛾𝑋 𝜀 (1)
The dependent variable is the difference in the average investment rate (i.e., capital
expenditure divided by PP&E) before and after the titling program. Titling Firm is 1 for firms
that obtained land titles in the Urban Renewal Program in Shenzhen, and 0 for the other firms.
The control variables include the pre-treatment firm characteristics that may be related to
investment, including ROA and Tobin’s Q by the end of 2012. As firm-level investment rates
could be affected by technology and average capital intensity, we control for the industry fixed
effect. We also control for the Stock Exchange fixed effect (i.e., being affiliated with Shenzhen
or Shanghai Stock Exchange) to exclude the impact from Exchange-specific changes in
regulations. The parameter of interest is 𝛽.
Here, the before-after change in the outcome net of the effects of the vector of X is
attributed to the treatment. The identifying assumption is that conditional on firm fixed effects
(implicit in taking the first difference for the outcome) and on the controlled covariates, the
treatment status of Titling Firm is exogenous. Our earlier evidence that the treatment status is
not correlated with pre-treatment characteristics is consistent with this presumption. However,
we cannot fully rule out the potential of endogeneity of Titling Firm conditional on the firm
fixed effect and the covariates X, and we shall adopt the instrumental variable strategy later to
examine the robustness of our key results.
The results without (in column (1)) and with the industry and the Exchange fixed effects
(column (2)) are in Table 3. Based on column (1), the titling firms, compared to other firms,
are associated with a significant increase in the investment rate by 35 percentage point for the
five years after titling. This is a considerable increase as it is roughly 0.8 standard deviation of

23
the investment rate, which was 43 percent. Adding the industry and the exchange FE in column
(2) does not change the results much: the effect changes from 0.35 to 0.30.
A concern is that our dependent variable, the before-after-treatment difference in the
investment rate, is sensitive to the choice of the benchmark of the pre-treatment investment
rate (against which the additional investment rate is calculated). Indeed, the firms’ investment
from the period between 2008 and 2012 might have been affected by many factors. For instance,
firms’ investment rates before 2012 could be affected by other regulatory changes, such as the
share-splitting reform,21 the legal reforms such as the passage of property rights in 2007, or
the large-scale quantitative easing by the end of 2009. These reforms could have different
impacts over the treatment and the control firms, especially when a long time window from
2008 to 2012 is considered.
To mitigate this concern, we experiment with multiple time windows for the pre-
treatment period. In column (3) of Table 3, we apply a median time window of 2010-2012 to
measure the pre-treatment investment rate. In column (4), we adopt a short time window of the
single year of 2012. The results from the median and the short time windows are similar to that
from the default of the five-year window. Our baseline regression is thus not subject to the
alternative interpretation that the increases in the investment rate are due to other policy
changes during the pre-treatment years.
A further concern with using the years 2010-2012 as the benchmark period is that the
investment in 2010 and 2012 may partially reflect the reform effect due to anticipation. Indeed,
if firms are expecting better investment opportunities later, they would hold their investment
temporarily right after the announcement of the reform in 2009, causing a higher jump in 2012
once the reform is implementable. To mitigate this concern, we delete firm-year observations
during the period of 2010-2012 (i.e., the years of potential anticipation) and use those in 2008-
21 The split-share reform began in April 2005 and lasted for more than 10 years (Li et al. 2011).

24
2009 as the pre-treatment period. The result is in Column (5) of Table 3. Our main result on
titling firms is still similar, with the coefficient reduced slightly to 0.26.
4B. Instrumental Variable Estimation
The DID estimation strategy assumes conditional exogeneity of Titling Firm, an assumption
that could be invalid. The treatment group may differ systematically from the control group in
unobserved dimensions, which may explain the different reactions in investments. To
overcome this concern, we conduct the instrumental variable regression.
The instrument we adopt is whether the firm was initially established as an SOE being
affiliated with the Shenzhen government. Firms originated as SOEs being affiliated with the
Shenzhen government were much more likely to hold Allocated land before the titling reform.
On the other hand, the firms affiliated to the Shenzhen government may not differ much when
compared with SOEs affiliated to other local government (such as non-Shenzhen city
government, or the provincial government) or the central government. It is not plausible that
the affiliation to Shenzhen government in the 1980s would affect the investment behavior of
firms in 2010s in channels other than holding Allocated lands, especially after we have
controlled for more updated pre-treatment characteristics such as profitability, Tobin’s Q, and
industry affiliations. As our instrumental variable, we use two measures related to the affiliation
of the firm to the Shenzhen government. The first is whether the Shenzhen government is the
controlling shareholder of the firm. The second is the share of ownership by the Shenzhen
government in the total share outstanding of the firm.
The instrumental variable estimation yields reassuring results. First, both of our
instruments are strong. The F-statistics for the excluded instrument is 91.3 and 110.4, far
surpassing the rule-of-thumb threshold value for weak instruments (i.e., around 10). Consistent
with our priors, both instrumental variables are positively correlated with the holding status of
allocated land. For instance, listed firms initially owned by the Shenzhen government are 69
percentage points more likely to be Titling Firm. Second, the second stage regression results

25
in columns (3) and (4) yield estimates of the effect of Titling Firm around 0.32, almost identical
to the previous estimates based on conditional exogeneity. The qualitative results based on the
DID are thus robust. Since the DID and the IV results are similar, and the DID estimates have
significant advantage than those based on IV estimation when the treatment is interacted with
other variables by reducing the influence of a few outliers (Young 2018), in the rest of the
paper we adopt the DID as the basic specification.
4C. Further Sensitivity Checks
Another concern is that the choice of the control group may be inappropriate. Indeed, all our
treatment firms are in Shenzhen, while the vast majority of our control firms are non-Shenzhen
firms. Shenzhen, as the Special Economic Zones of China, has been granted with favorable
policies that could not be enjoyed by firms elsewhere. The control firms could therefore differ
from the treatment firms (in Shenzhen) in aspects we have not controlled for.
We address this concern in four ways. First, we use the sample of only firms in Shenzhen
city to ensure that we only use firms in the same city and facing similar policy shocks over
time. Second, we use the sample of the firms from the top four metropolitan cities, Beijing,
Shanghai, Guangzhou, and Shenzhen. Third, we still use the whole sample but include the city
dummy variables, which would capture the fixed effect of cities. Finally, we employ propensity
score matching based on the size, age, leverage and ownership to ensure that the treatment and
the control firms are similar. The results are presented in columns (1) - (4) in Table 5. The four
methods yield remarkably similar conclusion to what our baseline results imply. The
coefficient of Titling Firms ranges from 0.41 (when using Shenzhen firms only) to around 0.30
(when using four megacity firms only, and with the full sample using propensity score
matching). These robustness checks suggest that the difference between Shenzhen and other
cities is not the driver of our result. The robust nature of the key parameter is again suggestive
of the relatively exogenous nature of the land titling program.

26
A further concern is whether the changes in investment rates merely stem from
organizational changes such as mergers and acquisitions. The investment rate could increase if
the titling firms take over a firm with a high investment rate. To eliminate this concern, we
control for the relative size of takeover, as measured by the size of firms that were acquired
divided by the size of the list firms.22 A firm’s size is measured by its total book asset. The
results, in Column (5) in Table 5, show that the coefficient of Titling Firm is largely unchanged,
and our key conclusion is not driven by firm takeovers.
To ensure that our results are not driven by our cross-sectional specification, which in
essence is DID since we allow the before-after change to depend on the treatment (and other
covariates), we also experiment with panel data regressions based on annual observations.
Although Bertrand et al. (2004) argue convincingly that the time-series autocorrelation may
generate overstatement of precision in the panel data regression, it may still be useful to check
whether the panel-based results yield similar estimates as those from the baseline regressions.
The panel specification allows for better control of time-varying covariates that may affect
investment rates. The panel fixed-effect specification is as follows:
𝐼𝑛𝑣𝑒𝑠𝑡𝑚𝑒𝑛𝑡 𝛼 𝜃 𝛽 𝑃𝑜𝑠𝑡 𝛽 𝑇𝑖𝑡𝑙𝑖𝑛𝑔 𝐹𝑖𝑟𝑚 ∗ 𝑃𝑜𝑠𝑡 𝛾𝑋 𝜀 (2)
The dependent variable is the time-varying annual investment rate. Titling Firm is a
dummy variable with a value of one for firms that obtained land titles under the Urban Renewal
Program and 0 for the other firms. Post is a dummy variable with a value of one for
observations after 2012 and 0 otherwise. Two time-varying factors related to firms’
investments are controlled: firms’ Tobin’s Q and annual cash flows. We also control for firm
fixed effects. The results are in Column (6) of Table 5. The coefficient of the interaction term
of Titling Firm and Post suggest that participation in the titling program is associated with an
increase in the investment rate by 28 percentage points after 2012 compared with non-titling
firms, a magnitude similar to what we found earlier.
22 The relative size of the takeover is 0 if the listed firm did not engage in any takeover in the sample period between 2008 and 2017.

27
One may worry that the estimate of the titling effect may reflect pre-existing trends that
differ among the treatment and the control groups (Heckman and Hotz 1989). This is possible
considering that the Chinese government launched a four-trillion fiscal stimulus, which may
result in divergent reactions among firms of different types. To eliminate this concern, we
implemented a pre-trend test by interacting Titling Firm with all pre- and post-treatment year
dummies. The result in Column (7) of Table 5 suggest that titling firms did not have distinct
pre-trend before the titling. Starting from the year 2013, the first year after the implementation
of the land titling program, the titling firms begin to exhibit higher investment rates over time,
with significant coefficients of 29 and 48 percentage points in the years 2016 and 2017.
The dynamic pattern observed in this pre-trend test induces us to examine the property
rights capital hypothesis. We revert to the baseline cross-sectional analysis, but we allow the
titling effects to differ over time. In particular, we partition our post-scheme sample period into
three sub-periods: 2013-2014, 2015-2016, and 2017. The results in Table 6 imply a trend of
increasing investment rate overtime: the investment rate rose by 13 percentage points
(significant at the 10 percent level) in the first two years, doubles to 26 percentage points after
two years, and this trend continues in the fifth year (i.e., 2017) with a coefficient of 30.4
percentage points. This pattern is consistent with the property rights capital hypothesis.
4D. Heterogeneity in the Original Property Rights Protection
To further validate that the titling effect reflects changes in underlying property rights, we take
advantage of variations in expropriation risks at the time of the reform. Among Shenzhen firms
in the titling program, two types faced particularly severe threat of land expropriation: those
with expired land tenure for their Allocated land at the time of the reform (i.e., around 2012),
and those whose previous rights to use the land were contested. For these vulnerable firms, the
land titling program should imply a greater change in the protection of land property rights,
and the effects on investment should be particularly large.

28
We obtain the indicators of expropriation vulnerability as follows. First, we construct a
dummy variable indicating whether a treatment firm’s previous land tenure had expired at the
time of the reform.23 We obtain the maturity of the tenures of the lands from the special report
or annual report of the listed companies. Second, we construct a dummy variable indicating
whether the usage rights of the land at the time of the reform were contested (i.e., whether the
firm illegally sold or rented their Allocated land to other firms). 24 Those illegitimate
transactions could result in multiple stakeholders with claim over the land and large
compensations for current users of the land to vacate. We obtained relevant information from
the annual reports and the self-disclosure reports of the titling firms.
In columns (1) and (2) of Table 7, we include the dummy variable indicating tenure
expiration interacting with Titling Firm.25 The results render support to the property right
hypothesis: according to the preferred column (2), titling firms whose land tenure was not
expired do not have significant titling effects, but titling firms with expired land tenure had a
titling effect on the investment rate of 42 percentage points. In columns (3) and (4) of Table 7,
we include the interaction term of Titling Firm and the dummy of contested land rights.
Relatively to other program participants, the titling effect on investment rates for titling firms
facing contested land rights around the time of the reform almost sextuples (i.e., from 0.08 to
0.47), again supporting the property rights hypothesis.
5. Political Connections and the Differential Impact of the Reform
We now allow distinct effects of titling for firms with various degree of political connections.
5A. Titling Effects by Ownership
23 In 1981, the Shenzhen government allowed tenures of 20 or 30 years to Allocated land. Many of those pieces of land expired or approached expiration in 2012. 24 The illegal way to sell allocated land was to sign a rent contract that had a length equal to the tenure length of the land. 25 We do not include the dummy indicating tenure expiration directly because this variable is available only for titled firms.

29
We now explore whether the impact of land titling depends on the linkage to the government
based on firm ownership. SOEs have a natural connection to the government, while non-SOEs
owned by private individuals and other non-state entities likely do not have such connections.26
We estimate the land titling effects either separately for SOEs and non-SOEs (columns (1) and
(2) of Table 8) or applying the interaction of the SOE dummy and Titling Firm in the pooled
sample (Column (3)). Both methods yield similar results.
The land titling effect is statistically significant and pronounced only for SOEs, but not
for non-SOEs. The magnitude of the titling effect is several times larger for SOEs than non-
SOEs, and the effect is positive and significant only for SOEs. The results suggest that the
benefits of urban land titling apply only to politically connected SOEs but not to non-SOEs,
which are still vulnerable to government expropriation (of land) even after land titling. The
results support the connection-rights complementarity hypothesis.
5B. Comparing SOEs and non-SOEs
The more pronounced effects of titling on SOEs relative to non-SOEs could reflect SOEs’
advantages over non-SOEs in many aspects rather than favorable property-rights enforcement.
We could exclude certain channels by showing that titling SOEs and titling non-SOEs do not
differ significantly in the characteristics related to those channels. Toward this end, we compare
the size of the land, the cost of the capital of equity, the extent of the financial constraints, and
the quality of corporate governance. For all these aspects, as shown below, the differences
between the titling SOEs and their non-SOE counterparts are not statistically significant.
Since a firm’s land size could affect profitability and investment, we first investigate
whether the scale of the land held by titling SOEs and titling non-SOEs differ. We first look at
the total area of the land, available from the Urban Planning, Land and Resource Commission
of Shenzhen. The first row of Table 9 shows that the size of the land held by titling SOEs is
26 Privatized non-SOEs could have natural connections with the government. Our test of titling effects by board composition likely would capture this possibility of political connections by non-SOEs to the government.

30
almost identical to that held by titling non-SOEs, suggesting that land size is not a driving
factor in the extra investment associated with titling SOEs. Second, we compare the absolute
and relative value of the land, rather the size of the land. The relative value of the land is
calculated by having the value of land normalized by the market value of the equity of the
titling firm. We find that both the absolute and the relative values of lands held by titling SOEs
and titling non-SOEs are almost identical. Third, the benefit of the land could be affected by
location because lands located near the city center are more likely to be associated with higher
value once developed. We have examined the geographic distribution of all lands of titling
firms, and found that lands from titling SOEs and non-SOEs are evenly distributed across the
districts of Shenzhen, suggesting that the difference in the potential of the lands held by titling
SOEs and non-SOEs is not a key factor behind investment rate difference between these two
types of firms.
The extra investment made by titling SOEs could be due to their lower costs of capital,
so they are likely to invest more even with similar returns for their investment projects.
Therefore, we look at the cost of equity of all titling firms, SOEs or non-SOEs. We obtained
relevant information and calculated the average annual stock market return from 2008 to 2012
as the historical cost of equity. We also calculate the changes in the cost of equity for a period
of 2013-2017 compared to the benchmark period of 2008-2012. Another measure of the cost
of capital, the distribution of dividend, also does not show any difference between titling SOEs
and titling non-SOE firms. The results thus do not support the hypothesis that the titling SOEs
had a lower cost of capital than titling non-SOEs.
Another concern is that SOEs could be less financially constrained than non-SOEs (Cull
et al. 2015), and this could explain their differences in the investment rate. But this aspect is
unlikely to explain our results. In the last column of Table 8 we have already controlled for the
SOE dummy, which captures the average difference in access to finance. Moreover, land titling
should relieve financial constraints to a greater extent for non-SOEs due to the possibility of

31
collateralizing land after land titling (Besley and Ghatak 2010). If land titling relieves financial
constraints to titling non-SOEs more than titling SOEs, the prediction would be a more positive
effect of titling on titling non-SOEs than on titling SOEs. This prediction is the opposite to our
findings. We have also tried to shed light on this concern empirically. We use two measures of
financial constraint, the size-age measure (Hadlock and Pierce, 2010), and the external-finance
reliance measure (Rajan and Zingales, 1998). 27 On both measures, we do not find any
differences between titling SOEs and titling non-SOEs (see Panel C). Recall that Allocated
land originated from initial state ownership but not necessarily current state ownership, our
finding here that titling SOEs and titling non-SOEs do not differ in financial constraints are
consistent with Harrison et al. (2019), which suggests that former SOEs that are private now -
- and our titling non-SOEs would fit this category -- tend to still enjoy benefits of access to
finance.
We also examine whether the quality of corporate governance could drive our result.
SOEs with the state as the largest shareholders are associated with severe corporate governance
problems (Megginson and Netter 2001). However, the corporate government of those listed
non-SOEs should resemble that of those listed SOEs because non-SOEs in our sample were
largely SOEs a decade ago but privatized later. To check empirically, we use three measures
of corporate governance, the scale of the incentive package, the chairman-CEO duality, and
the number of the independent board member.28 For all three measures, there are no significant
differences between the SOEs and non-SOEs.
5C. Impact of Political Connections
27As a robustness check, we also explore other measures of financial constraints, notably, the dividend measure (Fazzari, Hubbard and Petersen, 1988) and cash flow-investment sensitivity measures (Cummins, Hasset and Oliner, 2006). We do not find any significant difference between the SOEs and non-SOEs using those measures. 28 The scale of the incentive package is the ratio of the shares granted and controlled by the top management to the total share outstanding. The top management includes CEO, CFO, CTO and other top executives in sales and marketing, administration or human capital departments.

32
Since the titling premium in investment rate of SOEs relative to non-SOEs is unlikely to be
explained by the usual suspects we have just discussed, what other factors could be the source?
Here we consider political connections with the government. We use two measures to
characterize the political connections of titling firms. The first is the number of board members
with working experience in the city or in higher-level government leadership roles. Having
retired government officials on the board is a strong indicator of a firm’s political connections
because all the political ties of these officials would be available to the firm (Fan et al. 2007).
Note that this measure may not be strongly correlated with the ownership status of firms:
officials do work for a private or privatized firm upon retirement from their government
positions. Our second measure of political connection is the ratio of communist party members
as a percentage of the total number of employees (Fan et al. 2007). The advantage of this
measure lies in its relative stability because employee turnovers tend to be less frequent than
turnovers of board members.
The results from the OLS regression reported in Column (1) of Table 10 suggest that the
titling effects are much more pronounced for connected (vs non-connected) firms. Titling firms
with retired bureaucrats on their boards are associated with an investment rate that is 50
percentage points higher compared to those without such connections. This finding indicates
that the difference between SOE and non-SOEs is mainly driven by their connection with the
government. This result is not surprising because the government, even after implementing the
titling program, still retains significant power over the firms, who must rely on the government
to approve their applications and enforce the property law. In the regressions in columns (3),
we adopt the alternative measure of political connections based on employee party membership.
The critical importance of political connections remains true.
How do political connections affect the titling effect within SOEs and non-SOEs?
Political connections might work differently on property rights protection for SOEs and non-
SOEs. Columns (2) and (4) add additional terms: Titling SOE, titling SOE * political

33
connection; titling non-SOE, titling non-SOE * political connection. Here “political connection”
is either bureaucrats on board or the party member ratio. The results are consistent. For SOEs,
the titling effect does not hinge on further political connections—that is, state ownership is
enough. For non-SOEs, the titling effect highly hinges on the existence of political connections.
What are the channels through which political connections help connected firms to take
advantage of the titling program while effectively prevent the non-connected ones from doing
so? We search for evidence on the roots of the lack of responses of non-SOEs directly from the
annual reports of those titling firms. We checked their annual reports for information on their
progress in the land titling program. When non-SOEs explain the slow progress of their
application for titles, they do not mention financial constraints and investment opportunities.
In contrast, they frequently cite dealing with legal and administrative barriers. Firms usually
state that the slow progress of their application for land title is due either to their disputes with
the government (or the court) or to the disputes with other firms. This is consistent with
international evidence that government discretion in enforcing rules is substantial, and that the
government’s treatments of regulatory rules differ greatly within countries among firms
(Hallward-Driemeier and Pritchett 2015).
We therefore explain whether the titling firm has a dispute with the government or other
firms over its land. We estimate the linear probability model with the dependent variable being
the dummy variable of the firm having a dispute with government or other firms over the land,
using the sample of titling firms. The result is in Table 11. In Column (1), the probability of
having disputes with either the government or other firms are presented. The negative and large
coefficient of the SOE dummy suggests that those SOEs are much (i.e., 37 percent) less likely
to have a dispute with either government or other firms, rendering them a significant advantage
to implement the titling program quickly. The results remain robust when we consider only the
disputes with the government (column (2)) or the disputes with other firms (column (3)). Thus,
34
the connection with the government helps mitigate disputes with both the government and other
firms.
5D. Stock Market Reaction
We have established that the titling firms—and only those state-owned and politically
connected ones—have higher investment rates compared to non-titling firms. We now examine
whether the stock market anticipated this pattern when the program was announced.
We construct two measures on stock market reactions to the titling program. The first is
based on the short-term market reaction around the announcement date of the titling program.
In particular, we use the abnormal returns of a two-day window (i.e., the 25th and 26th of
November 2009), which is calculated using the daily stock market return net of the predicted
stock market return using a Fama-French three-factor model with an estimation window of [-
150, -10].
We regress the two-day stock market reaction on the titling program and measures of
state ownership and political connections. The results are in columns (1) - (4) of Table 12. The
positive and significant coefficient for the titling program indicates that the information about
titling is instantaneously incorporated into prices after the announcement, and that the market
is efficient in differentiating firms with and without Allocated land. However, we do not find
significant difference in stock market reactions between SOEs and non-SOE titling firms, or
between politically connected and non-connected titling firms.
The market may gradually update its information and change its attitude over time. We
thus construct the second measure of the stock market reaction, the changes of Tobin’s Q, to
capture the extent that the market price reflects information on the titling program. The
dependent variable now is the average Tobin’s Q from 2013 to 2017, net of the average Tobin’s
Q from 2010 to 2012. The results are in columns (5)-(8) of Table 12. Now long-term stock
market reactions reflect better how the titling effects hinge on ownership: Tobin’s Q is
significantly higher in titling SOEs relatively to titling non-SOEs; similarly, Tobin’s Q is

35
significantly higher in titling firms with political connections (as measured by bureaucrats on
board or party member ratio) relatively to titling firms without political connections.
6. Conclusions
While studies on rural land property rights abound, the impact of urban land property rights on
firm behavior is rarely studied. In this paper we use a policy experiment of urban land titling
in Shenzhen, China’s most dynamic city, to examine the impact of property rights protection
on corporate investments.29 Consistent with the fundamental economic insight that secure
property rights promote investment, we find that firms that obtain land titles do have much
higher investment rates than firms without land titles over the five years after the urban titling
policy. Using a plausible instrument for titling, and in light of the similarity of the IV and the
DID estimates, we believe the titling effect is causal. We provide further evidence to verify that
the positive effect of land titling on investment reflects property rights strengthening: those
firms facing higher expropriation risks (i.e., contested land rights and expired land lease) have
more pronounced titling effects.
Equally importantly, we provide evidence that the investment effect of land titling depends
critically on political connections and government enforcement. We find that state-owned
enterprises (SOEs) and those listed firms with stronger political connections experience
substantial increases in their investment, while non-SOEs and non-politically-connected firms
have almost no increase in investment at all. Further explorations suggest that political
connections are likely the key reasons behind SOEs’ positive and non-SOEs lack of reactions
in investment. Among non-state firms, those connected ones do increase their investment after
titling, but those non-connected ones do not. Overall, in light of evidence of resource
misallocation in favor of the state sector in China and the relative inefficiency of the state sector
around the world (Megginson and Netter 2001; Brandt, Tombe and Zhu 2013; Cull et al. 2015),
29 A caveat of this research is that the treatment sample is relatively small, though in terms of the share of listed firms in Shenzhen, it is reasonably high.

36
our findings suggest that, the discriminatory enforcement of property rights by the government
in favor of connected firms will adversely affect the development of the private sector and the
economy as a whole.30
References
Acemoglu, D., Johnson, S., Robinson, J., 2001. The colonial origins of comparative development:
an empirical investigation. American Economic Review 91(5), 1369-1401.
Acemoglu, D., Johnson, S., Robinson, J. A. 2005. “Institutions as a Fundamental Cause of Long-
Run Growth,” in Handbook of Economic Growth (pp. 385–472). Amsterdam: North
Holland.
Acemoglu, Daron, Davide Ticchi, and Andrea Vindigni, 2011, Emergence and persistence of
inefficient states, Journal of the European Economic Association 9, 177-208.
Acemoglu, D., D. Cantoni, S. Johnson, JA Robinson. 2011. “The Consequences of Radical
Reform: The French Revolution.” American Economic Review 101(7), 3286-3307.
Acemoglu, Daron, Simon Johnson, Amir Kermani, James Kwak, and Todd Mitton, 2016, The value
of connections in turbulent times: Evidence from the United States. Journal of Financial
Economics 121, 368-391.
Akcigit, Ufuk, Salome Baslandze, Francesca Lotti. 2018. “Connecting to Power: Political
Connections, Innovations, and Firm Dynamics.” NBER Working Paper 25136.
Alston, Lee, Gary D. Libecap, Robert Schneider. 1996. “The Determinants and Impact of Property
Rights.” Journal of Law, Economics, and Organization 12(1), 25-61.
Ang, James, Yingmei Cheng, and Chaopeng Wu, 2015, Trust, investment, and business contracting,
Journal of Financial and Quantitative Analysis 50, 569-595.
Bailey, Warren, Wei Huang, and Zhishu Yang, 2011, Bank loans with Chinese characteristics: Some
evidence on inside debt in a state-controlled banking system, Journal of Financial and
Quantitative Analysis 46, 1795-1830.
Banerjee, Abhijit, Paul Gertler, and MaitreeshGhatak, 2002, Empowerment and efficiency:
Tenancy reform in West Bengal, Journal of Political Economy 110, 239-280.
Berkman, H., Cole, R.A., Fu, L.J., 2010. Political connections and minority-shareholder protection:
evidence from securities-market regulation in China. J. Financ. Quant. Anal. 45 (6), 1391–
1417.
30 There is an intriguing possibility that the positive investment response of connected firms may reflect coordinated response of local governments and connected firms—for instance, the local government may know that these connected firms would carry out their side of the bargain when the local government needs something done. This is an area that needs further research in the future.

37
Berkowitz, Daniel, Chen Lin, and Yue Ma, 2015, Do property rights matter? Evidence from a
property law enactment, Journal of Financial Economics 116, 583-593.
Bertrand, Marianne, Esther Duflo, and Sendhil Mullainathan, 2004, How much should we trust
differences-in-differences estimates? Quarterly journal of economics 119, 249-275.
Besley, Timothy. 1995. "Property rights and investment incentives: Theory and evidence from
Ghana." Journal of Political Economy 103(5), 903-937.
Besley, T. J., Ghatak, M. 2010. “Property Rights and Economic Development.” In Handbook of
Development Economics vol. 5, p. 4525-95.
Bliss, M.A., Gul, F.A., 2012. Political connection and cost of debt: some Malaysian evidence. J.
Bank. Finance 36 (5), 1520–1527.
Boubakri, N., Cossett, J.C., Saffar, W., 2008. Political connection of newly privatized firms. J. Corp.
Finance 14 (5), 654–673.
Boubakri, N., Guedhami, O., Mishra, D., Saffar, W., 2012. Political connections and the cost of
equity capital. J. Corp. Finance 18 (3), 541–549.
Brandt, L., T. Tombe, X. Zhu. 2013. Factor market distortions across time, space and sectors in
China. Review of Econ. Dynamics 16(1), 39-58.
Burt, Ronald. 1998. “The Gender of Social Capital.” Rationality and Society 10(1), 5-46.
Cai, Hongbin, Hanming Fang, Lixin Colin Xu. 2011. “Eat, Drink, Firms, Government: An
Investigation of Corruption from Entertainment and Travel Costs of Chinese Firms.” Journal
of Law and Economics 54, 55-78
Calomiris, Charles W., Raymond Fisman, and Yongxiang Wang, 2010, Profiting from government
stakes in a command economy: Evidence from Chinese asset sales, Journal of Financial
Economics 96, 399-412.
Caro, Robert. The Power Broker: Robert Moses and the Fall of New York. New York: Knopf.
Caves, Douglas, Christensen, Laurits, Diewert, Erwin, 1982. Output, Input, and Productivity Using
Superlative Index Numbers. Economic Journal 92, 73–96.
Chan, K.S., Dang, V.Q.T., Yan, I.K.M., 2012. Chinese firms' political connection, ownership, and
financing constraints. Econ. Lett. 115 (2), 164–167.
Chen, Ting, James KS Kung. 2018. “Busting the `Princelings’: The campaign against corruption in
China’s primary land market.” Quarterly Journal of Economics 133, 185-226.
Chen Charles, Li Zengquan, Su Xijia, and Sun Zheng, 2011. Rent-seeking incentives, corporate
political connections, and the control structure of private firms: Chinese evidence. J. Corp.
Fin. 17 (2), 229–243.
Claessens, S., Feijen, E., Laeven, L., 2008. Political connections and preferential access to finance:
the role of campaign contribution. J. Financ. Econ. 88 (3), 554–580.
Cull, Robert, and Lixin Colin Xu, 2005, Institutions, ownership, and finance: the determinants of
profit reinvestment among Chinese firms, Journal of Financial Economics 77, 117–146.
Cull, Robert, Wei Li, Bo Sun, Lixin Colin Xu. 2015. “Banks, the Government, and Financial
Constraint: Evidence from a Large Sample of Chinese Firms,” Journal of Corporate Finance

38
32(C),271-294.
Cummins, Jason, Kevin Hassett, and Stephen Oliner, 2006, Investment behavior, observable
expectations, and internal funds, American Economic Review 96, 796-810.
Deininger, K., and S. Jin. 2006. “Tenure security and land-related investment: Evidence from
Ethiopia.” European Economic Review 50(5), 1245-1277.
Demsetz, Harold. 1967. “Toward a Theory of Property Rights.” American Economic Review 57(2),
347-359.
Di Tella, Rafael, Sebastian Galiant, and Ernesto Schargrodsky. 2007. "The formation of beliefs:
evidence from the allocation of land titles to squatters." Quarterly Journal of
Economics 122(1), 209-241.
Du, J., Girma, S., 2010. Red capitalists: political connections and firm performance in China.
Kyklos 63 (4), 530–545.
Faccio, Mara, 2006. Politically connected firms. Am. Econ. Rev. 96 (1), 369–386.
Faccio, Mara, 2010. Differences between politically connected and non-connected firms: a cross
country analysis. Financ. Manag. 39 (3), 905–927.
Faccio, Mara, McConnell, John J., Masulis, Ronald W., 2006. Political connections and corporate
bailouts. J. Finance 61 (6), 2597–2635.
Fan, Joseph P.H., T.J. Wong, Tianyu Zhang, 2007, Politically connected CEOs, corporate
governance, and Post-IPO performance of China's newly partially privatized firms, Journal of
Financial Economics 84, 330–357.
Fang, Lily, Josh Lerner, and Chaopeng Wu, 2016, Intellectual property rights protection, ownership,
and innovation: Evidence from China, Working paper.
Fazzari, Steven, Glenn Hubbard, Bruce Petersen, Alan S. Blinder, and James M. Poterba, 1988,
Financing constraints and corporate investment, Brookings Papers on Economic Activity 1988,
141-206.
Field, Erica. 2007. "Entitled to work: Urban property rights and labor supply in Peru." The
Quarterly Journal of Economics 122(4), 1561-1602.
Fisman, Raymond, 2001. Estimating the value of political connections. Am. Econ. Rev. 91 (4),
1095–1102.
Francis, B.B., Hasan, I., Sun, X., 2009. Political connections and the process of going public:
evidence from China. J. Int. Money Financ. 28 (4), 696–719.
Friedman, J., E. Jimenez, S. Mayo. 1988. “The demand for tenure security in developing countries.”
Journal of Development Economics 29(2), 185-98.
Fukuyama, F. 2014. Political Order and Political Decay. New York: Farrar, Straus and Giroux.
Goldman, E., Rocholl, J., So, J., 2009. Do politically connected boards affect firm value? Rev.
Financ. Stud. 22 (6), 2331–2360.
Galiani, Sebastian, and Ernesto Schargrodsky. 2010. "Property rights for the poor: Effects of land
titling." Journal of Public Economics 94 (9-10), 700-729.

39
Goldstein, Markus, and Christopher Udry. "The profits of power: Land rights and agricultural
investment in Ghana." Journal of political Economy 116(6), 981-1022.
Hadlock, Charles, and Joshua Pierce, 2010, New Evidence on Measuring Financial Constraints:
Moving Beyond the KZ Index, Review of Financial Studies 23, 1909-1940.
Hallward-Driemeier, Mary, Lant Pritchett. 2015. “How Business is Done in the Developing World:
Deals versus Rules.” J. of Econ. Perspectives 29(3), 121-140.
Harrison, Ann, Marshall Meyer, Peichun Wang, Linda Zhao, Minyuan Zhao. 2019. “Can a tiger
change its stripes? Reform of Chinese state-owned enterprises in the penumbra of the state.”
NBER Working Paper 25475.
Hayek, Friedrich. 1960. the constitution of liberty. Chicago: Chicago University Press.
Heckman, James J., V. Joseph Hotz. 1989. “Choosing among Alternative Nonexperimental
Methods for Estimating the Impact of Social Programs: The Case of Manpower Training,”
Journal of the American Statistical Association, 84 (408), 862-874.
Hornbeck, Richard. "Barbed wire: Property rights and agricultural development." The Quarterly
Journal of Economics 125 (2), 767-810.
Hsieh, Chang-Tai, and Peter Klenow, 2009, Misallocation and Manufacturing TFP in China and
India, Quarterly Journal of Economics 124, 1403-1448.
Huang, Zhangkai, Lixing Li, Guangrong Ma, L. Colin Xu. 2017. “Hayek, Local Information, and
Commanding Heights: Decentralizing State-Owned Enterprises.” American Economic Review
107(8), 2455-2478.
Jacoby, Hanan G., Guo Li, and Scott Rozelle, 2002, Hazards of Expropriation: Tenure Insecurity
and Investment in Rural China, American Economic Review 92, 1420-1447.
Jimenez, E. 1984. “Tenure security and urban squatting.” Review of Economics and Statistics 66(4),
556-67.
Johnson, Simon, John McMillan, and Christopher Woodruff. 2002. “Property Rights and Finance.”
American Economic Review 92(5), 1335–56.
Johnson, S., Mitton, T., 2003. Cronyism and capital control: evidence from Malaysia. J. Financ.
Econ. 67 (2), 351–382.
Lanjouw, Jean O., Philip I. Levy. 2002. “Untitled: A Study of Formal and Informal Property Rights
in Urban Ecuador.” Economic Journal 112, 986-1019.
Li, Hongbin, Lingsheng Meng, Qian Wang, Li-An Zhou, 2008, Political connections, financing and
firm performance: Evidence from Chinese private firms, Journal of Development
Economics87, 283–299
Li, Kai, Tan Wang, Yan-Leung Cheung, and Ping Jiang, 2011, Privatization and risk sharing:
Evidence from the split share structure reform in China, Review of Financial Studies 24, 2499-
2525.
Libecap, Gary, Dean Lueck. 2011. “The demarcation of land and the role of coordinating property
institutions.” Journal of Political Economy 119(3), 426-467.
Lin, Justin Yifu, Fang Cai, and Zhou Li., 1998, Competition, policy burdens, and state-owned

40
enterprise reform, American Economic Review 88, 422-427.
Lin, Chen, Ping Lin, Frank Song. 2010. Property rights protection and corporate R&D: Evidence
from China. Journal of Development Economics 93, 49-62.
Lin, Chen, Ping Lin, Hong Zou. 2012. Does property rights protection affect corporate risk
management strategy? Intra- and cross-country evidence. J. of Corporate Finance 18, 311-30.
Liu, Qiao, and Alan Siu, 2011, Institutions and corporate investment: Evidence from investment-
implied return on capital in China, J. of Financial and Quantitative Analysis 46, 1831-1863.
Lu, Haitian, Hongbo Pan, and Chenying Zhang, 2015, Political Connectedness and Court
Outcomes: Evidence from Chinese Corporate Lawsuits, J. of Law and Economics 58, 829-861.
Luez, C., Oberholzer-Gee, F., 2006. Political relationships, global financing, and corporate
transparency: evidence from Indonesia. J. Financ. Econ. 81 (2), 411–439.
McGregor, Richard. 2010. The Party: The Secret World of China's Communist Rulers. New
York: Harper Collins Press.
Megginson, William L. and Jeffry M. Netter, 2001. “From State to Market: A Survey of Empirical
Studies on Privatization.” Journal of Economic Literature 39: 321-389.
North, Douglas, 1993, Institutions and credible commitment, Journal of Institutional and
Theoretical Economics 149, 11-23.
Peltzman, Sam. 1976. “Toward a More General Theory of Regulation.” Journal of Law and
Economics 19(2), 211-240.
Persson, T., G. Tabellini. 2009. Democratic capital: the nexus of political and economic change.
American Economic Journal: Macroeconomics 1(2), 88-126.
Puga, Diego, and Daniel Trefler, 2014, International Trade and Institutional Change: Medieval
Venice’s Response to Globalization, Quarterly Journal of Economics 129, 753-821.
Qin, Bei, David Stromberg, Yanhui Wu. 2018. “Media Bias in China.” American Economic Review
108(9), 2442-76.
Rajan, Raghuram, Luigi Zingales, 1998, Financial dependence and growth, American Economic
Review 88, 559–586.
Rajan, Raghuram, and Luigi Zingales, 2003, The great reversals: the politics of financial
development in the twentieth century, Journal of Financial Economics 69, 5-50.
Shi, Xiangyu, Tianyang Xi, Xiaobo Zhang, Yifan Zhang. 2017. “Moving `Umbrella’: Identifying
Political Connections through Bureaucratic Transfers in China. Mimeo, Peking University.
Shih, Victor, Christopher Adolph, and Mingxing Liu, 2012. “Getting Ahead in the Communist Party:
Explaining the Advancement of Central Committee Members in China.” American Political
Science Review 106: 166-187.
Stigler, George, 1971, The theory of economic regulation, The Bell Journal of Economics and
Management Science 2, 3-21.
Tabellini, G. 2008. The scope of cooperation: values and incentives. Quarterly J. of Economics
123(3), 905-50.
Xiong, Wei, and Jialin Yu, 2011, The Chinese warrants bubble, American Economic Review 101,

41
2723-2753
Xu, Chenggang, 2011, The fundamental institutions of China's reforms and development. Journal
of Economic Literature 49, 1076-1151.
Yi, Yuanyuan, Gunnar Kohlin, Jintao Xu. 2014. “Property Rights, Tenure Security and Forest
Investment Incentives: Evidence from China’s Collective Forest Tenure Reform.”
Environment and Development Economics 19(1), 48-73.
Young, Alwyn, 2000, The Razor's Edge: Distortions and Incremental Reform in the People's
Republic of China, Quarterly Journal of Economics 115, 1091-1135.
Young, Alwyn, 2018, Consistency without Inference: Instrumental Variables in Practical
Application, mimeo, London School of Economics.

42
Figure 1. The increases in the land price index in Chinese cities. Source: http://www.landvalue.com.cn/Lvmonitor/Index

43
Figure 2. timeline of the evolvement of the local land market of Shenzhen. The figure illustrates the evolvement of Shenzhen’s land market since the 1980s when the allocated land was
distributed to then SOEs. The shortage of land resource was aggravated at the end of 2008 and the land titling
program was announced by the end of 2009. It is until 2012 that the scheme was truly implementable.
Resource: http://pnr.sz.gov.cn/

44
Panle A.
Panel B.
Figure 3. Firm Investment over time.
In Panel A, the sample of titling firms (grey bars) includes all 43 listed firms that receive land titles in the land titling program in Shenzhen. The sample of non-titling firms (while bars) includes all listed companies that are located in Shenzhen and that do not receive land titles in the land titling program. The figure presents the average investment (annual capital expenditure divided by PP&E) between 2008 and 2017.
In Panel B, the sample of SOE titling firms (grey bars) includes 30 listed SOEs that receive land titles in the land titling program occurred in Shenzhen in 2009. The sample of none SOEs (while bars) includes 13 listed non-SOEs that receive land titles in the land titling program in Shenzhen. The figure presents the average investment (annual capital expenditure divided by PP&E) between 2008 and 2017.
Resource: CSMAR
0%
10%
20%
30%
40%
50%
60%
2008 2009 2010 2011 2012 2013 2014 2015 2016 2017
Title Firms None Title Firms
0%
10%
20%
30%
40%
50%
60%
70%
2008 2009 2010 2011 2012 2013 2014 2015 2016 2017
SOE Titling Firms None SOE Titling Firms

45
Figure 4. Stock market reactions of politically connected and non-connected titling firms in the event time of land titling program. The sample of SOE titling firms (grey bars) includes politically connected listed firms that receive land titles in the land titling program in Shenzhen. The sample of none SOEs (while bars) includes non-politically connected listed firms that receive land titles in the land titling program occurred in Shenzhen in 2009. The figure presents the cumulative abnormal returns of both types of titling firms in a period window between 30 days before and 30 days after the announcement day of the 2009 land titling program. Resource: CSMAR
-4%
-2%
0%
2%
4%
6%
8%
10%
-30 -25 -20 -15 -10 -5 0 5 10 15 20 25 30
Cu
mu
lati
ve
Ab
no
rma
l R
etu
rns
Relative Date to Event
Connected Titling Firms Non-Connected Titling Firms

46
Table 1. The Difference in Legal Status between Allocated and Entitled Lands The table presents the differences in legal status between allocated and entitled lands that co-exists in Shenzhen China before 2009 when the land titling program was initiated.
Allocated land Entitled Land
Distribution Method Gov’t allocation Market purchase
Distribution Time Before land market
reform in the 1990s
After land market reform
in the 1990s
Enforcement of Tenure Incomplete Yes
Tenure Length Max 30 Years 40-70
Certificate Fiat Order Contract
Registration No Yes
Probability of expropriation High Rare
Compensation No Yes, usually higher than
the market price
Accepted as Collateral No Yes
Allowed to sell No Yes

47
Table 2. Pre-Treatment Summary Statistics The sample consists of all nonfinancial listed firms in the CSMAR database. The table presents variable average and standard deviation (in the bracket below) for the entire sample, as well as a subsample of firms that receive land titles in the land titling program (Titling firms) and firms that do not (Non Titling firms). The difference between the values for Titling firms and Non Titling firms are presented in Column (4). The statistics are calculated based on the financial reports of firms in 2011, the last year before the title reform was implemented in 2012. The t-statistics in brackets of column (4) are for the null hypothesis that there is no difference between Titling firms and Non-Titling firms. *,**,*** indicates significance at the 1%, 5% and 10% level respectively.
Whole Sample Titling
firm
Non-titling
firm Difference
N=1250 N=43 N=1207
Sales (Billion RMB) 5.315 5.317 5.266 -0.055 (8.237) (8.231) (8.507) (-0.043)
Total asset (Billion RMB) 8.342 8.323 8.879 0.576 (11.017) (10.998) (11.650) (0.338)
Employment (Thousand) 4.576 4.569 4.786 0.206 (5.708) (5.668) (6.803) (0.232)
Book leverage ratio 53.965 53.850 57.171 3.250 (19.503) (19.605) (16.261) (1.072)
Book to market ratio 0.364 0.365 0.350 -0.015 (0.235) (0.235) (0.239) (-0.424)
ROA 5.564 5.569 5.410 -0.147 (5.179) (5.213) (4.151) (-0.182)
Cash ratio 0.580 0.585 0.453 -0.131 (0.539) (0.541) (0.470) (-1.569)
Dividend (Million RMB) 56.642 55.845 78.849 23.295 (96.953) (95.808) (124.079) (1.553)
% of SOE 0.688 0.687 0.721 0.034 (0.463) (0.464) (0.454) (0.468)
Industry: Material 0.176 0.179 0.070 -0.111 (0.381) (0.384) (0.258) (-1.873)
Industry: Manufacture 0.225 0.223 0.279 0.058 (0.418) (0.416) (0.454) (0.895)
Industry: Nondurable goods 0.173 0.175 0.116 -0.059
(0.378) (0.380) (0.324) (-1.010)
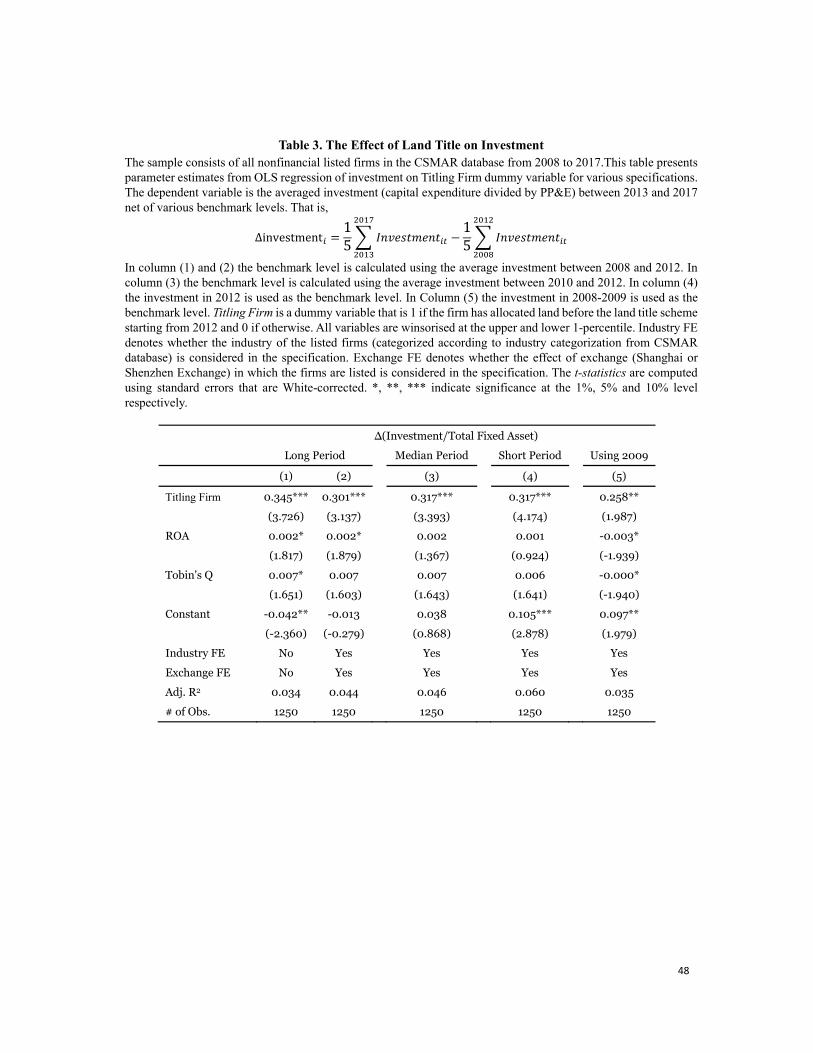
48
Table 3. The Effect of Land Title on Investment The sample consists of all nonfinancial listed firms in the CSMAR database from 2008 to 2017.This table presents parameter estimates from OLS regression of investment on Titling Firm dummy variable for various specifications. The dependent variable is the averaged investment (capital expenditure divided by PP&E) between 2013 and 2017 net of various benchmark levels. That is,
Δinvestment15
𝐼𝑛𝑣𝑒𝑠𝑡𝑚𝑒𝑛𝑡15
𝐼𝑛𝑣𝑒𝑠𝑡𝑚𝑒𝑛𝑡
In column (1) and (2) the benchmark level is calculated using the average investment between 2008 and 2012. In column (3) the benchmark level is calculated using the average investment between 2010 and 2012. In column (4) the investment in 2012 is used as the benchmark level. In Column (5) the investment in 2008-2009 is used as the benchmark level. Titling Firm is a dummy variable that is 1 if the firm has allocated land before the land title scheme starting from 2012 and 0 if otherwise. All variables are winsorised at the upper and lower 1-percentile. Industry FE denotes whether the industry of the listed firms (categorized according to industry categorization from CSMAR database) is considered in the specification. Exchange FE denotes whether the effect of exchange (Shanghai or Shenzhen Exchange) in which the firms are listed is considered in the specification. The t-statistics are computed using standard errors that are White-corrected. *, **, *** indicate significance at the 1%, 5% and 10% level respectively.
∆(Investment/Total Fixed Asset)
Long Period Median Period Short Period Using 2009
(1) (2) (3) (4) (5)
Titling Firm 0.345*** 0.301*** 0.317*** 0.317*** 0.258** (3.726) (3.137) (3.393) (4.174) (1.987)
ROA 0.002* 0.002* 0.002 0.001 -0.003* (1.817) (1.879) (1.367) (0.924) (-1.939)
Tobin's Q 0.007* 0.007 0.007 0.006 -0.000* (1.651) (1.603) (1.643) (1.641) (-1.940)
Constant -0.042** -0.013 0.038 0.105*** 0.097** (-2.360) (-0.279) (0.868) (2.878) (1.979)
Industry FE No Yes Yes Yes Yes
Exchange FE No Yes Yes Yes Yes
Adj. R2 0.034 0.044 0.046 0.060 0.035
# of Obs. 1250 1250 1250 1250 1250

49
Table 4. The Effect of Land Title on Investment: Instrumental Variable Regressions The sample consists of all nonfinancial listed firms in the CSMAR database from 2008 to 2017.This table presents parameter estimates from the first and second stage of instrumental variable regression of investment on Titling Firm dummy variable. In Column (1) and (2), the results of the first stage estimate are presented. In Column (3) and (4), the results of the second stage estimate are presented. The instrument we use in (3) is whether the Shenzhen government was the controlling shareholder of the firm when it was first established. The instrument we used in (4) were the shares of Shenzhen government as the percentage of total shares of the firm when the firm was first established. All variables are winsorised at the upper and lower 1-percentile. Industry FE denotes whether the industry of the listed firms (categorized according to industry categorization from CSMAR database) is considered in the specification. Exchange FE denotes whether the effect of exchange (Shanghai or Shenzhen Exchange) in which the firms are listed is considered in the specification. The t-statistics are computed using standard errors that is White-corrected. The *,**,*** indicates significance at the 1%, 5% and 10% level respectively.
Titling Firm ∆(Investment/PP&E)
First stage OLS
IV: Shenzhen
government as
controlling
shareholder when
established
IV: Shareholding
percentage of
Shenzhen
government when
established (1) (2) (3) (4)
Shenzhen gov’t as controlling 0.694***
shareholder when established (9.032)
Shareholding percentage of Shenzhen gov’t 0.808***
when established (9.603)
Titling Firm 0.322*** 0.315*** (2.771) (2.964)
ROA 0.001 0.001 (1.442) (1.442)
Tobin’s Q 0.003 0.003 (1.581) (1.579)
Industry FE Yes Yes Yes Yes
Exchange FE Yes Yes Yes Yes
Adj. R2 0.424 0.471 0.028 0.028
# of Obs. 1250 1250 1250 1250
First stage F-test 91.327 110.383

50
Table 5. The Robustness Check The sample consists of all nonfinancial listed firms in the CSMAR database from 2008 to 2017. This table presents estimates from OLS regressions of investment on Titling Firm dummy variable. For columns (1)-(5), cross-sectional OLS regressions are implemented. The independent variable is the averaged investment rate (capital expenditure divided by PP&E) between 2013 and 2017 net of various benchmark levels. In Column (1), only firms headquartered in Shenzhen are included in the regression sample. In Column (2), only firms headquartered in Beijing, Shanghai, Shenzhen and Guangzhou, four metropolitans are included. In Column (3), city dummies are included. In Column (4), the propensity score matching method is implemented. Four characteristics, size, age, leverage and ownership are used to find the most similar firms in the universe of the control firms. In Column (5), the size of the takeover is controlled. The relative size of the takeover is calculated by the size of firms acquired by the listed firm normalized by the size of the listed firm. In Column (6), the panel data regression (regression 2) is implemented. For each firm, observations from 2008 to 2017 are included. The dependent variable for Column (6) is the annual investment normalized by PP&E. Post is a dummy variable that is 1 if the year is after 2012 and 0 if not. In Column (7), the pre-trend test is implemented. For each year between 2008 and 2017, its interaction with the Titling Firm dummy is added in the panel data regression 2. All variables are winsorized at the upper and lower 1-percentile. Industry FE denotes whether the industry of the listed firms (categorized according to industry categorization from CSMAR database) is considered in the specification. Exchange FE denotes whether the effect of exchange (Shanghai or Shenzhen Exchange) in which the firms are listed is considered in the specification. The t-statistics are computed using standard errors that are White-corrected. The *,**,*** indicates significance at the 1%, 5% and 10% level respectively.
∆(Investment/Total Fixed Asset) Investment/Total Fixed
Shenzhen firms only
Firms in Metropolitan
City dummy
Propensity score matching Takeover Panel data
regression Pre-Trend
Test
(1) (2) (3) (4) (5) (6) (7)
Titling Firm 0.411** 0.341*** 0.352*** 0.295* 0.297***
(2.313) (2.662) (2.867) (1.706) (3.114)
Takeover 0.000***
(3.156)
Titling Firm * Takeover 0.000
(1.004)
Post Dummy 0.004
(0.153)
Titling Firm * Post dummy 0.276***
(3.427)
Titling Firm * Year 2008 -0.057 (-0.377)
Titling Firm * Year 2009 -0.094 (-1.377)
Titling Firm * Year 2010 -0.172 (-0.878)
Titling Firm * Year 2011 -0.120 (-1.064)
Titling Firm * Year 2012 -0.178
(-1.475)
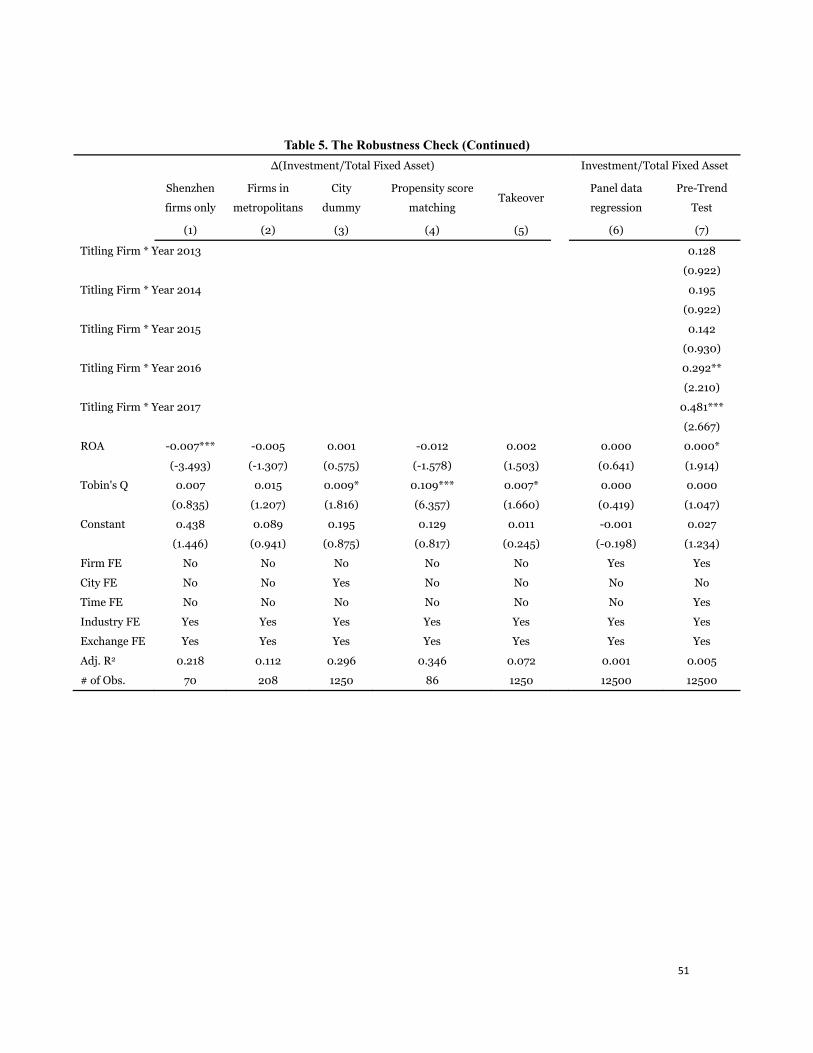
51
Table 5. The Robustness Check (Continued)
∆(Investment/Total Fixed Asset) Investment/Total Fixed Asset
Shenzhen
firms only
Firms in
metropolitans
City
dummy
Propensity score
matching Takeover
Panel data
regression
Pre-Trend
Test
(1) (2) (3) (4) (5) (6) (7)
Titling Firm * Year 2013 0.128 (0.922)
Titling Firm * Year 2014 0.195 (0.922)
Titling Firm * Year 2015 0.142 (0.930)
Titling Firm * Year 2016 0.292** (2.210)
Titling Firm * Year 2017 0.481*** (2.667)
ROA -0.007*** -0.005 0.001 -0.012 0.002 0.000 0.000* (-3.493) (-1.307) (0.575) (-1.578) (1.503) (0.641) (1.914)
Tobin's Q 0.007 0.015 0.009* 0.109*** 0.007* 0.000 0.000 (0.835) (1.207) (1.816) (6.357) (1.660) (0.419) (1.047)
Constant 0.438 0.089 0.195 0.129 0.011 -0.001 0.027 (1.446) (0.941) (0.875) (0.817) (0.245) (-0.198) (1.234)
Firm FE No No No No No Yes Yes
City FE No No Yes No No No No
Time FE No No No No No No Yes
Industry FE Yes Yes Yes Yes Yes Yes Yes
Exchange FE Yes Yes Yes Yes Yes Yes Yes
Adj. R2 0.218 0.112 0.296 0.346 0.072 0.001 0.005
# of Obs. 70 208 1250 86 1250 12500 12500
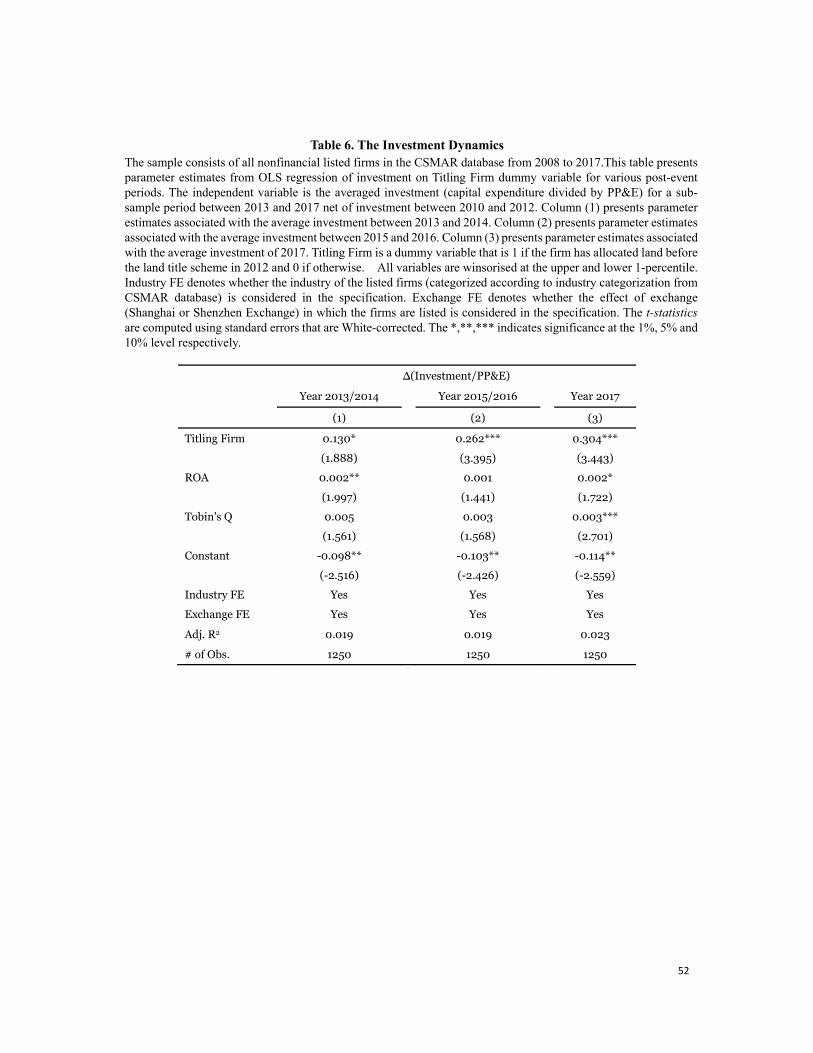
52
Table 6. The Investment Dynamics The sample consists of all nonfinancial listed firms in the CSMAR database from 2008 to 2017.This table presents parameter estimates from OLS regression of investment on Titling Firm dummy variable for various post-event periods. The independent variable is the averaged investment (capital expenditure divided by PP&E) for a sub-sample period between 2013 and 2017 net of investment between 2010 and 2012. Column (1) presents parameter estimates associated with the average investment between 2013 and 2014. Column (2) presents parameter estimates associated with the average investment between 2015 and 2016. Column (3) presents parameter estimates associated with the average investment of 2017. Titling Firm is a dummy variable that is 1 if the firm has allocated land before the land title scheme in 2012 and 0 if otherwise. All variables are winsorised at the upper and lower 1-percentile. Industry FE denotes whether the industry of the listed firms (categorized according to industry categorization from CSMAR database) is considered in the specification. Exchange FE denotes whether the effect of exchange (Shanghai or Shenzhen Exchange) in which the firms are listed is considered in the specification. The t-statistics are computed using standard errors that are White-corrected. The *,**,*** indicates significance at the 1%, 5% and 10% level respectively.
∆(Investment/PP&E)
Year 2013/2014 Year 2015/2016 Year 2017
(1) (2) (3)
Titling Firm 0.130* 0.262*** 0.304*** (1.888) (3.395) (3.443)
ROA 0.002** 0.001 0.002* (1.997) (1.441) (1.722)
Tobin's Q 0.005 0.003 0.003*** (1.561) (1.568) (2.701)
Constant -0.098** -0.103** -0.114** (-2.516) (-2.426) (-2.559)
Industry FE Yes Yes Yes
Exchange FE Yes Yes Yes
Adj. R2 0.019 0.019 0.023
# of Obs. 1250 1250 1250
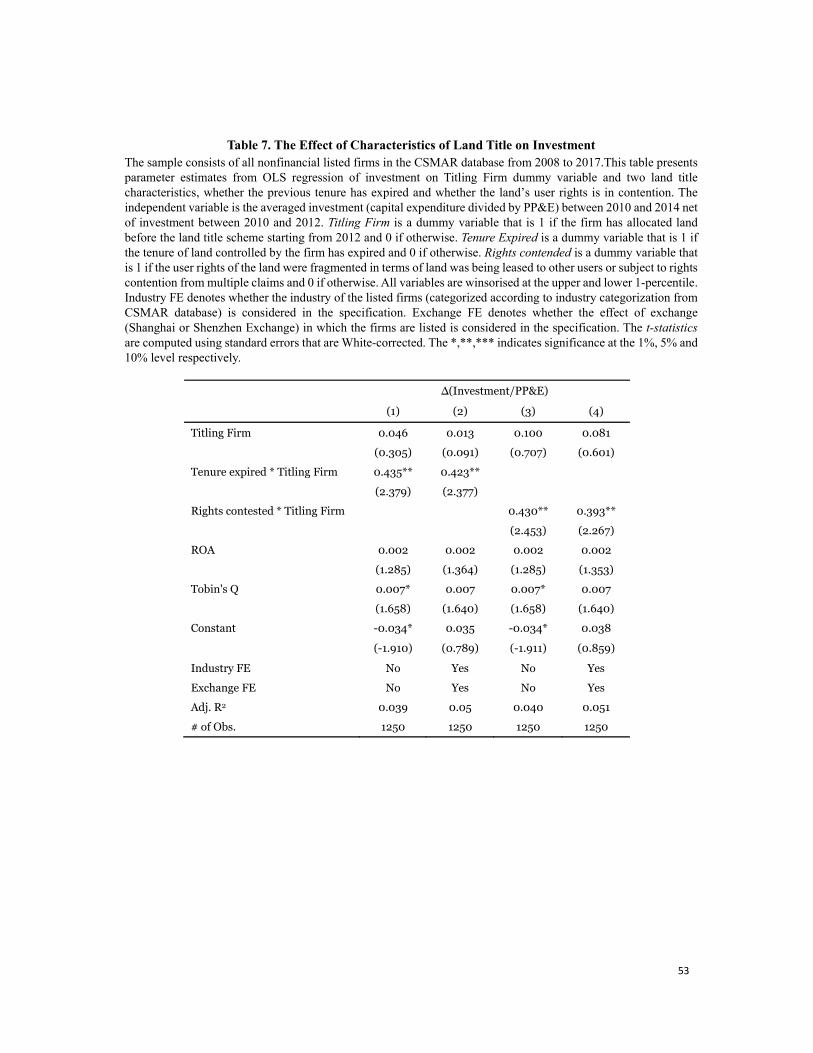
53
Table 7. The Effect of Characteristics of Land Title on Investment The sample consists of all nonfinancial listed firms in the CSMAR database from 2008 to 2017.This table presents parameter estimates from OLS regression of investment on Titling Firm dummy variable and two land title characteristics, whether the previous tenure has expired and whether the land’s user rights is in contention. The independent variable is the averaged investment (capital expenditure divided by PP&E) between 2010 and 2014 net of investment between 2010 and 2012. Titling Firm is a dummy variable that is 1 if the firm has allocated land before the land title scheme starting from 2012 and 0 if otherwise. Tenure Expired is a dummy variable that is 1 if the tenure of land controlled by the firm has expired and 0 if otherwise. Rights contended is a dummy variable that is 1 if the user rights of the land were fragmented in terms of land was being leased to other users or subject to rights contention from multiple claims and 0 if otherwise. All variables are winsorised at the upper and lower 1-percentile. Industry FE denotes whether the industry of the listed firms (categorized according to industry categorization from CSMAR database) is considered in the specification. Exchange FE denotes whether the effect of exchange (Shanghai or Shenzhen Exchange) in which the firms are listed is considered in the specification. The t-statistics are computed using standard errors that are White-corrected. The *,**,*** indicates significance at the 1%, 5% and 10% level respectively.
∆(Investment/PP&E)
(1) (2) (3) (4)
Titling Firm 0.046 0.013 0.100 0.081 (0.305) (0.091) (0.707) (0.601)
Tenure expired * Titling Firm 0.435** 0.423** (2.379) (2.377)
Rights contested * Titling Firm 0.430** 0.393** (2.453) (2.267)
ROA 0.002 0.002 0.002 0.002 (1.285) (1.364) (1.285) (1.353)
Tobin's Q 0.007* 0.007 0.007* 0.007 (1.658) (1.640) (1.658) (1.640)
Constant -0.034* 0.035 -0.034* 0.038
(-1.910) (0.789) (-1.911) (0.859)
Industry FE No Yes No Yes
Exchange FE No Yes No Yes
Adj. R2 0.039 0.05 0.040 0.051
# of Obs. 1250 1250 1250 1250
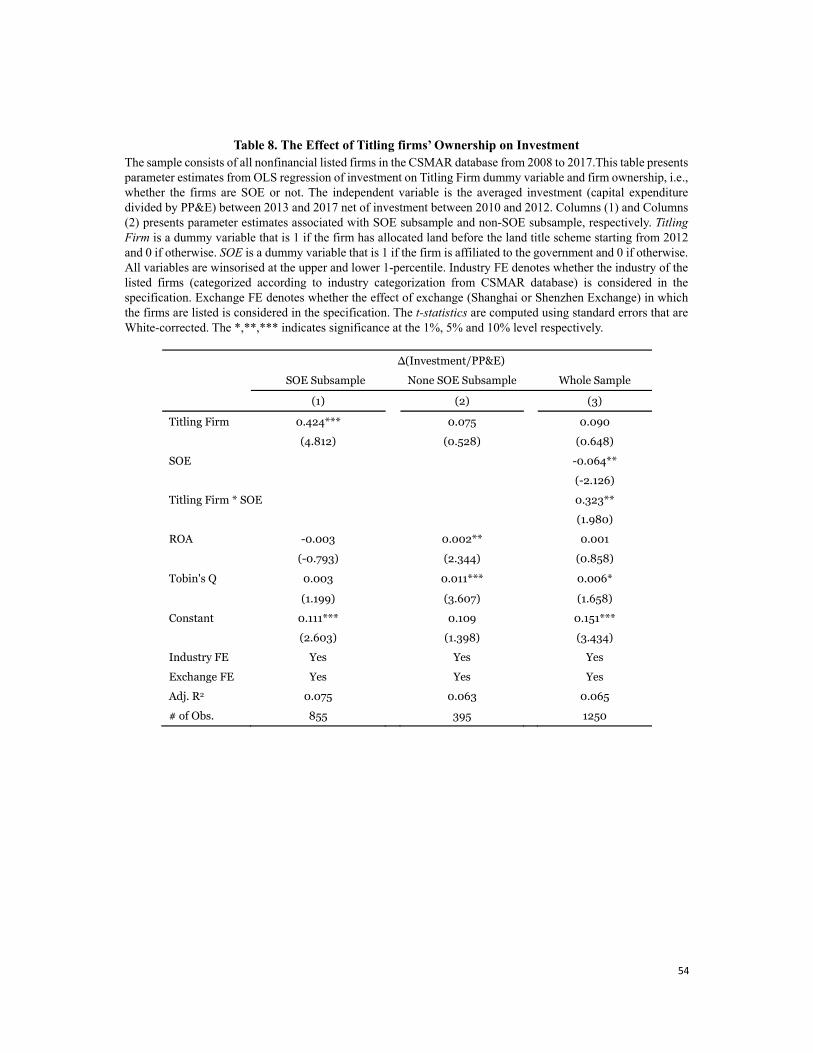
54
Table 8. The Effect of Titling firms’ Ownership on Investment The sample consists of all nonfinancial listed firms in the CSMAR database from 2008 to 2017.This table presents parameter estimates from OLS regression of investment on Titling Firm dummy variable and firm ownership, i.e., whether the firms are SOE or not. The independent variable is the averaged investment (capital expenditure divided by PP&E) between 2013 and 2017 net of investment between 2010 and 2012. Columns (1) and Columns (2) presents parameter estimates associated with SOE subsample and non-SOE subsample, respectively. Titling Firm is a dummy variable that is 1 if the firm has allocated land before the land title scheme starting from 2012 and 0 if otherwise. SOE is a dummy variable that is 1 if the firm is affiliated to the government and 0 if otherwise. All variables are winsorised at the upper and lower 1-percentile. Industry FE denotes whether the industry of the listed firms (categorized according to industry categorization from CSMAR database) is considered in the specification. Exchange FE denotes whether the effect of exchange (Shanghai or Shenzhen Exchange) in which the firms are listed is considered in the specification. The t-statistics are computed using standard errors that are White-corrected. The *,**,*** indicates significance at the 1%, 5% and 10% level respectively.
∆(Investment/PP&E) SOE Subsample None SOE Subsample Whole Sample
(1) (2) (3)
Titling Firm 0.424*** 0.075 0.090 (4.812) (0.528) (0.648)
SOE -0.064** (-2.126)
Titling Firm * SOE 0.323** (1.980)
ROA -0.003 0.002** 0.001 (-0.793) (2.344) (0.858)
Tobin's Q 0.003 0.011*** 0.006*
(1.199) (3.607) (1.658)
Constant 0.111*** 0.109 0.151*** (2.603) (1.398) (3.434)
Industry FE Yes Yes Yes
Exchange FE Yes Yes Yes
Adj. R2 0.075 0.063 0.065
# of Obs. 855 395 1250

55
Table 9. Characteristics of Land Titling firms The sample consists of all nonfinancial listed firms that have allocated land before 2012. The table presents variable average and standard deviation (in the bracket below) for the entire sample, as well as a subsample of firms that are affiliated to the government (SOE) and firms that do not (Non-SOE). The difference between the values for SOE and None SOE are presented in Column (4). The t-statistics in brackets of column (4) are for the null hypothesis that there is no difference between Titling firms and Non Titling firms. Historical Annual Stock Market Return is the annualized average stock market return between 2008 and 20012. Δ Historical Annual Stock Market Return is the difference in annualized average stock market return between 2008/2012 and 2013/2017. SA Measure is calculated using the formula of firm size and age. External Finance Reliance is constructed using the index of US industries’ averaged reliance on external finance. Incentive Package is averaged quantity of shares held by management as an incentive package between 2008 and 2017. CAR in QE announcement is the Cumulative Abnormal Returns (CARs) between 5th and 11thNov, 2008, when the “4 Trillion” fiscal stimulus plan was released. *,**,*** indicates significance at the 1%, 5% and 10% level respectively.
(1) All Titling firms (2) SOE (3) Non-SOE (4) Difference
Panel A: Land Characteristics
Land Area (Hectare) 4.986 4.775 5.358 -0.583
(4.210) (3.390) (5.458) (0.012)
Land Value (Billion RMB) 1.307 1.328 1.286 0.042
(1.172) (1.074) (0.956) (0.113)
Land Value (% of Market 0.573 0.579 0.583 -0.004
Capitalization) (0.377) (0.345) (0.447) (-0.057)
Panel B: Cost of Equity
Historical Annual Stock Market -0.350 -0.321 -0.423 -0.102
Return (0.130) (0.134) (0.085) (-1.460)
Δ Historical Annual Stock Market 0.032 -0.029 0.190 0.219
Return (0.220) (0.203) (0.188) (1.241)
Dividend / Total sales 0.038 0.049 0.009 0.0406 (0.161) (0.189) (0.019) (0.74)
Panel C: Financial Constraints
Size-Age Measure 1.019 0.779 1.43 -0.651 (3.808) (1.691) (6.001) (-0.54)
External Finance Reliance 0.334 0.351 0.308 0.043 (0.245) (0.256) (0.225) (0.440)
Panel D: Corporate Governance
Incentive Package 2.223 2.146 2.421 -0.275 (5.015) (4.999) (5.274) (-0.16)
Chairman-CEO duality 0.837 0.839 0.833 0.00538 (0.374) (0.374) (0.389) (0.04)
% of Independent board 0.358 0.350 0.379 -0.0290 (0.050) (0.042) (0.061) (-1.23)

56
Table 10. The Effect of Titling Firms’ Political Connections on Investment The sample consists of all nonfinancial listed firms in the CSMAR database from 2008 to 2017.This table presents parameter estimates from OLS regression of investment on Titling Firm dummy variable and firms’ political connections, measured by either the total number of local bureaucrats on the firms’ boards or the ratio of Communist Party members as the percentage of total employees. The independent variable is the averaged investment between 2013 and 2017 net of investment between 2010 and 2012. Bureaucrats on Boards is the total number of board members of the firms with experience of serving in the government. The Party Member Ratio is the ratio of the total number of employees with communist party membership divided by the number of total employees. All variables are winsorised at the upper and lower 1-percentile. Industry FE denotes whether the industry of the listed firms (categorized according to industry categorization from CSMAR database) is considered in the specification. Exchange FE denotes whether the effect of exchange (Shanghai or Shenzhen Exchange) in which the firms are listed is considered in the specification. The t-statistics are computed using standard errors that are White-corrected. The *,**,*** indicates significance at the 1%, 5% and 10% level respectively.
∆(Investment/PP&E) Bureaucrats on boards Party Member Ratio
(1) (2) (3) (4)
Titling Firm 0.186*** 0.211*** (2.682) (3.093)
Bureaucrats on boards -0.035 -0.035 (-1.251) (-1.254)
Titling Firm * Bureaucrats on board 0.500*** (2.808)
Party Member -0.016 -0.016 (-1.043) (-1.033)
Titling Firm * Party Member 1.663*** (5.227)
Titling Firm * SOE 0.271*** 0.254*** (3.376) (3.530)
Titling Firm * Non-SOE 0.031 0.149 (0.282) (0.970)
Titling Firm * SOE * Bureaucrats on board 0.064 (0.932)
Titling Firm * Non-SOE * Bureaucrats on board 1.216*** (10.706)
Titling Firm * SOE * Party Member -0.679 (-0.107)
Titling Firm * Non-SOE * Party Member 1.594*** (5.185)
Control Variables Yes Yes Yes Yes
Industry FE Yes Yes Yes Yes
Exchange FE Yes Yes Yes Yes
Adj. R2 0.067 0.069 0.073 0.072
# of Obs. 1250 1250 1250 1250

57
Table 11. The Effect of Titling Firms’ Ownership on preferential treatments The sample consists of all firms in the CSMAR database that has Allocated land before the land titling program starting from 2012. This table presents parameter estimates from OLS regression of title firms’ ownership on the preferential treatment received by the firm. In Column (1), the dependent variable is a dummy variable that is 1 if the firm has disputes either with the government or with other firms and 0 if otherwise. In Column (2), the dependent variable is a dummy variable that is 1 if the firm has disputes with the government and 0 if otherwise. In Column (3), the dependent variable is a dummy variable that is 1 if the firm has disputes with other firms and 0 otherwise. All variables are winsorized at the upper and lower one percentile. Industry FE denotes whether the industry of the listed firms (categorized according to industry categorization from CSMAR database) is considered in the specification. Exchange FE denotes whether the effect of exchange (Shanghai or Shenzhen Exchange) in which the firms are listed is considered in the specification. The t-statistics are computed using standard errors that are White-corrected. *,**,*** indicate significance at the 1%, 5% and 10% level respectively.
All Disputes Disputes with government Disputes with private firms (1) (2) (3)
SOE dummy -0.367** -0.432** -0.388** (-2.087) (-2.542)
-0.000
(-1.000)
0.003
(0.166)
0.018
(0.557)
0.405
(1.460)
Yes
Yes
0.133
(-2.205)
Log(Total Asset) 0.002*** -0.001 (3.293) (-1.262)
ROA -0.006 -0.033* (-0.274) (-1.753)
Tobin's Q 0.012 -0.057** (0.419) (-2.300)
Constant 0.480 0.781**
(1.628) (2.324)
Industry FE Yes Yes
Exchange FE Yes Yes
Adj. R2 0.133 0.264
# of Obs. 43 43 43

58
Table 12. The Short- and Long-Term Stock Market Reactions The sample consists of all nonfinancial listed firms in the CSMAR database from 2008 to 2017.This table presents the result of the regression analysis of the stock market reaction in the short and long run. The cumulative abnormal returns in the next two trading days are used to measure the short-term stock market reaction. The increase of Tobin’s Q in the next 5 years after the event net of its 2 years growth before the event was used to measure the long-term stock market reaction. Titling Firm is a dummy variable that is 1 if the firm has allocated land before the land title scheme starting from 2012 and 0 if otherwise. SOE is a dummy variable that is 1 if the firm is affiliated to the government and 0 if otherwise. All variables are winsorised at the upper and lower 1-percentile. Industry FE denotes whether the industry of the listed firms (categorized according to industry categorization from CSMAR database) is considered in the specification. Exchange FE denotes whether the effect of exchange (Shanghai or Shenzhen Exchange) in which the firms are listed is considered in the specification. The t-statistics are computed using standard errors that are White-corrected. The *,**,*** indicates significance at the 1%, 5% and 10% level respectively.
Stock Market Reaction [0,2] Δ Tobin's Q [-2 Year, 5 Year] (1) (2) (3) (4) (5) (6) (7) (8)
Titling Firm 0.076*** 0.097*** 0.068*** 0.082*** 2.851** 1.952 0.907* 1.423 (7.073) (4.606) (6.392) (7.361) (2.510) (0.900) (1.836) (1.571)
SOE 0.002 0.823*
(0.762) (1.740)
Titling Firm * SOE -0.030 1.723*
(-1.234) (1.780)
Bureaucrats on boards 0.000 -0.441 (0.057) (-0.780)
Titling Firm * Bureaucrats on boards 0.027 8.748***
(0.986) (3.423)
Party Member -0.001 -0.783*** (-1.156) (-5.492)
Titling Firm * Party Member -0.098 10.773*** (-0.956) (3.559)
Industry FE Yes Yes Yes Yes Yes Yes Yes Yes
Exchange FE Yes Yes Yes Yes Yes Yes Yes Yes
Adj. R2 0.031 0.031 0.031 0.031 0.027 0.028 0.029 0.052
# of Obs. 1250 1250 1250 1250 1250 1250 1250 1250

59
Table A1 Statistical Description
The sample consists of all financial listed firms in the CSMAR database from 2008-2017.
N Mean St. Dev. Min Max
∆(Investment/Total Fixed Asset) 1250 0.03 0.43 -.832 1.25
Titling Firm dummy 1250 0.04 0.19 0 1
ROA in 2012 1250 6.16 17.12 -13.29 40.18
Tobin Q in 2012 1250 2.04 8.69 .11 232.59
Δ Tobin's Q 1250 0.83 6.71 -89.14 101.35
The relative size of the acquirees in the M&A deals 1250 0.05 1.27 0 44
Shenzhen dummy 1250 0.06 0.23 0 1
Tenure Unexpired 1250 0.02 0.16 0 1
Rights Uncontended 1250 0.02 0.15 0 1
SOE dummy 1250 0.69 0.46 0 1
Historical Annual Stock Market Return 1250 -0.36 0.12 -0.54 -0.07
Δ Historical Annual Stock Market Return 1250 -0.01 0.19 -0.37 0.40
Dividend / Total sales 1250 0.02 0.07 0 1.94
Incentive Package 1250 2.53 8.48 0 78.04
Chairman-CEO duality dummy 1250 0.71 0.46 0 1.00
% of Independent board 1250 0.36 0.05 0.09 0.57
Size-Age Measure 1250 0.83 3.91 -0.68 23.92
External Finance Reliance 1250 0.27 0.26 -0.14 1.14
CAR in QE announcement 1250 0.19 0.09 -0.50 0.50
Bureaucrats on boards 1250 0.11 0.38 0 3
Party Member 1250 0.14 0.88 0 1
All Disputes 1250 0.01 0.11 0 1
Disputes with government 1250 0.01 0.09 0 1
Disputes with private firms 1250 0.01 0.10 0 1