policy paper 2015-02 global views - brookings institution
TRANSCRIPT
Policy Paper 2015-02
MAY 2015
The Brookings insTiTuTion
1775 MassachuseTTs ave., nWWashingTon, Dc 20036
G LO B A L V I EW S
Private Capital Flows, Official Development Assistance, and Remittances to Africa:
Who Gets What?
Amadou SyDirector and Senior Fellow, Africa Growth Initiative
The Brookings Institution
Fenohasina Maret RakotondrazakaGuest Scholar, Africa Growth Initiative
The Brookings Institution
PHOTO: © USAID

ACKNOWLEDGMENTS
We thank Christine Zhang and Christina Golubski for their useful comments.
1
Introduction
Strong Growth and Changing Composition
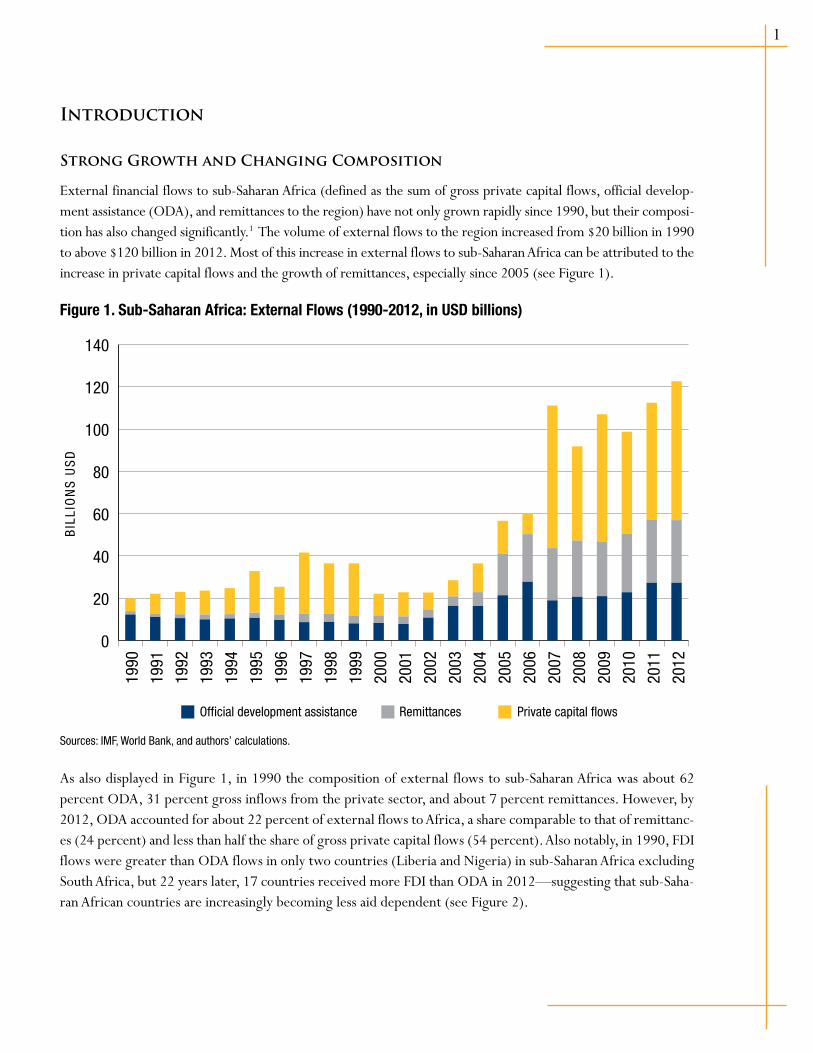
External financial flows to sub-Saharan Africa (defined as the sum of gross private capital flows, official develop-ment assistance (ODA), and remittances to the region) have not only grown rapidly since 1990, but their composi-tion has also changed significantly.1 The volume of external flows to the region increased from $20 billion in 1990 to above $120 billion in 2012. Most of this increase in external flows to sub-Saharan Africa can be attributed to the increase in private capital flows and the growth of remittances, especially since 2005 (see Figure 1).
Figure 1. Sub-Saharan Africa: External Flows (1990-2012, in USD billions)
0
20
40
60
80
100
120
140
1990
1991
1992
1993
1994
1995
1996
1997
1998
1999
2000
2001
2002
2003
2004
2005
2006
2007
2008
2009
2010
2011
2012
Official development assistance Remittances Private capital flows
BIL
LIO
NS
US
D
Sources: IMF, World Bank, and authors’ calculations.
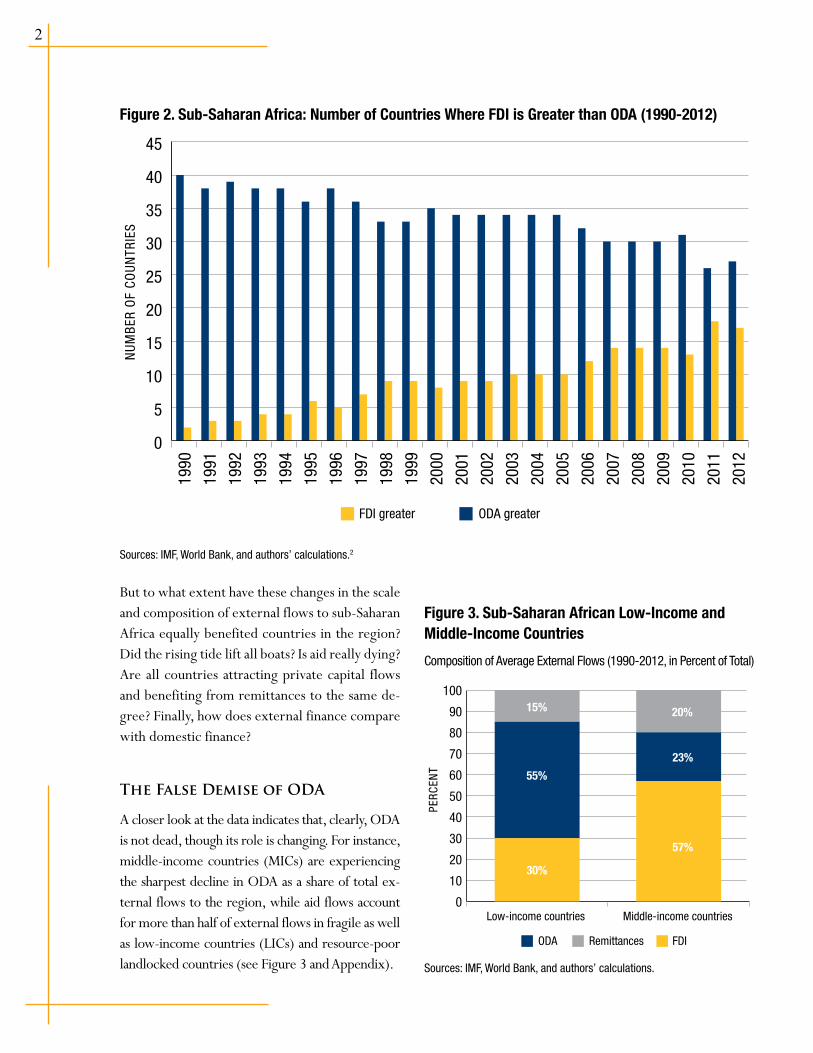
As also displayed in Figure 1, in 1990 the composition of external flows to sub-Saharan Africa was about 62 percent ODA, 31 percent gross inflows from the private sector, and about 7 percent remittances. However, by 2012, ODA accounted for about 22 percent of external flows to Africa, a share comparable to that of remittanc-es (24 percent) and less than half the share of gross private capital flows (54 percent). Also notably, in 1990, FDI flows were greater than ODA flows in only two countries (Liberia and Nigeria) in sub-Saharan Africa excluding South Africa, but 22 years later, 17 countries received more FDI than ODA in 2012—suggesting that sub-Saha-ran African countries are increasingly becoming less aid dependent (see Figure 2).
2
Figure 2. Sub-Saharan Africa: Number of Countries Where FDI is Greater than ODA (1990-2012)
0
5
10
15
20
25
30
35
40
45
1990
1991
1992
1993
1994
1995
1996
1997
1998
1999
2000
2001
2002
2003
2004
2005
2006
2007
2008
2009
2010
2011
2012
FDI greater ODA greater
NUM
BER
OF
COUN
TRIE
S
Sources: IMF, World Bank, and authors’ calculations.2
But to what extent have these changes in the scale and composition of external flows to sub-Saharan Africa equally benefited countries in the region? Did the rising tide lift all boats? Is aid really dying? Are all countries attracting private capital flows and benefiting from remittances to the same de-gree? Finally, how does external finance compare with domestic finance?
The False Demise of ODA
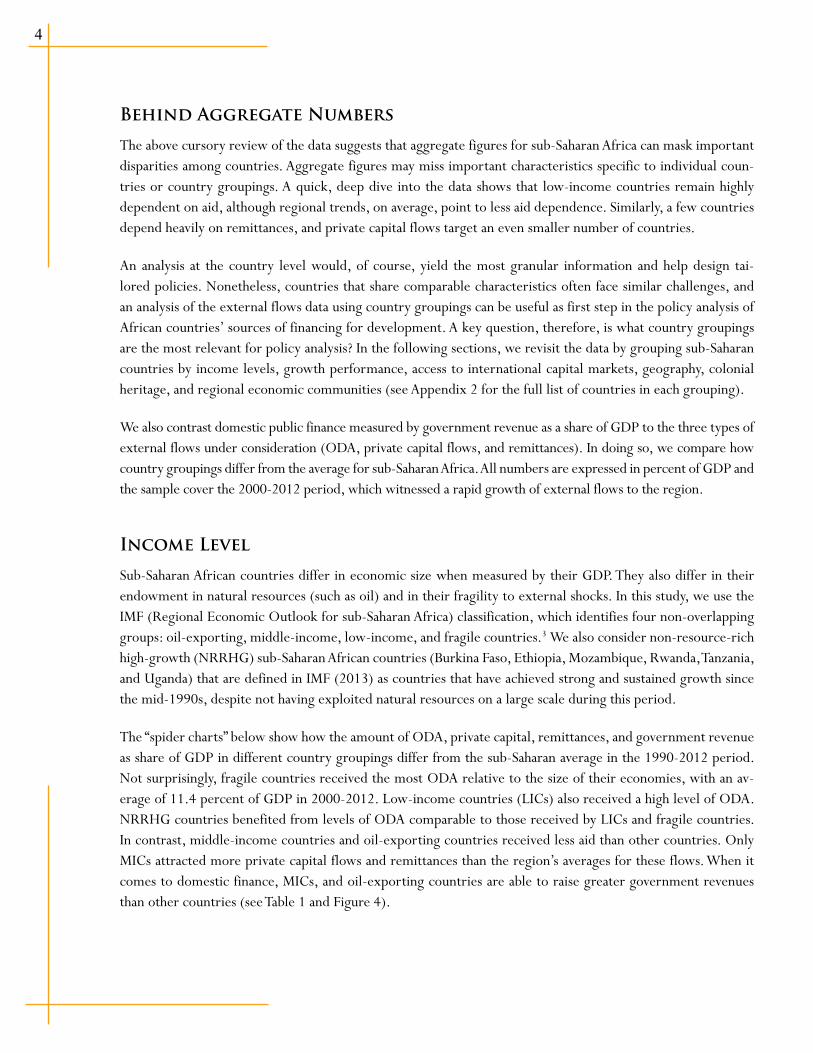
A closer look at the data indicates that, clearly, ODA is not dead, though its role is changing. For instance, middle-income countries (MICs) are experiencing the sharpest decline in ODA as a share of total ex-ternal flows to the region, while aid flows account for more than half of external flows in fragile as well as low-income countries (LICs) and resource-poor landlocked countries (see Figure 3 and Appendix).
Figure 3. Sub-Saharan African Low-Income and Middle-Income Countries
Composition of Average External Flows (1990-2012, in Percent of Total)
0
10
20
30
40
50
60
70
80
90
10015% 20%
23%
57%
55%
30%
Low-income countries Middle-income countries
FDI ODA Remittances
PERC
ENT
Sources: IMF, World Bank, and authors’ calculations.

3
The Concentration of Private Capital Flows
The data also show that private capital flows to sub-Saharan Africa over the period of 2001-2012 have mostly benefited two countries—South Africa and Nigeria—which accounted for 45 percent and 13 percent of total private flows to sub-Saharan Africa, respectively. These two countries have attracted the most flows in part be-cause they are the largest in sub-Saharan Africa, together making up more than half of the region’s GDP.
The small number of countries that are able to attract large private capital flows is also evident in foreign direct investment (FDI)—its largest component. From 1990 to 2000, half of total FDI to sub-Saharan Africa went to South Africa (29 percent) and Nigeria (21 percent). This trend has not changed: Between 2001 and 2012, the top 10 recipient countries received 85 percent of the total FDI inflows to the region.
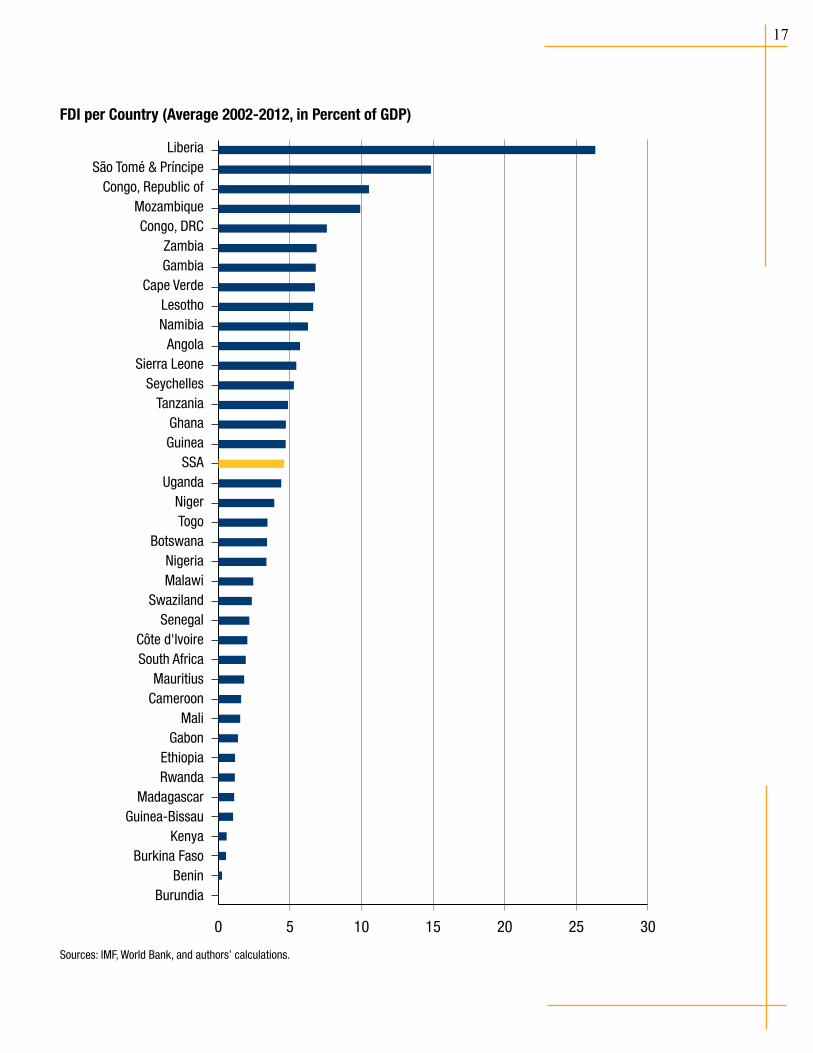
In contrast, it is difficult to discern a strong pattern when FDI is scaled by GDP. Some small economies have the highest FDI to GDP ratios in sub-Saharan Africa. Liberia—a fragile country with a small economy—tops the list with FDI inflows at 26 percent of its GDP, on average, between 2000 and 2012, followed by São Tomé and Príncipe. Other small economies such as the Gambia, Cape Verde, Lesotho, and Sierra Leone have also attracted relatively large amounts of FDI as a share of GDP. But the list of the top 10 recipients of FDI in sub-Saharan Africa also include larger economies such as Mozambique, the Democratic Republic of the Congo, the Republic of the Congo, Zambia, and Namibia (see Appendix 1).
Portfolio flows have also been increasing recently, though they remain concentrated in South Africa: That coun-try received 96 percent of the portfolio flows to the region in 1990-2000. However, in 2001-2012, the issuance of sovereign bonds by a number of countries and increased interest by investors has led to a more diversified recipient base for portfolio flows. South Africa’s share of the total fell to 59 percent, whereas Nigeria’s increased to 24 percent, and other countries like Mauritius (14 percent) emerged on the scene (see Appendix 1).
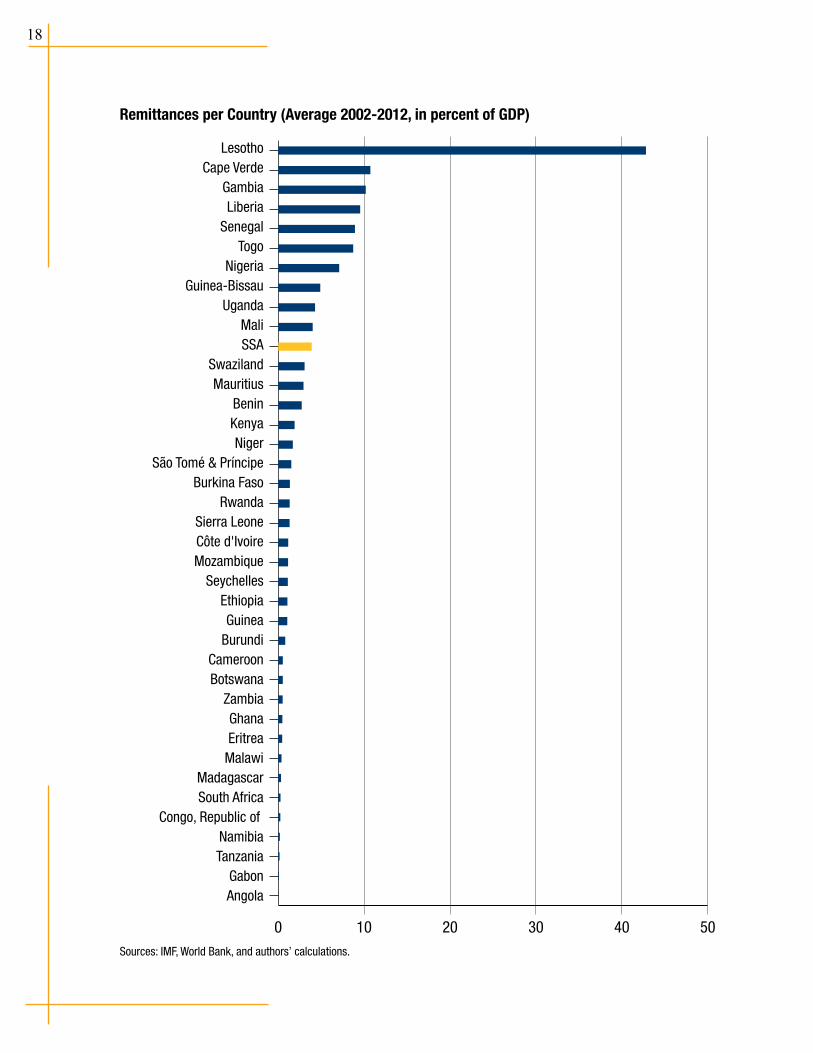
The Potential of Remittances
Remittances to sub-Saharan Africa have increased substantially, reaching about 3 percent of GDP in 2012. In fact, the volume of remittance flows to Africa has increased from $20 billion in 2005 to $30 billion in 2012. The true amount of remittances is likely to be higher, though, as these official statistics do not account for informal remittances.
In terms of volume, Nigeria was the largest recipient of remittances in the region from 1990 to 2012. However, in terms of share of GDP, Lesotho was the most remittance-dependent country, with flows reaching 41 percent of GDP between 2002 and 2012. Other countries with high remittance flows when scaled to the size of their economies include Cape Verde, Gambia, Liberia, Senegal, Togo, and Nigeria—between 5 percent and 10 per-cent of their GDP.
4
Behind Aggregate Numbers
The above cursory review of the data suggests that aggregate figures for sub-Saharan Africa can mask important disparities among countries. Aggregate figures may miss important characteristics specific to individual coun-tries or country groupings. A quick, deep dive into the data shows that low-income countries remain highly dependent on aid, although regional trends, on average, point to less aid dependence. Similarly, a few countries depend heavily on remittances, and private capital flows target an even smaller number of countries.
An analysis at the country level would, of course, yield the most granular information and help design tai-lored policies. Nonetheless, countries that share comparable characteristics often face similar challenges, and an analysis of the external flows data using country groupings can be useful as first step in the policy analysis of African countries’ sources of financing for development. A key question, therefore, is what country groupings are the most relevant for policy analysis? In the following sections, we revisit the data by grouping sub-Saharan countries by income levels, growth performance, access to international capital markets, geography, colonial heritage, and regional economic communities (see Appendix 2 for the full list of countries in each grouping).
We also contrast domestic public finance measured by government revenue as a share of GDP to the three types of external flows under consideration (ODA, private capital flows, and remittances). In doing so, we compare how country groupings differ from the average for sub-Saharan Africa. All numbers are expressed in percent of GDP and the sample cover the 2000-2012 period, which witnessed a rapid growth of external flows to the region.
Income Level
Sub-Saharan African countries differ in economic size when measured by their GDP. They also differ in their endowment in natural resources (such as oil) and in their fragility to external shocks. In this study, we use the IMF (Regional Economic Outlook for sub-Saharan Africa) classification, which identifies four non-overlapping groups: oil-exporting, middle-income, low-income, and fragile countries.3 We also consider non-resource-rich high-growth (NRRHG) sub-Saharan African countries (Burkina Faso, Ethiopia, Mozambique, Rwanda, Tanzania, and Uganda) that are defined in IMF (2013) as countries that have achieved strong and sustained growth since the mid-1990s, despite not having exploited natural resources on a large scale during this period.
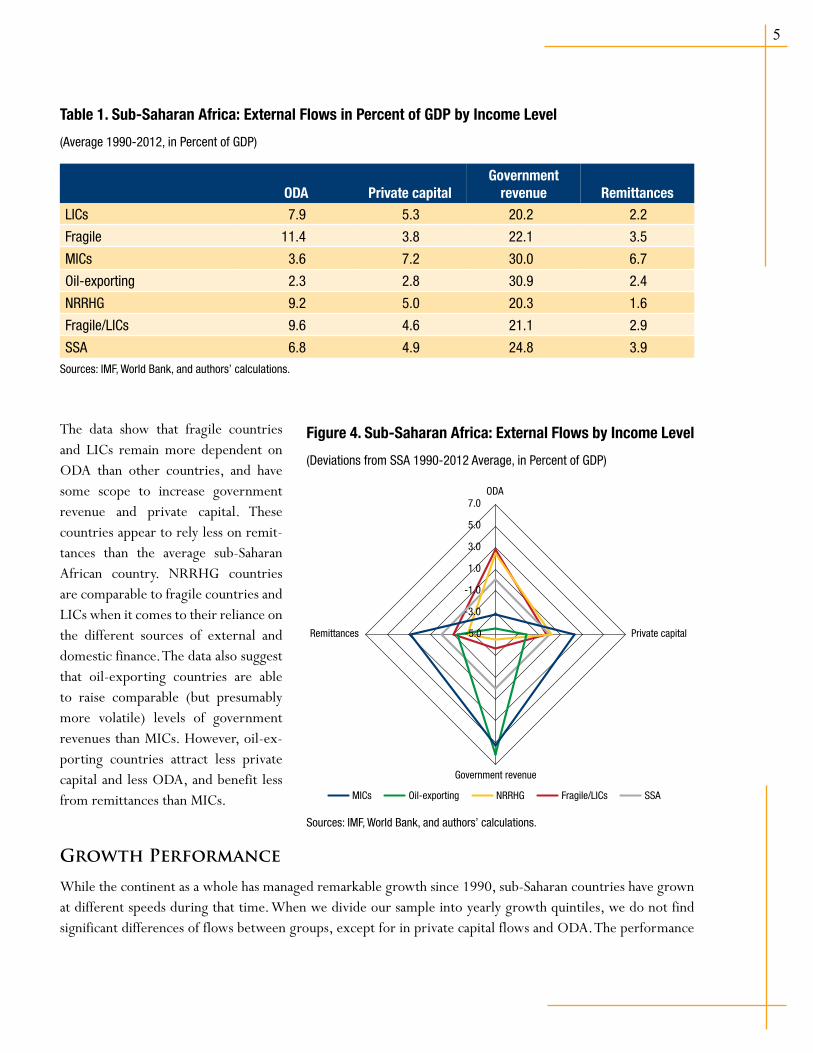
The “spider charts” below show how the amount of ODA, private capital, remittances, and government revenue as share of GDP in different country groupings differ from the sub-Saharan average in the 1990-2012 period. Not surprisingly, fragile countries received the most ODA relative to the size of their economies, with an av-erage of 11.4 percent of GDP in 2000-2012. Low-income countries (LICs) also received a high level of ODA. NRRHG countries benefited from levels of ODA comparable to those received by LICs and fragile countries. In contrast, middle-income countries and oil-exporting countries received less aid than other countries. Only MICs attracted more private capital flows and remittances than the region’s averages for these flows. When it comes to domestic finance, MICs, and oil-exporting countries are able to raise greater government revenues than other countries (see Table 1 and Figure 4).
5
Table 1. Sub-Saharan Africa: External Flows in Percent of GDP by Income Level
(Average 1990-2012, in Percent of GDP)
ODA Private capitalGovernment
revenue RemittancesLICs 7.9 5.3 20.2 2.2
Fragile 11.4 3.8 22.1 3.5
MICs 3.6 7.2 30.0 6.7
Oil-exporting 2.3 2.8 30.9 2.4
NRRHG 9.2 5.0 20.3 1.6
Fragile/LICs 9.6 4.6 21.1 2.9
SSA 6.8 4.9 24.8 3.9Sources: IMF, World Bank, and authors’ calculations.
The data show that fragile countries and LICs remain more dependent on ODA than other countries, and have some scope to increase government revenue and private capital. These countries appear to rely less on remit-tances than the average sub-Saharan African country. NRRHG countries are comparable to fragile countries and LICs when it comes to their reliance on the different sources of external and domestic finance. The data also suggest that oil-exporting countries are able to raise comparable (but presumably more volatile) levels of government revenues than MICs. However, oil-ex-porting countries attract less private capital and less ODA, and benefit less from remittances than MICs.
Growth Performance
While the continent as a whole has managed remarkable growth since 1990, sub-Saharan countries have grown at different speeds during that time. When we divide our sample into yearly growth quintiles, we do not find significant differences of flows between groups, except for in private capital flows and ODA. The performance
Figure 4. Sub-Saharan Africa: External Flows by Income Level
(Deviations from SSA 1990-2012 Average, in Percent of GDP)
Fragile/LICs
-3.0
-1.0
1.0
3.0
5.0
7.0
-5.0
ODA
Private capital
Government revenue
Remittances
MICs Oil-exporting NRRHG SSA
Sources: IMF, World Bank, and authors’ calculations.

6
of countries in raising government revenues and benefiting from remittances are comparable. However, we find that countries that grew the fastest received the most private capital flows as a share of GDP. Interestingly, these same countries attracted the most ODA. Countries such as Liberia (before the Ebola outbreak) and Mozam-bique, for instance, grew very fast and, at the same time, received private capital flows (mostly FDI) in excess of 10 percent of GDP, and were large recipients of ODA.4 Growth performance, except for in the fastest-growing countries, does not seem to be associated with the levels of external and domestic financing as a share of GDP (see Table 2 and Figure 5).5
Table 2. Sub-Saharan Africa: External Flows in Percent of GDP by Growth Quintile
(Average 1990-2012, in Percent of GDP)
ODAPrivate capital
flowsGovernment
revenue RemittancesQuintile 1 5.7 4.1 20.4 2.4
Quintile 2 4.8 2.8 25.8 4.4
Quintile 3 5.7 3.5 26.5 4.7
Quintile 4 3.5 5.3 23.5 3.6
Quintile 5 9.3 6.4 25.3 3.2
SSA 6.8 4.6 24.8 3.9Sources: IMF, World Bank, and authors’ calculations.
Access to International Capital Markets
African countries are increasingly access-ing international capital markets to issue foreign-currency (mostly U.S. dollars) denominated bonds. Whereas only South Africa issued sovereign bonds before 2006, an increasing number of sub-Saha-ran countries have tapped offshore finan-cial (eurobond) market.6 A pre-requisite for such borrowing is the attribution of a sovereign credit rating by an interna-tional credit agency. It is useful to analyze how countries that have accessed interna-tional capital markets and those that have obtained a sovereign credit rating differ from the average sub-Saharan country, in terms of access to external finance and government revenues.
Figure 5. External Flows by Growth Quintile
(Deviations from SSA 1990-2012 Average, in Percent of GDP)
-4.0
-6.0
-2.0
0.0
2.0
4.0ODA
Private capital
Government revenue
Remittances
Q1 Q2 Q3 Q4 Q5 SSA
Sources: IMF, World Bank, and authors’ calculations.
7
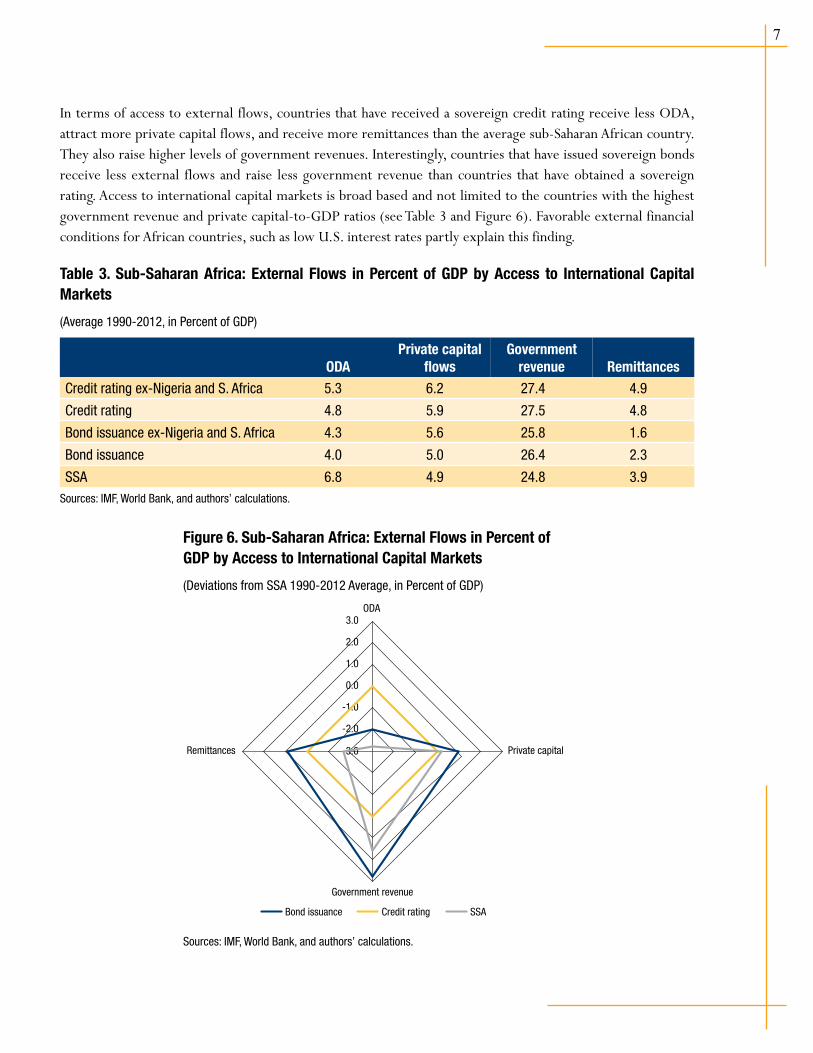
In terms of access to external flows, countries that have received a sovereign credit rating receive less ODA, attract more private capital flows, and receive more remittances than the average sub-Saharan African country. They also raise higher levels of government revenues. Interestingly, countries that have issued sovereign bonds receive less external flows and raise less government revenue than countries that have obtained a sovereign rating. Access to international capital markets is broad based and not limited to the countries with the highest government revenue and private capital-to-GDP ratios (see Table 3 and Figure 6). Favorable external financial conditions for African countries, such as low U.S. interest rates partly explain this finding.
Table 3. Sub-Saharan Africa: External Flows in Percent of GDP by Access to International Capital Markets
(Average 1990-2012, in Percent of GDP)
ODAPrivate capital
flowsGovernment
revenue RemittancesCredit rating ex-Nigeria and S. Africa 5.3 6.2 27.4 4.9
Credit rating 4.8 5.9 27.5 4.8
Bond issuance ex-Nigeria and S. Africa 4.3 5.6 25.8 1.6
Bond issuance 4.0 5.0 26.4 2.3
SSA 6.8 4.9 24.8 3.9Sources: IMF, World Bank, and authors’ calculations.
Figure 6. Sub-Saharan Africa: External Flows in Percent of GDP by Access to International Capital Markets
(Deviations from SSA 1990-2012 Average, in Percent of GDP)
-2.0
-3.0
-1.0
0.0
1.0
2.0
3.0ODA
Private capital
Government revenue
Remittances
Bond issuance SSACredit rating
Sources: IMF, World Bank, and authors’ calculations.
8
Physical Geography
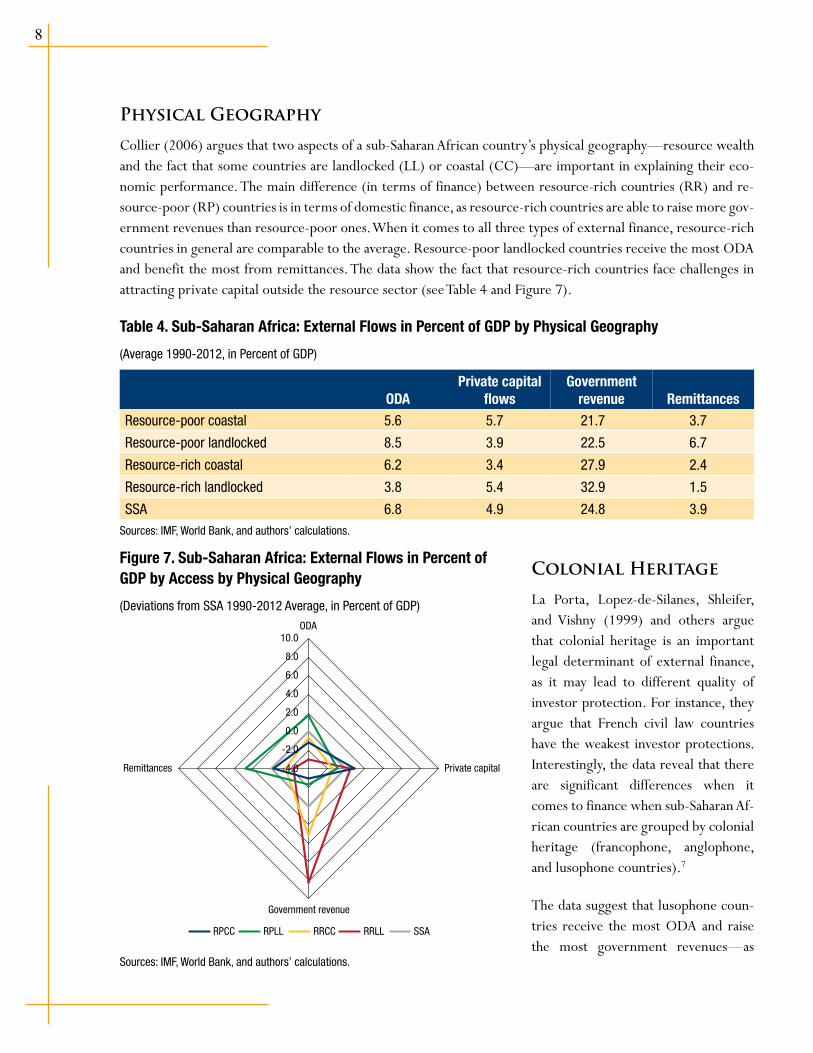
Collier (2006) argues that two aspects of a sub-Saharan African country’s physical geography—resource wealth and the fact that some countries are landlocked (LL) or coastal (CC)—are important in explaining their eco-nomic performance. The main difference (in terms of finance) between resource-rich countries (RR) and re-source-poor (RP) countries is in terms of domestic finance, as resource-rich countries are able to raise more gov-ernment revenues than resource-poor ones. When it comes to all three types of external finance, resource-rich countries in general are comparable to the average. Resource-poor landlocked countries receive the most ODA and benefit the most from remittances. The data show the fact that resource-rich countries face challenges in attracting private capital outside the resource sector (see Table 4 and Figure 7).
Table 4. Sub-Saharan Africa: External Flows in Percent of GDP by Physical Geography
(Average 1990-2012, in Percent of GDP)
ODAPrivate capital
flowsGovernment
revenue RemittancesResource-poor coastal 5.6 5.7 21.7 3.7
Resource-poor landlocked 8.5 3.9 22.5 6.7
Resource-rich coastal 6.2 3.4 27.9 2.4
Resource-rich landlocked 3.8 5.4 32.9 1.5
SSA 6.8 4.9 24.8 3.9Sources: IMF, World Bank, and authors’ calculations.
Colonial Heritage
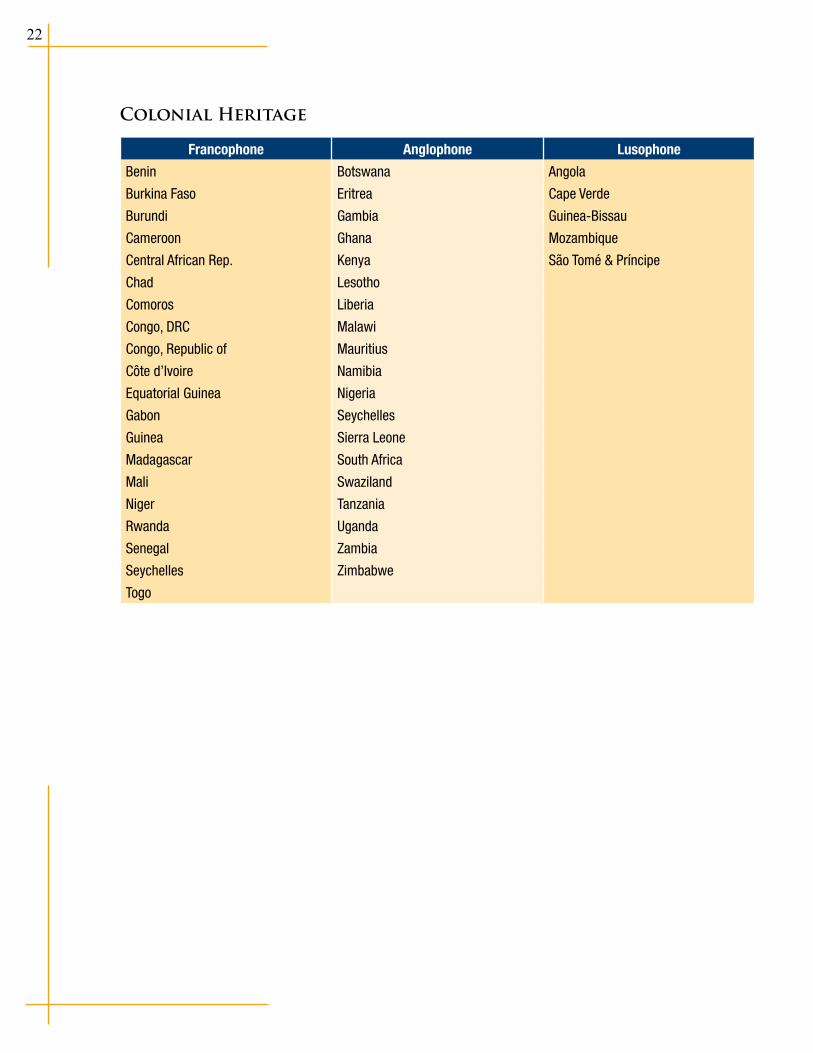
La Porta, Lopez-de-Silanes, Shleifer, and Vishny (1999) and others argue that colonial heritage is an important legal determinant of external finance, as it may lead to different quality of investor protection. For instance, they argue that French civil law countries have the weakest investor protections. Interestingly, the data reveal that there are significant differences when it comes to finance when sub-Saharan Af-rican countries are grouped by colonial heritage (francophone, anglophone, and lusophone countries).7
The data suggest that lusophone coun-tries receive the most ODA and raise the most government revenues—as
Figure 7. Sub-Saharan Africa: External Flows in Percent of GDP by Access by Physical Geography
(Deviations from SSA 1990-2012 Average, in Percent of GDP)
-2.0
-4.0
0.0
2.0
4.0
6.0
8.0
10.0ODA
Private capital
Government revenue
Remittances
RPCC RPLL RRCC RRLL SSA
Sources: IMF, World Bank, and authors’ calculations.

9
seen in the performances of Mozambique and Angola. Both are resource rich, and Mozambique has received large amounts of ODA. In contrast, anglophone countries are comparable to the average sub-Saharan African country, whereas francophone countries are below regional averages for all types of flows. However, colonial heritage alone cannot explain the performance of francophone countries as they include a relatively heteroge-neous group of countries (see Table 5 and Figure 8). Separating francophone countries into sub-groups such as regional economic communities (RECs) can therefore yield useful insights. The next section, which compares the performance of a number of RECS, explores the differences between the two francophone regions: the Eco-nomic Community of Central African States (ECCAS/CEMAC) and the West African Economic and Monetary Union (WAEMU/UEMOA).
Table 5. Sub-Saharan Africa: External Flows in Percent of GDP by Colonial Heritage
(Average 1990-2012, in Percent of GDP)
ODAPrivate capital
flowsGovernment
revenue RemittancesLusophone 11.0 6.2 32.3 4.3
Anglophone 6.2 5.5 26.0 5.0
Francophone 6.1 3.7 22.8 2.6
SSA 6.8 4.9 24.8 3.9Sources: IMF, World Bank, and authors’ calculations.
Regional Economic Communities
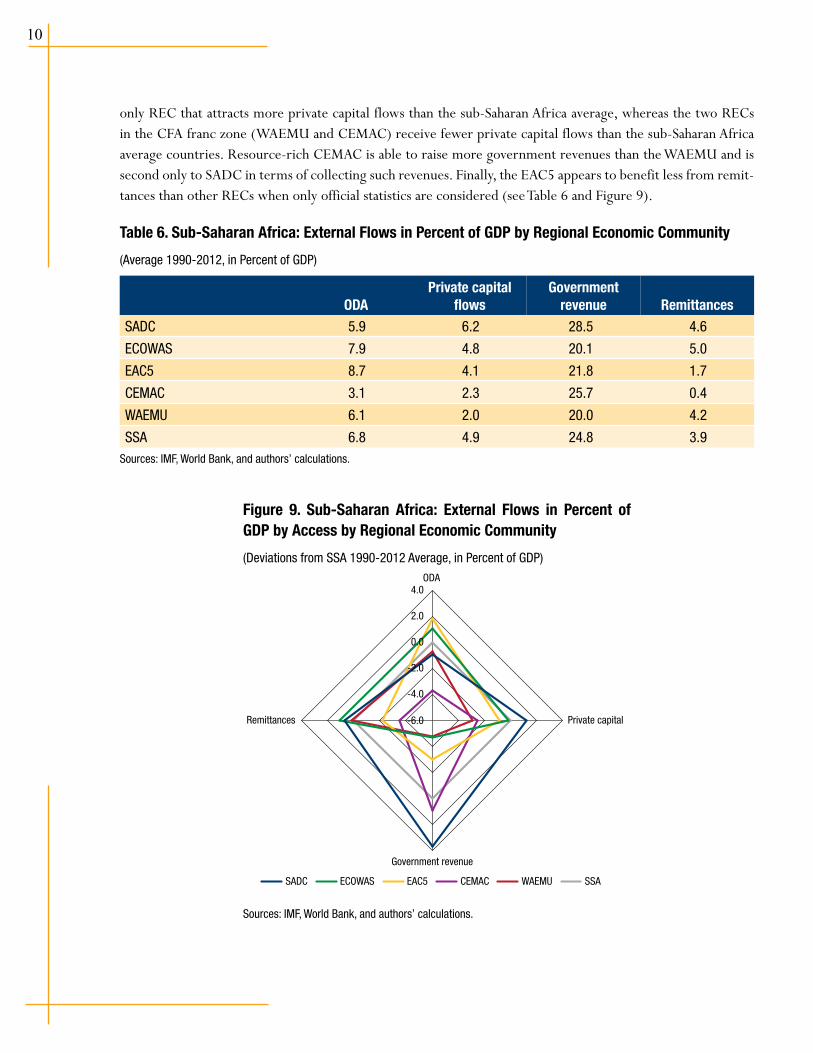
It may be useful to focus on the perfor-mance of regional economic commu-nities (RECs) in sub-Saharan Africa, as they provide an institutional framework that facilitates policy discussion and im-plementation. The data suggest that the five countries of the Eastern African Community (EAC5) and the Econom-ic Community of West African States (ECOWAS) receive the most ODA as a share of GDP while the Economic Community of Central African States (CEMAC) receives the least ODA. The West African Economic and Monetary Union (WAEMU) and Southern African Development Community (SADC) are comparable in terms of ODA. SADC (which includes South Africa) is the
Figure 8. Sub-Saharan Africa: External Flows in Percent of GDP by Access by Colonial Heritage
(Deviations from SSA 1990-2012 Average, in Percent of GDP)
0.0
-2.0
2.0
4.0
6.0
8.0ODA
Private capital
Government revenue
Remittances
Luso Anglo SSAFranco
Sources: IMF, World Bank, and authors’ calculations.
10
only REC that attracts more private capital flows than the sub-Saharan Africa average, whereas the two RECs in the CFA franc zone (WAEMU and CEMAC) receive fewer private capital flows than the sub-Saharan Africa average countries. Resource-rich CEMAC is able to raise more government revenues than the WAEMU and is second only to SADC in terms of collecting such revenues. Finally, the EAC5 appears to benefit less from remit-tances than other RECs when only official statistics are considered (see Table 6 and Figure 9).
Table 6. Sub-Saharan Africa: External Flows in Percent of GDP by Regional Economic Community
(Average 1990-2012, in Percent of GDP)
ODAPrivate capital
flowsGovernment
revenue RemittancesSADC 5.9 6.2 28.5 4.6
ECOWAS 7.9 4.8 20.1 5.0
EAC5 8.7 4.1 21.8 1.7
CEMAC 3.1 2.3 25.7 0.4
WAEMU 6.1 2.0 20.0 4.2
SSA 6.8 4.9 24.8 3.9Sources: IMF, World Bank, and authors’ calculations.
Figure 9. Sub-Saharan Africa: External Flows in Percent of GDP by Access by Regional Economic Community
(Deviations from SSA 1990-2012 Average, in Percent of GDP)
-2.0
0.0
2.0
4.0
-4.0
-6.0
ODA
Private capital
Government revenue
Remittances
SADC ECOWAS CEMAC WAEMU SSAEAC5
Sources: IMF, World Bank, and authors’ calculations.
11
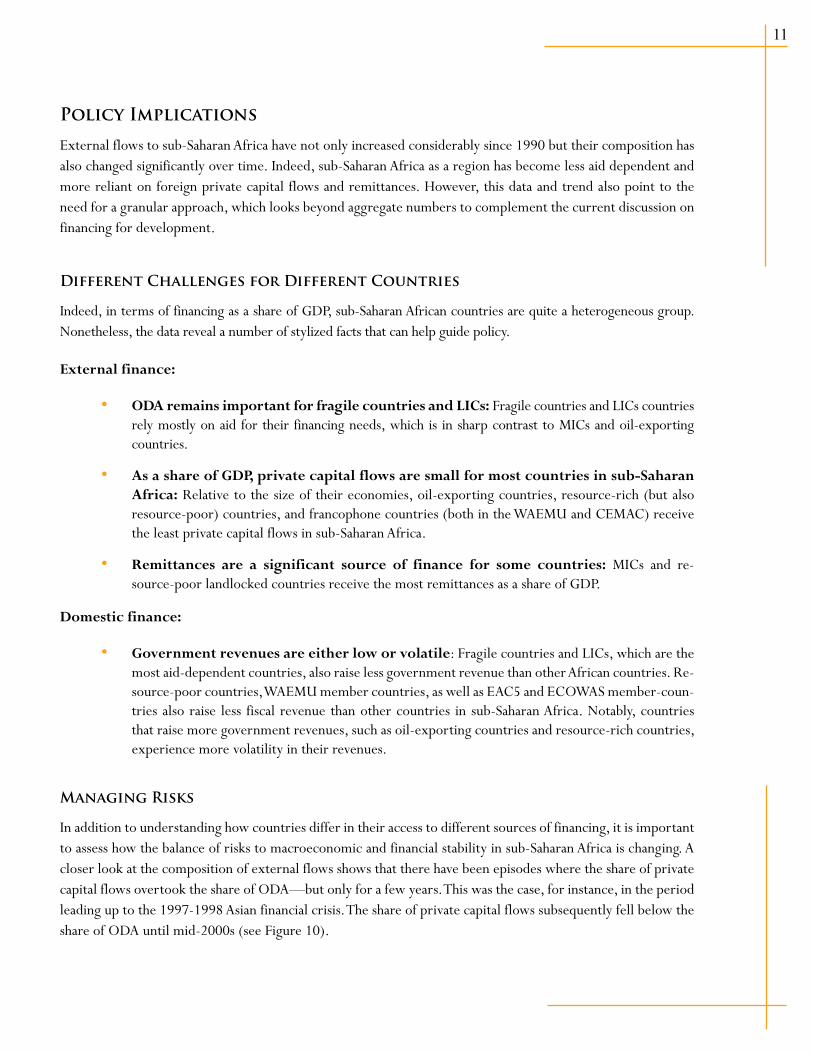
Policy Implications
External flows to sub-Saharan Africa have not only increased considerably since 1990 but their composition has also changed significantly over time. Indeed, sub-Saharan Africa as a region has become less aid dependent and more reliant on foreign private capital flows and remittances. However, this data and trend also point to the need for a granular approach, which looks beyond aggregate numbers to complement the current discussion on financing for development.
Different Challenges for Different Countries
Indeed, in terms of financing as a share of GDP, sub-Saharan African countries are quite a heterogeneous group. Nonetheless, the data reveal a number of stylized facts that can help guide policy.
External finance:
• ODA remains important for fragile countries and LICs: Fragile countries and LICs countries rely mostly on aid for their financing needs, which is in sharp contrast to MICs and oil-exporting countries.
• As a share of GDP, private capital flows are small for most countries in sub-Saharan Africa: Relative to the size of their economies, oil-exporting countries, resource-rich (but also resource-poor) countries, and francophone countries (both in the WAEMU and CEMAC) receive the least private capital flows in sub-Saharan Africa.
• Remittances are a significant source of finance for some countries: MICs and re-source-poor landlocked countries receive the most remittances as a share of GDP.
Domestic finance:
• Government revenues are either low or volatile: Fragile countries and LICs, which are the most aid-dependent countries, also raise less government revenue than other African countries. Re-source-poor countries, WAEMU member countries, as well as EAC5 and ECOWAS member-coun-tries also raise less fiscal revenue than other countries in sub-Saharan Africa. Notably, countries that raise more government revenues, such as oil-exporting countries and resource-rich countries, experience more volatility in their revenues.
Managing Risks
In addition to understanding how countries differ in their access to different sources of financing, it is important to assess how the balance of risks to macroeconomic and financial stability in sub-Saharan Africa is changing. A closer look at the composition of external flows shows that there have been episodes where the share of private capital flows overtook the share of ODA—but only for a few years. This was the case, for instance, in the period leading up to the 1997-1998 Asian financial crisis. The share of private capital flows subsequently fell below the share of ODA until mid-2000s (see Figure 10).

12
Figure 10. Sub-Saharan Africa: Composition of External Flows (1990-2012)
1990
1991
1992
1993
1994
1995
1996
1997
1998
1999
2000
2001
2002
2003
2004
2005
2006
2007
2008
2009
2010
2011
2012
Official development assistance Remittances Private capital flows
0
10
20
30
40
50
60
70
80
90
100PE
RCEN
T
Sources: IMF, World Bank, and authors’ calculations.
The increase in private capital flows to sub-Saharan Africa, especially portfolio flows, is likely to increase vul-nerabilities, as these flows have been historically more volatile than ODA and remittances. They also strengthen the financial linkages between sub-Saharan Africa and the rest of the global economy. On the other hand, private capital flows are helping reduce the large financing gap for achieving sustainable development goals, especially in infrastructure. Furthermore, the resulting increased vulnerability to external shocks may be somewhat mitigat-ed by the increase in remittances, which have been more stable than private capital flows. Assessing the volatility and degree of complementarity and substitutability of the different components of external flows is a first step towards a better understanding of the changing balance of risks.
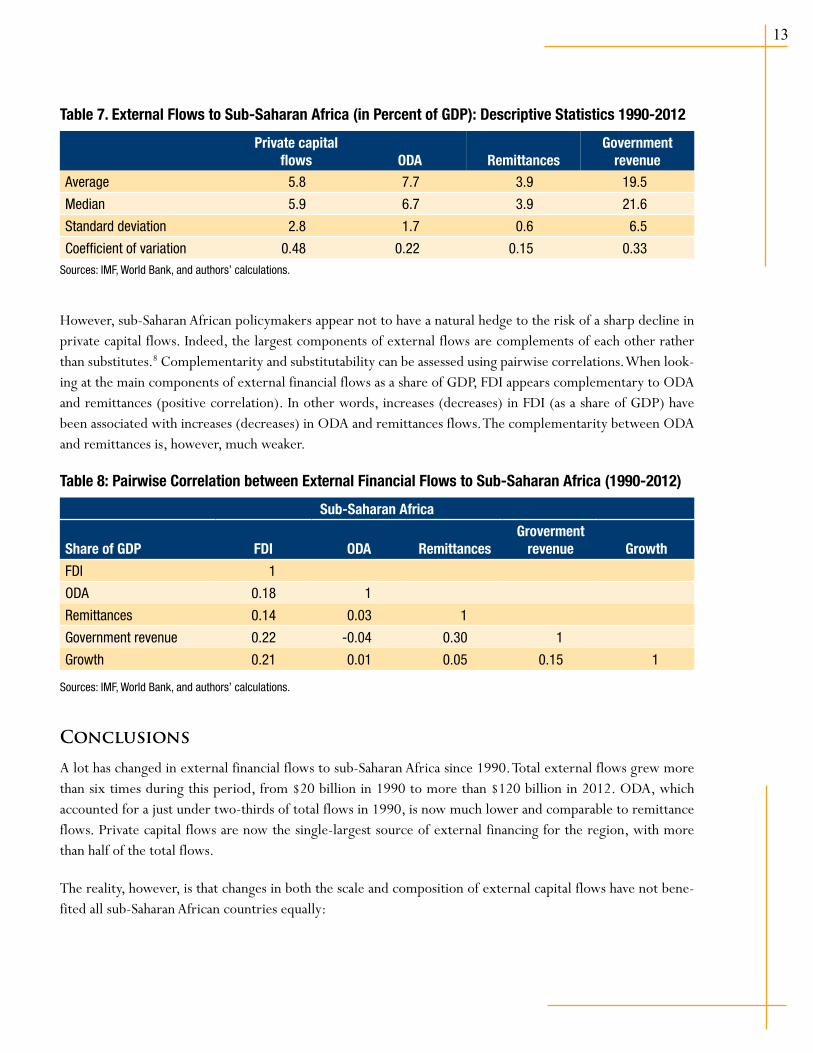
The data suggest that sub-Saharan African policymakers should prioritize the management of risks stemming from private capital flows that, not surprisingly, are more volatile than ODA and remittances. Comparing the coefficient of variation (standard deviation divided by average) of the different components of external flows (as a share of GDP) during 1990-2012 shows that private capital flows are more volatile than both ODA and re-mittances. Moreover, remittances are the least volatile flows. Government revenues are also more volatile than ODA and remittances, as a number of resource-rich countries depend on volatile fiscal revenues.
13
Table 7. External Flows to Sub-Saharan Africa (in Percent of GDP): Descriptive Statistics 1990-2012
Private capital flows ODA Remittances
Government revenue
Average 5.8 7.7 3.9 19.5
Median 5.9 6.7 3.9 21.6
Standard deviation 2.8 1.7 0.6 6.5
Coefficient of variation 0.48 0.22 0.15 0.33Sources: IMF, World Bank, and authors’ calculations.
However, sub-Saharan African policymakers appear not to have a natural hedge to the risk of a sharp decline in private capital flows. Indeed, the largest components of external flows are complements of each other rather than substitutes.8 Complementarity and substitutability can be assessed using pairwise correlations. When look-ing at the main components of external financial flows as a share of GDP, FDI appears complementary to ODA and remittances (positive correlation). In other words, increases (decreases) in FDI (as a share of GDP) have been associated with increases (decreases) in ODA and remittances flows. The complementarity between ODA and remittances is, however, much weaker.
Table 8: Pairwise Correlation between External Financial Flows to Sub-Saharan Africa (1990-2012)
Sub-Saharan Africa
Share of GDP FDI ODA RemittancesGroverment
revenue Growth
FDI 1
ODA 0.18 1
Remittances 0.14 0.03 1
Government revenue 0.22 -0.04 0.30 1
Growth 0.21 0.01 0.05 0.15 1
Sources: IMF, World Bank, and authors’ calculations.
Conclusions
A lot has changed in external financial flows to sub-Saharan Africa since 1990. Total external flows grew more than six times during this period, from $20 billion in 1990 to more than $120 billion in 2012. ODA, which accounted for a just under two-thirds of total flows in 1990, is now much lower and comparable to remittance flows. Private capital flows are now the single-largest source of external financing for the region, with more than half of the total flows.
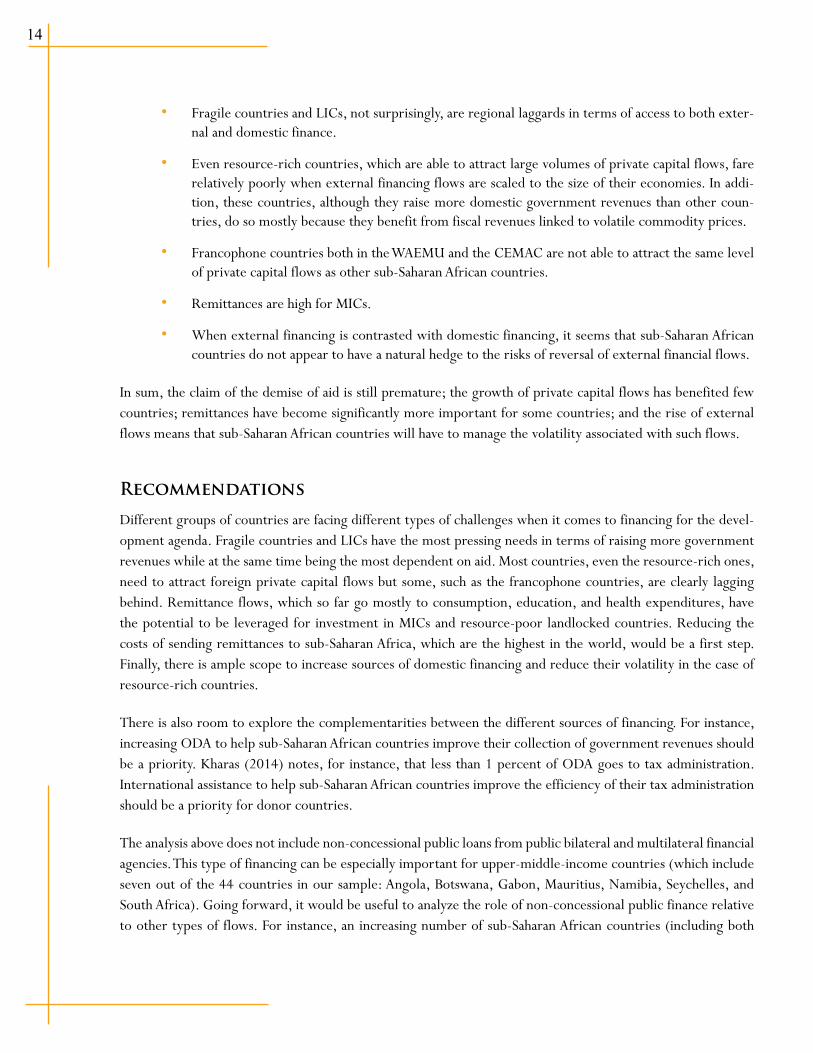
The reality, however, is that changes in both the scale and composition of external capital flows have not bene-fited all sub-Saharan African countries equally:
14
• Fragile countries and LICs, not surprisingly, are regional laggards in terms of access to both exter-nal and domestic finance.
• Even resource-rich countries, which are able to attract large volumes of private capital flows, fare relatively poorly when external financing flows are scaled to the size of their economies. In addi-tion, these countries, although they raise more domestic government revenues than other coun-tries, do so mostly because they benefit from fiscal revenues linked to volatile commodity prices.
• Francophone countries both in the WAEMU and the CEMAC are not able to attract the same level of private capital flows as other sub-Saharan African countries.
• Remittances are high for MICs.
• When external financing is contrasted with domestic financing, it seems that sub-Saharan African countries do not appear to have a natural hedge to the risks of reversal of external financial flows.
In sum, the claim of the demise of aid is still premature; the growth of private capital flows has benefited few countries; remittances have become significantly more important for some countries; and the rise of external flows means that sub-Saharan African countries will have to manage the volatility associated with such flows.
Recommendations
Different groups of countries are facing different types of challenges when it comes to financing for the devel-opment agenda. Fragile countries and LICs have the most pressing needs in terms of raising more government revenues while at the same time being the most dependent on aid. Most countries, even the resource-rich ones, need to attract foreign private capital flows but some, such as the francophone countries, are clearly lagging behind. Remittance flows, which so far go mostly to consumption, education, and health expenditures, have the potential to be leveraged for investment in MICs and resource-poor landlocked countries. Reducing the costs of sending remittances to sub-Saharan Africa, which are the highest in the world, would be a first step. Finally, there is ample scope to increase sources of domestic financing and reduce their volatility in the case of resource-rich countries.
There is also room to explore the complementarities between the different sources of financing. For instance, increasing ODA to help sub-Saharan African countries improve their collection of government revenues should be a priority. Kharas (2014) notes, for instance, that less than 1 percent of ODA goes to tax administration. International assistance to help sub-Saharan African countries improve the efficiency of their tax administration should be a priority for donor countries.
The analysis above does not include non-concessional public loans from public bilateral and multilateral financial agencies. This type of financing can be especially important for upper-middle-income countries (which include seven out of the 44 countries in our sample: Angola, Botswana, Gabon, Mauritius, Namibia, Seychelles, and South Africa). Going forward, it would be useful to analyze the role of non-concessional public finance relative to other types of flows. For instance, an increasing number of sub-Saharan African countries (including both

15
upper- and lower-middle-income countries) have relied more on (relatively riskier) private external finance in the form of dollar-denominated sovereign bond issuance rather than access public non-concessional public finance. This trend raises a number of questions regarding the conditions and modalities for sub-Saharan African countries for accessing non-concessional public finance, which need to be re-examined by public bilateral and multilateral institutions. This trend also points to the urgency of strengthening debt management institutions and practices in these countries.

16
APPENDIX 1. SSA: ODA, FDI, and Remittances per Country (Aver-age 2002-2012, in Percent of GDP)
ODA per Country (Average 2002-2012, in Percent of GDP)
0 5 10 15 20 25 30 35
LiberiaCongo, DRC
São Tomé & PríncipeMozambique
BurundiMalawi
Sierra LeoneRwanda
Cape VerdeEritrea
ZambiaMali
TanzaniaGuinea-Bissau
UgandaEthiopia
NigerSSA
Burkina FasoTogo
SenegalBenin
Central African Rep.Madagascar
ZimbabweComoros
GhanaCongo, Republic of
CameroonLesothoGuineaKenya
GambiaCôte d’Ivoire
ChadNamibia
AngolaNigeria
BotswanaSeychellesSwaziland
GabonMauritius
Equatorial GuineaSouth Africa
Sources: IMF, World Bank, and authors’ calculations.
17
FDI per Country (Average 2002-2012, in Percent of GDP)
0 5 10 15 20 25 30
LiberiaSão Tomé & Príncipe
Congo, Republic ofMozambiqueCongo, DRC
ZambiaGambia
Cape VerdeLesothoNamibia
AngolaSierra Leone
SeychellesTanzania
GhanaGuinea
SSAUganda
NigerTogo
BotswanaNigeriaMalawi
SwazilandSenegal
Côte d'IvoireSouth Africa
MauritiusCameroon
MaliGabon
EthiopiaRwanda
MadagascarGuinea-Bissau
KenyaBurkina Faso
BeninBurundia
Sources: IMF, World Bank, and authors’ calculations.
18
Remittances per Country (Average 2002-2012, in percent of GDP)
0 10 20 30 40 50
LesothoCape Verde
GambiaLiberia
SenegalTogo
NigeriaGuinea-Bissau
UgandaMaliSSA
SwazilandMauritius
BeninKenyaNiger
São Tomé & PríncipeBurkina Faso
RwandaSierra LeoneCôte d'IvoireMozambique
SeychellesEthiopiaGuinea
BurundiCameroonBotswana
ZambiaGhanaEritrea
MalawiMadagascarSouth Africa
Congo, Republic of NamibiaTanzania
GabonAngola
Sources: IMF, World Bank, and authors’ calculations.
19
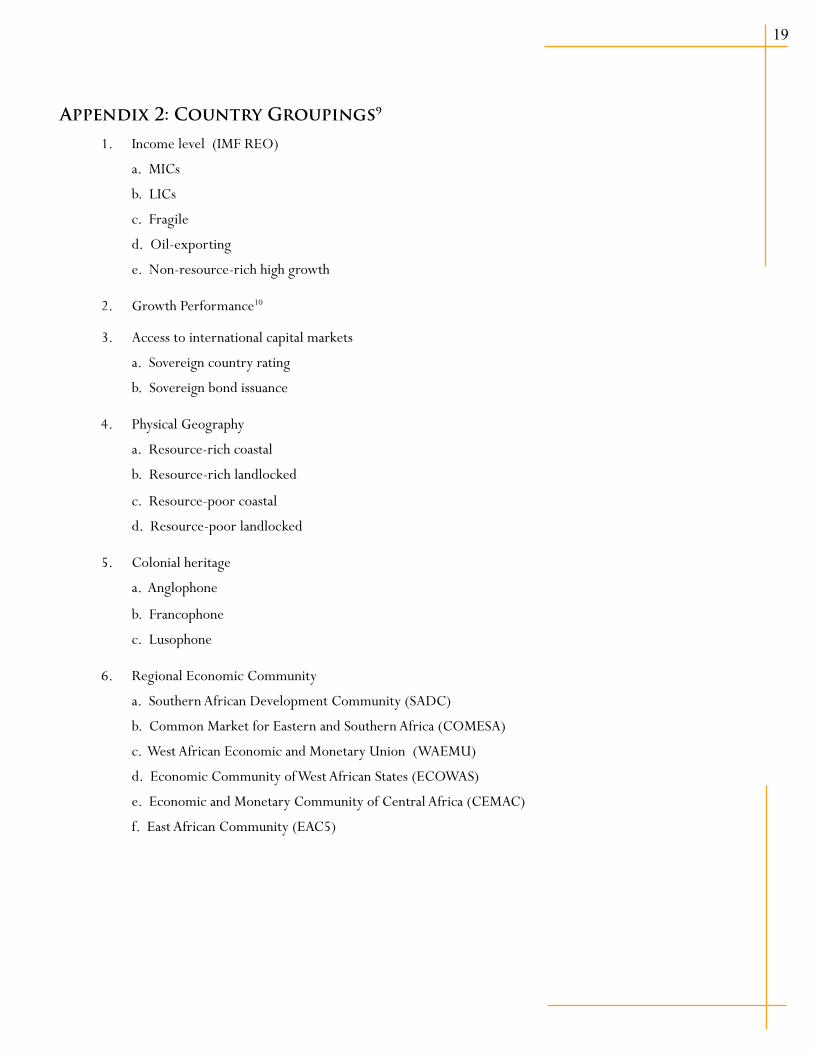
Appendix 2: Country Groupings9
1. Income level (IMF REO)
a. MICs
b. LICs
c. Fragile
d. Oil-exporting
e. Non-resource-rich high growth
2. Growth Performance10
3. Access to international capital markets
a. Sovereign country rating
b. Sovereign bond issuance
4. Physical Geography
a. Resource-rich coastal
b. Resource-rich landlocked
c. Resource-poor coastal
d. Resource-poor landlocked
5. Colonial heritage
a. Anglophone
b. Francophone
c. Lusophone
6. Regional Economic Community
a. Southern African Development Community (SADC)
b. Common Market for Eastern and Southern Africa (COMESA)
c. West African Economic and Monetary Union (WAEMU)
d. Economic Community of West African States (ECOWAS)
e. Economic and Monetary Community of Central Africa (CEMAC)
f. East African Community (EAC5)
20
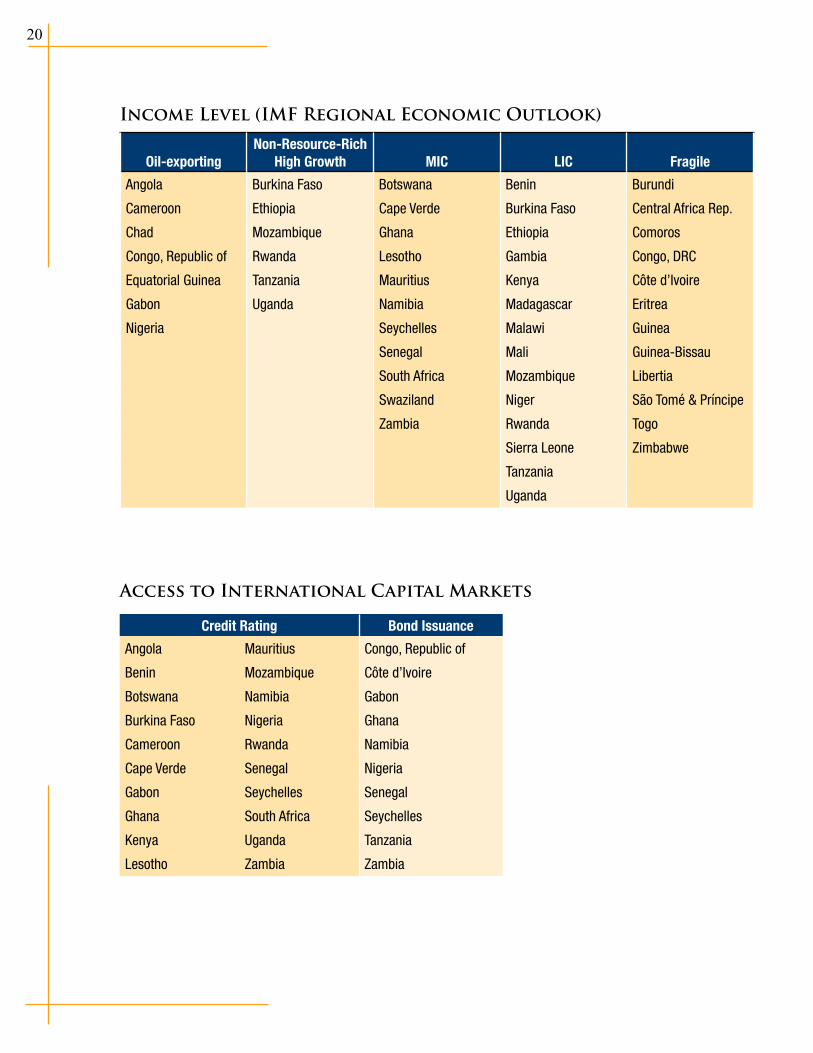
Income Level (IMF Regional Economic Outlook)
Oil-exportingNon-Resource-Rich
High Growth MIC LIC Fragile
Angola Burkina Faso Botswana Benin Burundi
Cameroon Ethiopia Cape Verde Burkina Faso Central Africa Rep.
Chad Mozambique Ghana Ethiopia Comoros
Congo, Republic of Rwanda Lesotho Gambia Congo, DRC
Equatorial Guinea Tanzania Mauritius Kenya Côte d’Ivoire
Gabon Uganda Namibia Madagascar Eritrea
Nigeria Seychelles Malawi Guinea
Senegal Mali Guinea-Bissau
South Africa Mozambique Libertia
Swaziland Niger São Tomé & Príncipe
Zambia Rwanda Togo
Sierra Leone Zimbabwe
Tanzania
Uganda
Access to International Capital Markets
Credit Rating Bond Issuance
Angola Mauritius Congo, Republic of
Benin Mozambique Côte d’Ivoire
Botswana Namibia Gabon
Burkina Faso Nigeria Ghana
Cameroon Rwanda Namibia
Cape Verde Senegal Nigeria
Gabon Seychelles Senegal
Ghana South Africa Seychelles
Kenya Uganda Tanzania
Lesotho Zambia Zambia
21
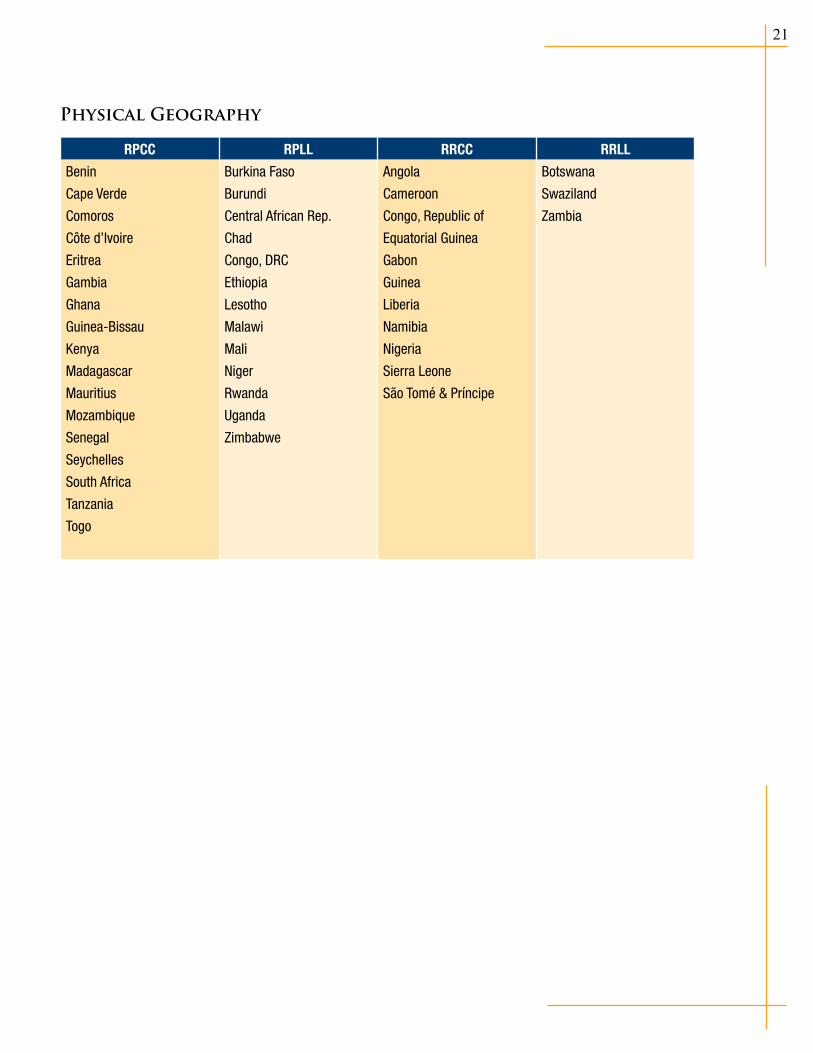
Physical Geography
RPCC RPLL RRCC RRLL
Benin Burkina Faso Angola Botswana
Cape Verde Burundi Cameroon Swaziland
Comoros Central African Rep. Congo, Republic of Zambia
Côte d’Ivoire Chad Equatorial Guinea
Eritrea Congo, DRC Gabon
Gambia Ethiopia Guinea
Ghana Lesotho Liberia
Guinea-Bissau Malawi Namibia
Kenya Mali Nigeria
Madagascar Niger Sierra Leone
Mauritius Rwanda São Tomé & Príncipe
Mozambique Uganda
Senegal Zimbabwe
Seychelles
South Africa
Tanzania
Togo
22
Colonial Heritage
Francophone Anglophone Lusophone
Benin Botswana Angola
Burkina Faso Eritrea Cape Verde
Burundi Gambia Guinea-Bissau
Cameroon Ghana Mozambique
Central African Rep. Kenya São Tomé & Príncipe
Chad Lesotho
Comoros Liberia
Congo, DRC Malawi
Congo, Republic of Mauritius
Côte d’Ivoire Namibia
Equatorial Guinea Nigeria
Gabon Seychelles
Guinea Sierra Leone
Madagascar South Africa
Mali Swaziland
Niger Tanzania
Rwanda Uganda
Senegal Zambia
Seychelles Zimbabwe
Togo

23
Regional Economic Communities
WAEMU CEMAC EAC5 ECOWAS SADC SACU COMESA
Benin Cameroon Burundi Benin Angola Botswana Burundi
Burkina Faso Central African Rep.
Kenya Burkina Faso Botswana Lesotho Comoros
Côte d’Ivoire Chad Rwanda Cape Verde Congo, DRC Namibia Congo, DRC
Guinea-Bissau Congo, Republic of
Tanzania Côte d’Ivoire Lesotho South Africa Eritrea
Mali Equatorial Guinea
Uganda Gambia Madagascar Swaziland Ethiopia
Niger Gabon Guinea Malawi Kenya
Senegal Guinea-Bissau Mauritius Madagascar
Togo Liberia Mozambique Malawi
Mali Namibia Mauritius
Niger Seychelles Rwanda
Nigeria South Africa Seychelles
Senegal Swaziland Swaziland
Sierra Leone Tanzania Uganda
Togo Zambia Zambia
Zimbabwe Zimbabwe
24
References
Bluedorn John, Rupa Duttagupta, Jaime Guajardo, and Petia Topalova (2013). “Capital Flows are Fickle: Anytime, Anywhere,” IMFWP/13/183, Washington DC, www.imf.org/external/pubs/ft/wp/2013/wp13183.pdf
Collier, Paul (2006). “Africa: Geography and Growth”, (Journal TEN, Federal Reserve Bank of Kansas City, Fall)
Kharas, Homi (2014). Financing for Development: International Financial Flows after 2015, Brookings Institution, Washington DC, http://www.brookings.edu/research/papers/2014/07/08-financing-development-in-ternational-financial-flows-kharas
La Porta, Rafael, Florencio Lopez de Silanes, Andrei Shleifer, and Robert Vishny (1999). “The Quality of Govern-ment.” Journal of Law, Economics and Organization 15(1): 222-79
25
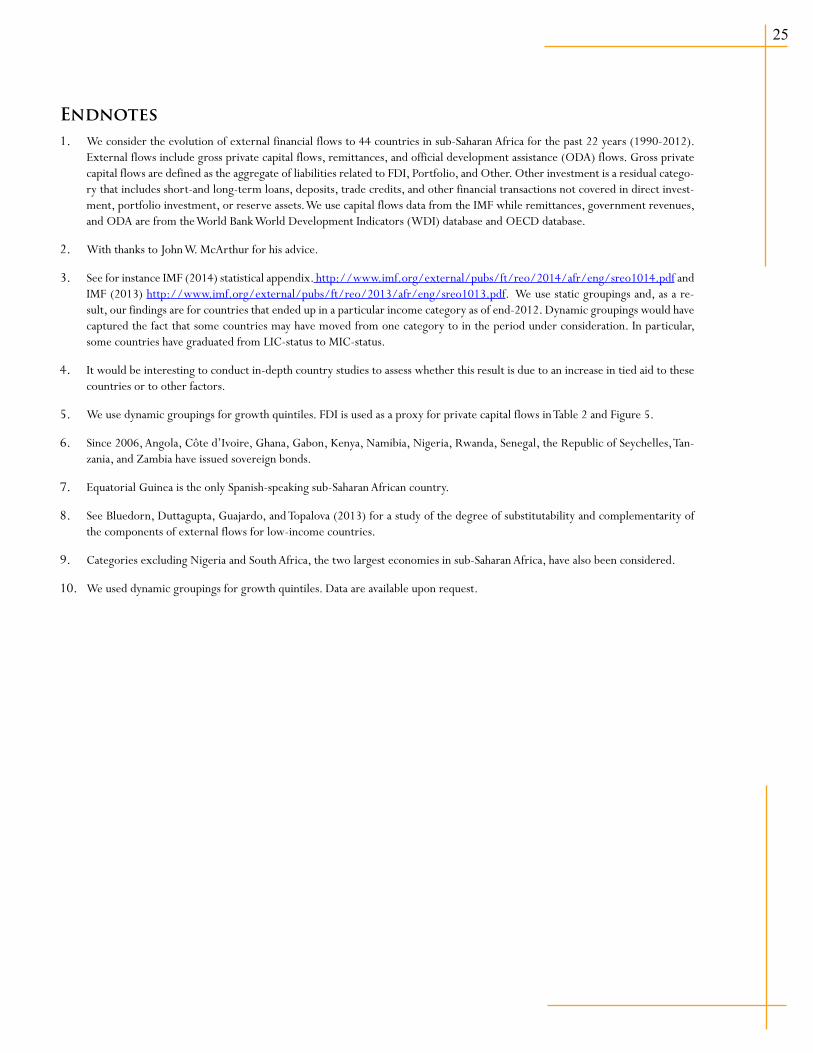
Endnotes1. We consider the evolution of external financial flows to 44 countries in sub-Saharan Africa for the past 22 years (1990-2012).
External flows include gross private capital flows, remittances, and official development assistance (ODA) flows. Gross private capital flows are defined as the aggregate of liabilities related to FDI, Portfolio, and Other. Other investment is a residual catego-ry that includes short-and long-term loans, deposits, trade credits, and other financial transactions not covered in direct invest-ment, portfolio investment, or reserve assets. We use capital flows data from the IMF while remittances, government revenues, and ODA are from the World Bank World Development Indicators (WDI) database and OECD database.
2. With thanks to John W. McArthur for his advice.
3. See for instance IMF (2014) statistical appendix. http://www.imf.org/external/pubs/ft/reo/2014/afr/eng/sreo1014.pdf and IMF (2013) http://www.imf.org/external/pubs/ft/reo/2013/afr/eng/sreo1013.pdf. We use static groupings and, as a re-sult, our findings are for countries that ended up in a particular income category as of end-2012. Dynamic groupings would have captured the fact that some countries may have moved from one category to in the period under consideration. In particular, some countries have graduated from LIC-status to MIC-status.
4. It would be interesting to conduct in-depth country studies to assess whether this result is due to an increase in tied aid to these countries or to other factors.
5. We use dynamic groupings for growth quintiles. FDI is used as a proxy for private capital flows in Table 2 and Figure 5.
6. Since 2006, Angola, Côte d’Ivoire, Ghana, Gabon, Kenya, Namibia, Nigeria, Rwanda, Senegal, the Republic of Seychelles, Tan-zania, and Zambia have issued sovereign bonds.
7. Equatorial Guinea is the only Spanish-speaking sub-Saharan African country.
8. See Bluedorn, Duttagupta, Guajardo, and Topalova (2013) for a study of the degree of substitutability and complementarity of the components of external flows for low-income countries.
9. Categories excluding Nigeria and South Africa, the two largest economies in sub-Saharan Africa, have also been considered.
10. We used dynamic groupings for growth quintiles. Data are available upon request.
