cash for clunkers - brookings institution
TRANSCRIPT
Cash for Clunkers: An Evaluation of the Car Allowance Rebate System
Ted Gayer and Emily Parker
OCTOBER 31, 2013
This research was supported by a grant from the MacArthur Foundation.
We are grateful to Karen Dynan, who worked on much of this project until her nomination to
be Assistant Secretary for Economic Policy at the U.S. Department of the Treasury.

CASH FOR CLUNKERS: AN EVALUATION OF THE CAR ALLOWANCE REBATE SYSTEM
1
I. Introduction
The Car Allowance Rebate System (CARS), more commonly known as “Cash for Clunkers,” was
a government program administered by the National Highway Transportation Safety
Administration (NHTSA) that allowed consumers to trade in an older, less fuel-efficient vehicle
for a voucher to be applied toward the purchase of a newer, more fuel-efficient vehicle.
Depending on the difference in fuel economy between the trade-in vehicle and the new vehicle,
program participants received a voucher for either $3,500 or $4,500. After the “clunker” was
traded in at the dealership, its engine was destroyed, ensuring its permanent removal from the
U.S. vehicle fleet. Nearly 700,000 clunkers were traded in between July 1, 2009 and August 24,
2009 as part of the program.
There were two motivations for the CARS program. The first was to provide temporary stimulus
to counter the economic contraction that was occurring at that time. The other was to improve
the fuel efficiency of the existing stock of vehicles, in order to reduce emissions. Our evaluation
of the evidence suggests that the $2.85 billion in vouchers provided by the program had a small
and short-lived impact on gross domestic product, essentially shifting roughly a few billion
dollars forward from the subsequent two quarters following the program. The implied cost per
job created due to the program was much higher than what was estimated for alternative fiscal
stimulus programs. This does not account for the decrease in the capital stock stemming from
the program’s requirement that the traded in used cars be destroyed.
On the environmental side, the cost per ton of carbon dioxide reduced due to the program was
higher than what would be achieved through a more cost-effective policy such as a carbon tax or
cap-and-trade, but was comparable (or indeed lower) than what is achieved through some of the
less cost-effective environmental policies, such as the tax subsidy for electric vehicles.
II. Background on the CARS Program
The idea for a Cash for Clunkers program first received widespread attention in the United
States when Alan Blinder proposed it in an opinion piece for the New York Times on July 27,
2008 (Blinder, 2008).1 At that time, the U.S. economy was struggling. In the third quarter of
2008, GDP growth declined 2 percent and dropped another 8.3 percent in the final quarter of
1. Individual states, including California (2008), Colorado (2009), Delaware (1992), Illinois (1993), and Texas (2007), and other countries, including Canada (2008), France (2009), Germany (2009), Italy (2007), Japan (2009), Romania (2005), and the United Kingdom (2009), had also implemented similar vehicle retirement programs.

CASH FOR CLUNKERS: AN EVALUATION OF THE CAR ALLOWANCE REBATE SYSTEM
2
the year. The unemployment rate was 5.8 percent in July and continued to rise over the next
year, reaching a peak of 10.0 percent in October, 2009. The weakening economy caused
policymakers to search for ways to provide stimulus, leading to increased political appeal of
Cash for Clunkers.
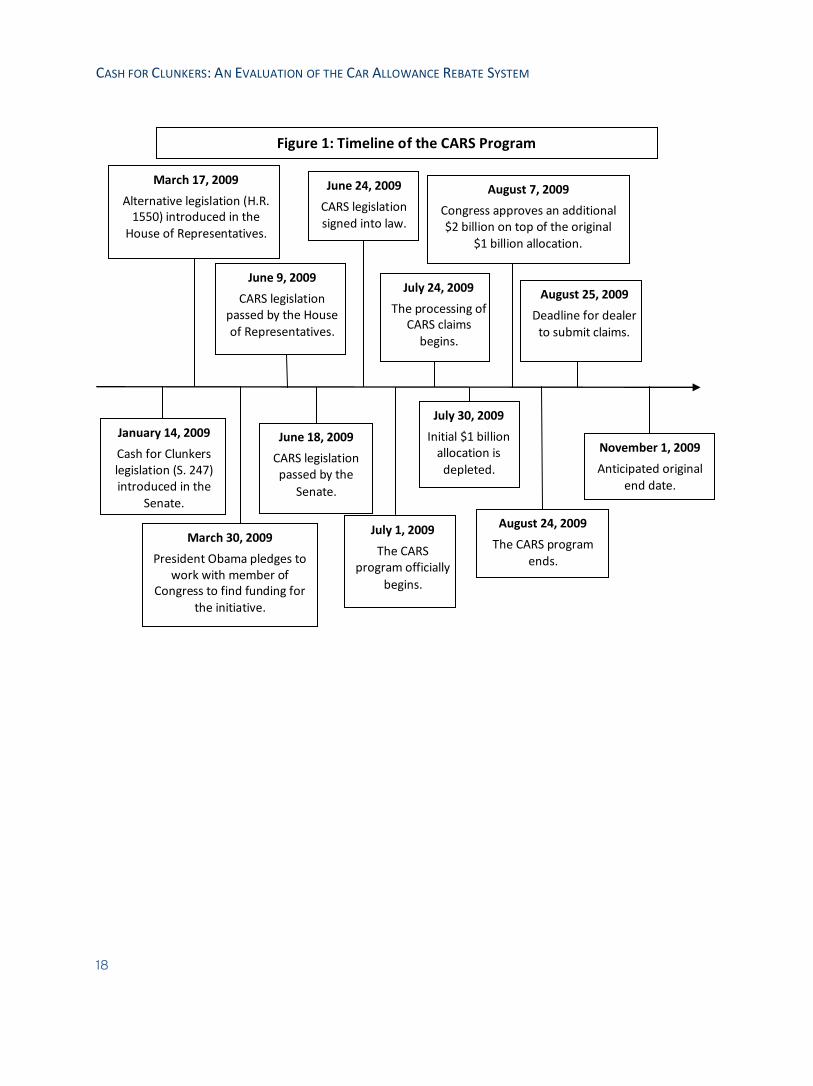
Figure 1 shows a timeline for the program, starting with the introduction of the bill in the Senate
on January 13, 2009. The House introduced a similar bill on March 17, 2009. The program was
signed into law by President Obama on June 24, 2009, as the Consumer Assistance to Recycle
and Save Program as Title XIII of the Supplemental Appropriations Act of 2009.2
The program initially received $1 billion in funding and was slated to run between July 1 and
November 1, 2009. By July 30, 2009, the initial $1 billion allocation was depleted because the
take-up of the program far exceeded expectations. NHTSA assumed dealer requests for payment
would average approximately 3,000 per day. However, in the first 10 days, NHTSA received an
average of 22,400 requests per day—more than 7 times the expected participation (DOT Office
of Inspector General, 2010). During the next week, both the House of Representative and the
Senate approved $2 billion in additional funds. On August 7, 2009, President Obama signed the
additional funding into law, approving $3 billion in total funding for the program. Even with the
additional funding, the program ended on August 24, 2009, over two months before its
anticipated November 1 end date.
Under the CARS program, a consumer received a voucher by trading in an older, less fuel-
efficient vehicle and purchasing a new, more fuel-efficient vehicle. Table 1 shows the minimum
fuel economy required of the new vehicle and the minimum difference in fuel economy between
the trade-in vehicle and the new vehicle required to receive a voucher of either $3,500 or
$4,500. For example, if the difference between the fuel economy of a trade-in passenger car and
a new passenger car was between 4 and 9 miles per gallon, and the new vehicle had a fuel
economy rating of at least 22 miles per gallon, then the consumer received a voucher for $3,500.
If the difference was at least 10 miles per gallon, and again the new passenger car had a fuel
economy rating of at least 22 miles per gallon, the consumer received a voucher for $4,500.
Eligible vehicle types included automobiles (passenger cars), category 1 trucks (sports utility
vehicles, small trucks, and minivans weighing less than 6,000 pounds), category 2 trucks (vans
and pick-up trucks weighing between 6,001 and 10,000 pounds), and category 3 trucks (large
vans and trucks weighing between 10,001 and 14,000 pounds). Motorcycles were not eligible. 2. The title of the program (Car Allowance Rebate System) and the title of the legislation that made that program law (Consumer Assistance to Recycle and Save) share the same acronym. Throughout the paper, the acronym “CARS” refers to the program.

CASH FOR CLUNKERS: AN EVALUATION OF THE CAR ALLOWANCE REBATE SYSTEM
3
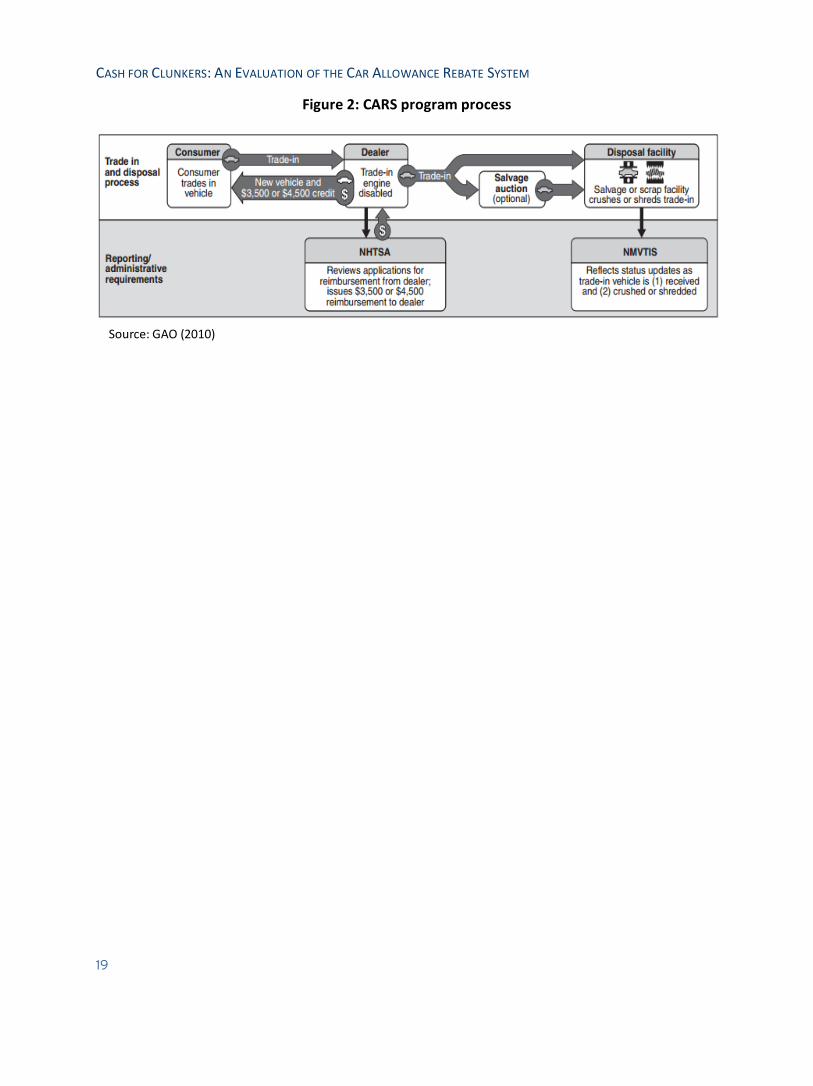
Figure 2 describes the roles played by consumers, dealerships, and the disposal facilities as part
of the CARS program. When a consumer brought a “clunker” into a dealership to trade-in, the
dealer gave the consumer a voucher worth either $3,500 or $4,500 to be applied toward the
purchase (or long-term lease) of a new vehicle. The dealer then disabled the engine of the trade-
in vehicle by running a sodium silicate solution through the engine, causing its permanent
destruction. The dealer sent the disabled vehicle to either a salvage auction or to a disposal
facility. The dealer had to prove that the vehicle was successfully destroyed to the National
Motor Vehicle Title Information System (NMVTIS) in order be reimbursed for the $3,500 or
$4,500 voucher by NHTSA.
Unlike the original proposal by Blinder (2008), the program was not means tested, so anyone
trading in an old vehicle could qualify for the voucher, subject to the following eligibility
requirements:
1. A minimum fuel economy level for the new vehicle and a minimum difference in fuel
economy between the new and traded-in vehicle, as discussed above and shown in Table
1
2. The trade-in vehicle had to be less than 25 years old.
3. The new vehicle had to have been purchased between July 1, 2009 and November 1,
2009.3
4. The new vehicle had to be purchased or have a 5-year-minimum lease.
5. The trade-in vehicle had to have been registered and insured continuously for the full
year preceding the trade-in.
6. The trade-in vehicle had to be in drivable condition.
7. The engine of the trade in vehicle had to be permanently destroyed. The dealer was
required to disclose to the consumer the best estimate of the scrap value of the trade-in
vehicle and include this amount (less $50 in dealer expense) in the voucher to the
consumer.4
8. The new vehicle had to have a suggested retail price of less than $45,000.
The statute required that NHTSA establish and administer the program within 30 days of the
enactment of the bill. Because of this short time frame, some program requirements were
3. The end date was later changed to August 24, 2009. 4. There was widespread non-compliance with this rule. Many dealers estimated the scrap value to be exactly $50 per vehicle and therefore did not increase the voucher amount. Oregon attempted to address non-compliance of this rule. In December 2009, the Attorney General of the state warned dealers that they should have complied with the federal law requiring dealers to pass along the scrap value (less $50) to consumers, leading many Oregon dealers to retroactively mail checks to CARS program participants (Oregon Department of Justice, 2009).
CASH FOR CLUNKERS: AN EVALUATION OF THE CAR ALLOWANCE REBATE SYSTEM
4
rushed or overlooked. For example, one of the requirements of the dealership was to administer
a survey to program participants that asked whether the consumer would have purchased a new
vehicle in the absence of the CARS program. Only 21 percent of participants fully and accurately
completed the survey.
Additionally, because of the unexpected high take-up of the program, NHTSA did not have
sufficient resources to process the dealerships’ requests for reimbursement on time. On August
25, when the program ended, NHTSA still had 649,522 pending dealer payment requests.
NHTSA had to pull over 7,000 employees from other federal agencies including the Federal
Aviation Administration, the Internal Revenue Service, the Department of Transportation, and
private contractors across the country to help process the requests.
III. Overview of Take-up of CARS Program
According to the U.S. General Accountability Office (2010), there were 677,842 vehicles traded
in under the CARS program, resulting in $2.85 billion in total value of rebates, or an average
voucher amount of approximately $4,200. NHTSA documents that the new vehicles purchased
under the program averaged 24.9 miles per gallon, compared to the 15.8 miles per gallon
averaged by the trade-in vehicles (Bolton, 2009).
Congress budgeted $3 billion in total for the program, but the full amount was not used because
the program ended based on what proved to be a conservative estimate of when the funds would
be exhausted. The final taxpayer cost of the CARS program was $2.85 billion.
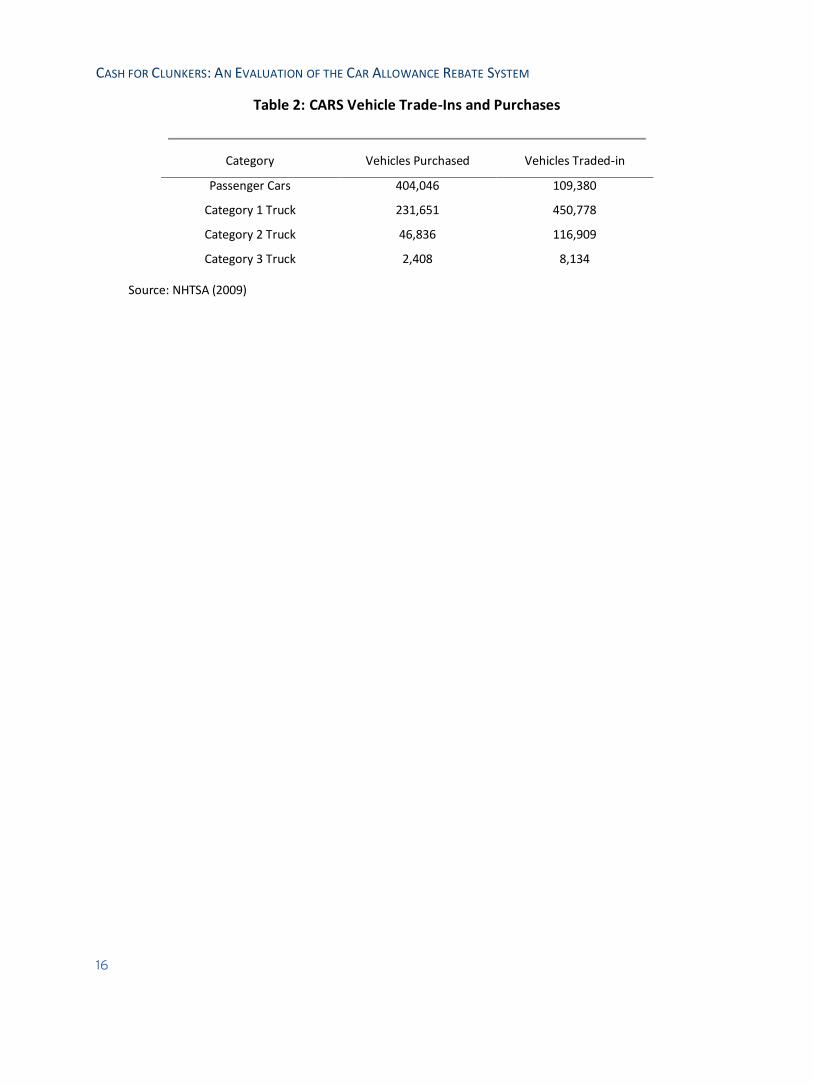
Table 2 shows the number of each type of vehicle purchased and each type of vehicle traded in
under the program. Eighty-four percent of the vehicles traded in were category 1 trucks (sports
utility vehicles, small trucks, and minivans weighing less than 6,000 pounds). In contrast, fifty-
nine percent of the vehicles purchased were passenger cars.
Figure 3 shows the manufacturers of the new vehicles purchased under the program. Toyota,
General Motors, Ford, Honda, Nissan, and Hyundai accounted for more than 80 percent of the
new vehicles purchased under the program.5
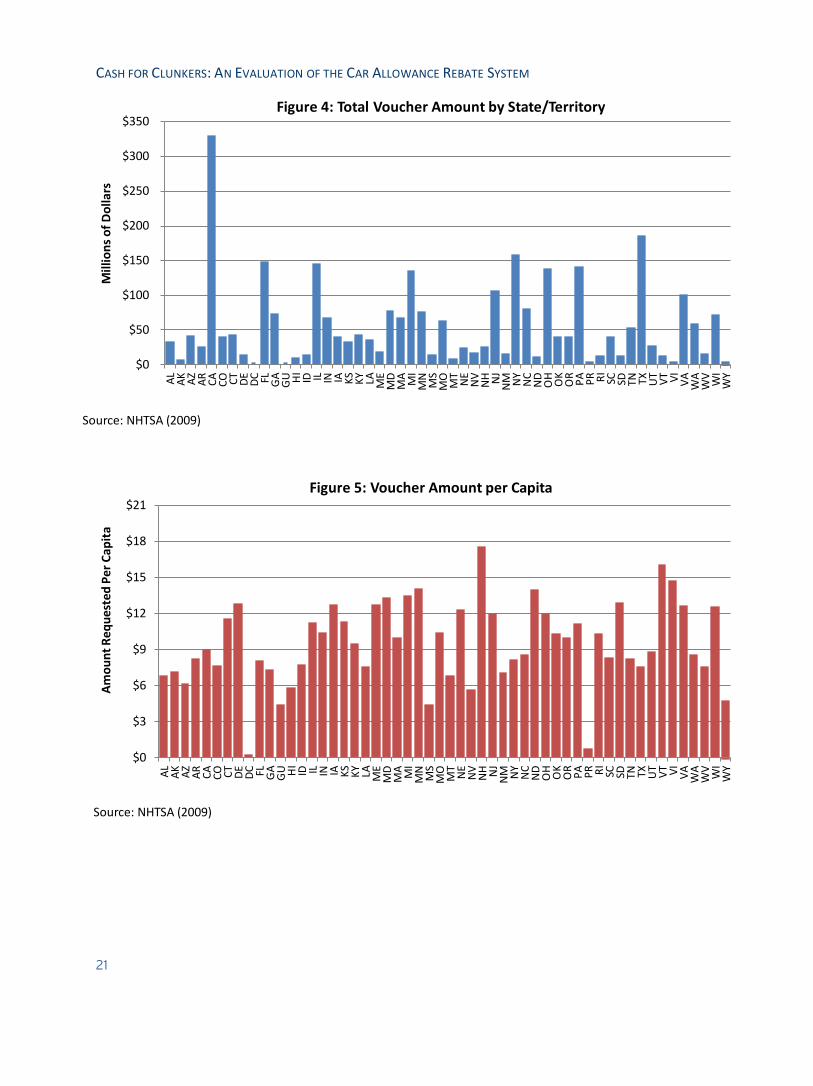
Figure 4 shows the total voucher amount by state, and Figure 5 shows the per-capita voucher
amount by state. All fifty states, the District of Columbia, Guam, the U.S. Virgin Islands, and
5. Although foreign automakers received a large percentage of the sales under the CARS program, many foreign manufacturers have substantial operations in the U.S. For example, approximately 70 percent of Toyota’s sales and 89 percent of Honda’s sales in the United States are manufactured in North America.
CASH FOR CLUNKERS: AN EVALUATION OF THE CAR ALLOWANCE REBATE SYSTEM
5
Puerto Rico participated in the CARS program. Larger states, like California and Texas received
more in total voucher amounts because of their larger populations, whereas New Hampshire
and Vermont received the greatest per capita voucher amount.
IV. Evidence of Market Impact of CARS program
An examination of aggregate market data suggests a short-term impact of the CARS program on
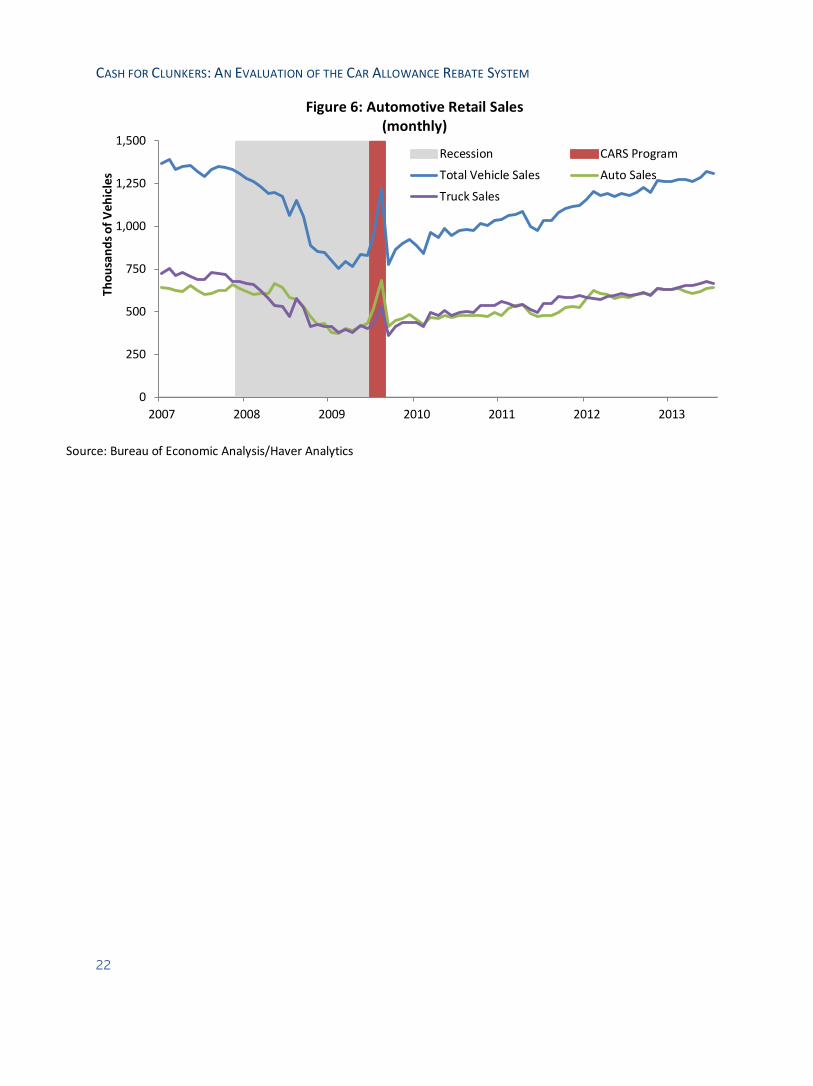
the economy. Figure 6 shows monthly passenger car, light truck, and total passenger vehicle
sales from January 2007 through August 2013. Throughout the recession that lasted from
November 2007 to June 2009, sales of passenger vehicles dropped 38 percent. During the CARS
program, vehicle sales increased 14 percent in July 2009 and increased another 28 percent in
August 2009. The increase was more pronounced for passenger cars than for trucks, with the
former increasing 21 percent in July and 31 percent in August, while the latter increased 7
percent in July and 24 percent in August. Sales reverted to pre-program levels immediately after
the expiration of the program in September. After September 2009, car and truck sales
gradually trended up as the economy (slowly) recovered. Only in recent months have sales
reached the range seen prior to the recession, though they have yet to reach their pre-recession
peak.
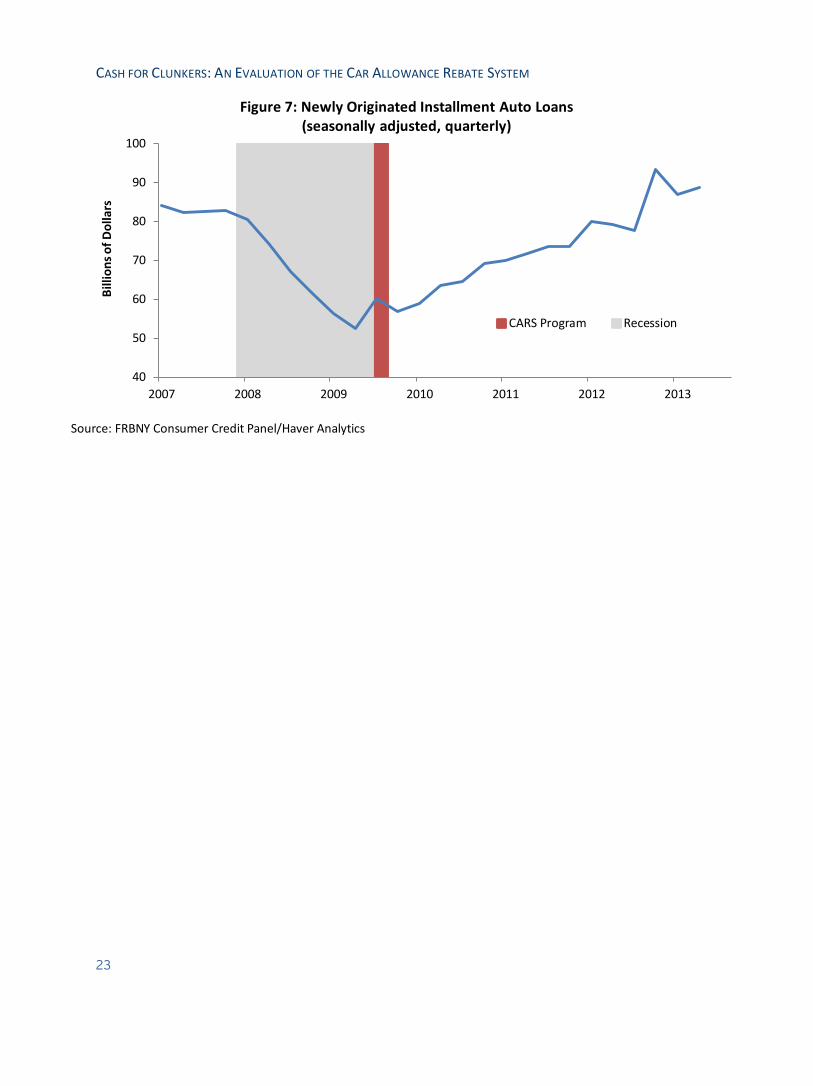
An impact of the CARS program is also evident in other indicators of the U.S. vehicle market.
Figure 7 shows a quarterly time series of newly originated auto loans from January 2007 to June
2013. There was a 15 percent uptick during the third quarter of 2009, when the CARS program
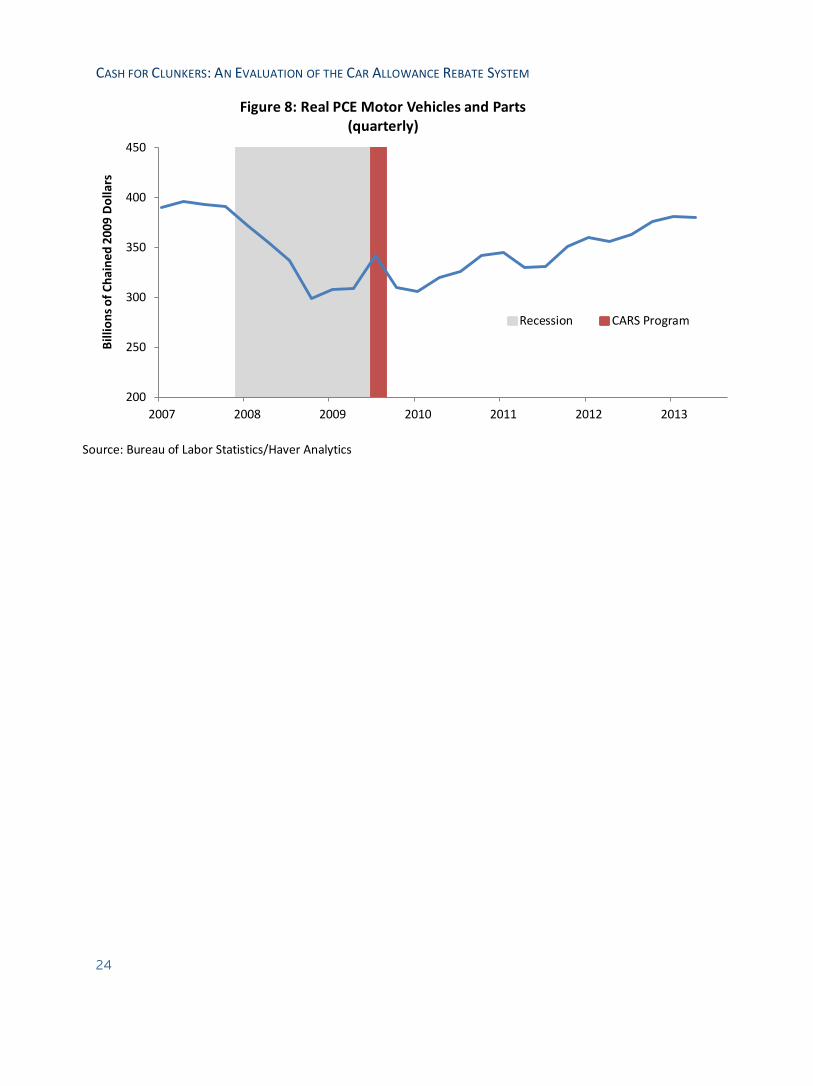
was active, followed by a 6 percent decline in the fourth quarter. Figure 8 shows a quarterly time
series of personal expenditures on motor vehicles and parts, and indicates an increase of 11
percent during the third quarter of 2009, followed by a 10 percent decline in the quarter
following the program. Both new auto loans and real personal expenditures on vehicles and
parts decreased to pre-program levels immediately after the expiration of the CARS program in
September 2009.
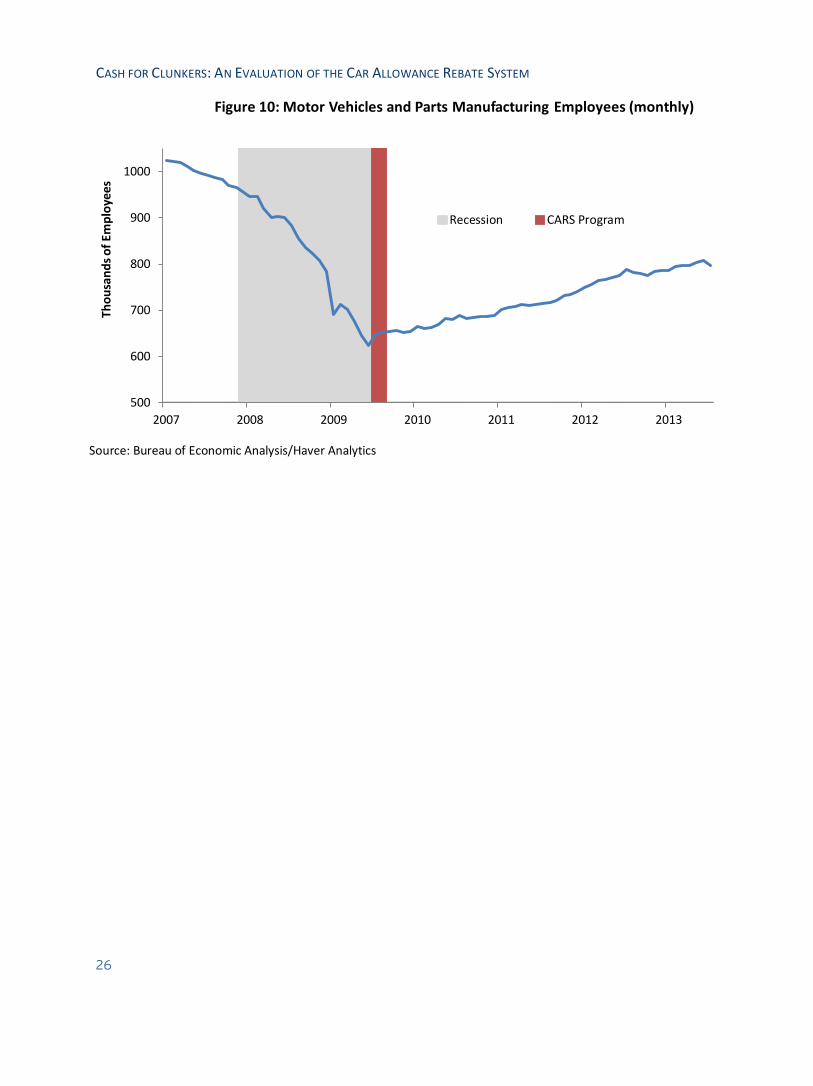
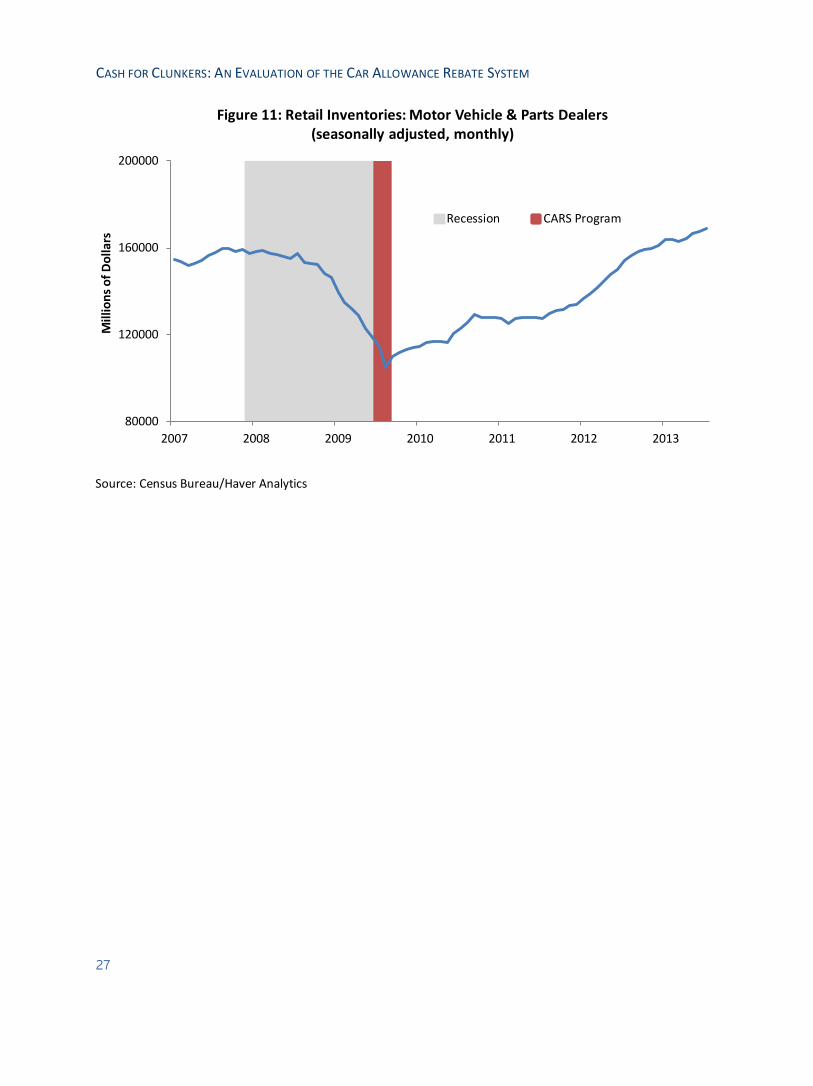
Figure 9 shows a monthly time series of the number of motor vehicle assemblies in the United
States. Figure 10 shows a monthly time series of the number of employees in auto
manufacturing. Both figures 9 and 10 increased during the CARS program, yet unlike the
previous measures, they do not show a decline following the expiration of the program. Not
surprisingly, in addition to the increase in motor vehicles and parts assembly to meet demand
during the CARS program, there was a decrease in inventories, as shown in Figure 11.
CASH FOR CLUNKERS: AN EVALUATION OF THE CAR ALLOWANCE REBATE SYSTEM
6
Four automobile companies—Toyota, Ford, General Motors, and Honda—represented 64
percent of the new vehicles purchased under the CARS program. Figure 12 shows the stock price
trends of these four companies before, during, and after the CARS program. The stock price
from GM is flat during much of this period because GM filed for Chapter 11 bankruptcy on June
1, 2009.6 During the CARS program, Toyota, Honda, and Ford all saw their stock prices
increase, followed by an immediate decrease after the expiration of the program. Beginning with
the start of the CARS program on July 1, Ford’s stock increased 43 percent through August 5,
where it peaked and then decreased 15 percent through the end of September. Over the same
time period, Honda saw a 19 percent increase followed by an 8 percent decrease through the end
of September. Toyota experienced a 16 percent increase followed by a 10 percent decrease
through the end of September.
Financial markets react to anticipated events. From the introduction of the legislation in the
Senate in mid-January through the expiration of the program on August 24, 2009, Ford’s stock
experienced a 253 percent increase, Honda’s stock saw a 44 percent increase, and Toyota’s stock
saw a 30 percent increase.
While the patterns of all these indicators suggest that the CARS program had an effect on the
market, they cannot clearly indicate the magnitude or duration of the effect. Doing so requires a
credible estimate of the counterfactual of what would have happened in the vehicle market
absent the CARS program.
V. To What Extent Did the CARS Program Provide Fiscal
Stimulus?
The key justification for the CARS program was to provide temporary stimulus by spurring
vehicle sales. There were nearly 700,000 participants in the 55 days of the program, which
represents 31.4 percent of total vehicle sales during this period. However, the question is how
many of these vehicle sales would have occurred without the program. The empirical challenge
is to estimate the counterfactual level of sales in the absence of the program. Another question is
the extent to which any additional sales incentivized by the program were borrowed from sales
that would have occurred otherwise in the near future subsequent to the program.
6. On July 10, 2009, a new company largely financed by the United States Treasury purchased most of the assets of the General Motors Corporation. On November 18, 2010, General Motors Company resumed trading on the NYSE.
CASH FOR CLUNKERS: AN EVALUATION OF THE CAR ALLOWANCE REBATE SYSTEM
7
Early research on the effect of the CARS program relied on aggregate sales data and consumer
surveys – similar to the evidence shown in the previous section – to estimate the pattern of sales
that would have occurred absent the program. Using these methods, the Council of Economic
Advisers (2009) estimated that the program induced 440,000 additional sales, and the DOT
Office of the Inspector General (2009) estimated that the program induced 597,950 additional
sales. However, the volatility of sales data in the months preceding the program makes the use
of national aggregate data less reliable. Later studies also had the advantage of data for the
period following the program, allowing for estimation of the development of the pattern of sales.
Mian and Sufi (2012) instead rely on cross-sectional variation across U.S. cities in exposure to
the CARS program as measured by the number of “clunkers” in the city as of summer 2008 to
estimate the effect on vehicle sales. They find that the program induced the purchase of an
additional 370,000 vehicles during the treatment period (amounting to 55 percent of total
vehicle sales).
Li, Linn, and Spiller (2012) estimate the counterfactual of what would have happened to vehicle
sales without the program based on sales in Canada, which has a similar market to the U.S. but
did not have a Cash for Clunkers program during this time. Their findings of the short-term
impact of the program are very similar to those found by Mian and Sufi (2012). They find that
the program induced an additional 390,000 vehicle sales during the treatment period
(amounting to 58 percent of total vehicle sales).
The CARS program was designed to provide short-term stimulus, but the question arises of just
how short-term. As described above, the program induced purchases of additional vehicle sales
during its existence, but some amount of these sales were pulled forward (or borrowed) from
sales that would have occurred in the future in the absence of the program. This pull forward
effect can be seen in the aggregate sales data previously provided in Figure 6, which shows that
vehicle sales dropped by approximately 38 percent in September 2009 (the month after the
expiration of the program) compared to August 2009.
Mian and Sufi (2012) find that in the months subsequent to the expiration of the program, the
treatment cities (those that had a large stock of eligible clunkers before the program) saw the
purchase of many fewer new vehicles than the control cities (those that had a small stock of
eligible clunkers before the program). Ten months after the end of the program, the cumulative
purchases of the high- and low-clunker cities from July 2009 to June 2010 were nearly the same

CASH FOR CLUNKERS: AN EVALUATION OF THE CAR ALLOWANCE REBATE SYSTEM
8
(Mian and Sufi, 2012). Other studies find similar results that the increase in sales from the
program were pulled forward from near-term future sales.7
The evidence therefore suggests that the CARS program provided a short-term boost in vehicle
sales of approximately 380,000 vehicles, which were pulled forward from sales that would have
occurred in subsequent months. As discussed by Copeland and Kahn (2013), the degree to which
the pulling forward of sales led to a short-term boost in GDP and employment during the
existence of the program depends on the impact on production more than sales. If the industry
primarily relied on reducing inventory stocks to meet the higher demand during the short period
of the program (which they could subsequently replenish during the low-demand post-program
months), then there would be a muted impact on employment and GDP. Copeland and Kahn
(2013) indeed find that the increase in vehicle production during the program was less than half
of the induced increase in vehicle sales and that this additional production was shifted forward
from the subsequent two quarters. The net result is a negligible increase in GDP, shifting
roughly $2 billion into the third quarter of 2009 from the subsequent two quarters (Copeland
and Kahn, 2013).
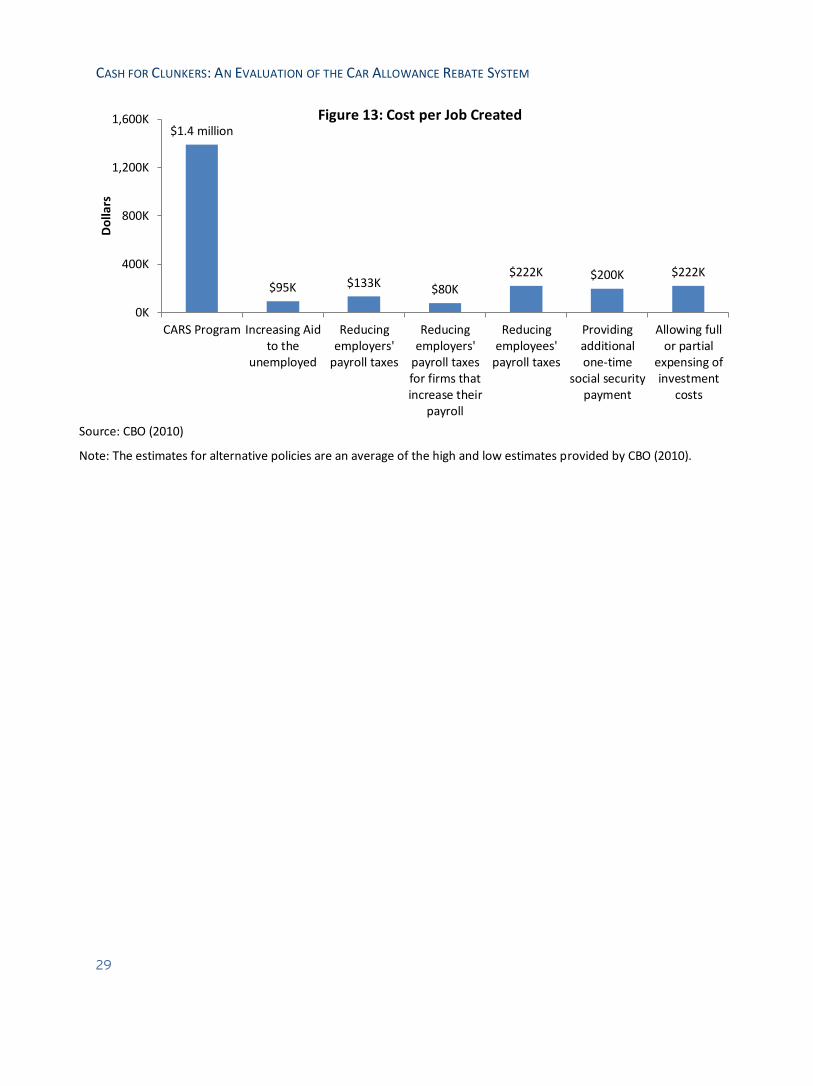
Similarly, Li, Linn, and Spiller (2012) find a minimal increase in employment due to the CARS
program. They estimate an additional 3,676 job years from June through December 2009, split
between the assembly and parts industries. Over the longer term through May 2010, they find a
net increase of only 2,050 job years. Figure 13 shows cost per job created by the CARS program
compared to a number of other policy options evaluated by the Congressional Budget Office
(2010). Using Li, Linn, and Spiller’s (2012) long-term jobs estimate for the CARS program, the
program created 0.7 jobs for each million dollars of program cost, resulting in a cost of $1.4
million per job created. This suggests that the CARS program was far less cost effective at
creating jobs than other fiscal stimulus programs, such as increasing unemployment aid,
reducing payroll taxes, providing an additional social security payment, or allowing the
expensing of investment costs.
An unexplored consideration of the effectiveness of the CARS program is whether it substituted
for other consumption. The average new vehicle price for vehicles purchased under the CARS
program was $22,592 (Busse, et al, 2012). Even with the $3,500 or $4,500 voucher, the price of
the new vehicle far exceeded the value of the voucher, meaning participants could have
decreased their consumption spending on other items.
7. See, for example, Copeland and Kahn (2013) and GAO (2010).
CASH FOR CLUNKERS: AN EVALUATION OF THE CAR ALLOWANCE REBATE SYSTEM
9
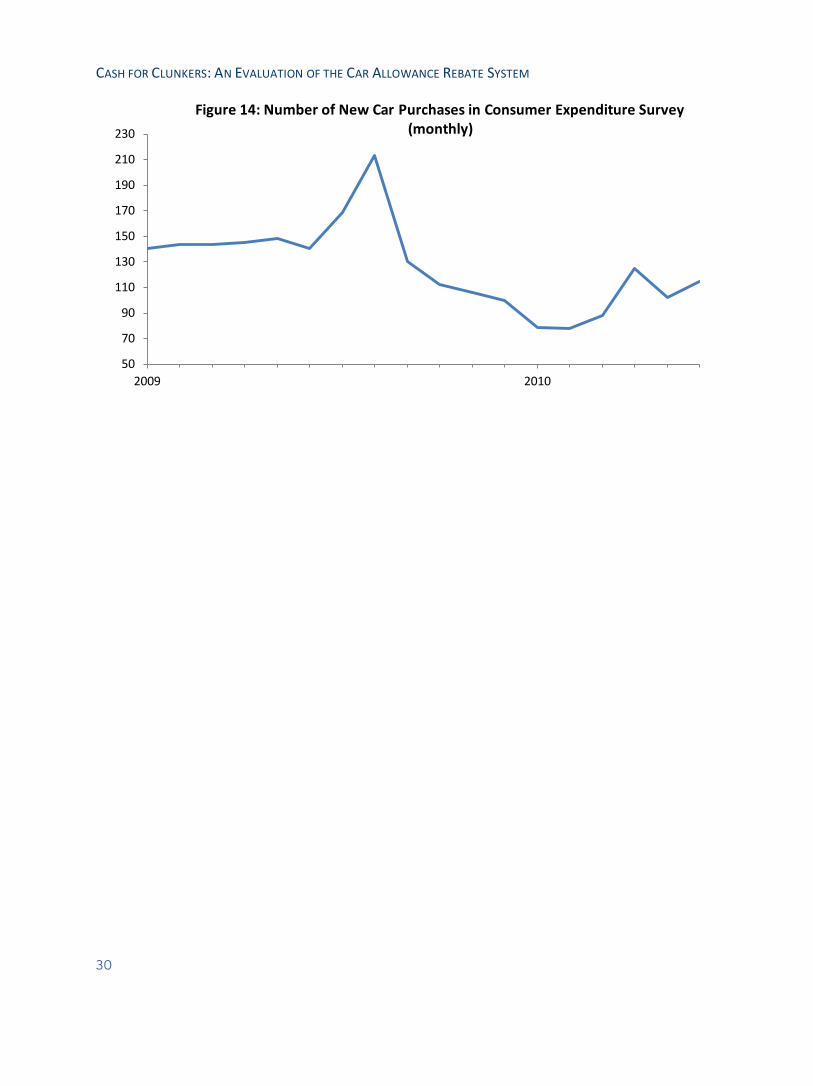
Using the public-use microdata from the consumer expenditure survey, we attempt to identify
households that were likely participants in the CARS program. The consumer expenditure
survey data are collected for the Bureau of Labor Statistics by the U.S. Census Bureau. It
provides information on the buying habits of American consumers, including expenditures,
income, and household characteristics. As shown in Figure 14, the pattern of new vehicle sales in
the consumer expenditure data resemble the pattern of aggregate sales for the full population
from the Bureau of Economic Analysis, with a spike in sales in July and August 2009, followed
by decreased sales following the expiration of the program.8
We identify likely CARS participants in the consumer expenditure survey as those households
that purchased a new vehicle in July or August 2009, received either $3,500 or $4,500 trade-in
value for their old vehicle, and purchased a new vehicle that costs less than $45,000. Only a
small number of households (53) within the survey meet these criteria, so the limitation of the
data strongly cautions against over interpretation. With that caveat, we find that in the third
quarter of 2009, the participants in the CARS program spent a similar proportion of their
before-tax income on non-auto consumption (11.8 percent) as did all non-participants in the
program (13 percent), non-participants who purchased a new vehicle (11.1 percent) and non-
participants who purchased a new or used vehicle (12.7 percent), suggesting that households
that purchased new vehicles under the CARS program did not reduce other consumption during
the time of the program. This suggests that participants in the CARS program were not liquidity
constrained. While the program incentivized purchasing a vehicle slightly earlier than otherwise
would have occurred, there was no change in other consumption patterns.
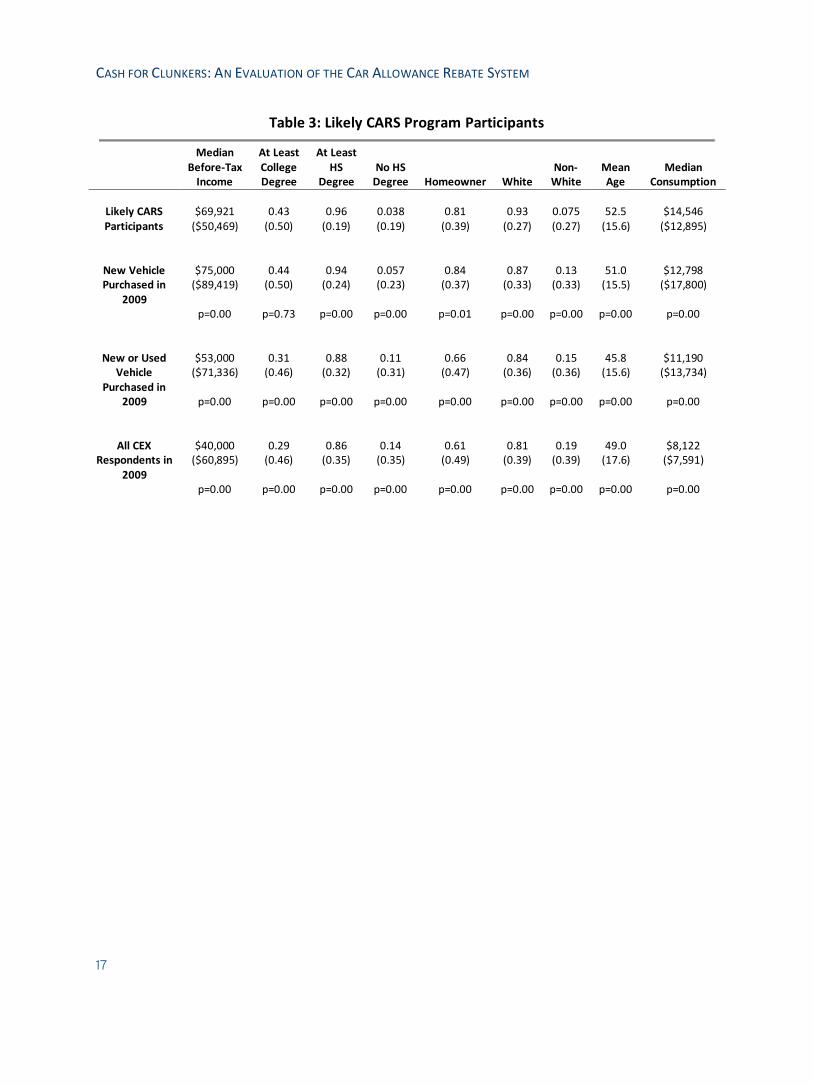
VI. Did the CARS Program Have Distributional Effects?
The CARS program was available to households at all income levels. Using the consumer
expenditure survey, we can compare the socio-demographic characteristics of households who
were likely participants in the CARS program to other households who participated in the
survey. The first row of Table 3 shows some socio-economic information of the likely CARS
participants. Based on this refined but limited sample, the households we identify as likely
participating in the CARS program had a median before-tax income of about $69,000.
Compared to households that purchased a new vehicle in 2009 but likely did not receive the
8. Vehicle sales in the more recent months of the survey are under-counted, given the structure of the survey. Respondents were surveyed from 2008 to 2011. While households interviewed in 2011 could report past vehicle purchases from 2008 through 2011, households interviewed in 2008 could not report future purchases. This leads to an under-reporting of sales in the more recent years.
CASH FOR CLUNKERS: AN EVALUATION OF THE CAR ALLOWANCE REBATE SYSTEM
10
CARS voucher, program participants had a lower level of income, were less likely to be a
homeowner, more likely to have a high school degree, more likely to be white, and more likely to
be older. Compared both to households that purchased a new or used vehicle in 2009 but likely
did not receive the CARS voucher and to all other households in the consumer expenditure
survey (other than the ones who received the CARS voucher), program participants had a higher
before-tax income, were older, more likely to be white, more likely to own a home, and more
likely to have a high-school and a college degree.
The assessment thus far has focused on the degree to which the CARS program provided
temporary stimulus by incentivizing households to purchase a new vehicle. This ignores the
economic impact stemming from the program’s requirement that the trade-in vehicle be
destroyed. Incentivizing the premature destruction of used vehicles represents a loss of capital
stock and thus a reduction in economic wealth.9
VII. What Was the Environmental Impact of the CARS Program?
In addition to providing economic stimulus, one of the intentions of the CARS program was to
reduce carbon emissions by replacing older, less fuel-efficient vehicles with newer more fuel-
efficient ones. One would not expect a substantial reduction in carbon emissions given that the
nearly 700,000 vehicles purchased under the program accounted for less than one percent of
the total on-road vehicle fleet in the United States. And as documented above, only
approximately 56 percent of these 700,000 vehicles purchased in July and August were due to
the program, and these additional purchases were pulled forward from sales that would have
otherwise taken place in the months that followed the program. The savings in fuel economy and
reduction in emissions therefore accrue from the program’s incentive to purchase a more fuel-
efficient vehicle for a relatively small number of vehicles. However, the required differential in
fuel economy under the program was relatively small. For example, more than 8,200 consumers
traded in an old Ford F150 pickup truck for a newer version of the same model, making it the
most common swap of the program. A 1990 4WD Ford F150 gets 14 miles per gallon and a 2010
4WD Ford F150 gets 16 miles per gallon. Because the Ford F150 is considered a category 2 truck,
this trade was eligible for a $4,500 voucher, even though the fuel economy only increased by 2
miles per gallon (NHTSA, 2009). Overall, the average fuel economy of the vehicles traded in
9. A related concern is that, by reducing the supply of used cars, the program led to an increase in prices in the used car market, which would adversely affect consumers (who tend to be low-income). Busse et al. (2012) find no evidence of such a price effect.
CASH FOR CLUNKERS: AN EVALUATION OF THE CAR ALLOWANCE REBATE SYSTEM
11
under the CARS program was 15.7 miles per gallon and that of new vehicles purchased under the
program was 24.9 miles per gallon.
Using the counterfactual of vehicle sales in Canada, Li, Linn, and Spiller (2012) find that the
program resulted in a reduction in gasoline consumption of 884 to 2,916 million gallons, which
is equivalent to about 2.4 to 7.9 days worth of current U.S. gasoline consumption.10 They also
find that the program resulted in a reduction of carbon dioxide emissions of only 8.58 to 28.28
million tons.11
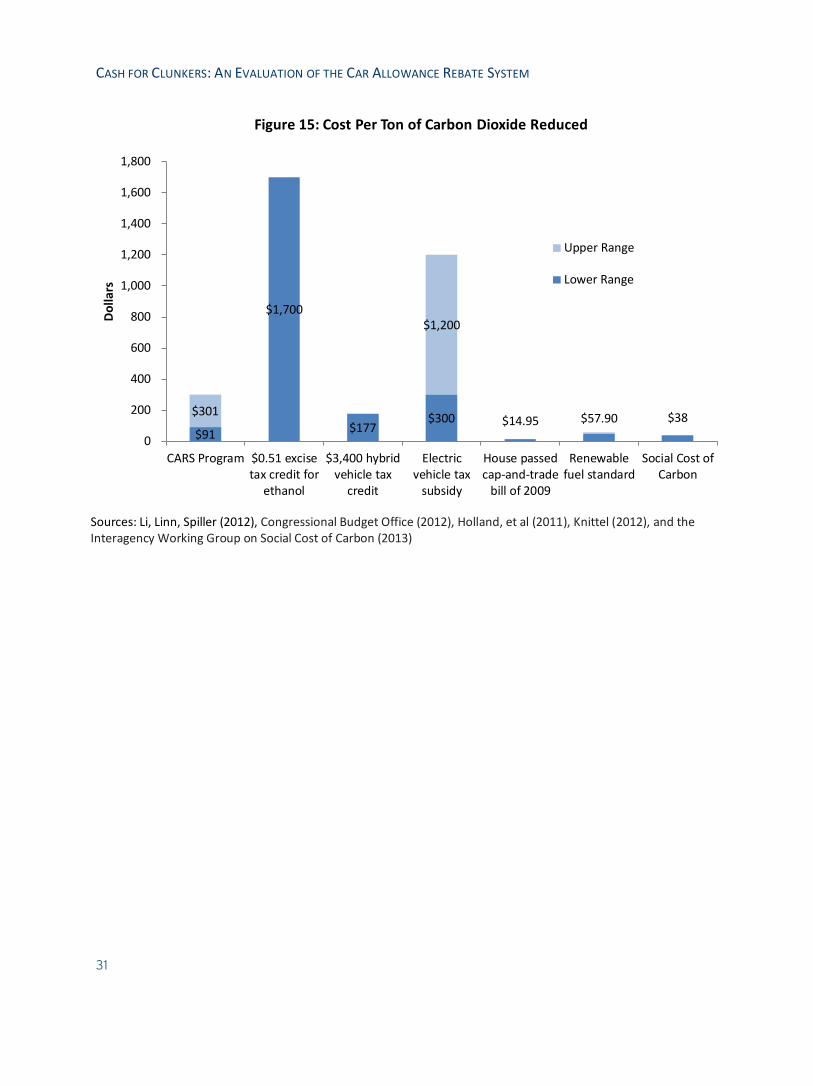
Li, Linn, and Spiller’s (2012) estimated reductions in carbon dioxide emissions (including the
co-benefit reduction in carbon monoxide, volatile organic compounds, nitrogen oxides, and
exhaust particulates) amounts to a cost per ton of carbon dioxide of $91 to $301 stemming from
the program. For comparison, Figure 15 shows estimates of the cost per ton of carbon dioxide
reduced for a handful of alternative environmental policies. It also includes the estimated social
cost of carbon, which is meant to capture the total external cost of a ton of carbon dioxide
emitted, and is used by the administration in regulatory impact assessments or proposed
regulations. The cost per ton of carbon dioxide reduced by the CARS program far exceeds the
estimated social cost of carbon, suggesting it is an inefficient approach to reducing emissions. 12
It is also far higher than the cost per ton of carbon dioxide that would have occurred under the
cap-and-trade bill that passed the House of Representatives in 2009. 13 However, it is
comparable to the cost per ton of carbon dioxide under the $3,400 hybrid vehicle tax credit14
and is more cost effective than the electric vehicle tax subsidy, the excise tax credit for ethanol,
and the renewable fuel standard.15 Note that these estimates of the reduction in gasoline
consumption and emissions do not account for the energy consumed by prematurely disposing
of used vehicles and the manufacturing of additional vehicles due to the CARS program, which
would offset some of the program’s environmental benefits.
10. The U.S. Energy Information Administration estimates that the United States consumes a daily average of about 367.08 million gallons. 11. Li, Linn, and Spiller's (2012) estimates of carbon dioxide and gasoline reductions from the program vary depending on assumptions of the size of the rebound effect (which is the increase in driving that results from increasing fuel economy), the estimate of the net increase in new vehicle sales from the program, and estimates of the expected vehicle miles that will be driven for the new vehicles purchased. 12. The social cost of carbon shown in Figure 15 assumes a three percent discount rate and represents the cost for 2015 (Interagency Working Group on Social Cost of Carbon, 2013). 13. This figure comes from EPA’s modeling of the House-passed cap-and-trade bill of 2009, also known as the Waxman-Markey Bill. We report results for Scenario 3 which excludes the effect of the energy efficiency programs in H.R. 2454. EPA estimates that the addition of those programs would have produced a slightly lower allowance price than the price in Scenario 3. 14. This estimate assumes that the power plants that produce the vehicle's electricity emit greenhouse gases at a rate equal to the national average for the electricity sector (CBO, 2012) 15. Note that the excise tax credit for ethanol expired on December 31, 2011.
CASH FOR CLUNKERS: AN EVALUATION OF THE CAR ALLOWANCE REBATE SYSTEM
12
VIII. Conclusion
The primary motivation for the CARS program was to provide temporary stimulus to counter
the economic contraction that was occurring at that time, while also reducing fuel consumption
and thus emissions. The evidence suggests that the program did indeed incentivize the sale of
more fuel efficient vehicles by pulling sales forward from the near-term future. This resulted in a
small and short-lived increase in production, GDP, and job creation. However, the implied cost
per job created was much higher than alternative fiscal stimulus policies. Further, these small
stimulus effects do not account for the depletion of the capital stock that resulted from the
destruction of used vehicles.
The CARS program was not means-tested, and evidence from the consumer expenditure survey
suggests that participants’ income is higher than consumers who purchased a new or used
vehicle, but lower than consumers who purchased a new vehicle outside of the CARS program
over the same time period. Consumers who participated in the CARS program did not decrease
other measures of consumption to do so.
The CARS program led to a slight improvement in fuel economy and some reduction in carbon
emissions. The cost per ton of carbon dioxide reduced from the program suggests that the
program was not a cost-effective way to reduce emissions, although was more cost effective than
some other environmental policies, such as the tax subsidy for electric vehicles or the tax credit
for ethanol.
CASH FOR CLUNKERS: AN EVALUATION OF THE CAR ALLOWANCE REBATE SYSTEM
13
References
Blinder, Alan S. 2008. “A Modest Proposal: Eco-Friendly Stimulus.” The New York Times (July
27, 2008). Available at:
http://www.nytimes.com/2008/07/27/business/27view.html?_r=3&.
Bolton, Eric. 2009. “Cash for Clunkers Wraps up with Nearly 700,000 Car Sales and Increased
Fuel Efficiency, U.S. Transportation Secretary LaHood Declares Program ‘Wildly
Successful’.” NHTSA (August 26, 2009). Available at:
http://www.nhtsa.gov/About+NHTSA/Press+Releases/2009/Cash+for+Clunkers+Wraps+
up+with+Nearly+700,000+car+sales+and+increased+fuel+efficiency,+U.S.+Transportatio
n+Secretary+LaHood+declares+program+%E2%80%9Cwildly+successful%E2%80%9D
Busse, Meghan R., Christopher R. Knittel, Jorge Silva-Risso, and Florian Zettelmeyer. (2012).
“Did ‘Cash for Clunkers’ Deliver? The Consumer Effects of the Car Allowance Rebate
System.” (November 2012). Available at:
http://web.mit.edu/knittel/www/papers/CFC_consumer_latest.pdf
Congressional Budget Office. 2012. “Effects of Federal Tax Credits for the Purchase of Electric
Vehicles.” (September 20, 2012). Available at: http://www.cbo.gov/publication/43576
Congressional Budget Office. 2010. “Policies for Increasing Economic Growth and Employment
in 2010 and 2011.” (January 2010). Available at:
http://www.cbo.gov/sites/default/files/cbofiles/ftpdocs/108xx/doc10803/01-14-
employment.pdf
Copeland, Adam and James Kahn. 2013. “The Production Impact of ‘‘Cash-For-Clunkers’’:
Implications for Stabilization Policy.” Economic Inquiry 51, no. 1 (2013). Available at:
http://onlinelibrary.wiley.com/doi/10.1111/j.1465-7295.2011.00443.x/pdf
Council of Economic Advisers. 2009. “Economic Analysis of the Car Allowance Rebate System
(‘Cash for Clunkers’)”. (September 10, 2009). Available at:
http://www.whitehouse.gov/assets/documents/CEA_Cash_for_Clunkers_Report_FINAL.p
df
DOT Office of the Inspector General. 2010. “Consumer Assistance to Recycle and Save Program:
Most Transactions Met Program Requirements, But Program Completion Activities
Continue.” (April 2010). Available at:
http://www.oig.dot.gov/sites/dot/files/CARS%20FINAL%204.29.10%20508.pdf
General Accountability Office. 2010. “Lessons Learned from Cash for Clunkers Program.” (April
2010). Available at: http://www.gao.gov/assets/310/303722.pdf
Holland, Stephen P., Jonathan E. Hughes, Christopher R. Knittel, and Nathan C. Parker. 2011.
“Some Inconvenient Truths About Climate Change Policy: The Distributional Impacts of
CASH FOR CLUNKERS: AN EVALUATION OF THE CAR ALLOWANCE REBATE SYSTEM
14
Transportation Policies.” MIT (August 2011). Available at:
http://dspace.mit.edu/bitstream/handle/1721.1/66290/2011-016.pdf?sequence=1
Interagency Working Group on Social Cost of Carbon. 2013. “Technical Update of the Social
Cost of Carbon for Regulatory Impact Analysis.” (May 2013). Available at:
http://www.whitehouse.gov/sites/default/files/omb/inforeg/social_cost_of_carbon_for_ri
a_2013_update.pdf
Knittel, Christopher. 2012. “Reducing Petroleum Consumption from Transportation.” Journal
of Economic Perspectives Volume 26, Number 1 (Winter 2012). Available at:
http://web.mit.edu/knittel/www/papers/JEP_latest.pdf
Li, Shanjun, Joshua Linn, and Elisheba Spiller. 2012. “Evaluating ‘Cash-for-Clunkers’: Program
Effects on Auto Sales and the Environment.” Journal of Environmental Economics and
Management (2012). Available at:
http://econ.eller.arizona.edu/docs/Seminar_Papers/Sp%2011_Li.pdf.
Mian, Atif and Amir Sufi. 2012. “The Effects of Fiscal Stimulus: Evidence from the 2009 Cash
for Clunkers Program.” The Quarterly Journal of Economics (June 22, 2012). Available at:
http://qje.oxfordjournals.org/content/127/3/1107.full.pdf+html.
Morris, Adele. 2013. “The Many Benefits of a Carbon Tax.” The Brookings Institution (February
11, 2013). Available at:
http://www.brookings.edu/~/media/research/files/papers/2013/02/thp%20budget%20pa
pers/thp_15waysfedbudget_prop11.pdf
NHTSA. 2009. “CARS Vehicle Eligibility Guide.” (July 17, 2009). Available at:
http://www.fueleconomy.gov/feg/carssearchintro.shtml
Oregon Department of Justice. 2009. “Oregon Attorney General Announces Cash-For-Clunkers
Settlements.” (December 17, 2009) Available at:
http://www.doj.state.or.us/releases/pages/2009/rel121709.aspx

CASH FOR CLUNKERS: AN EVALUATION OF THE CAR ALLOWANCE REBATE SYSTEM
15
Table 1: CARS Voucher Matrix
Trade-in Vehicle
Type New Vehicle
Type Minimum
MPG of New Vehicle
Difference Between New Vehicle MPG and Trade-in
Vehicle MPG
Voucher Rebate
Automobile Automobile 22 mpg 4-9 mpg $3,500
≥10 mpg
$4,500
Category 1 Truck 18 mpg 2-4 mpg $3,500
≥5 mpg
$4,500
Category 1 Truck Automobile 22 mpg 4-9 mpg $3,500
≥10 mpg
$4,500
Category 1 Truck 18 mpg 2-4 mpg $3,500
≥5 mpg
$4,500
Category 2 Truck Automobile 22 mpg 4-9 mpg $3,500 ≥10 mpg
$4,500
Category 1 Truck 18 mpg 2-4 mpg $3,500 ≥5 mpg
$4,500
Category 2 Truck 15 mpg 1 mpg $3,500
≥2 mpg
$4,500
Category 3 Truck Automobile 22 mpg 4-9 mpg $3,500
≥10 mpg
$4,500
Category 1 Truck 18 mpg 2-4 mpg $3,500
≥5 mpg
$4,500
Category 2 Truck
15 mpg n/a $3,500
Category 3 Truck n/a n/a $3,500
CASH FOR CLUNKERS: AN EVALUATION OF THE CAR ALLOWANCE REBATE SYSTEM
16
Table 2: CARS Vehicle Trade-Ins and Purchases
Category Vehicles Purchased Vehicles Traded-in
Passenger Cars 404,046 109,380
Category 1 Truck 231,651 450,778
Category 2 Truck 46,836 116,909
Category 3 Truck 2,408 8,134
Source: NHTSA (2009)
CASH FOR CLUNKERS: AN EVALUATION OF THE CAR ALLOWANCE REBATE SYSTEM
17
Table 3: Likely CARS Program Participants
Median Before-Tax
Income
At Least College Degree
At Least HS
Degree No HS
Degree Homeowner White Non-
White Mean Age
Median Consumption
Likely CARS Participants
$69,921
($50,469)
0.43
(0.50)
0.96
(0.19)
0.038 (0.19)
0.81
(0.39)
0.93
(0.27)
0.075 (0.27)
52.5
(15.6)
$14,546
($12,895)
New Vehicle Purchased in
2009
$75,000 ($89,419)
p=0.00
0.44 (0.50)
p=0.73
0.94 (0.24)
p=0.00
0.057 (0.23)
p=0.00
0.84 (0.37)
p=0.01
0.87 (0.33)
p=0.00
0.13 (0.33)
p=0.00
51.0 (15.5)
p=0.00
$12,798 ($17,800)
p=0.00
New or Used Vehicle
Purchased in 2009
$53,000 ($71,336)
p=0.00
0.31 (0.46)
p=0.00
0.88 (0.32)
p=0.00
0.11 (0.31)
p=0.00
0.66 (0.47)
p=0.00
0.84 (0.36)
p=0.00
0.15 (0.36)
p=0.00
45.8 (15.6)
p=0.00
$11,190 ($13,734)
p=0.00
All CEX Respondents in
2009
$40,000 ($60,895)
p=0.00
0.29 (0.46)
p=0.00
0.86 (0.35)
p=0.00
0.14 (0.35)
p=0.00
0.61 (0.49)
p=0.00
0.81 (0.39)
p=0.00
0.19 (0.39)
p=0.00
49.0 (17.6)
p=0.00
$8,122 ($7,591)
p=0.00
CASH FOR CLUNKERS: AN EVALUATION OF THE CAR ALLOWANCE REBATE SYSTEM
18
January 14, 2009
Cash for Clunkers legislation (S. 247) introduced in the
Senate.
March 17, 2009
Alternative legislation (H.R. 1550) introduced in the
House of Representatives.
March 30, 2009
President Obama pledges to work with member of
Congress to find funding for
the initiative.
June 18, 2009
CARS legislation passed by the
Senate.
June 24, 2009
CARS legislation signed into law.
June 9, 2009
CARS legislation passed by the House
of Representatives.
July 30, 2009
Initial $1 billion allocation is
depleted.
July 1, 2009
The CARS program officially
begins.
August 7, 2009
Congress approves an additional $2 billion on top of the original
$1 billion allocation.
November 1, 2009
Anticipated original end date.
August 25, 2009
Deadline for dealer
to submit claims.
August 24, 2009
The CARS program
ends.
Figure 1: Timeline of the CARS Program
July 24, 2009
The processing of CARS claims
begins.
CASH FOR CLUNKERS: AN EVALUATION OF THE CAR ALLOWANCE REBATE SYSTEM
19
Figure 2: CARS program process
Source: GAO (2010)

CASH FOR CLUNKERS: AN EVALUATION OF THE CAR ALLOWANCE REBATE SYSTEM
20
Toyota, 19.4%
General Motors, 17.6%
Ford, 14.4% Honda, 13.0%
Nissan, 8.7%
Hyundai, 7.2%
Chrysler, 6.6%
Kia, 4.3%
Subaru, 2.5%
Mazda, 2.4%
Volkswagen, 2.0%
Figure 3:New Vehicles Manufacturers Suzuki
Mitsubishi
MINI
Smart
Volvo
All Other
Source: NHTSA (2009)
CASH FOR CLUNKERS: AN EVALUATION OF THE CAR ALLOWANCE REBATE SYSTEM
21
$0
$50
$100
$150
$200
$250
$300
$350
AL
AK
AZ
AR
CA
CO CT
DE
DC FL GA
GU HI
ID IL IN IA KS
KY
LA ME
MD
MA
MI
MN
MS
MO
MT
NE
NV
NH NJ
NM NY
NC
ND
OH
OK
OR
PA PR RI
SC SD TN TX UT
VT VI
VA
WA
WV
WI
WY
Mill
ion
s o
f D
olla
rs
Figure 4: Total Voucher Amount by State/Territory
$0
$3
$6
$9
$12
$15
$18
$21
AL
AK
AZ
AR
CA
CO CT
DE
DC FL GA
GU HI
ID IL IN IA KS
KY
LA ME
MD
MA
MI
MN
MS
MO
MT
NE
NV
NH NJ
NM NY
NC
ND
OH
OK
OR
PA PR RI
SC SD TN TX UT
VT VI
VA
WA
WV
WI
WY
Am
ou
nt
Req
ues
ted
Pe
r C
apit
a
Figure 5: Voucher Amount per Capita
Source: NHTSA (2009)
Source: NHTSA (2009)
CASH FOR CLUNKERS: AN EVALUATION OF THE CAR ALLOWANCE REBATE SYSTEM
22
0
250
500
750
1,000
1,250
1,500
2007 2008 2009 2010 2011 2012 2013
Tho
usa
nd
s o
f V
eh
icle
s Figure 6: Automotive Retail Sales
(monthly)
Recession CARS Program
Total Vehicle Sales Auto Sales
Truck Sales
Source: Bureau of Economic Analysis/Haver Analytics
CASH FOR CLUNKERS: AN EVALUATION OF THE CAR ALLOWANCE REBATE SYSTEM
23
40
50
60
70
80
90
100
2007 2008 2009 2010 2011 2012 2013
Bill
ion
s o
f D
olla
rs
Figure 7: Newly Originated Installment Auto Loans (seasonally adjusted, quarterly)
CARS Program Recession
Source: FRBNY Consumer Credit Panel/Haver Analytics
CASH FOR CLUNKERS: AN EVALUATION OF THE CAR ALLOWANCE REBATE SYSTEM
24
200
250
300
350
400
450
2007 2008 2009 2010 2011 2012 2013
Bill
ion
s o
f C
hai
ned
200
9 D
olla
rs
Figure 8: Real PCE Motor Vehicles and Parts (quarterly)
Recession CARS Program
Source: Bureau of Labor Statistics/Haver Analytics

CASH FOR CLUNKERS: AN EVALUATION OF THE CAR ALLOWANCE REBATE SYSTEM
25
0
2
4
6
8
10
12
2007 2008 2009 2010 2011 2012 2013
Mill
ion
s o
f U
nit
s Figure 9: Motor Vehicle Assemblies
(monthly)
CARS Program Recession
Source: Federal Reserve Board/Haver Analytics
CASH FOR CLUNKERS: AN EVALUATION OF THE CAR ALLOWANCE REBATE SYSTEM
26
500
600
700
800
900
1000
2007 2008 2009 2010 2011 2012 2013
Tho
usa
nd
s o
f Em
plo
yees
Figure 10: Motor Vehicles and Parts Manufacturing Employees (monthly)
Recession CARS Program
Source: Bureau of Economic Analysis/Haver Analytics
CASH FOR CLUNKERS: AN EVALUATION OF THE CAR ALLOWANCE REBATE SYSTEM
27
80000
120000
160000
200000
2007 2008 2009 2010 2011 2012 2013
Mill
ion
s o
f D
olla
rs
Figure 11: Retail Inventories: Motor Vehicle & Parts Dealers (seasonally adjusted, monthly)
Recession CARS Program
Source: Census Bureau/Haver Analytics

CASH FOR CLUNKERS: AN EVALUATION OF THE CAR ALLOWANCE REBATE SYSTEM
28
0
20
40
60
80
100
120
140
2007 2008 2009 2010 2011 2012 2013
Figure 12: NYSE Prices of Top 4 CARS Manufacturers
CARS Program Recession
Toyota Honda
GM Ford
Source: NYSE
CASH FOR CLUNKERS: AN EVALUATION OF THE CAR ALLOWANCE REBATE SYSTEM
29
$1.4 million
$95K $133K $80K
$222K $200K $222K
0K
400K
800K
1,200K
1,600K
CARS Program Increasing Aidto the
unemployed
Reducingemployers'
payroll taxes
Reducingemployers'
payroll taxesfor firms thatincrease their
payroll
Reducingemployees'
payroll taxes
Providingadditionalone-time
social securitypayment
Allowing fullor partial
expensing ofinvestment
costs
Do
llars
Figure 13: Cost per Job Created
Source: CBO (2010)
Note: The estimates for alternative policies are an average of the high and low estimates provided by CBO (2010).
CASH FOR CLUNKERS: AN EVALUATION OF THE CAR ALLOWANCE REBATE SYSTEM
30
50
70
90
110
130
150
170
190
210
230
2009 2010
Figure 14: Number of New Car Purchases in Consumer Expenditure Survey (monthly)
CASH FOR CLUNKERS: AN EVALUATION OF THE CAR ALLOWANCE REBATE SYSTEM
31
$91
$1,700
$177 $300 $14.95 $57.90 $38 $301
$1,200
0
200
400
600
800
1,000
1,200
1,400
1,600
1,800
CARS Program $0.51 excisetax credit for
ethanol
$3,400 hybridvehicle tax
credit
Electricvehicle tax
subsidy
House passedcap-and-trade
bill of 2009
Renewablefuel standard
Social Cost ofCarbon
Do
llars
Figure 15: Cost Per Ton of Carbon Dioxide Reduced
Upper Range
Lower Range
Sources: Li, Linn, Spiller (2012), Congressional Budget Office (2012), Holland, et al (2011), Knittel (2012), and the Interagency Working Group on Social Cost of Carbon (2013)