policy options to achieve the 80% cut land management, sequestration and sinks robin matthews...
TRANSCRIPT
Policy options to achieve the 80% cut
Land Management, Sequestration and Sinks
Robin MatthewsClimate Change Theme Leader
Macaulay InstituteAberdeen AB15 8QH
Presentation at Scottish Parliament, November 19, 2008

Structure of the talk
1. Background2. Contribution to overall Scottish GHG emissions
made by the land use sector3. Trends in GHG emissions from the land use sector4. Scope for the use of land for sequestration and
sinks
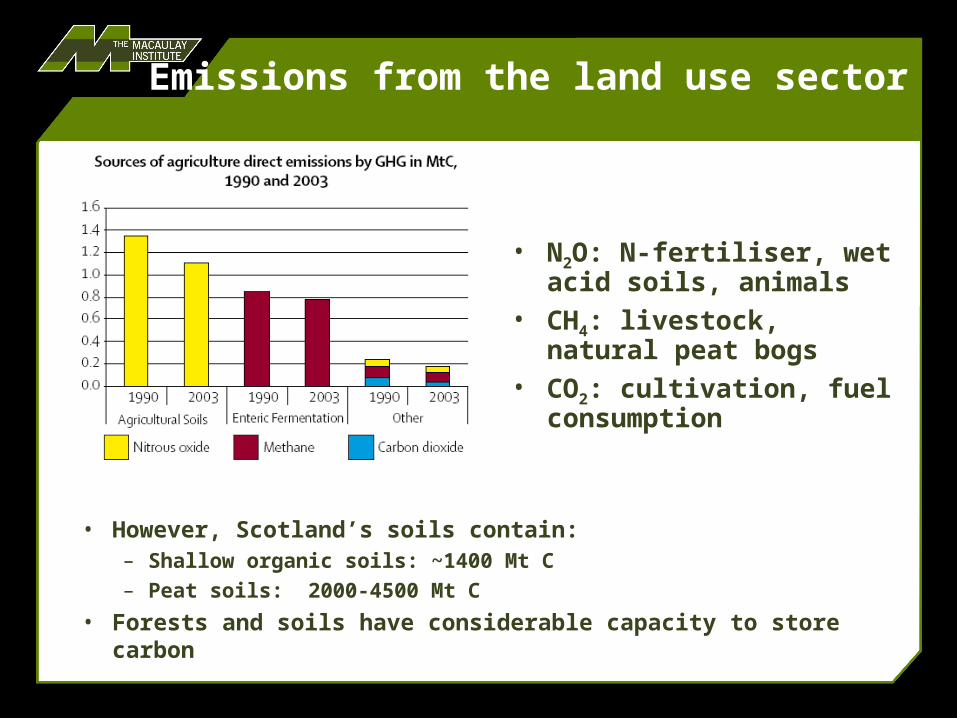
Emissions from the land use sector
• However, Scotland’s soils contain:– Shallow organic soils: ~1400 Mt C– Peat soils: 2000-4500 Mt C
• Forests and soils have considerable capacity to store carbon
• N2O: N-fertiliser, wet acid soils, animals
• CH4: livestock, natural peat bogs
• CO2: cultivation, fuel consumption
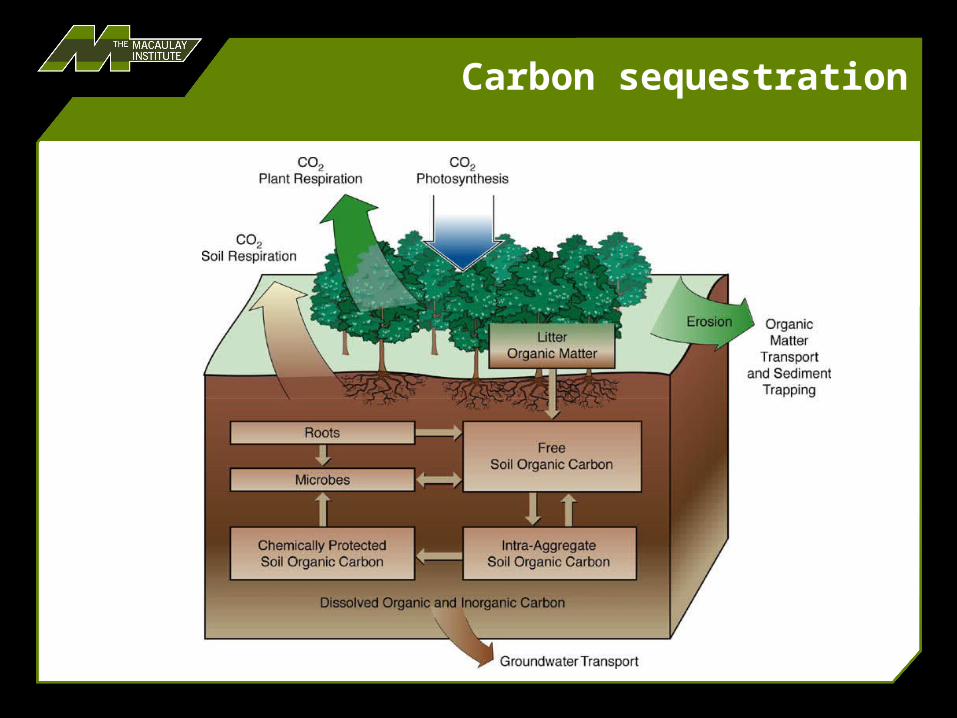
Carbon sequestration
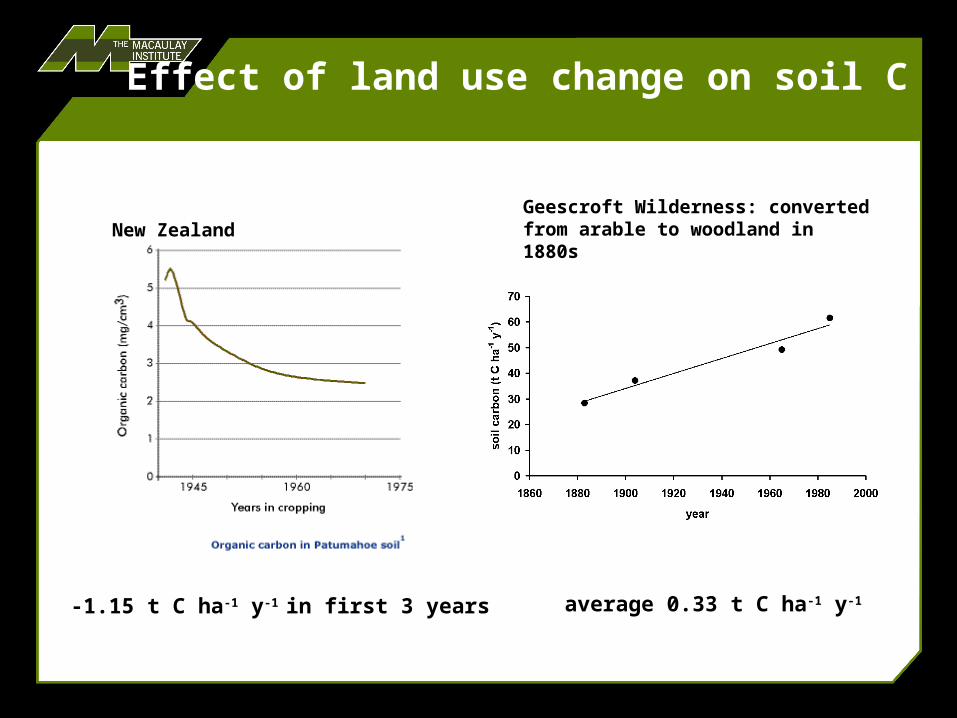
Effect of land use change on soil C
New Zealand
average 0.33 t C ha-1 y-1-1.15 t C ha-1 y-1 in first 3 years
Geescroft Wilderness: converted from arable to woodland in 1880s

Scale of the contribution
62% of UK’s removals is by Scottish forests (2003)
From ‘Changing Our Ways: Scotland’s Climate Change Programme’, SEERAD, 2006.
Scotland’s total emissions: 59 Mt CO2e yr-1
Land use emissions: 11.8 Mt CO2e yr-1
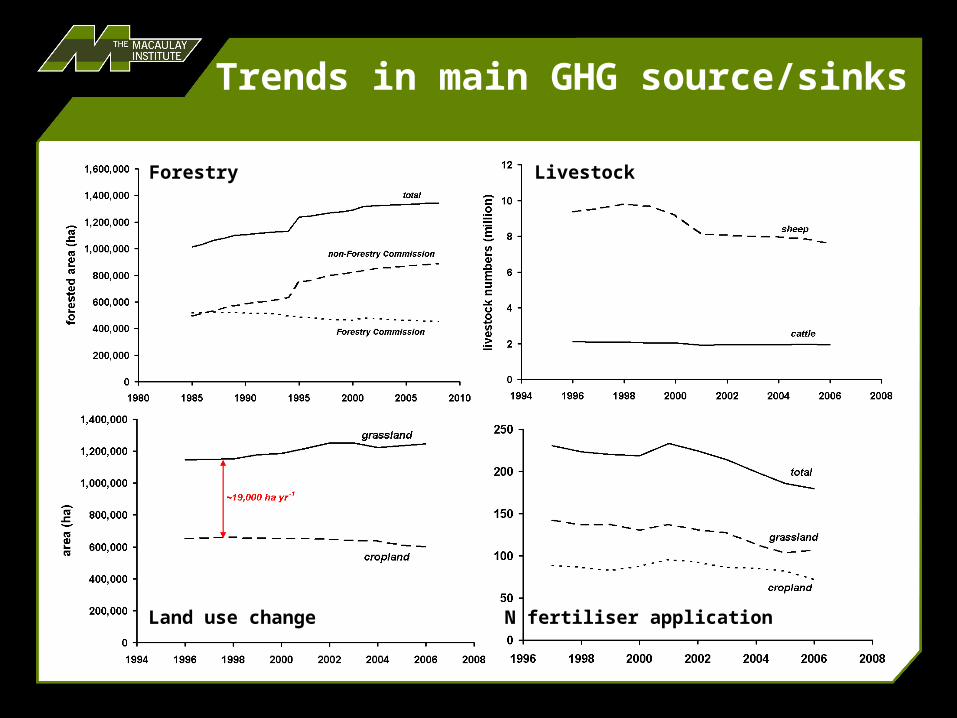
Trends in main GHG source/sinks
Forestry Livestock
Land use change N fertiliser application
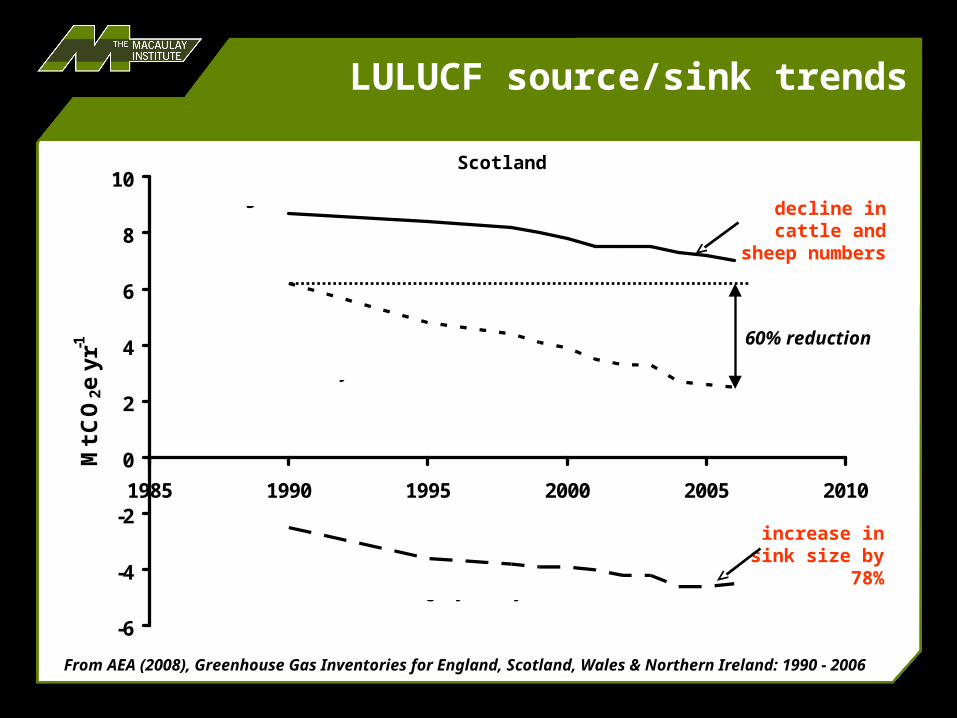
LULUCF source/sink trends
-6
-4
-2
0
2
4
6
8
10
1985 1990 1995 2000 2005 2010
Mt
CO
2e y
r-1
Agriculture
Land use, land use change, forestry
Net emissions from land use sector
From AEA (2008), Greenhouse Gas Inventories for England, Scotland, Wales & Northern Ireland: 1990 - 2006
Scotland
decline in cattle and sheep
numbers
increase in sink size by
78%
60% reduction
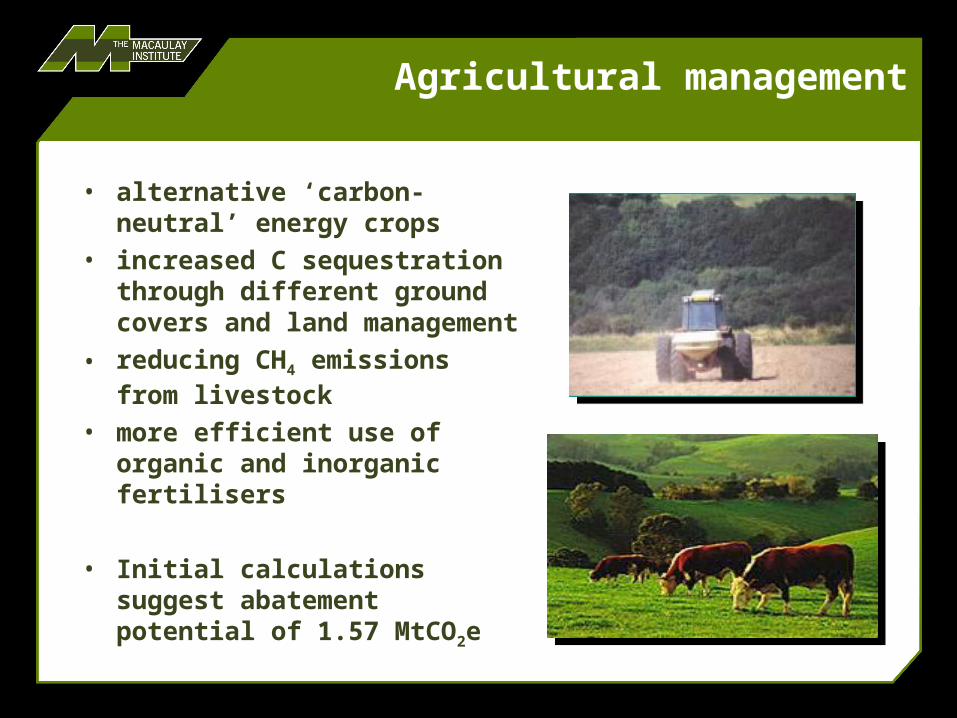
Agricultural management
• alternative ‘carbon-neutral’ energy crops
• increased C sequestration through different ground covers and land management
• reducing CH4 emissions from livestock
• more efficient use of organic and inorganic fertilisers
• Initial calculations suggest abatement potential of 1.57 MtCO2e
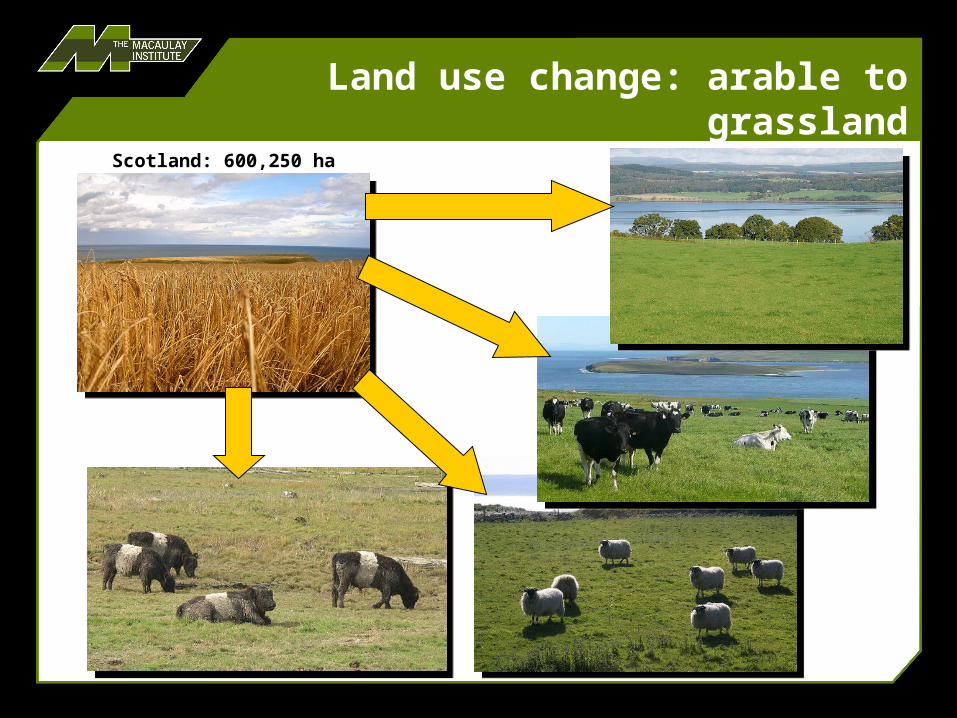
Land use change: arable to grassland
Scotland: 600,250 ha
Land use change: arable to grassland
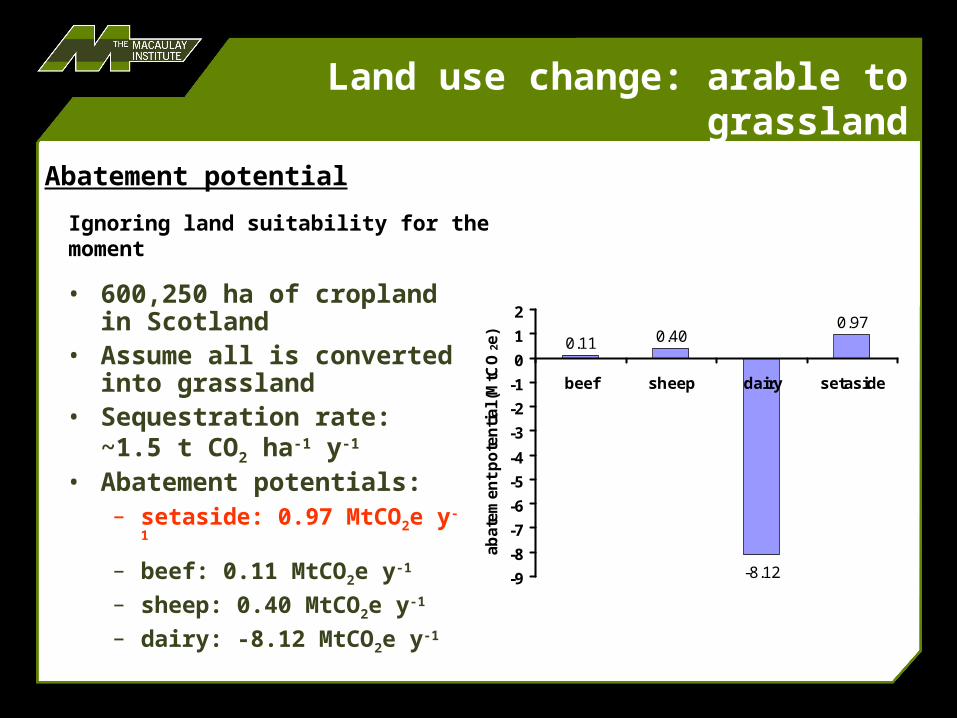
• 600,250 ha of cropland in Scotland
• Assume all is converted into grassland
• Sequestration rate:~1.5 t CO2 ha-1 y-1
• Abatement potentials:– setaside: 0.97 MtCO2e
y-1
– beef: 0.11 MtCO2e y-1
– sheep: 0.40 MtCO2e y-1
– dairy: -8.12 MtCO2e y-1
Abatement potential
Ignoring land suitability for the moment
0.11 0.40
-8.12
0.97
-9
-8
-7
-6
-5
-4
-3
-2
-1
0
1
2
beef sheep dairy setaside
ab
ate
me
nt
po
ten
tia
l (M
tCO
2e)
Land use change: forestry
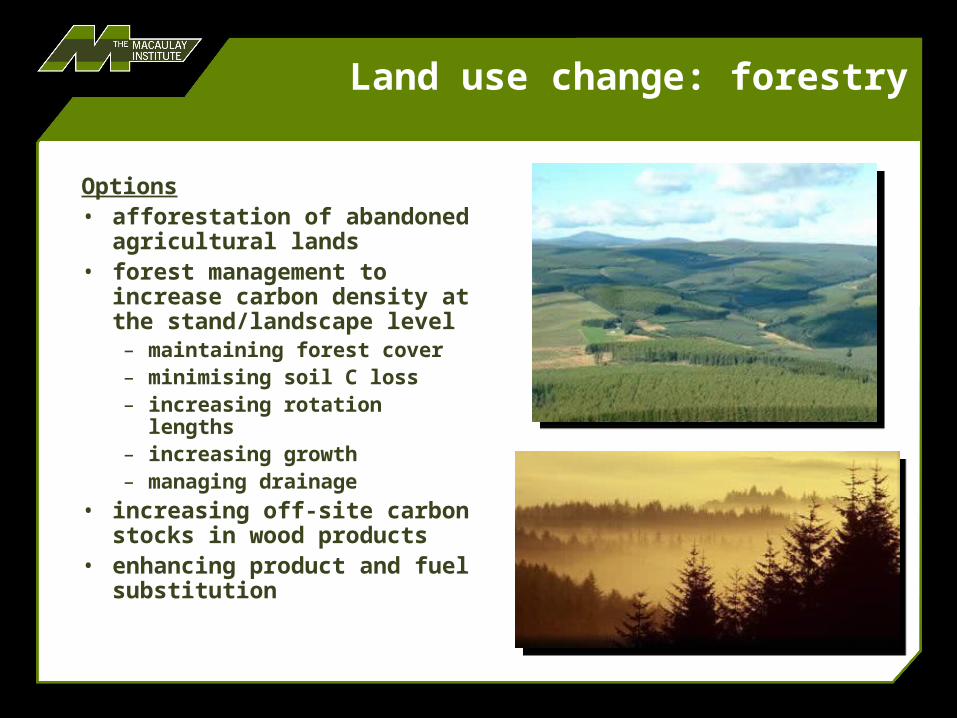
Options• afforestation of
abandoned agricultural lands
• forest management to increase carbon density at the stand/landscape level– maintaining forest cover– minimising soil C loss– increasing rotation
lengths– increasing growth– managing drainage
• increasing off-site carbon stocks in wood products
• enhancing product and fuel substitution
Land use change: forestry
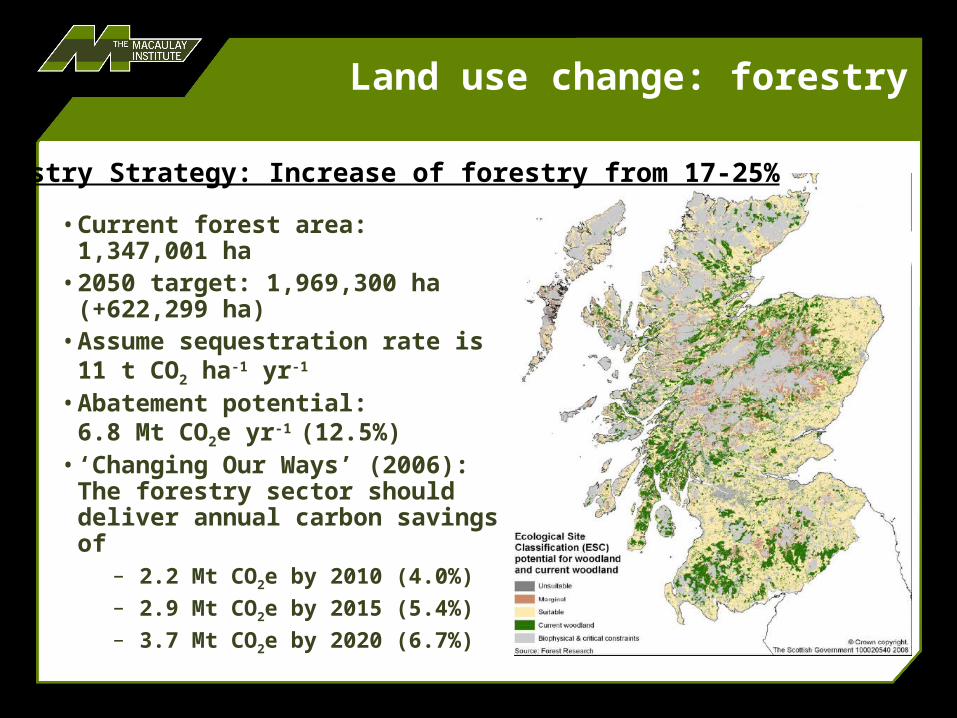
•Current forest area: 1,347,001 ha
•2050 target: 1,969,300 ha (+622,299 ha)
•Assume sequestration rate is11 t CO2 ha-1 yr-1
•Abatement potential: 6.8 Mt CO2e yr-1 (12.5%)
•‘Changing Our Ways’ (2006): The forestry sector should deliver annual carbon savings of
– 2.2 Mt CO2e by 2010 (4.0%)– 2.9 Mt CO2e by 2015 (5.4%)– 3.7 Mt CO2e by 2020 (6.7%)
Forestry Strategy: Increase of forestry from 17-25%
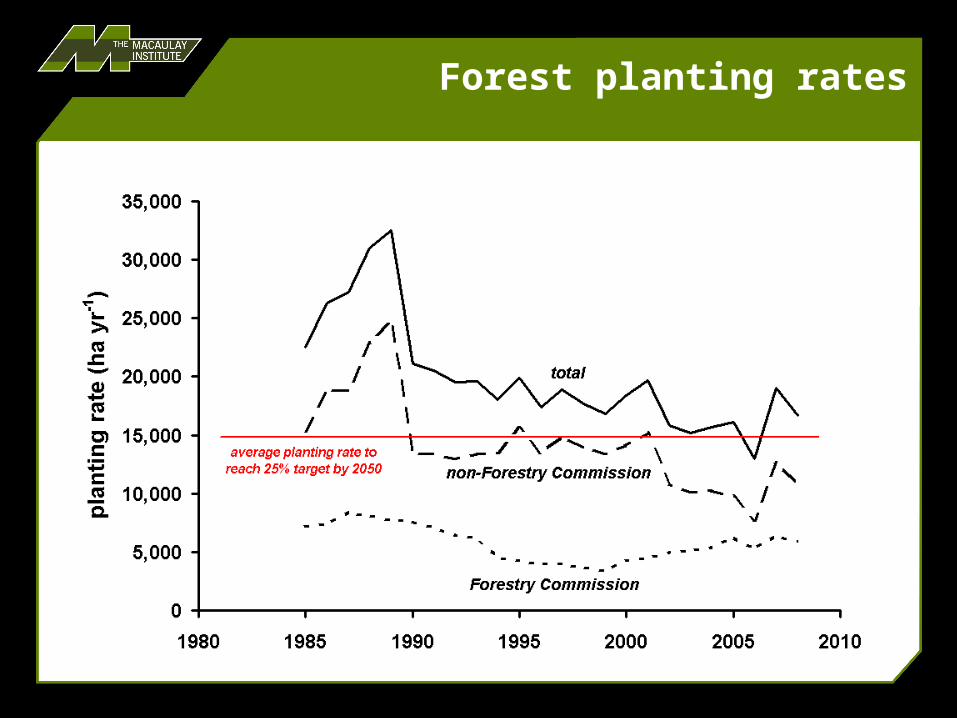
Forest planting rates
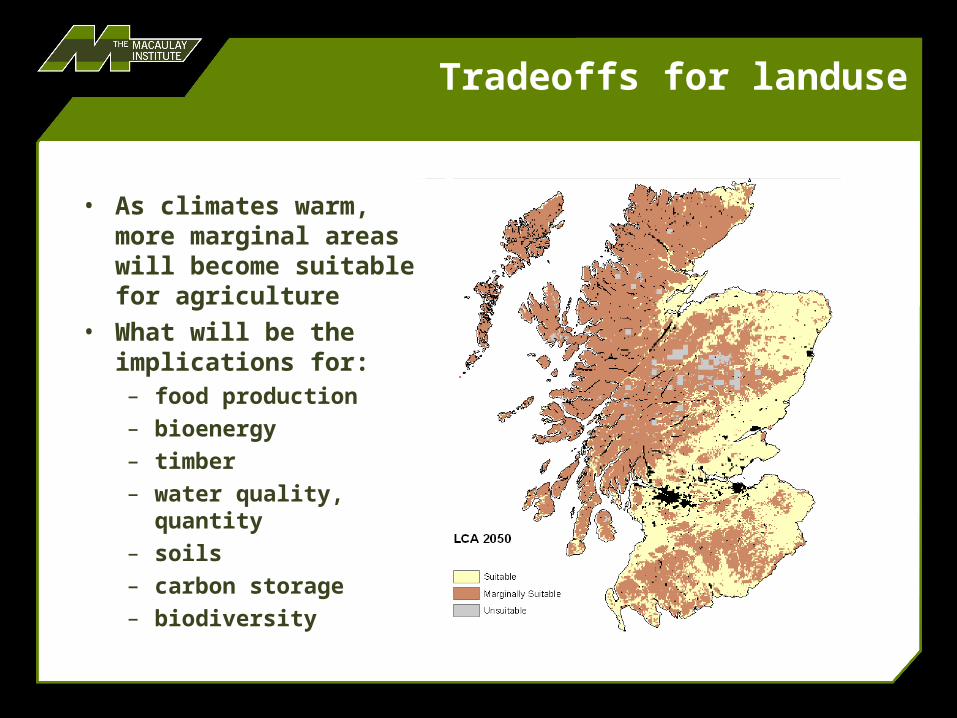
Tradeoffs for landuse
• As climates warm, more marginal areas will become suitable for agriculture
• What will be the implications for: – food production– bioenergy– timber– water quality,
quantity– soils– carbon storage– biodiversity
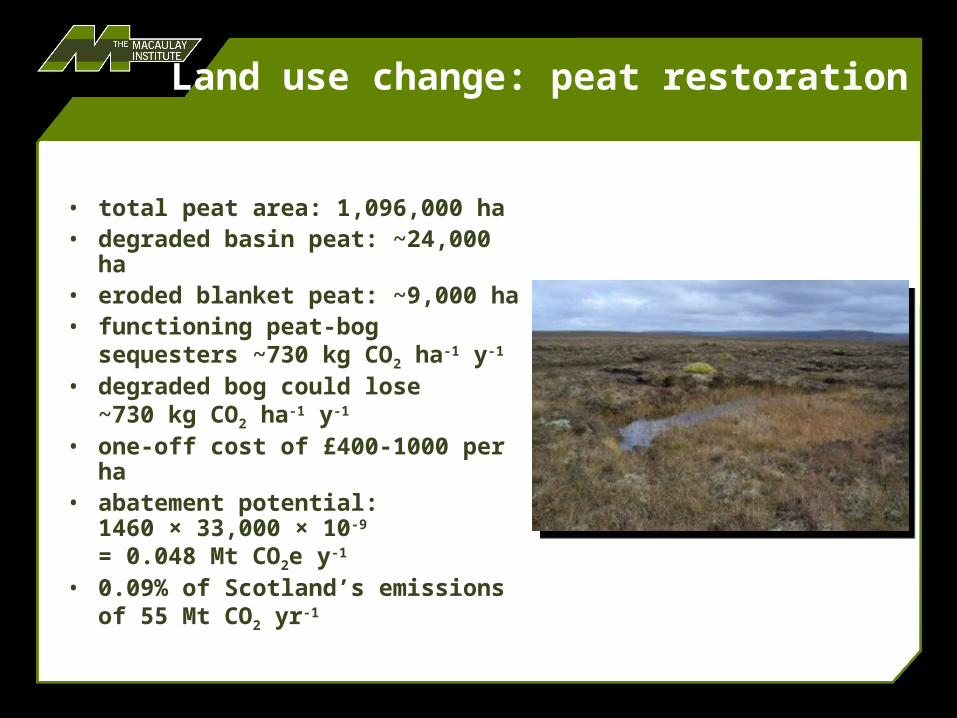
Land use change: peat restoration
• total peat area: 1,096,000 ha• degraded basin peat: ~24,000
ha• eroded blanket peat: ~9,000 ha• functioning peat-bog
sequesters ~730 kg CO2 ha-1 y-1
• degraded bog could lose~730 kg CO2 ha-1 y-1
• one-off cost of £400-1000 per ha
• abatement potential:1460 × 33,000 × 10-9 = 0.048 Mt CO2e y-1
• 0.09% of Scotland’s emissions of 55 Mt CO2 yr-1
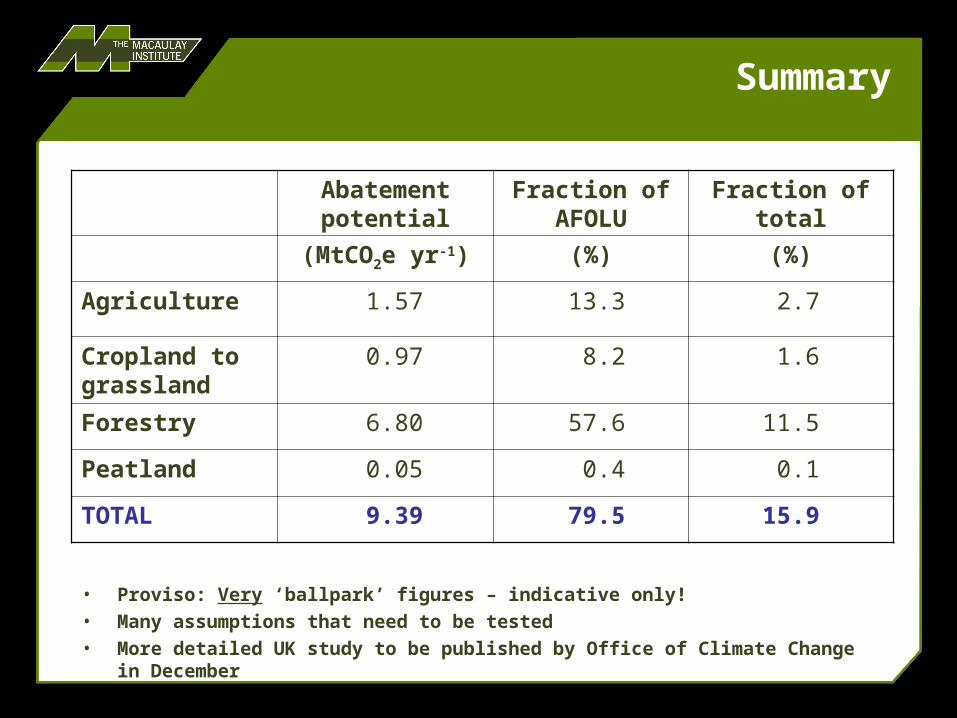
Summary
Abatement potential
Fraction of AFOLU
Fraction of total
(MtCO2e yr-1) (%) (%)
Agriculture 1.57 13.3 2.7
Cropland to grassland
0.97 8.2 1.6
Forestry 6.80 57.6 11.5
Peatland 0.05 0.4 0.1
TOTAL 9.39 79.5 15.9
• Proviso: Very ‘ballpark’ figures – indicative only!• Many assumptions that need to be tested• More detailed UK study to be published by Office of Climate Change in
December

Marginal abatement cost curves
•Options ranked in decreasing order of cost-effectiveness
•Width of each bar (x-axis): abatement potential (AP)
•Height of each bar (y-axis): cost-effectiveness (CE)
•Comparing the abatement scenario with a baseline
40
100
140 120 100 20 0
1,300
0
600
- 50
- 250
80
- 100 - 150
500 550
650
300 450
50
60
150
£ /tCO2e
MtCO2e
Cheap option, big emission savings
Expensive options, small emission savings
Financial savings