policy brief: co-patenting in india - indigo projects · pdf filepolicy brief: co-patenting in...
TRANSCRIPT

Hier steht der Kolumnentitel
Policy brief: Co-patenting in IndiaThe international dimension of patenting in India with special regard to the European Union
Florian Gruber, Centre for Social Innovation Florina Piroi, Institute of Software Technology and Interactive Systems, Vienna University of Technology
2 3
Hier steht der Kolumnentitel Table of contents
Table of contents
1 Introduction to patents ............................................................................................................................................4
2 Setting the scene .....................................................................................................................................................5
2.1 Current Indian patent policy issues ................................................................................................................5
2.2 State of art of patenting in India ...................................................................................................................6
2.3 The Indian Intellectual Property Office .........................................................................................................6
2.4 Qualitative aspects of Indian patents ...........................................................................................................9
2.5 Patent Cooperation Treaty (PCT) applications ........................................................................................... 10
2.6 India and the world: co-patents ....................................................................................................................12
2.7 Migration of inventors ....................................................................................................................................15
3 Thematic focus: Water, Energy, Health ................................................................................................................. 17
3.1 Health ................................................................................................................................................................ 17
3.2 Water ................................................................................................................................................................ 18
3.3 Energy ...............................................................................................................................................................21
4 Bibliography............................................................................................................................................................ 26
5 Glossary ................................................................................................................................................................... 27
Published byCentre for Social Innovation (ZSI)Linke Wienzeile 2461150 WienAustriaTel: +43 1 495 04 42 - 0www.zsi.at
E-mail: [email protected]
www. indigoprojects.eu
Copyright © 2014 INDIGO Policy
Date of publication: November 2014First edition 250 copies
All rights reserved. This publication or parts thereof may not be reproduced in any form or by any means without written permission from the authors.
The authors are solely responsible for the content which does not represent the opinion of the European Commission.
INDIGO Policy has received funding from the uropean Commission’s Seventh Framework Programme for research, technological development and demonstration under grant agreement no. 609535
Graphic design: Harald Göstl
Printed in Austria Page 1 Figure 1: Global co-inventions with India. Source: PATSTAT

4 5
Setting the sceneIntroduction to patents
1 Introduction to patents
Patents are an important indicator of inventive activity, and with subsequent entrepreneurial efforts, they can be used to develop, manufacture and mar-ket products and processes. They are mostly used to restrict others to use the patented information for economic gains. But patents also have the im-portant role of conveying information on the outputs of R & D efforts, as the disclosed and structured information in the patent documents can be used as a basis to develop further inventions.
Patents can be claimed for inventions that are new, involve an inventive step and can be used in industrial applications. Patents confer legal protec-tion to exclude others from using the patented invention for a specific pe-riod of time, usually 20 years from the first filing date. They are granted by national patent offices, and the protection is only valid in those countries where the invention was applied for. 1
This policy brief on patents first takes a look at current burning policy is-sues in Intellectual Property (IP) protection. It briefly introduces the Indian IP Office and general patenting in India. To assess the international dimen-sions of patents, this report subsequently turns to co-patenting: first on a global scale; looking briefly at the BRICS countries, and finally it looks at EU-India relevant cooperation in more detail. For the latter, the analysis was narrowed down to topics selected in the India-EU Strategic Roadmap for Innovation and Research: ‘energy’, ‘health’, and ‘water’, including their re-spective sub-topics.
Data from the Indian office of the Controller General of Patents, Designs, Trade Marks and Geographical Indication (CGPDTM) is employed to get a picture of the state of the art of Indian patents. In order to assess the inter-nationalisation aspects, PCT patent counts from the OECD StatExtracts da-tabase 2 based on data received from the EPO Bibliographic database are used. For specific thematic queries, the EPO Worldwide Statistical Patent Database (PATSTAT, Spring 2014) is applied.
1 OECD (2009), OECD Patent Statistics Manual2 http://stats.oecd.org
2 Setting the scene
2.1 Current Indian patent policy issues
The Indian patent system has been modified several times in the past to bet-ter reflect international standards for example in 2005 the global Agreement on Trade-Related Aspects of Intellectual Property Rights (TRIPS) 3. In this re-gard however, some needs of emerging countries differ from those of more developed nations. As the Controller General of CGPDTM presented during a recent BRICS IP conference 4, India’s approach to IP rights is to provide a balance between the rights of inventors and the interests of society at large, and the Indian IP legislation strives to maintain this balance.
One point of discussion is the issue of compulsory licences 5, which at least theoretically is one of the major flexibilities allowed under TRIPS. The Indian government has recommended three anti-cancer drugs for compul-sory licencing in order to make these otherwise very expensive drugs afford-able for the Indian population 6. Compulsory licencing is seen as very crit-ical by (pharma) firms from more developed countries such as Bayer, and pressure is also being put on India by the US government 7. “… US industry, particularly the pharmaceuticals sector, and trade lobbies putting pressure on their government to place India under the Priority Foreign Country list for IPR.” However, there is also a counter-movement from enterprises such as Boeing, Abbott, Maruti-Suzuki and Honeywell that confirm their belief in the strength of the Indian IPR system to adhere to global standards. 8
In a statement to the World Intellectual Property Organisation (WIPO) standing committee on the Law of Patents, Mr Andrew Jenner from the International Federation of Pharmaceutical Manufacturers (IFPMA) said that compulsory licencing sets a negative precedent and can reduce the incen-tive to invest in the research and development of new medicines. He be-lieves that negotiated approaches, such as tiered pricing or voluntary li-censing are generally more effective and sustainable, both medically and economically. 9
During a recent TRIPS council meeting from the 25th to the 26th of February 2014, the Indian representative remarked that “… if patent mo-nopolies had existed a hundred years ago, the world would not have seen the current revolutions in fields such as telecommunications, pharmaceuti-cals, engineering, and information technology”. India proposed that devel-oping countries should be able to define their own patent threshold on the basis of their socio economic development. 10
Partly in order to counter the IP-related pressure from developed coun-tries, leading emerging economies, in a separate meeting during the WIPO annual General Assembly in September 2013, signed an agreement
3 The TRIPS Agreement, which came into effect on 1 January 1995, is to date the most comprehensive multilateral global agreement on intellectual property. http://www.wto.org/english/tratop_e/trips_e/intel2_e.htm
4 Reported at: http://www.ip-watch.org/2013/11/27/brics-launch-their-own-plan-for-ip-cooperation-india-defends-itself/ 5 Compulsory licensing is when a government allows someone else to produce the patented product or process without the consent of the patent owner.
See: http://www.wto.org/english/tratop_e/trips_e/public_health_faq_e.htm 6 Reported at: http://www.ip-watch.org/2013/01/22/2013-india-battles-for-right-to-use-compulsory-licences-to-make-medicines-affordable/ 7 http://www.ip-watch.org/2014/02/18/battles-over-patents-is-india-changing-the-rules-of-the-game/ 8 http://www.financialexpress.com/news/indian-patent-law-very-strong-at-par-with-global-standards-maruti-suzuki/1256912/ 9 IFPMA Statement to the WIPO Standing Committee on the Law of Patents (SCP), Geneva, 12 October 201010 Reported at: http://www.ip-watch.org/2014/02/27/trips-council-discussion-of-ip-and-innovation-irritates-india-other-issues-unchanged/
“Patents are a key measure of innovation output, as patent indicators reflect the inventive perfor-mance of countries, regions, technologies, firms, etc. They are also used to track the level of diffusion of knowledge across technology areas, countries, sectors, firms, etc., and the level of internationalisa-tion of innovative activities. Patent indicators can serve to measure the output of R & D, its productivi-ty, structure and the development of a specific technology / industry. Among the few available indica-tors of technology output, patent indicators are probably the most frequently used. The relationship between patents as an intermediate output resulting from R & D inputs has been investigated exten-sively. Patents are often interpreted as an output indicator; however, they could also be viewed as an input indicator, as patents are used as a source of information by subsequent inventors.”
— OECD 2009

6 7
Setting the sceneSetting the scene
for IP cooperation: the “BRICS Intellectual Property Offices Cooperation Roadmap” 11. The roadmap sets out several “cooperation streams” among the BRICS countries: Brazil, Russia, India, China and South Africa:
○ Training of Intellectual Property Office staff○ IP / Patent processes and procedures including search, classification
and translation○ Promotion of public awareness on IP in BRICS countries○ National IP strategy and IP strategy for enterprises○ Information services on IP, e.g. exchange of patent documentation,
taking account of local legislation○ Collaboration in international forums as required and subject to
consensus○ Examiner exchange programme
The efficacy of this new inter-organisational body and the weight it will be able to put into international IP-related negotiations is yet to be seen.
2.2 State of art of patenting in India
The first Indian patent law was known as the Act VI of 1856 on Protection of Inventions, with subsequent modifications being published since. At present the patent system in India is governed by the Patents Act of 1970, amended by the Patents (Amendment) Act 2005 and by the Patents Rules, of 2003, as amended by the Patents Rules of 2006.
India became a contracting state to the Patent Cooperation Treaty (PCT) which is administered by WIPO on the 7th of December 1998. Under the PCT system, a person can file a single application for example in India to seek protection from the PCT for all contracting parties. The PCT procedure works through a unified filing procedure that is standardised for all participating IP Offices. Applicants would otherwise require more time to fulfil different na-tional requirements as they seek protection for their invention, time which could otherwise be used to evaluate their chances of obtaining a grant for the patent and finally of being able to economically exploit the invention. It is now the most popular route among inventors targeting worldwide mar-kets and it is used increasingly by Indian applicants.
2.3 The Indian Intellectual Property Office 12
The CGPDTM is a subordinate of the Department of Industrial Policy and Promotion under the Ministry of Commerce and Industry.
In the recent past there has been a significant drop in the number of pat-ents granted by the Indian Patent Office, not because of a reduction of the Indian inventive activities, but because of a shortage of examiners as well as more stringent examination guidelines for patent applications. The decline from 2008 / 2009 to 2012 / 2013 was 72.96 % in granted patents.
“There are two reasons for this drop, one being shortage of examin-ers as examiners were promoted to controller rank. Another reason is that from 2009 onwards, quality system was introduced in the patent office by adopting patent manual, patent office procedures and various guidelines
11 http://www.ip-watch.org/weblog/wp-content/uploads/2013/11/SIGNED-BRICS-IP-OFFICES-COOPERATION-ROADMAP.pdf12 Data in this section is mainly derived from the annual report 2012 – 2013 of the Indian IP Office
regarding quality examination,” said Rakesh Kumar, Deputy Controller of Patents and Designs and Head of Mumbai office. 13 That might also be the reason for the considerable backlog existing currently in the Indian IP Office, with 119,889 patents still being in the allotment stocks of the examiners 14
Patent filing at the Indian Patent Office has seen a rise of 23.97 % from 2008 / 2009 to 2012 / 2013, with 22 % of these patents filed by Indian applicants in just 2012 / 2013. While a total of 43.663 patents were filed in 2012 / 2013, a majority or to be precise 78 %of these patent applications were internation-al applications. Classification of technical fields is a slightly different from the internationally used classifications, such as the International Patent Classification (IPC) or the more specific Cooperative Patent Classification (CPC), which is an extension of the IPC and is jointly managed by the EPO and the US Patent and Trademark Office. The thematic distribution of pat-ent applications filed in India from 2008 to 2013 is shown in figure 3. There are three fields of invention that stand out. ‘Mechanical’ inventions have risen significantly in the past years, and ‘computer / electronics’ have had a sharp drop from 2010 / 2011 onwards. The highest increase was in ‘other fields’. The sub-thematic distribution of patent applications in this catego-ry, which encompass “various, other and new fields of invention” of specif-ic interest to India, in absolute numbers are shown in figure 4 for the year 2012 / 2013. The inventive fields of ‘communication’ followed by ‘physics’ fea-ture most prominently.
13 http://www.financialexpress.com/news/india-sees-sharp-drop-in-patent-applications/1216693/14 October 2014; real time data from: http://ipindiaonline.gov.in/stockandflow/
Filed
Examined
Granted
Disposal of request for examination
50,000
45,000
40,000
35,000
30,000
25,000
20,000
15,000
10,000
5,000
02008 – 2009 2009 – 2010 2010 – 2011 2011 – 2012 2012 – 2013
Figure 2: Trends in Indian patent applications. Source: India IP Office
Bio-technology
Chemical
Computer / electronics
Drug
Electrical
Food
General engineering
Mechanical
Other fields
15,000
13,500
12,000
10,500
9,000
7,500
6,000
4,500
3,000
1,500
02008 – 2009 2009 – 2010 2010 – 2011 2011 – 2012 2012 – 2013
Figure 3: Indian patent applications per technological field and year. Source: India IP Office
8 9
Setting the sceneSetting the scene
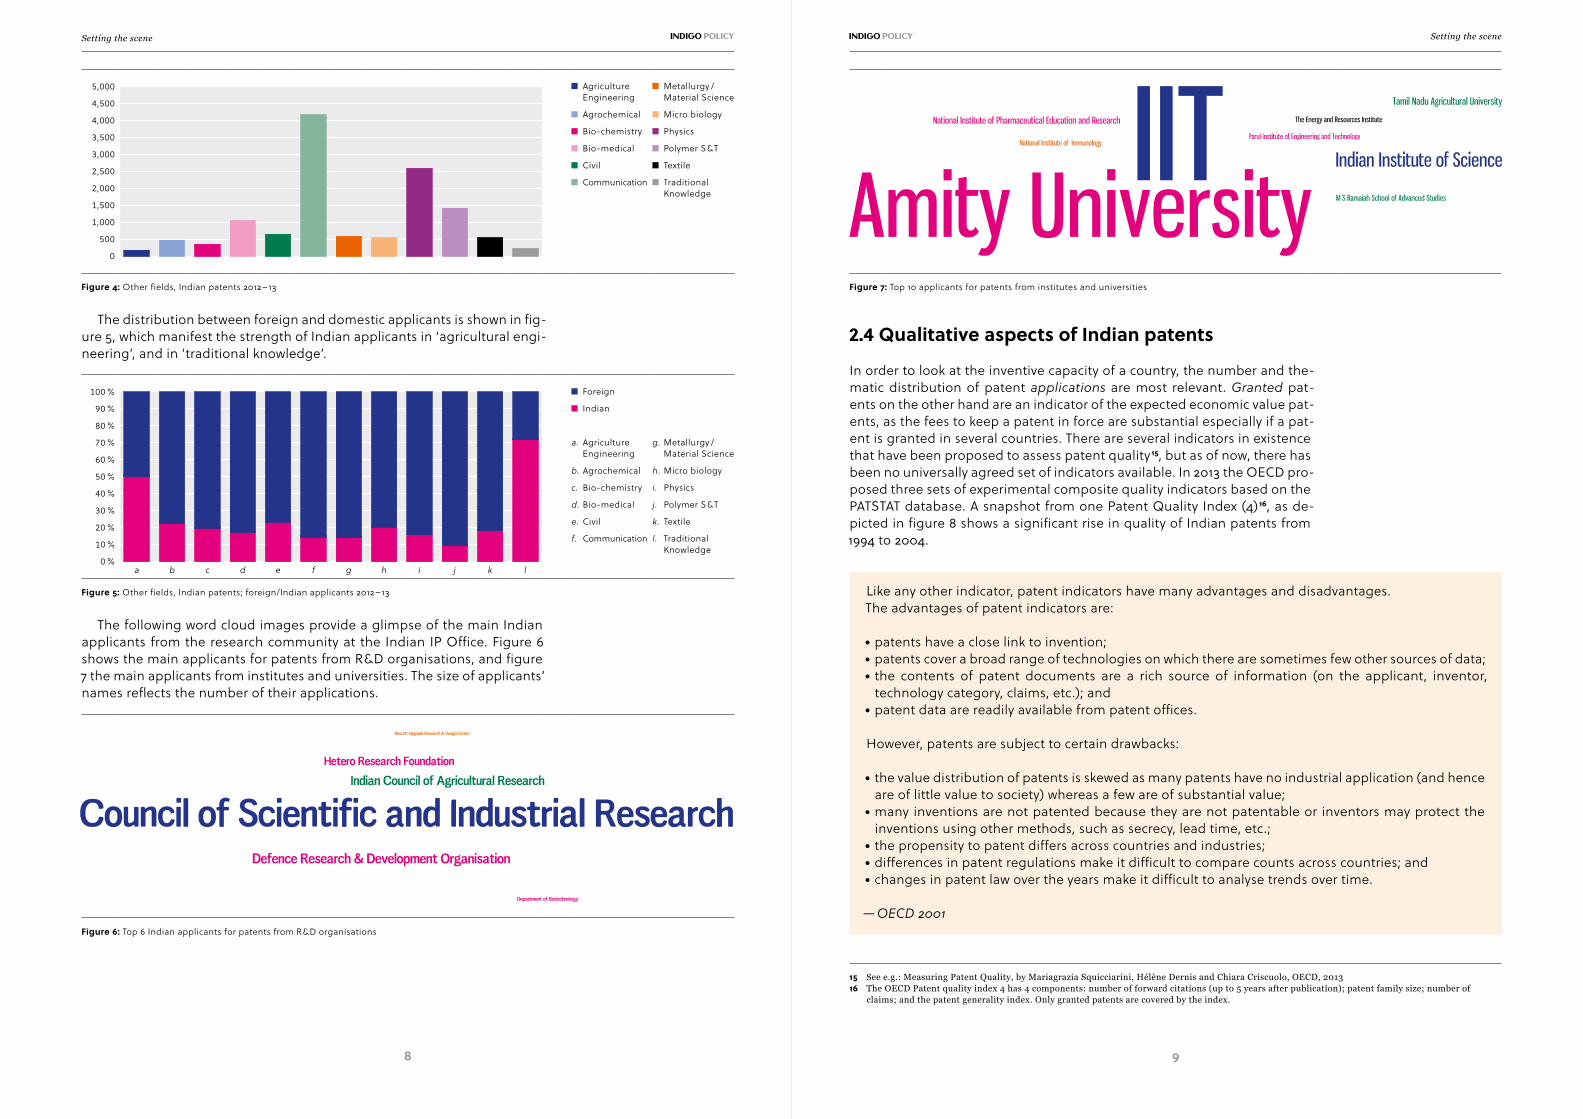
The distribution between foreign and domestic applicants is shown in fig-ure 5, which manifest the strength of Indian applicants in ‘agricultural engi-neering’, and in ‘traditional knowledge’.
The following word cloud images provide a glimpse of the main Indian applicants from the research community at the Indian IP Office. Figure 6 shows the main applicants for patents from R & D organisations, and figure 7 the main applicants from institutes and universities. The size of applicants’ names reflects the number of their applications.
2.4 Qualitative aspects of Indian patents
In order to look at the inventive capacity of a country, the number and the-matic distribution of patent applications are most relevant. Granted pat-ents on the other hand are an indicator of the expected economic value pat-ents, as the fees to keep a patent in force are substantial especially if a pat-ent is granted in several countries. There are several indicators in existence that have been proposed to assess patent quality 15, but as of now, there has been no universally agreed set of indicators available. In 2013 the OECD pro-posed three sets of experimental composite quality indicators based on the PATSTAT database. A snapshot from one Patent Quality Index (4) 16, as de-picted in figure 8 shows a significant rise in quality of Indian patents from 1994 to 2004.
15 See e.g.: Measuring Patent Quality, by Mariagrazia Squicciarini, Hélène Dernis and Chiara Criscuolo, OECD, 201316 The OECD Patent quality index 4 has 4 components: number of forward citations (up to 5 years after publication); patent family size; number of
claims; and the patent generality index. Only granted patents are covered by the index.
Agriculture Engineering
Agrochemical
Bio-chemistry
Bio-medical
Civil
Communication
Metallurgy /Material Science
Micro biology
Physics
Polymer S & T
Textile
Traditional Knowledge
5,000
4,500
4,000
3,500
3,000
2,500
2,000
1,500
1,000
500
0
Figure 4: Other fields, Indian patents 2012 – 13
Foreign
Indian
a. Agriculture Engineering
b. Agrochemical
c. Bio-chemistry
d. Bio-medical
e. Civil
f. Communication
g. Metallurgy /Material Science
h. Micro biology
i. Physics
j. Polymer S & T
k. Textile
l. Traditional Knowledge
100 %
90 %
80 %
70 %
60 %
50 %
40 %
30 %
20 %
10 %
0 %a b c d e f g h i j k l
Figure 5: Other fields, Indian patents; foreign/Indian applicants 2012 – 13
Figure 6: Top 6 Indian applicants for patents from R & D organisations
Figure 7: Top 10 applicants for patents from institutes and universities
Like any other indicator, patent indicators have many advantages and disadvantages. The advantages of patent indicators are:
○ patents have a close link to invention;○ patents cover a broad range of technologies on which there are sometimes few other sources of data;○ the contents of patent documents are a rich source of information (on the applicant, inventor,
technology category, claims, etc.); and○ patent data are readily available from patent offices.
However, patents are subject to certain drawbacks:
○ the value distribution of patents is skewed as many patents have no industrial application (and hence are of little value to society) whereas a few are of substantial value;
○ many inventions are not patented because they are not patentable or inventors may protect the inventions using other methods, such as secrecy, lead time, etc.;
○ the propensity to patent differs across countries and industries;○ differences in patent regulations make it difficult to compare counts across countries; and○ changes in patent law over the years make it difficult to analyse trends over time.
— OECD 2001

10 11
Setting the sceneSetting the scene
2.5 Patent Cooperation Treaty (PCT) applications
PCT applications have a special value for scientific analysis, as the unified application framework used in this kind of patenting facilitates comparisons between countries and regions. In India, the majority of foreign applications are filed through the PCT national phase route 17 from abroad. In 2012 / 2013, a total number of 28,435 foreign PCT patent applications were filed in India a small decrease from the previous reporting period (28,965). The interna-tional distribution is shown in figure 9, with the main foreign resident ap-plicants shown in figure 10.
As concerns first filing directly at the Indian IP Office, in the reporting pe-riod 2012 / 2013 a total number of 1,042 patents were filed through the PCT route, which shows a remarkably high use of the PCT by Indian applicants to protect their inventions abroad. 18 Major Indian PCT applicants were: Hetero Research Foundation, Ineda Systems Pvt. Limited, Mylan Laboratories Limited, TVS Motors Company Limited, Tata Steel Limited, Tega Industries Limited, Natco Pharma Limited and Dr Reddys Laboratory Limited.
17 “The national phase is the second of the two main phases of the PCT procedure. It follows the international phase and consists in the processing of the international application before each Office of or acting for a Contracting State that has been designated in the international application (see International Phase). In each designated State the international application has the effect of a national (or regional) application as from the international filing date, and the decision to grant protection for the invention is the task of the Office of or acting for that State (the ‘designated Office’).” http://www.wipo.int/pct/en/guide/np02.html
18 Intellectual Property India, Annual Report 2012 – 2013 of the Office of the Controller General of Patents, Designs, Trade Marks and Geographical Indications
These figures by the Indian IP Office do not include applications that are filed directly by Indian applicants in the International Bureau of WIPO. By taking the data from the OECD StatExtract database more applications can be seen.
Figure 11 shows the rise of of PCT applications with Indian applicants and inventors: 19
Figure 12 shows the cross-cutting technology distribution of patents. Here a sharp rise in ICT patent applications with inventors from India, both in percentage of the whole as well as in absolute numbers can be seen. Pharmaceuticals started from a higher number in 2002 but have experi-ence only a moderate rise over the past few years in comparison to the oth-er areas.
The number of patents included in the PATSTAT database that are first filed at the Indian IP Office are smaller than those in the StatExtract da-tabase. The reason for this discrepancy is the use of different algorithms for allocating missing country information of patents. However, as figure 13 shows, it is interesting to see where to these applications first filed in India were subsequently filed; in which countries Indian applicants w additional-ly wanted to protect their IP rights. Other than in India, patent protection is notably also asked for in the USA and at the European Patent Office (EP); followed later on by Japan, Canada, China and Australia. 20
19 http://stats.oecd.org, accessed 2. 10. 201420 EA in this figure means the Eurasian Patent Organization
1994
2004
0.30
0.25
0.20
0.15
0.10
0.05
0AT BR CN DE ES IN JP SG World
Figure 8: OECD experimental Patent Quality Index 4
Figure 9: Top 10 foreign resident patent applicants in India
Figure 10: PCT national phase applications by foreign country resident
Indian inventors
Indian applicants
2,000
1,750
1,500
1,250
1,000
750
500
250
01999 2000 2001 2002 2003 2004 2005 2006 2007 2008 2009 2010 2011
Figure 11: PCT applications with Indian applicant / inventor. Source: StatExtracts

12 13
Setting the sceneSetting the scene
2.6 India and the world: co-patents
Increasingly, inventions are developed through international coopera-tion. Each patent document lists one or more inventor(s) and one or more applicant(s) including information on their origin countries. This data can be used to assess the volume of international R & D cooperation, mainly by two indicators: cross-border ownership of patents and co-inventions (meth-odological explanation see box). This paper uses PCT patent applications to compare patents from India and the rest of the world. This is meaningful because of its unified application framework in all participating countries. Furthermore, data on co-patenting is available in international patent data-bases such as the EPO / PATSTAT database where at least one country, other than India, is involved in this cooperation. 21
Figure 14 is taken from OECD’s “Comparative performance of nation-al science and innovation systems”, which sets the Indian data on the one hand in comparison to the OECD countries as a whole, and on the oth-er hand specifically to the BRICS countries’ performance. Interesting is the low level of co-authorship in scientific journals from the Indian side (scor-ing ‘4’ in relation to the sample median of ‘100’ of all OECD countries), but the significantly high level of international cooperation through co-inven-tions (with a score of ‘104’ being above the OECD sample median). This is also reflected to a minor extent by other BRICS countries. Only South Africa shows an inverted profile.
21 According to the global patent coverage PDF from EPO / PATSTAT, India provided patent information for the period 1975 – 2005; see: https://data.epo.org/data/data.html
In absolute figures, the number of PCT co-inventions have grown signif-icantly especially for China, while the other BRICS countries show a more moderate increase; see figure 15.
Concerning the regional dimension, the percentage of regional patent applications with co-inventors from other regions, is an indicator of inno-vation co-operation activity between localities. More than 60 % of patents in OECD countries are applied for by two or more inventors. The share of co-patenting of the total Patent Cooperation Treaty (PCT) applications are typ-ically high for patenting leaders (such as the United States), more marginal
Cross-border ownership of patents reflects international flows of knowledge from the inventor coun-try to the applicant countries and international flows of funds for research (multinational companies). In most cases, patents with inventors from abroad correspond to inventions made at the research lab-oratories of multinational companies and applied for at company headquarters (although in some cases national subsidiaries also may own or co-own the patents). Hence, this indicator expresses the extent to which foreign firms control domestic inventions.
Co-inventions represent the international collaboration in the inventive process. International col-laboration by researchers can take place either within a multinational corporation (with research fa-cilities in several countries) or through co-operative research among several firms or institutions (col-laboration between inventors belonging to different universities or public research organisations). In that sense, co-invention indicators also reflect international flows of knowledge.
More info: OECD 2009
Biotechnology
ICT
Nanotechnology
Medical technology
Pharmaceuticals
700
600
500
400
300
200
100
02002 2003 2004 2005 2006 2007 2008 2009 2010 2011
Figure 12: PCT Patents by cross-cutting technology, India as inventor country. Source: StatExtracts
Country2,500
2,250
2,000
1,750
1,500
1,250
1,000
750
500
250
0US EP JP CA CN AU MX BR DE EA AT IL KR NZ GB
Figure 13: Second filings of patents first filed in India. Source: PATSTAT
International co-authorship
International co-patenting
120
100
80
60
40
20
0
− 20BR CN IN RU ZA
Figure 14: OECD Comparative performance of national science and innovation systems: BRICS in relation to OECD median
BR
CN
IN
RU
ZA
20,000
17,500
15,000
12,500
10,000
7,500
5,000
2,500
02000 2001 2002 2003 2004 2005 2006 2007 2008 2009 2010 2011
Figure 15: International co-invention, number of PCT patent applications. Source: StatExtracts
14 15
Setting the sceneSetting the scene
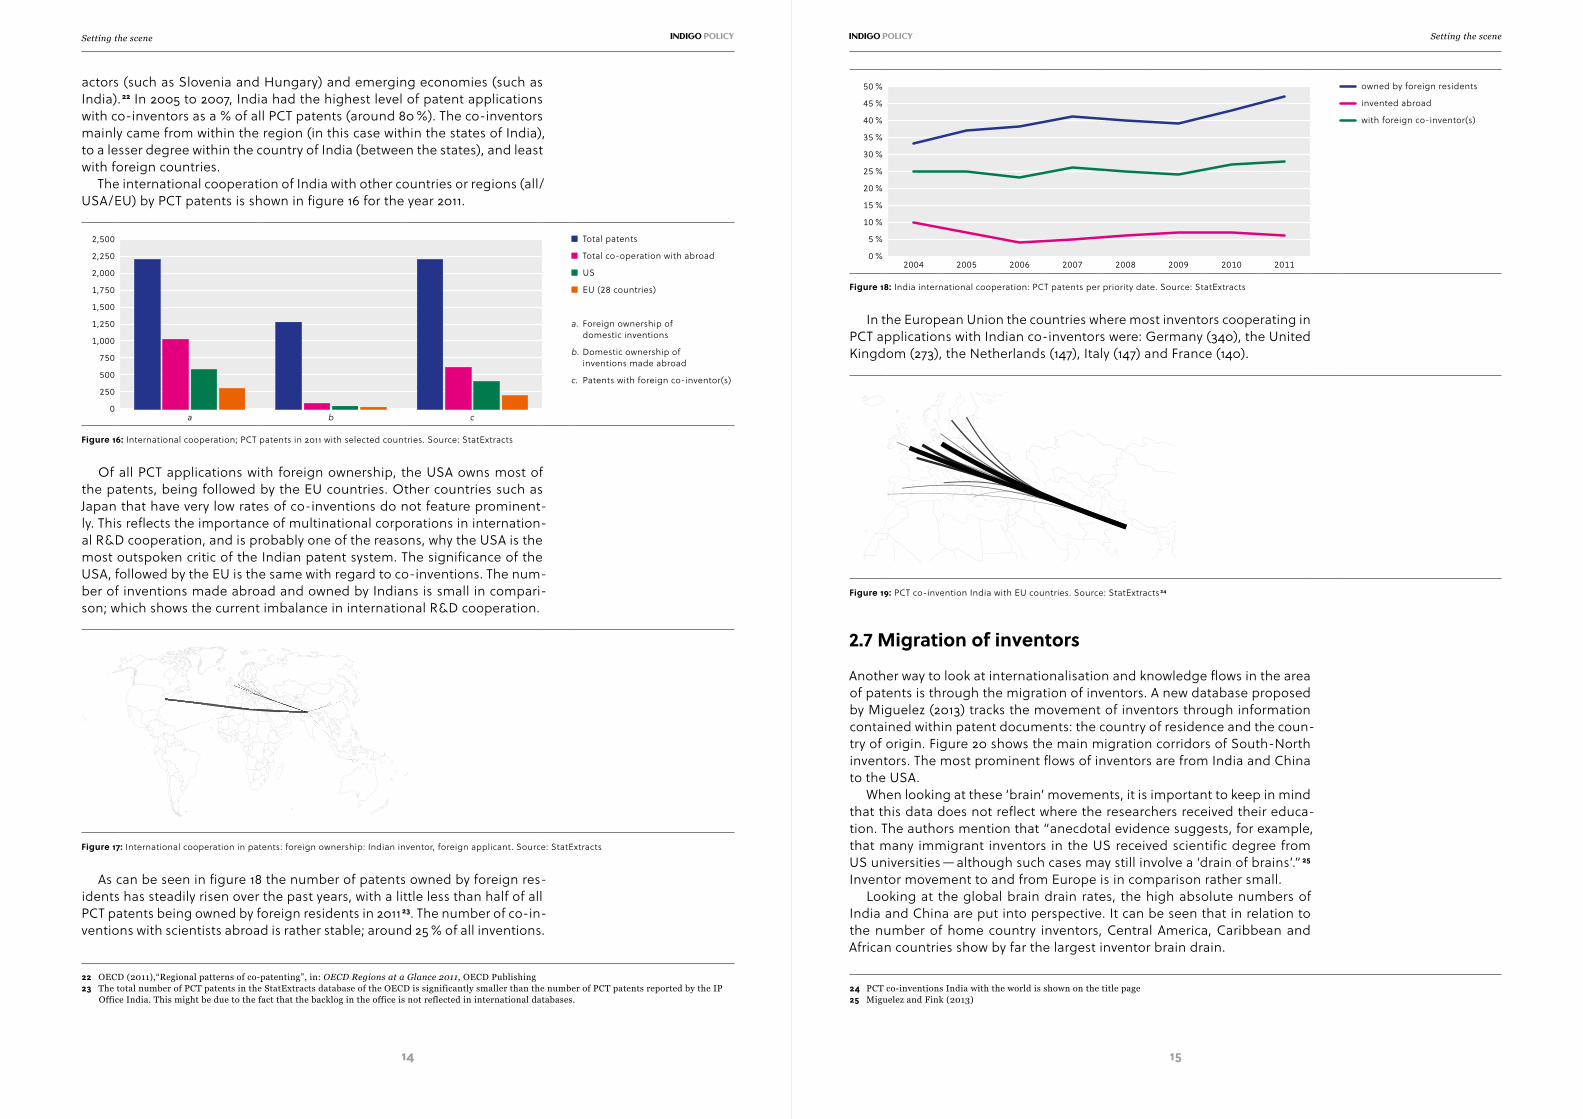
actors (such as Slovenia and Hungary) and emerging economies (such as India). 22 In 2005 to 2007, India had the highest level of patent applications with co-inventors as a % of all PCT patents (around 80 %). The co-inventors mainly came from within the region (in this case within the states of India), to a lesser degree within the country of India (between the states), and least with foreign countries.
The international cooperation of India with other countries or regions (all /USA / EU) by PCT patents is shown in figure 16 for the year 2011.
Of all PCT applications with foreign ownership, the USA owns most of the patents, being followed by the EU countries. Other countries such as Japan that have very low rates of co-inventions do not feature prominent-ly. This reflects the importance of multinational corporations in internation-al R & D cooperation, and is probably one of the reasons, why the USA is the most outspoken critic of the Indian patent system. The significance of the USA, followed by the EU is the same with regard to co-inventions. The num-ber of inventions made abroad and owned by Indians is small in compari-son; which shows the current imbalance in international R & D cooperation.
As can be seen in figure 18 the number of patents owned by foreign res-idents has steadily risen over the past years, with a little less than half of all PCT patents being owned by foreign residents in 2011 23. The number of co-in-ventions with scientists abroad is rather stable; around 25 % of all inventions.
22 OECD (2011),“Regional patterns of co-patenting”, in: OECD Regions at a Glance 2011, OECD Publishing23 The total number of PCT patents in the StatExtracts database of the OECD is significantly smaller than the number of PCT patents reported by the IP
Office India. This might be due to the fact that the backlog in the office is not reflected in international databases.
In the European Union the countries where most inventors cooperating in PCT applications with Indian co-inventors were: Germany (340), the United Kingdom (273), the Netherlands (147), Italy (147) and France (140).
2.7 Migration of inventors
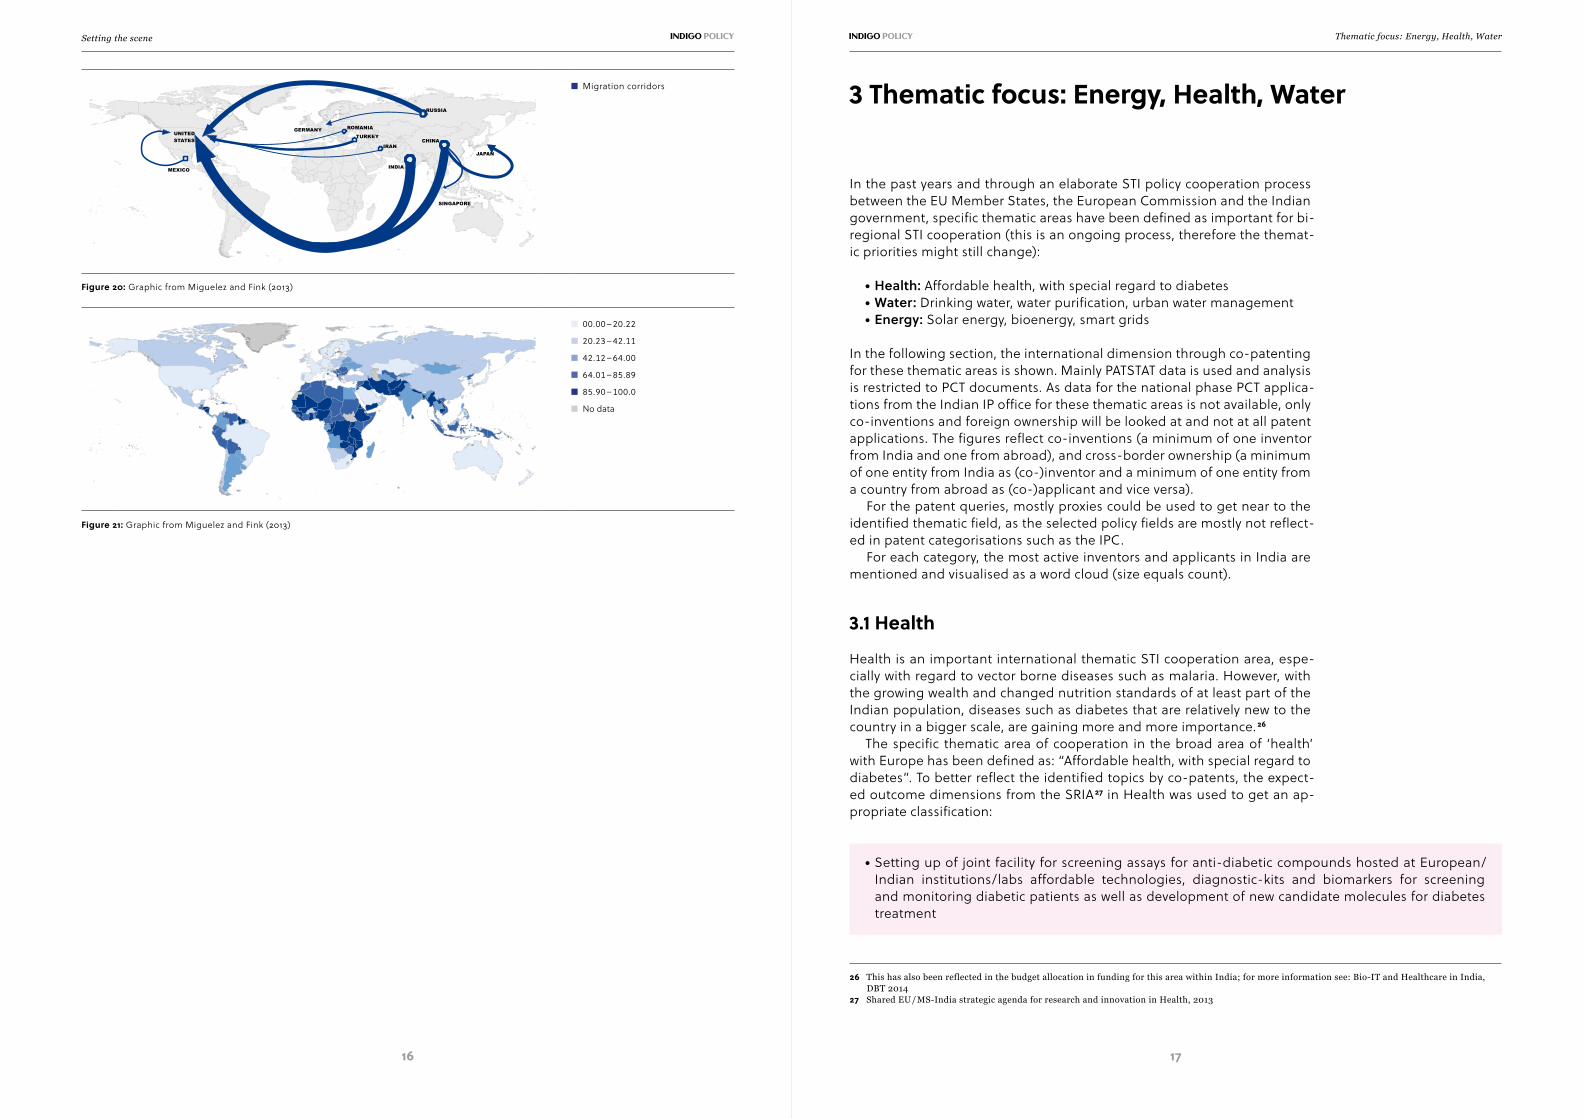
Another way to look at internationalisation and knowledge flows in the area of patents is through the migration of inventors. A new database proposed by Miguelez (2013) tracks the movement of inventors through information contained within patent documents: the country of residence and the coun-try of origin. Figure 20 shows the main migration corridors of South-North inventors. The most prominent flows of inventors are from India and China to the USA.
When looking at these ‘brain’ movements, it is important to keep in mind that this data does not reflect where the researchers received their educa-tion. The authors mention that “anecdotal evidence suggests, for example, that many immigrant inventors in the US received scientific degree from US universities — although such cases may still involve a ‘drain of brains’.” 25 Inventor movement to and from Europe is in comparison rather small.
Looking at the global brain drain rates, the high absolute numbers of India and China are put into perspective. It can be seen that in relation to the number of home country inventors, Central America, Caribbean and African countries show by far the largest inventor brain drain.
24 PCT co-inventions India with the world is shown on the title page25 Miguelez and Fink (2013)
Total patents
Total co-operation with abroad
US
EU (28 countries)
a. Foreign ownership of domestic inventions
b. Domestic ownership of inventions made abroad
c. Patents with foreign co-inventor(s)
2,500
2,250
2,000
1,750
1,500
1,250
1,000
750
500
250
0a b c
Figure 16: International cooperation; PCT patents in 2011 with selected countries. Source: StatExtracts
Figure 17: International cooperation in patents: foreign ownership: Indian inventor, foreign applicant. Source: StatExtracts
owned by foreign residents
invented abroad
with foreign co-inventor(s)
50 %
45 %
40 %
35 %
30 %
25 %
20 %
15 %
10 %
5 %
0 %2004 2005 2006 2007 2008 2009 2010 2011
Figure 18: India international cooperation: PCT patents per priority date. Source: StatExtracts
Figure 19: PCT co-invention India with EU countries. Source: StatExtracts 24
16 17
Thematic focus: Energy, Health, WaterSetting the scene
3 Thematic focus: Energy, Health, Water
In the past years and through an elaborate STI policy cooperation process between the EU Member States, the European Commission and the Indian government, specific thematic areas have been defined as important for bi-regional STI cooperation (this is an ongoing process, therefore the themat-ic priorities might still change):
○ Health: Affordable health, with special regard to diabetes○ Water: Drinking water, water purification, urban water management○ Energy: Solar energy, bioenergy, smart grids
In the following section, the international dimension through co-patenting for these thematic areas is shown. Mainly PATSTAT data is used and analysis is restricted to PCT documents. As data for the national phase PCT applica-tions from the Indian IP office for these thematic areas is not available, only co-inventions and foreign ownership will be looked at and not at all patent applications. The figures reflect co-inventions (a minimum of one inventor from India and one from abroad), and cross-border ownership (a minimum of one entity from India as (co-)inventor and a minimum of one entity from a country from abroad as (co-)applicant and vice versa).
For the patent queries, mostly proxies could be used to get near to the identified thematic field, as the selected policy fields are mostly not reflect-ed in patent categorisations such as the IPC.
For each category, the most active inventors and applicants in India are mentioned and visualised as a word cloud (size equals count).
3.1 Health
Health is an important international thematic STI cooperation area, espe-cially with regard to vector borne diseases such as malaria. However, with the growing wealth and changed nutrition standards of at least part of the Indian population, diseases such as diabetes that are relatively new to the country in a bigger scale, are gaining more and more importance. 26
The specific thematic area of cooperation in the broad area of ‘health’ with Europe has been defined as: “Affordable health, with special regard to diabetes”. To better reflect the identified topics by co-patents, the expect-ed outcome dimensions from the SRIA 27 in Health was used to get an ap-propriate classification:
26 This has also been reflected in the budget allocation in funding for this area within India; for more information see: Bio-IT and Healthcare in India, DBT 2014
27 Shared EU / MS-India strategic agenda for research and innovation in Health, 2013
○ Setting up of joint facility for screening assays for anti-diabetic compounds hosted at European /Indian institutions / labs affordable technologies, diagnostic-kits and biomarkers for screening and monitoring diabetic patients as well as development of new candidate molecules for diabetes treatment
Migration corridors
Figure 20: Graphic from Miguelez and Fink (2013)
00.00 – 20.22
20.23 – 42.11
42.12 – 64.00
64.01 – 85.89
85.90 – 100.0
No data
Figure 21: Graphic from Miguelez and Fink (2013)
CHINA
INDIA
JAPAN
RUSSIA
SINGAPORE
UNITEDSTATES
MEXICO
ROMANIA
TURKEY
IRAN
GERMANY
18 19
Thematic focus: Energy, Health, WaterThematic focus: Energy, Health, Water
There is no patent class for ‘affordable health’, as this is not a techno-logical area but a term more related to frugal innovation. The cross-cut-ting category Y10S514 / 866 ‘diabetes’ for the specific classification search and G01N2800 / 00 ‘detection or diagnosis of diseases’ was used to get a basis for the research as most of the outcome dimensions are concerned with this. However, no co-patents with India could be found in these categories in PATSTAT. From the data of the Indian IP office it can be seen that under the field of ‘bio-medical’ invention, in the category ‘various, other and new fields of invention’ a total number of 1,053 patent applications were filed in 2012 / 2013. 183 of these applications were filed by Indian applicants, and 870 by applicants from abroad. In the same year, 11 patents were granted in this field to solely foreign applicants.
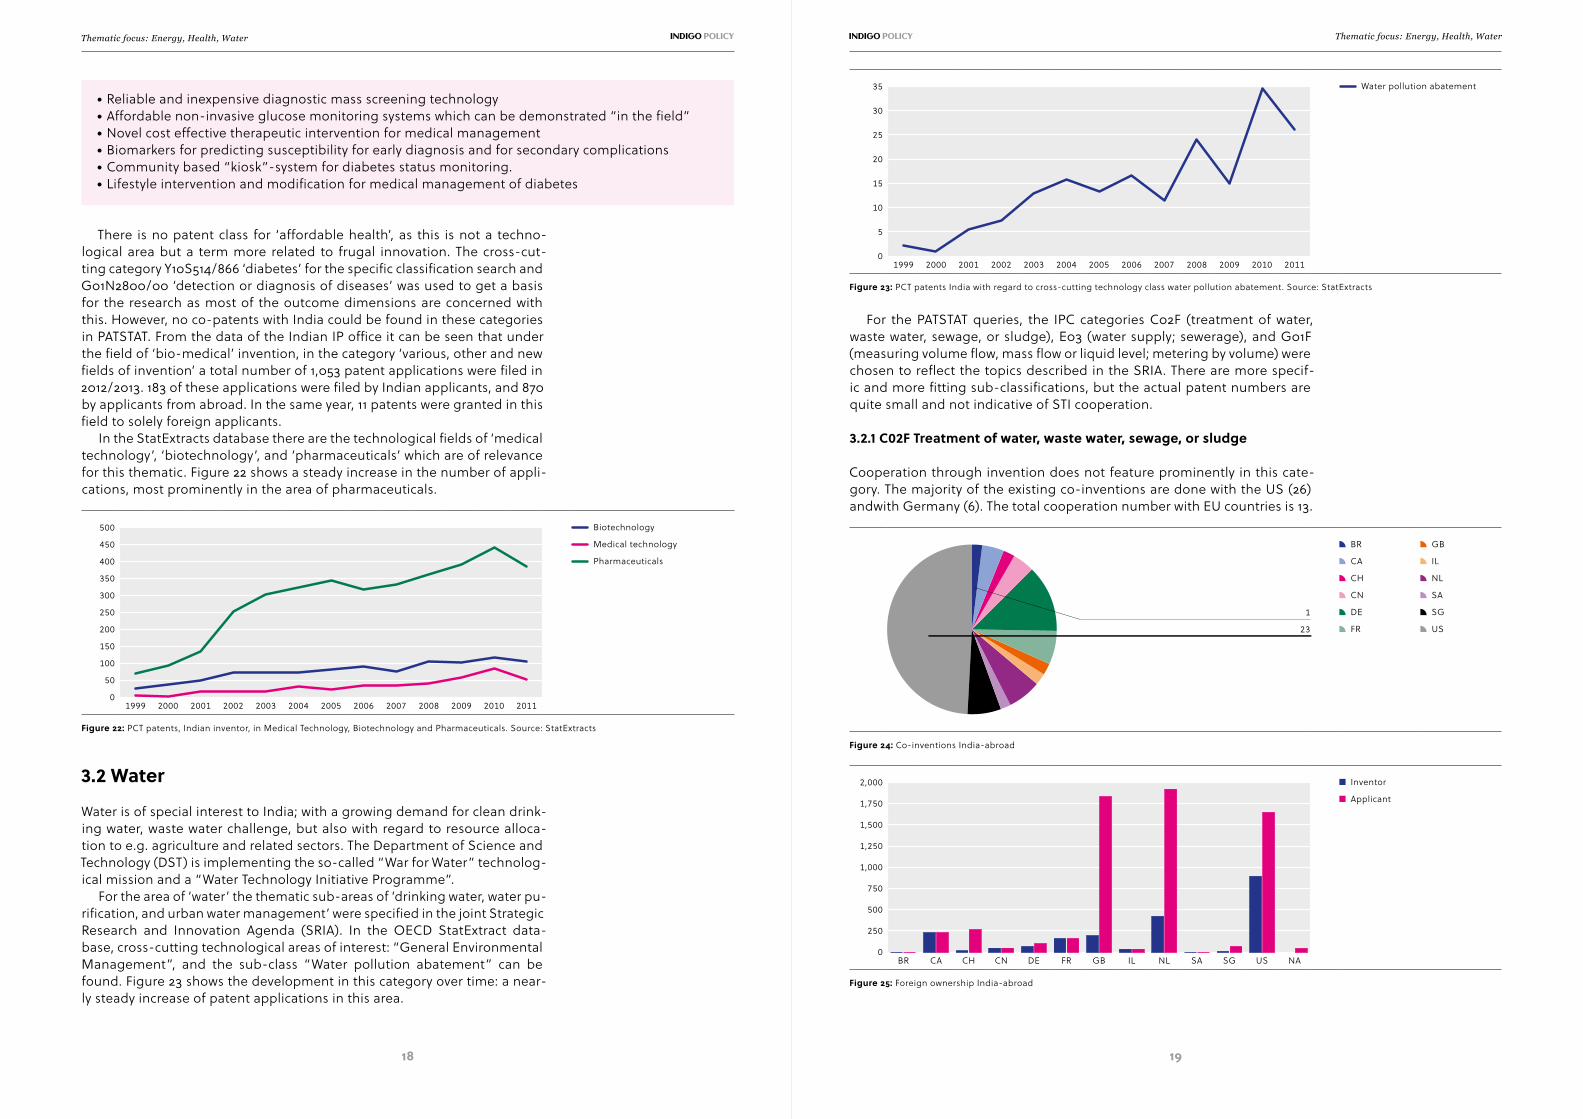
In the StatExtracts database there are the technological fields of ‘medical technology’, ‘biotechnology’, and ‘pharmaceuticals’ which are of relevance for this thematic. Figure 22 shows a steady increase in the number of appli-cations, most prominently in the area of pharmaceuticals.
3.2 Water
Water is of special interest to India; with a growing demand for clean drink-ing water, waste water challenge, but also with regard to resource alloca-tion to e.g. agriculture and related sectors. The Department of Science and Technology (DST) is implementing the so-called “War for Water” technolog-ical mission and a “Water Technology Initiative Programme”.
For the area of ‘water’ the thematic sub-areas of ‘drinking water, water pu-rification, and urban water management’ were specified in the joint Strategic Research and Innovation Agenda (SRIA). In the OECD StatExtract data-base, cross-cutting technological areas of interest: “General Environmental Management”, and the sub-class “Water pollution abatement” can be found. Figure 23 shows the development in this category over time: a near-ly steady increase of patent applications in this area.
For the PATSTAT queries, the IPC categories C02F (treatment of water, waste water, sewage, or sludge), E03 (water supply; sewerage), and G01F (measuring volume flow, mass flow or liquid level; metering by volume) were chosen to reflect the topics described in the SRIA. There are more specif-ic and more fitting sub-classifications, but the actual patent numbers are quite small and not indicative of STI cooperation.
3.2.1 C02F Treatment of water, waste water, sewage, or sludge
Cooperation through invention does not feature prominently in this cate-gory. The majority of the existing co-inventions are done with the US (26) andwith Germany (6). The total cooperation number with EU countries is 13.
○ Reliable and inexpensive diagnostic mass screening technology ○ Affordable non-invasive glucose monitoring systems which can be demonstrated “in the field” ○ Novel cost effective therapeutic intervention for medical management ○ Biomarkers for predicting susceptibility for early diagnosis and for secondary complications ○ Community based “kiosk”-system for diabetes status monitoring. ○ Lifestyle intervention and modification for medical management of diabetes
Biotechnology
Medical technology
Pharmaceuticals
500
450
400
350
300
250
200
150
100
50
01999 2000 2001 2002 2003 2004 2005 2006 2007 2008 2009 2010 2011
Figure 22: PCT patents, Indian inventor, in Medical Technology, Biotechnology and Pharmaceuticals. Source: StatExtracts
Water pollution abatement35
30
25
20
15
10
5
01999 2000 2001 2002 2003 2004 2005 2006 2007 2008 2009 2010 2011
Figure 23: PCT patents India with regard to cross-cutting technology class water pollution abatement. Source: StatExtracts
BR
CA
CH
CN
DE
FR
GB
IL
NL
SA
SG
US
1
23
Figure 24: Co-inventions India-abroad
Inventor
Applicant
2,000
1,750
1,500
1,250
1,000
750
500
250
0BR CA CH CN DE FR GB IL NL SA SG US NA
Figure 25: Foreign ownership India-abroad

20 21
Thematic focus: Energy, Health, WaterThematic focus: Energy, Health, Water
Interestingly a high number of patents applications in this class feature inventions that were invented in India but owned by foreign applicants: Netherlands (1,917), Great Britain (1,829), and the US (1,644).
TATA Consultancy Services Limited is the major player from the Indian side, followed by the Council of Scientific and Industrial Research.
3.2.2 E03 Water supply; sewerage
There are small numbers for international co-patents in this category, with only three co-inventions with Germany, Great Britain, and the Netherlands.
The Indian actors in the field do not show much concentration, as can be visualised from the word cloud in figure 29.
3.2.3 G01F Measuring volume, volume flow, mass flow or liquid level; metering by volume
In this small-sized category, the US is the most prominent cooperation part-ner of India with regard to co-inventions, and cross-ownership of patents. Finland, the Netherlands, and Great Britain are also active here.
3.3 Energy
Among others, research in this area of special interest to India is support-ed by the “Bhaskar Advanced Solar Energy (BASE) Fellowship Programme” and the “Solar Energy Research Initiative” by DST. The Indian Department of
Figure 26: Co-patenting inventors and applicants from India
DE
GB
NL
1
Figure 27: Co-inventions India-abroad
Inventor
Applicant
5
4
3
2
1
0DE GB IT NL US
Figure 28: Most active foreign ownership India-abroad
Figure 29: Co-patenting inventors and applicants from India
FI
US
1
3
Figure 30: Co-inventions India-abroad
Inventor
Applicant
50
45
40
35
30
25
20
15
10
5
0FI GB NL US
Figure 31: Foreign ownership India-abroad

22 23
Thematic focus: Energy, Health, WaterThematic focus: Energy, Health, Water
Biotechnology (DBT) is active in this field with a special programme: “Energy Biosciences-Biofuels” 28.
In this area three sub-thematics were defined in SRIA as especially inter-esting for India-EU cooperation: solar energy, bioenergy, and smart grids.
For solar energy, the classes Y02E10 / 40 (solar thermal energy) and Y02E10 / 50 (Photovoltaic [PV] energy) were chosen. For smart grids the cross-cutting area Y04S (smart grid technologies remote network opera-tion, smart metering, electric and hybrid vehicles interoperability, trading and marketing) seemed best to reflect this topic. For bioenergy we used Y02E50 / 10 (bio fuels) a cross-cutting category.
3.3.1 Solar energy
3.3.1.1 Y02E10 / 40 Solar thermal energy
Solar thermal energy is a rather small category with regard to co-patent-ing with India. Again the US is India’s most prominent partner in co-patent-ing. Germany is applicant country in 7 cases, with the Inventors coming only from India. The cooperation with the Netherlands is more equal in this re-gard. Interestingly Namibia is also an applicant country in this sub-category.
28 http://dbtindia.nic.in/uniquepage.asp?id_pk=360
3.3.1.2 Y02E10 / 50 Photovoltaic [PV] energy
Here, the US is again the strongest partner by far in co-inventions and in cross-ownership of patents, followed by the UK, Israel, Japan, the Netherlands and Germany. From the Indian side, the Council of Scientific and Industrial Research (CSIR) is the major partner.
GB
NL
US
1
2
Figure 32: Co-inventions India-abroad
Inventor
Applicant
10
9
8
7
6
5
4
3
2
1
0GB NL US CH DE ES NA
Figure 33: Foreign ownership India-abroad
BE
CN
DE
GB
GR
IL
JP
NL
TR
US
1
15
Figure 34: Co-inventions India-abroad
Inventor
Applicant
35
30
25
20
15
10
5
0BE CN DE GB GR IL JP NL TR US
Figure 35: Foreign ownership India-abroad
Figure 36: Co-patenting inventors and applicants from India
24 25
Thematic focus: Energy, Health, WaterThematic focus: Energy, Health, Water
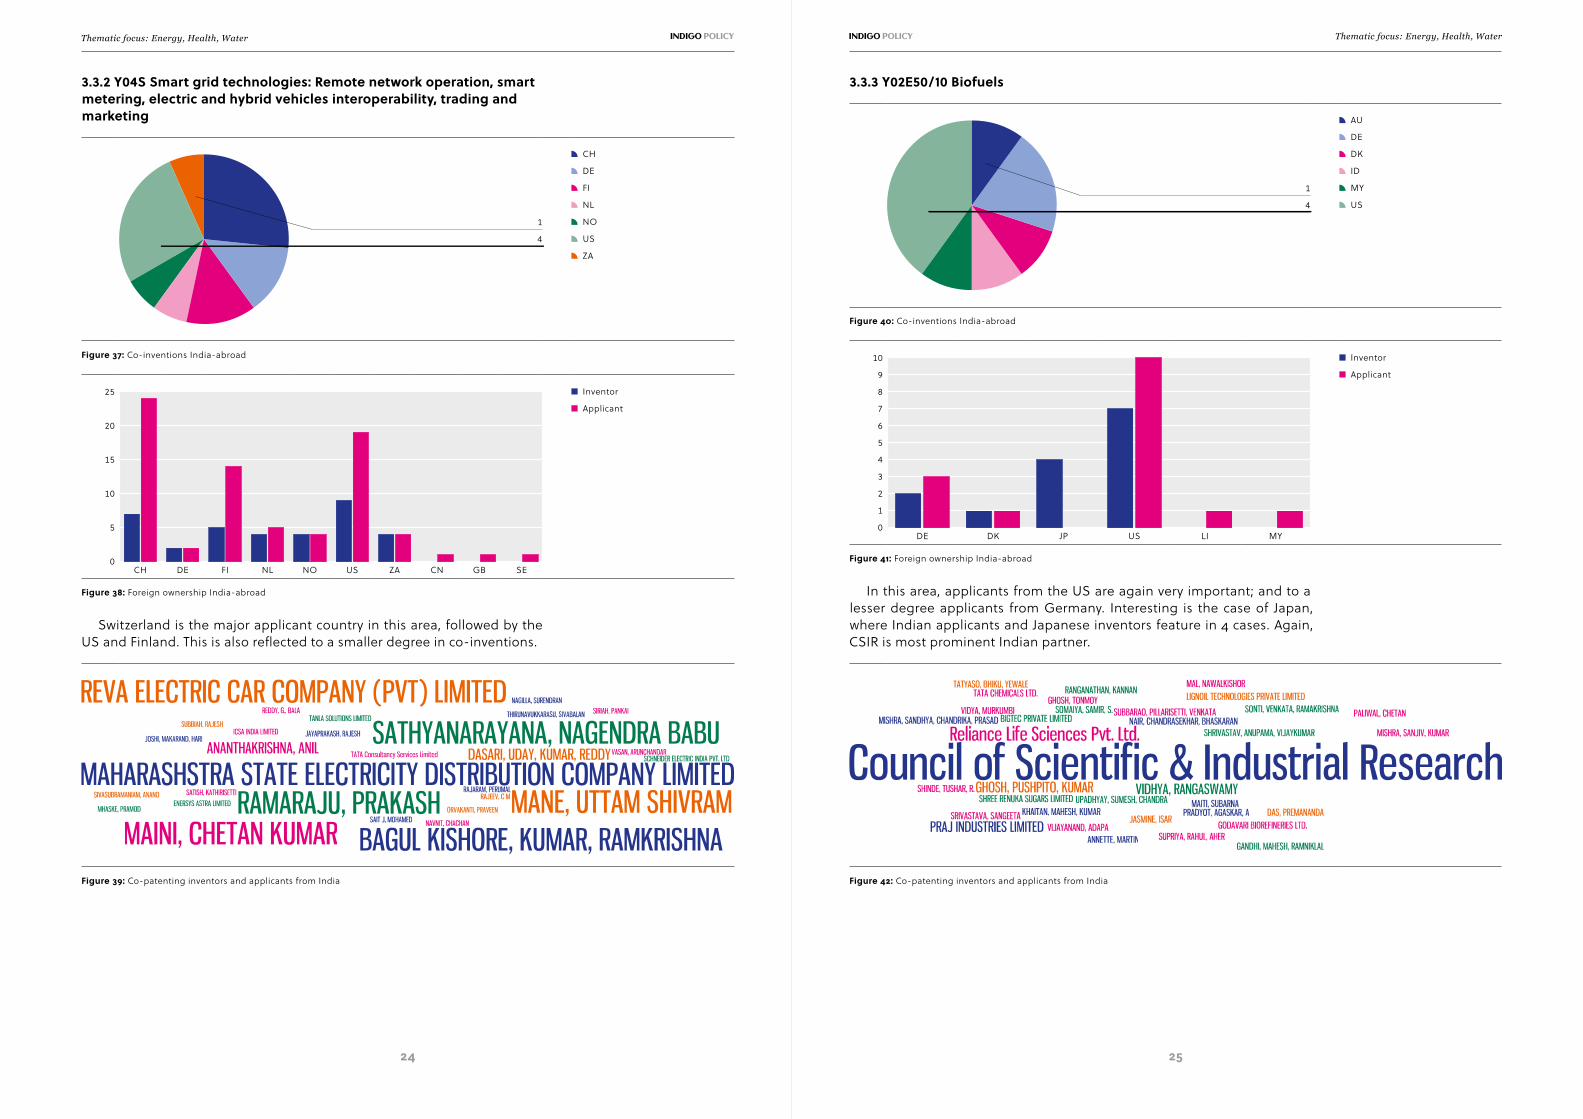
3.3.2 Y04S Smart grid technologies: Remote network operation, smart metering, electric and hybrid vehicles interoperability, trading and marketing
Switzerland is the major applicant country in this area, followed by the US and Finland. This is also reflected to a smaller degree in co-inventions.
3.3.3 Y02E50 / 10 Biofuels
In this area, applicants from the US are again very important; and to a lesser degree applicants from Germany. Interesting is the case of Japan, where Indian applicants and Japanese inventors feature in 4 cases. Again, CSIR is most prominent Indian partner.
CH
DE
FI
NL
NO
US
ZA
1
4
Figure 37: Co-inventions India-abroad
Inventor
Applicant
25
20
15
10
5
0CH DE FI NL NO US ZA CN GB SE
Figure 38: Foreign ownership India-abroad
Figure 39: Co-patenting inventors and applicants from India
AU
DE
DK
ID
MY
US
1
4
Figure 40: Co-inventions India-abroad
Inventor
Applicant
10
9
8
7
6
5
4
3
2
1
0DE DK JP US LI MY
Figure 41: Foreign ownership India-abroad
Figure 42: Co-patenting inventors and applicants from India

26 27
Hier steht der KolumnentitelBibliography
4 Bibliography
Bio-IT and Healthcare in India, DBT 2014
de Rassenfosse G., Dernis H., Boedt G., An Introduction to the Patstat Database with Example Queries, Melbourne Institute Working Paper No. 8 / 14
Dernis H., Guellec D., Using Patent Counts for Cross-Country Comparisons of Technology Output, OECD, 2001
Frietsch R., Neuhäusler P., Rothengatter O., Which road to take? Filing routes to the European Patent Office, World Patent Information, 35 (1), 8 – 19, 2013
IFPMA Statement to the WIPO Standing Committee on the Law of Patents (SCP), Geneva, 12 October 2010, Remarks by Mr Andrew Jenner, Director, Intellectual Property & Trade, IFPMA
Miguélez E., Fink C., Measuring the International Mobility of Inventors: A New Database, WIPO Economics Publications, No. 8, 2013
Miguélez E., Inventor diasporas and the internationalization of inventive activity, The Output of R & D activities: Harnessing the Power of Patents Data, Sevilla 19 – 20 September 2013, ppt
OECD, Compendium of Patent Statistics, 2008
OECD, Patent Manual, 2009
OECD, Regional patterns of co-patenting, in: OECD Regions at a Glance, 2011
OECD, Science, Technology and Industry Outlook, 2012
OECD, Science, Technology and Industry Scoreboard, 2013
Office of the Controller General of Patents, Designs, Trade Marks and Geographical Indications, Intellectual Property India, Annual Report, 2012 – 2013
Shared EU / MS – India strategic agenda for research and innovation in Energy, Ref. Ares(2013)3488244 - 15 / 11 / 2013
Shared EU / MS – India strategic agenda for research and innovation in Health, Ref. Ares(2013)3488244 - 15 / 11 / 2013
Shared EU / MS – India strategic agenda for research and innovation in Water, Ref. Ares(2013)3488244 - 15 / 11 / 2013
Squicciarini M., Dernis H., Criscuolo C., Measuring Patent Quality: Indicators of Technological and Economic Value, OECD, 2013
van Zeebroeck N., van Pottelsberghe de la Potterie B., Filing strategies and patent value, Economics of Innovation and New Technology, 20 (6), 539 – 562, 2011
5 Glossary
BRICS
CGPDTMCPCDBTDSTEPOICSRIFPMA IPIPCJPOOECDPATSTATPCTSRIATRIPSUSPTOWIPO
Acronym for an association of five major emerging national economies: Brazil, Russia, India, China, and South AfricaOffice of the Controller General of Patents, Designs, Trade Marks and Geographical IndicationsCooperative Patent ClassificationDepartment for BiotechnologyDepartment for Science and TechnologyEuropean Patent OfficeCouncil of Scientific and Industrial ResearchInternational Federation of Pharmaceutical Manufacturers Intellectual PropertyInternational Patent ClassificationJapan Patent OfficeOrganisation for Economic Co-operation and DevelopmentWorldwide Statistical Patent Database Patent Cooperation Treaty Strategic Research and Innovation Agenda Agreement on Trade-Related Aspects of Intellectual Property RightsUnited States Patent and Trademark OfficeWorld Intellectual Property Organization
.......
............
...........
..............................
.....................
.......................
..........
............................
..............

28
Hier steht der Kolumnentitel