pipe detection surveys and creation of a water utility gis, niue
TRANSCRIPT
PIPE DETECTION SURVEYS AND
CREATION OF A WATER UTILITY GIS, NIUE
Paula Dawe
SOPAC Secretariat
September 2000 SOPAC Technical Report 311
This project has been supported by NZODA and the Canadian organization CUSO

[TR311 – Dawe]
2
[TR311 – Dawe]
3
TABLE OF CONTENTS
EXECUTIVE SUMMARY............................................................................................................................................................ 5
1.0 INTRODUCTION..................................................................................................................................................................... 6
2.0 ACKNOWLEDGEMENTS .................................................................................................................................................... 9
3.0 SCOPE OF PROJECT............................................................................................................................................................. 9
4.0 FIELD WORK ........................................................................................................................................................................... 9
5.0 GIS LAYERS ............................................................................................................................................................................13
5.1 EXISTING LAYERS ..................................................................................................................................................................13 5.2 BOREHOLES.............................................................................................................................................................................14 5.3 PUMPS.......................................................................................................................................................................................15 5.4 TANKS ......................................................................................................................................................................................16 5.5 JUNCTIONS...............................................................................................................................................................................18 5.6 VALVES ....................................................................................................................................................................................18 5.7 PIPES.........................................................................................................................................................................................19 5.8 FIRE HYDRANTS......................................................................................................................................................................20 5.9 BULK FLOW METERS.............................................................................................................................................................20 5.10 CONTOURS.............................................................................................................................................................................21
6.0 CONCLUSIONS AND RECOMMENDATIONS...........................................................................................................22
7.0 REFERENCES .........................................................................................................................................................................24
[TR311 – Dawe]
4
LIST OF FIGURES AND TABLES FIGURE 1: OLD RAINWATER CATCHMENT TANK ..................................................................................... 6 FIGURE 2: TRENCH DIGGER USED IN THE LAYING OF PIPES & ELECTRICAL AND TELEPHONE CABLES IN NIUE. ... 8 FIGURE 3: RD-500 PIPE DETECTOR PULSE GENERATING ATTACHMENT................................................... 10 FIGURE 4: LISTENING FOR THE GENERATED PULSE USING THE RD-500 PVC PIPE DETECTOR RECEIV ER...... 10 FIGURE 5: TAKING A POSITION USING THE TRIMBLE GPS HANDHELD ROVER ........................................... 11 FIGURE 6: AN OLD VILLAGE COMMUNAL TAP....................................................................................... 11 FIGURE 7: P IPE PUNCTURED DURING EXCAVATION .............................................................................. 13 FIGURE 8: LIKU BOREHOLE, PUMP, SWITCHBOARD, AND BULK FLOW METER ............................................ 14 FIGURE 9: MAKEFU SOLAR POWERED BORE HOLE PUMP....................................................................... 15 FIGURE 10: PRESSURE PUMP MAINTAINING 15-30 PSI PRESSURE RANGE IN VILLAGE DISTRIBUTION SYSTEM . 16 FIGURE 11: TIMBER TANK IN AVETELE............................................................................................... 16 FIGURE 12: FLOAT CONTROLS REGULATING BORE PUMP ACTIVITIES FOR TOI AND VAIEA TANKS .................. 17 FIGURE 13: RUSTY TANK ROOF IN TOI AND LEAKING BASE ON ALOFI NORTH TANK .................................... 17 FIGURE 14: EXCAVATED ELBOW....................................................................................................... 18 FIGURE 15: VALVE ALONG MAIN IN ALOFI SOUTH ................................................................................ 18 FIGURE 16: FIRE HYDRANT AT LIKU BOREHOLE................................................................................... 20 FIGURE 17: BULK FLOW METER........................................................................................................ 21 FIGURE 18: CONTOUR, ROAD, BOREHOLE, AND TANK LAYERS FROM THE MAPINFO GIS OF NIUE................ 21
TABLE 1: LAYERS AND INFORMATIO N CONTAINED IN THE WATER UTILITY GIS ............................................ 5 TABLE 2: CONDUCTIVITY READINGS FOR NIUE BOREHOLES .................................................................. 14 TABLE 3: PER-CAPITA CONSUMPTION IN NIUE AS DETERMINED FROM BULK METER READINGS ..................... 21
[TR311 – Dawe]
5
EXECUTIVE SUMMARY
The following report describes the work involved in creating a water utility GIS for the Water
Supply Section of the Government of Niue’s Public Works Department. Work was performed both
in Niue in cooperation with the Water Section, and at SOPAC offices in Fiji.
Objectives that were achieved during and as a result of the trip to Niue include:
i) Pipe-detection surveys at Tamakatoga, Avatele, Vaiea, and Alofi South villages and the
collection of information on surveyed assets belonging to Niue’s water-distribution system.
ii) The creation of a GIS of surveyed assets belonging to the Niue Water Supply Section
including pipes, valves, boreholes, pumps, tanks, fire hydrants and bulk water meters.
The development of the GIS involved the collection of accurate pipe and other asset layout
information. Pipe detection was carried out using a RD-500 PVC pipe detector and positional
information was collected using a Trimble handheld GPS. The GIS was then developed using
MapInfo software.
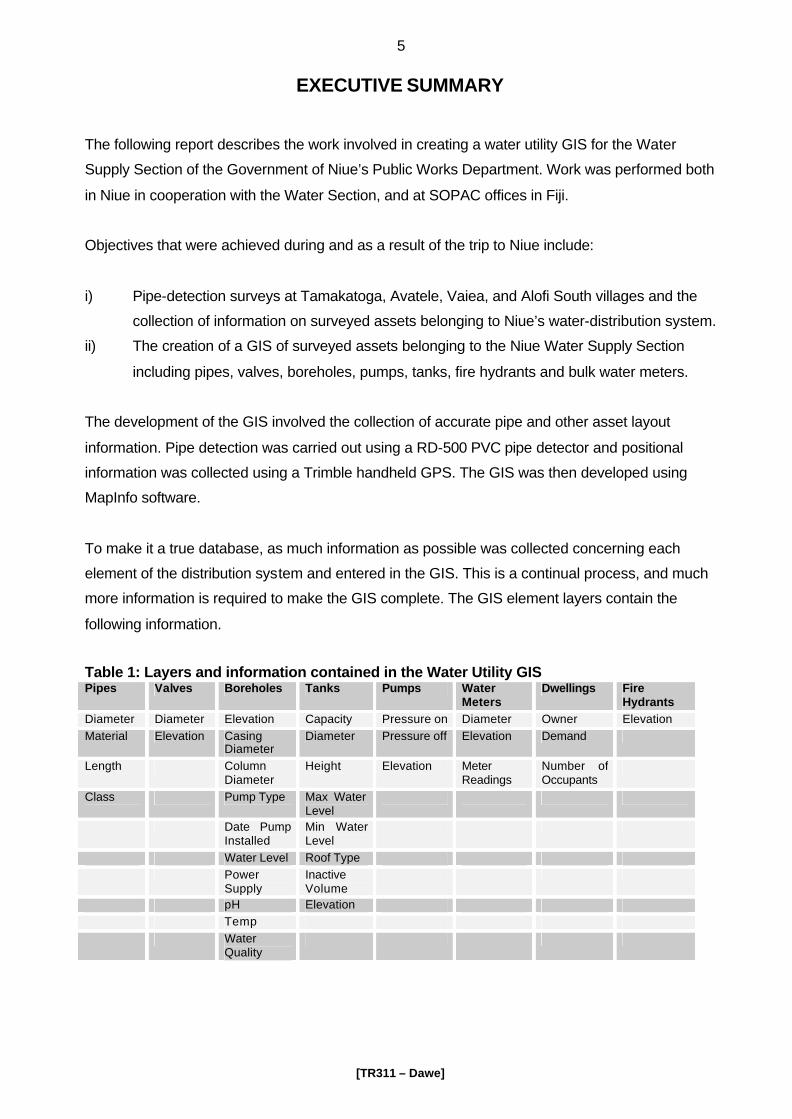
To make it a true database, as much information as possible was collected concerning each
element of the distribution system and entered in the GIS. This is a continual process, and much
more information is required to make the GIS complete. The GIS element layers contain the
following information.
Table 1: Layers and information contained in the Water Utility GIS Pipes Valves Boreholes Tanks Pumps Water
Meters Dwellings Fire
Hydrants Diameter Diameter Elevation Capacity Pressure on Diameter Owner Elevation Material Elevation Casing
Diameter Diameter Pressure off Elevation Demand
Length Column Diameter
Height Elevation Meter Readings
Number of Occupants
Class Pump Type Max Water Level
Date Pump Installed
Min Water Level
Water Level Roof Type Power
Supply Inactive Volume
pH Elevation Temp Water
Quality
[TR311 – Dawe]
6
1.0 INTRODUCTION
This report describes work that was done during and after a visit to Niue by a member of the
SOPAC Water Resources Unit from February 13 to March 1, 2000. The purpose of the trip was to
collect information on the water-distribution system in order to create a geographical information
database (GIS) for the Water Section of the Niue Public Works Department. Once the field work
had been done, the task involved creating a detailed digital plan of assets belonging to the Niue
Water Works, and storing as much information as possible concerning these assets in the
database.
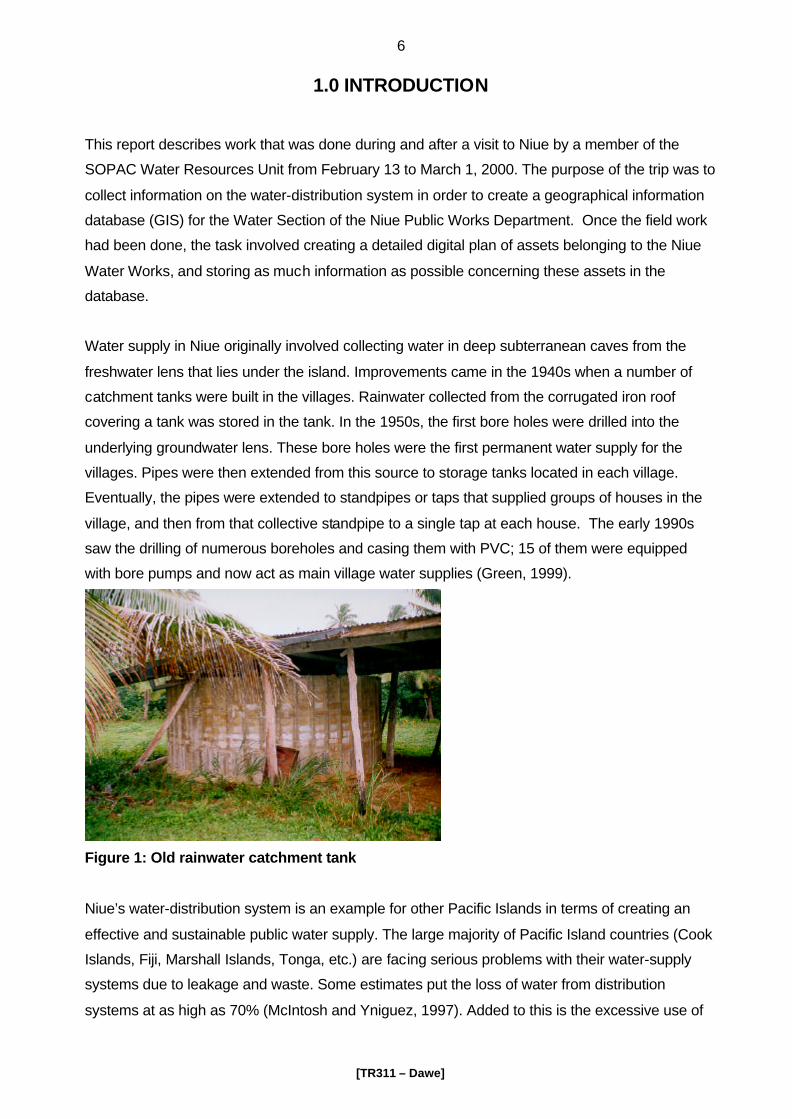
Water supply in Niue originally involved collecting water in deep subterranean caves from the
freshwater lens that lies under the island. Improvements came in the 1940s when a number of
catchment tanks were built in the villages. Rainwater collected from the corrugated iron roof
covering a tank was stored in the tank. In the 1950s, the first bore holes were drilled into the
underlying groundwater lens. These bore holes were the first permanent water supply for the
villages. Pipes were then extended from this source to storage tanks located in each village.
Eventually, the pipes were extended to standpipes or taps that supplied groups of houses in the
village, and then from that collective standpipe to a single tap at each house. The early 1990s
saw the drilling of numerous boreholes and casing them with PVC; 15 of them were equipped
with bore pumps and now act as main village water supplies (Green, 1999).
Figure 1: Old rainwater catchment tank
Niue’s water-distribution system is an example for other Pacific Islands in terms of creating an
effective and sustainable public water supply. The large majority of Pacific Island countries (Cook
Islands, Fiji, Marshall Islands, Tonga, etc.) are facing serious problems with their water-supply
systems due to leakage and waste. Some estimates put the loss of water from distribution
systems at as high as 70% (McIntosh and Yniguez, 1997). Added to this is the excessive use of

[TR311 – Dawe]
7
water by Pacific Islanders with per-capita consumption being cited as high as 700 L/d in some
places (ADB, 1999).
The result is a perception that current pipeline, pumping and storage capacities are inadequate.
The solution is often seen to be costly upgrading of current infrastructure, and little energy is
given to creating greater public awareness in water conservation or to a systematic campaign to
fix leaks.
Water use in Niue has been estimated at 278 litres per person per day (Green, 1999), which is
close to typical water demands in most Western countries. In terms of rural village supplies in the
Pacific, this demand is quite high, but for semi-urban reticulation systems, this value is typical.
Since public water supply was first introduced to Niue, per-capita water consumption has
increased, but the need for full-scale upgrades to the reticulation system has been avoided.
There are two reasons for this:
1. The population of Niue has decreased, which has to some extent negated the effects of
increased consumption; and
2. A house-to-house leak-detection and maintenance program, started in 1997, reduced water
consumption by half between the start and end of the program in 1999.
Before the leak-detection program, however, water supply in Niue was in serious difficulty.
Mismanagement and lack of maintenance and mismanagement led to the water supply being
unreliable. Water demand exceeded supply, and even with pumps working at full capacity, there
was insufficient water reaching many end-of-the-line consumers, and storage tanks would remain
empty (Green, 1999).
Currently the population of Niue enjoys a continuous water supply with acceptable system
pressures and flows. Bore pumps are operating less, saving the Public Works a significant
amount of money on power costs, and at the same time increasing the operating life of the
pumps. All this was achieved by the simple expediency of fixing what was broken – the largest
portion of wastage being caused by leaking taps and constantly running toilet cisterns (Green,
1999).
The water supply and distribution situation in Niue up to 1997 was typical of most other Pacific
Islands. It is significant to note that a head-on, hands-on approach addressing the relevant
problems of mismanagement and maintenance was implemented successfully here. Too often,
the bother of maintaining a water-supply system in the Pacific is left till the problems involved
[TR311 – Dawe]
8
seem overwhelming. International help is quite often sought, in the form of foreign aid, loans or
consultants. Although it might not be their objective in helping, the end results of this are often
expensive reports that nobody reads, costly upgrades that don’t match the rest of the network
because different materials were used, and debt for the recipient country. In addition, the two root
causes for a large percentage of water-supply problems – leakage and overuse – have not been
addressed.
Plans of the Niue water-distribution system for the 13 different villages were drawn up in 1990-92
by United Nations Volunteer Civil Engineer, Nwe Nwe Nyo. These drawings provide a general
layout of the Niue pipe network, but are inaccurate in many instances. Moreover, these drawings
held no geographical reference from which a digitised version might be made.
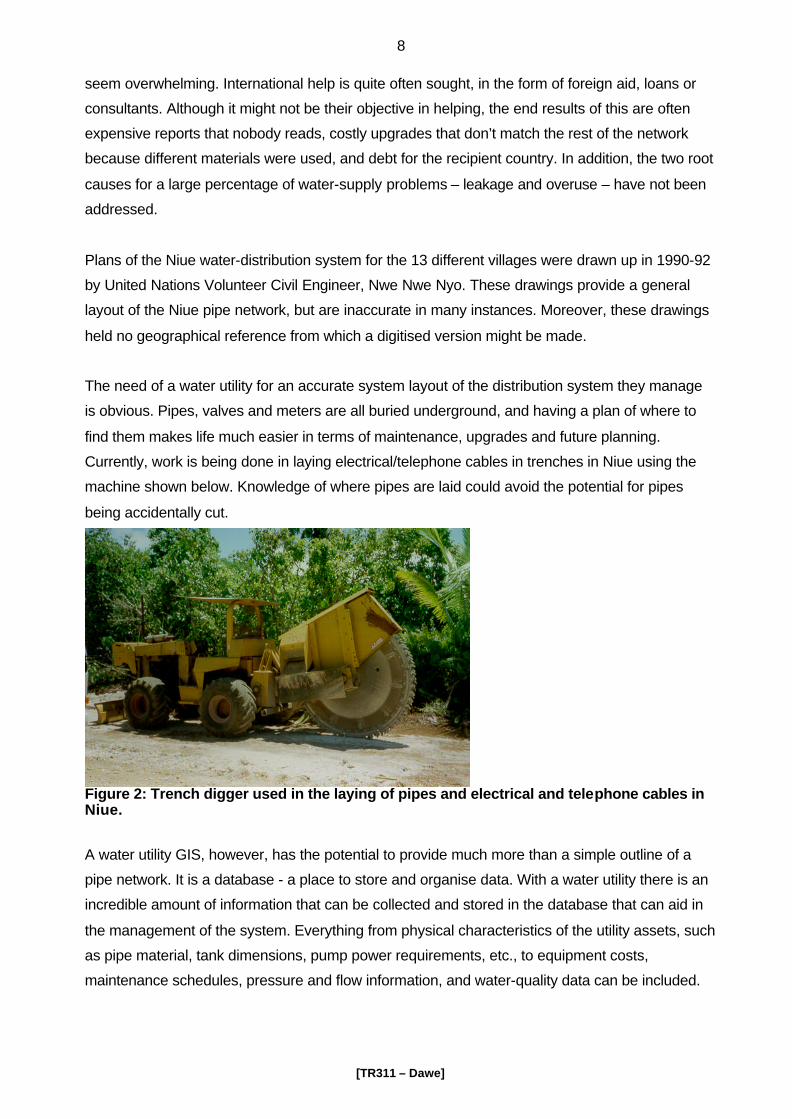
The need of a water utility for an accurate system layout of the distribution system they manage
is obvious. Pipes, valves and meters are all buried underground, and having a plan of where to
find them makes life much easier in terms of maintenance, upgrades and future planning.
Currently, work is being done in laying electrical/telephone cables in trenches in Niue using the
machine shown below. Knowledge of where pipes are laid could avoid the potential for pipes
being accidentally cut.
Figure 2: Trench digger used in the laying of pipes and electrical and telephone cables in Niue.
A water utility GIS, however, has the potential to provide much more than a simple outline of a
pipe network. It is a database - a place to store and organise data. With a water utility there is an
incredible amount of information that can be collected and stored in the database that can aid in
the management of the system. Everything from physical characteristics of the utility assets, such
as pipe material, tank dimensions, pump power requirements, etc., to equipment costs,
maintenance schedules, pressure and flow information, and water-quality data can be included.
[TR311 – Dawe]
9
2.0 ACKNOWLEDGEMENTS
The SOPAC Secretariat would like to thank NZODA for their financial support as part of its Water
Demand Management project. The author wishes to thank all staff of Niue’s Water Section for
their support and cooperation during the trip, i.e. Mr André Siohane, Acting Director, and the Pipe
Detection Team. Thanks also go out to the Government of Niue’s Lands and Survey Department
for their assistance.
3.0 SCOPE OF PROJECT
Quantifiable objectives that were achieved as a result of this trip include:
• The location and record of the pipe network layout in several villages in Niue
• The location and record of information about pipes, pipe junctions, valves, meters, boreholes,
tanks, pumps, and fire hydrants
• The collection of information concerning the water supply system including: census
information, salinity tests, water usage
4.0 FIELD WORK
The majority of time spent in Niue was spent doing surveys of the village distribution systems.
The methodology of the work was simple enough, although in application several difficulties were
experienced. Equipment used out in the field included an RD-500 PVC pipe detector (on loan to
SOPAC from the Rarotonga Water Works in the Cook Islands), a Trimble hand-held GPS rover,
and a Hanna conductivity meter.
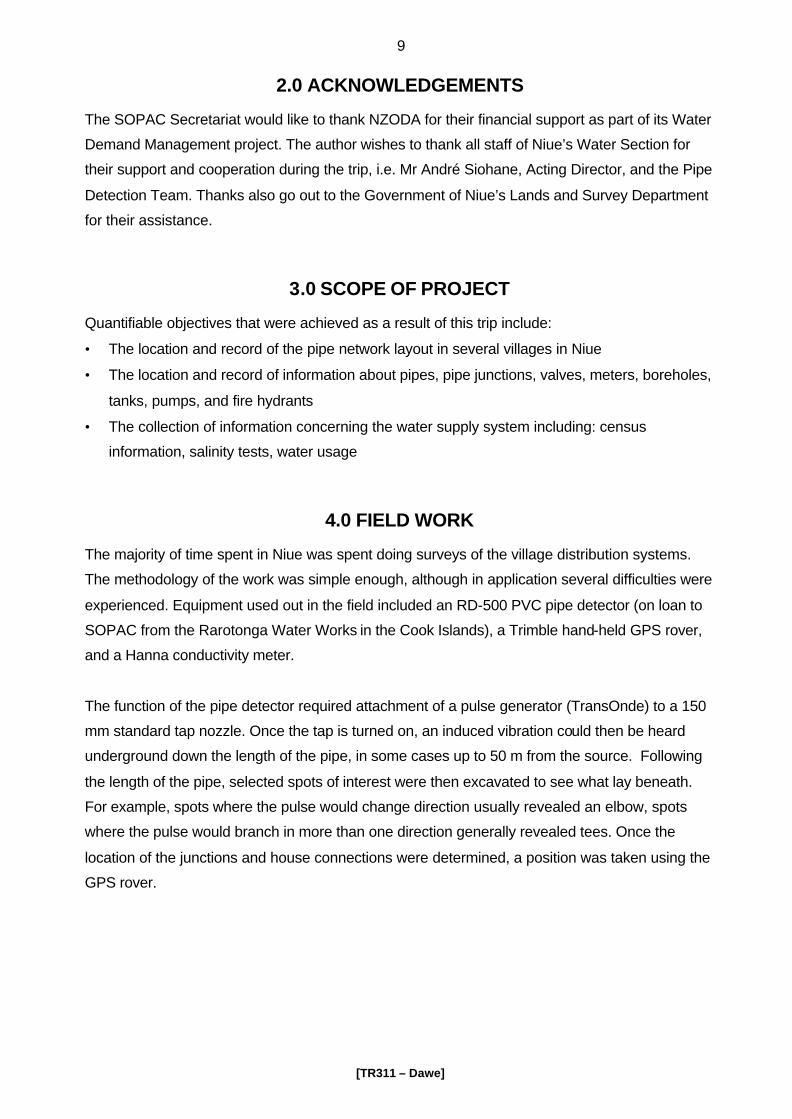
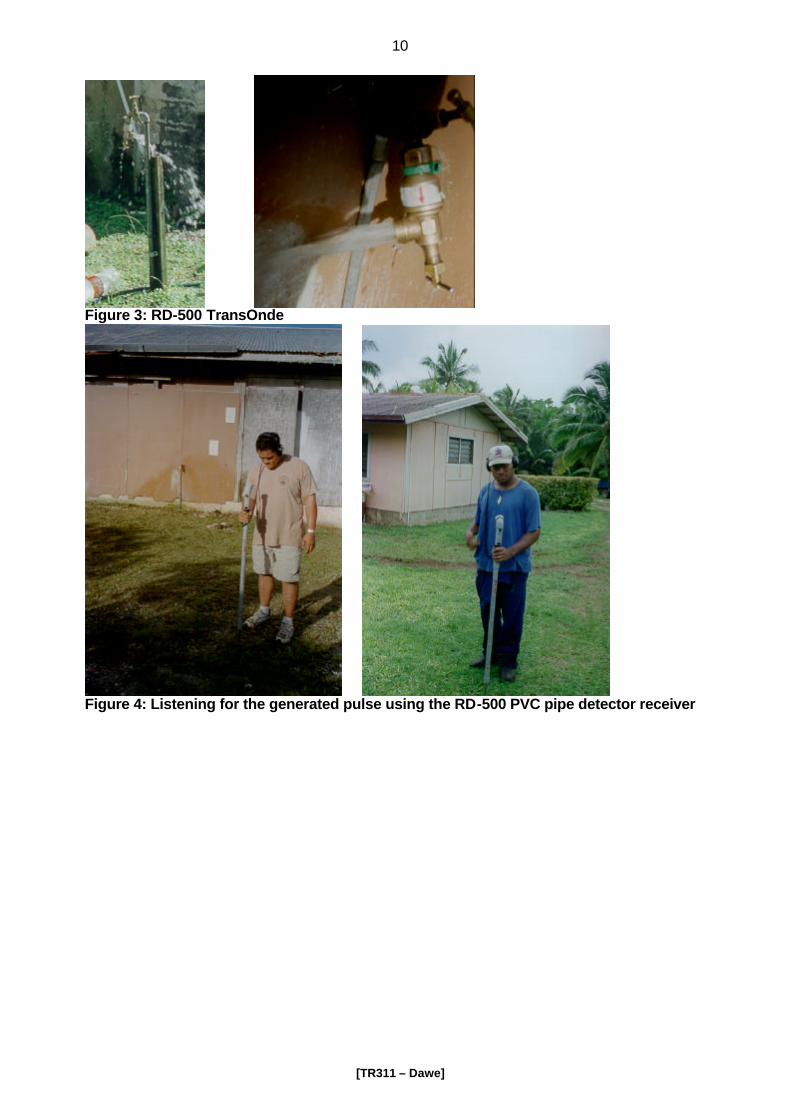
The function of the pipe detector required attachment of a pulse generator (TransOnde) to a 150
mm standard tap nozzle. Once the tap is turned on, an induced vibration could then be heard
underground down the length of the pipe, in some cases up to 50 m from the source. Following
the length of the pipe, selected spots of interest were then excavated to see what lay beneath.
For example, spots where the pulse would change direction usually revealed an elbow, spots
where the pulse would branch in more than one direction generally revealed tees. Once the
location of the junctions and house connections were determined, a position was taken using the
GPS rover.
[TR311 – Dawe]
10
Figure 3: RD-500 TransOnde
Figure 4: Listening for the generated pulse using the RD-500 PVC pipe detector receiver
[TR311 – Dawe]
11
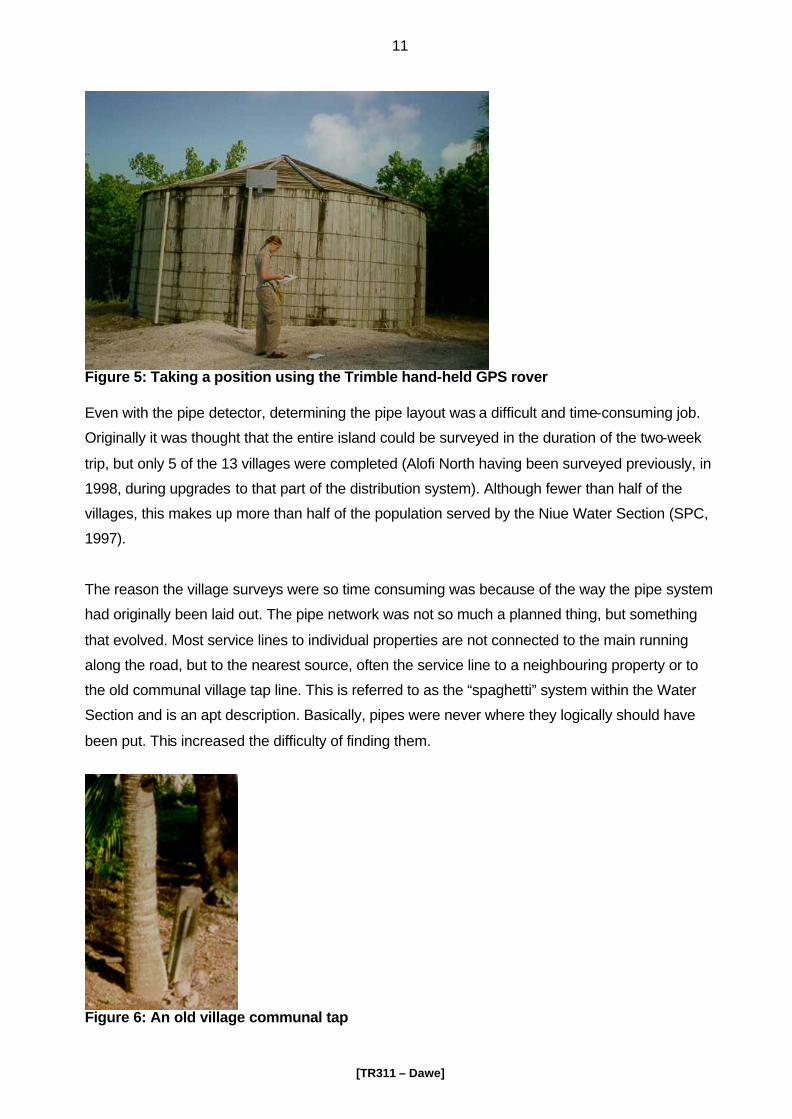
Figure 5: Taking a position using the Trimble hand-held GPS rover Even with the pipe detector, determining the pipe layout was a difficult and time-consuming job.
Originally it was thought that the entire island could be surveyed in the duration of the two-week
trip, but only 5 of the 13 villages were completed (Alofi North having been surveyed previously, in
1998, during upgrades to that part of the distribution system). Although fewer than half of the
villages, this makes up more than half of the population served by the Niue Water Section (SPC,
1997).
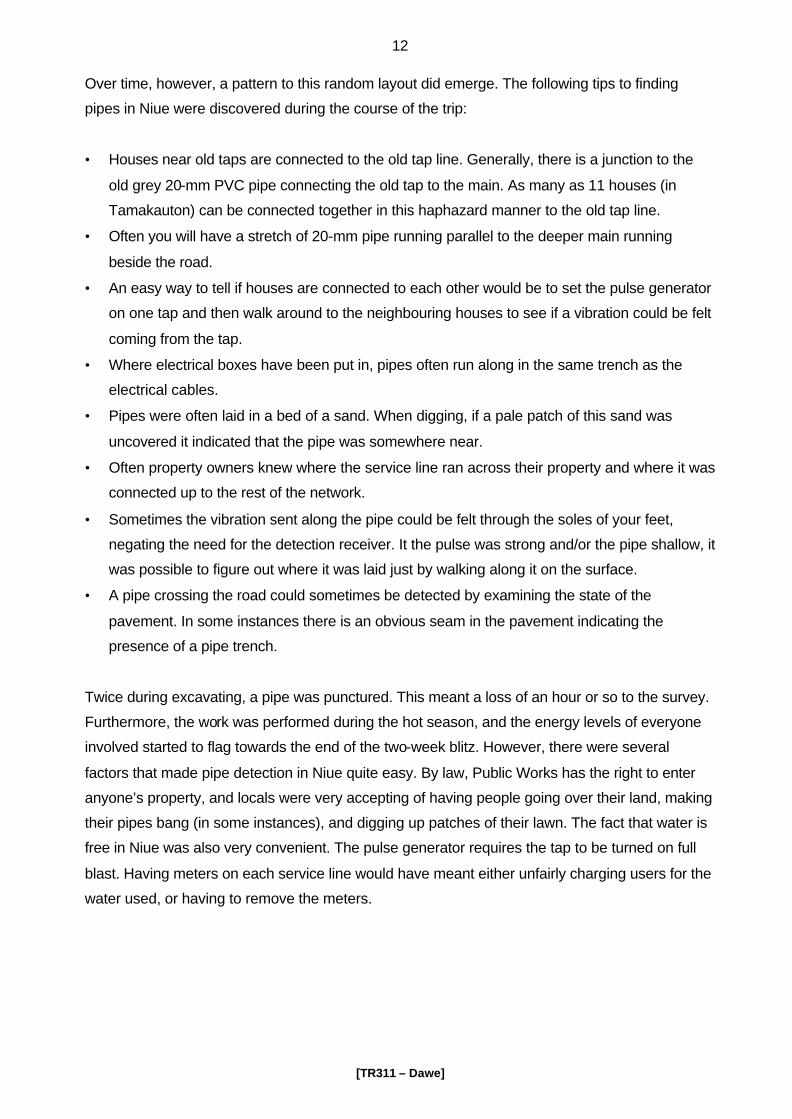
The reason the village surveys were so time consuming was because of the way the pipe system
had originally been laid out. The pipe network was not so much a planned thing, but something
that evolved. Most service lines to individual properties are not connected to the main running
along the road, but to the nearest source, often the service line to a neighbouring property or to
the old communal village tap line. This is referred to as the “spaghetti” system within the Water
Section and is an apt description. Basically, pipes were never where they logically should have
been put. This increased the difficulty of finding them.
Figure 6: An old village communal tap
[TR311 – Dawe]
12
Over time, however, a pattern to this random layout did emerge. The following tips to finding
pipes in Niue were discovered during the course of the trip:
• Houses near old taps are connected to the old tap line. Generally, there is a junction to the
old grey 20-mm PVC pipe connecting the old tap to the main. As many as 11 houses (in
Tamakauton) can be connected together in this haphazard manner to the old tap line.
• Often you will have a stretch of 20-mm pipe running parallel to the deeper main running
beside the road.
• An easy way to tell if houses are connected to each other would be to set the pulse generator
on one tap and then walk around to the neighbouring houses to see if a vibration could be felt
coming from the tap.
• Where electrical boxes have been put in, pipes often run along in the same trench as the
electrical cables.
• Pipes were often laid in a bed of a sand. When digging, if a pale patch of this sand was
uncovered it indicated that the pipe was somewhere near.
• Often property owners knew where the service line ran across their property and where it was
connected up to the rest of the network.
• Sometimes the vibration sent along the pipe could be felt through the soles of your feet,
negating the need for the detection receiver. It the pulse was strong and/or the pipe shallow, it
was possible to figure out where it was laid just by walking along it on the surface.
• A pipe crossing the road could sometimes be detected by examining the state of the
pavement. In some instances there is an obvious seam in the pavement indicating the
presence of a pipe trench.
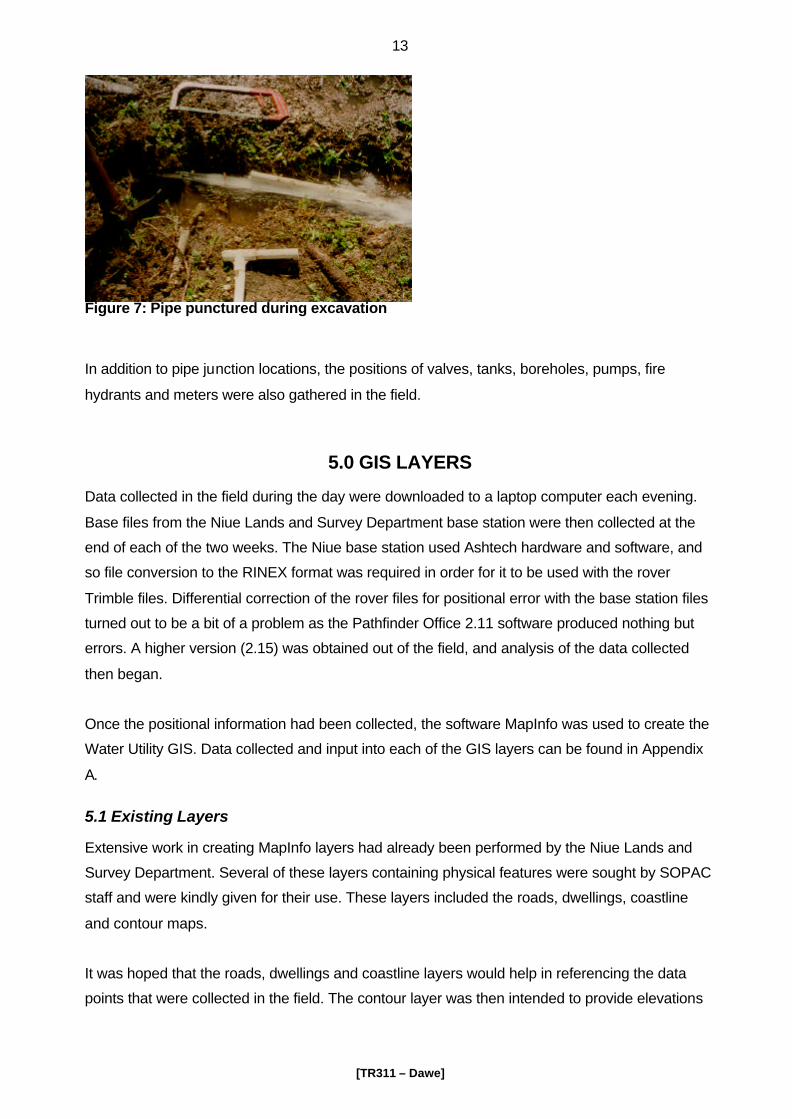
Twice during excavating, a pipe was punctured. This meant a loss of an hour or so to the survey.
Furthermore, the work was performed during the hot season, and the energy levels of everyone
involved started to flag towards the end of the two-week blitz. However, there were several
factors that made pipe detection in Niue quite easy. By law, Public Works has the right to enter
anyone’s property, and locals were very accepting of having people going over their land, making
their pipes bang (in some instances), and digging up patches of their lawn. The fact that water is
free in Niue was also very convenient. The pulse generator requires the tap to be turned on full
blast. Having meters on each service line would have meant either unfairly charging users for the
water used, or having to remove the meters.
[TR311 – Dawe]
13
Figure 7: Pipe punctured during excavation
In addition to pipe junction locations, the positions of valves, tanks, boreholes, pumps, fire
hydrants and meters were also gathered in the field.
5.0 GIS LAYERS
Data collected in the field during the day were downloaded to a laptop computer each evening.
Base files from the Niue Lands and Survey Department base station were then collected at the
end of each of the two weeks. The Niue base station used Ashtech hardware and software, and
so file conversion to the RINEX format was required in order for it to be used with the rover
Trimble files. Differential correction of the rover files for positional error with the base station files
turned out to be a bit of a problem as the Pathfinder Office 2.11 software produced nothing but
errors. A higher version (2.15) was obtained out of the field, and analysis of the data collected
then began.
Once the positional information had been collected, the software MapInfo was used to create the
Water Utility GIS. Data collected and input into each of the GIS layers can be found in Appendix
A.
5.1 Existing Layers
Extensive work in creating MapInfo layers had already been performed by the Niue Lands and
Survey Department. Several of these layers containing physical features were sought by SOPAC
staff and were kindly given for their use. These layers included the roads, dwellings, coastline
and contour maps.
It was hoped that the roads, dwellings and coastline layers would help in referencing the data
points that were collected in the field. The contour layer was then intended to provide elevations
[TR311 – Dawe]
14
for each of the data points collected. In several cases, new houses that had been built were not
on the dwellings layer and were drawn in using the junction positions as references.
5.2 Boreholes
During the two weeks in the field, a total of 18 boreholes were surveyed. Of these 18, one was
sealed and two were used for agriculture. The rest were used as village water supplies.
Conductivity tests of the water from each borehole were performed, the results of which are found
in the following table. From experience, the salinity of the water is not a concern for readings
under 1000 µS/cm. The Mekefu reading is, however, close to the WHO guideline levels.
Table 2: Conductivity readings for Niue Boreholes Borehole Conductivity (µS/cm) SP1 375 SP2 380 SP3 486 SP4 496 Tamakauton 414 Avatele 361 Vaiea 351 Hakupu 392 Liku 598 Lekepa 609 Mutalau 544 Toi 580 Hikutavake 497 Tuapa 570 Makefu 763 A value of 1500 µS/cm was published as the maximum permissible limit for freshwater according
to recent WHO guidelines (WHO, 1993). At this level the water is suitable for drinking purposes,
based on its approximate equivalence with a chloride ion concentration of 250 mg/L.
Conductivity readings for all of the Niue boreholes were well below this limit.
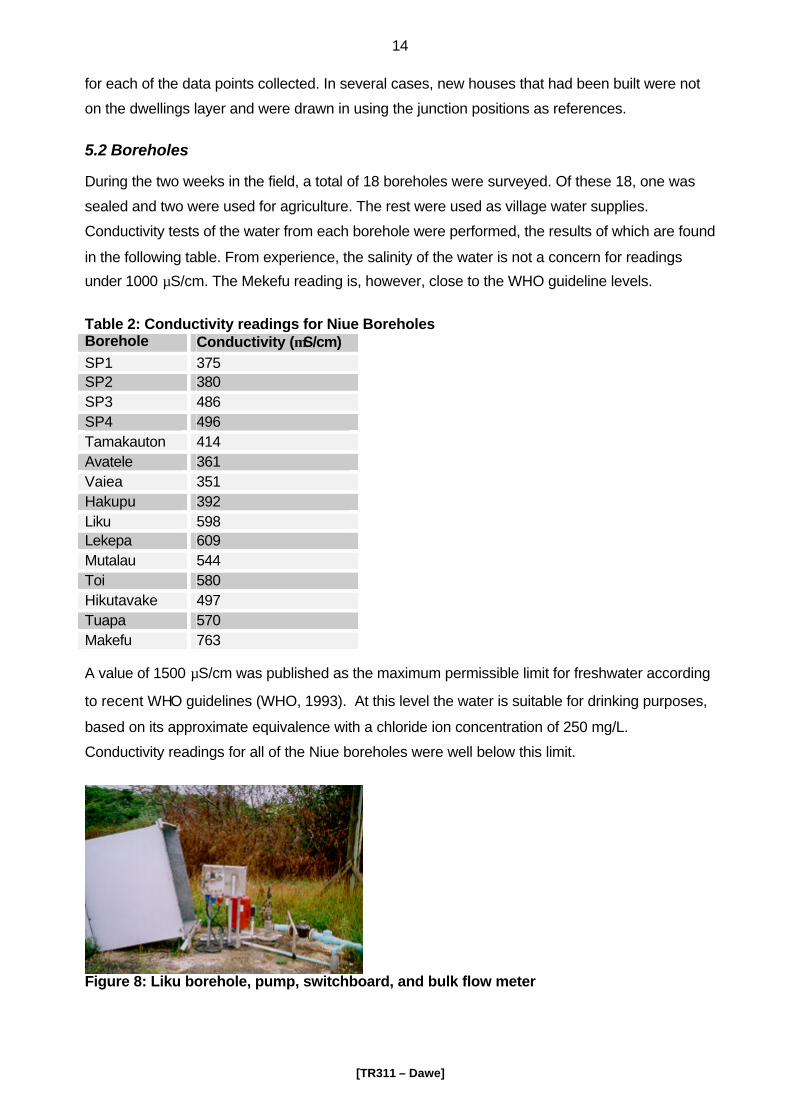
Figure 8: Liku borehole, pump, switchboard, and bulk flow meter
[TR311 – Dawe]
15
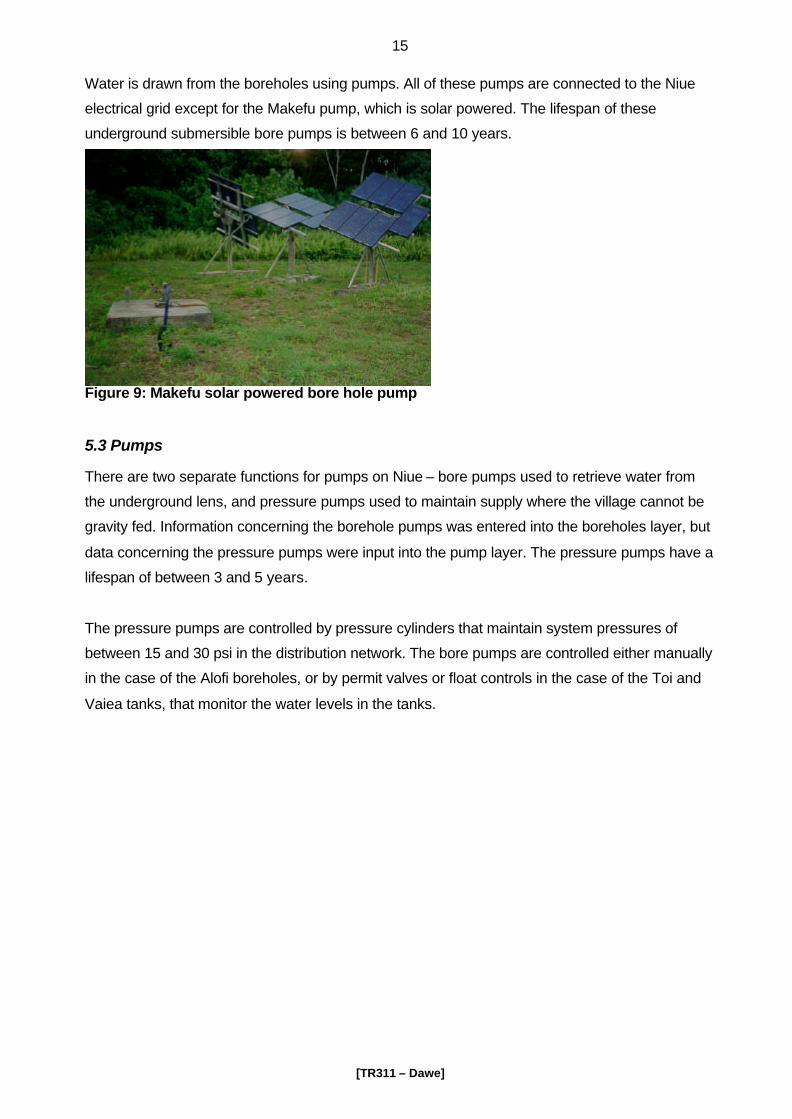
Water is drawn from the boreholes using pumps. All of these pumps are connected to the Niue
electrical grid except for the Makefu pump, which is solar powered. The lifespan of these
underground submersible bore pumps is between 6 and 10 years.
Figure 9: Makefu solar powered bore hole pump
5.3 Pumps
There are two separate functions for pumps on Niue – bore pumps used to retrieve water from
the underground lens, and pressure pumps used to maintain supply where the village cannot be
gravity fed. Information concerning the borehole pumps was entered into the boreholes layer, but
data concerning the pressure pumps were input into the pump layer. The pressure pumps have a
lifespan of between 3 and 5 years.
The pressure pumps are controlled by pressure cylinders that maintain system pressures of
between 15 and 30 psi in the distribution network. The bore pumps are controlled either manually
in the case of the Alofi boreholes, or by permit valves or float controls in the case of the Toi and
Vaiea tanks, that monitor the water levels in the tanks.
[TR311 – Dawe]
16
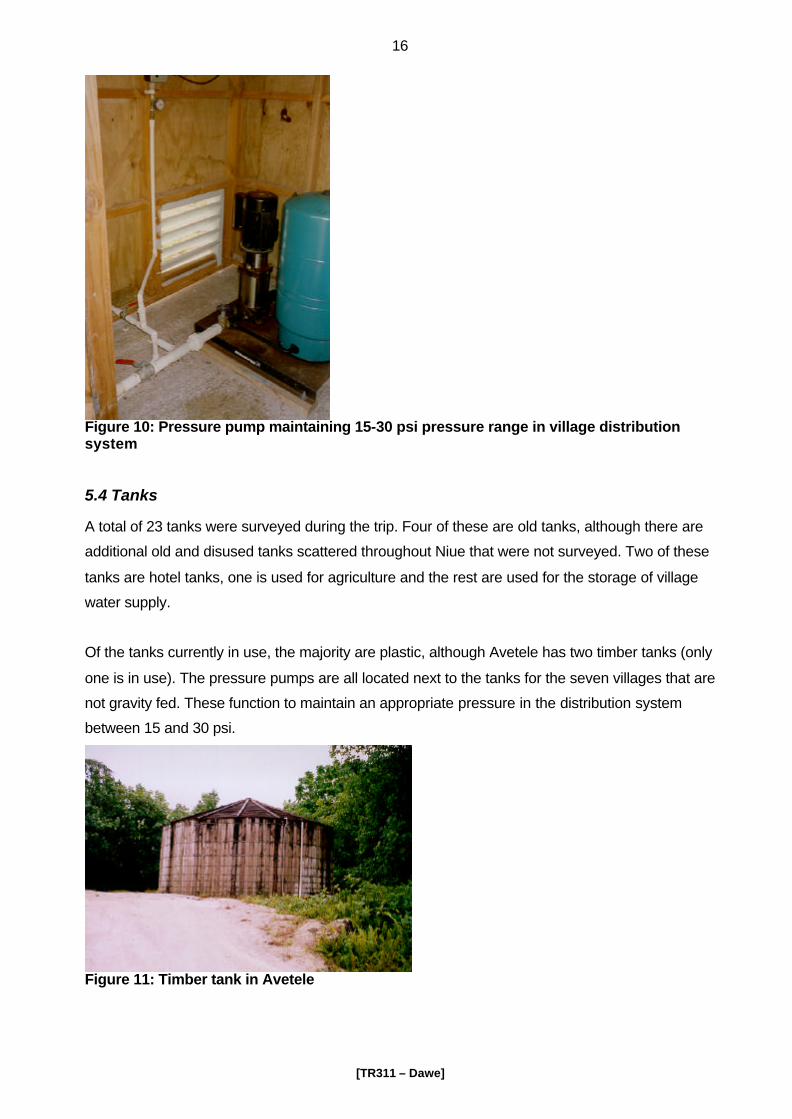
Figure 10: Pressure pump maintaining 15-30 psi pressure range in village distribution system
5.4 Tanks
A total of 23 tanks were surveyed during the trip. Four of these are old tanks, although there are
additional old and disused tanks scattered throughout Niue that were not surveyed. Two of these
tanks are hotel tanks, one is used for agriculture and the rest are used for the storage of village
water supply.
Of the tanks currently in use, the majority are plastic, although Avetele has two timber tanks (only
one is in use). The pressure pumps are all located next to the tanks for the seven villages that are
not gravity fed. These function to maintain an appropriate pressure in the distribution system
between 15 and 30 psi.
Figure 11: Timber tank in Avetele
[TR311 – Dawe]
17
Of all the active tanks, only in the Alofi South and Alofi North tanks are the water levels still
manually controlled. Float switches control Toi and Vaiea, and the rest are equipped with permit
valves that regulate the activity of the borehole pumps. In this way, the water levels in the tanks
are strictly controlled so that no overflowing occurs. However, if not monitored closely, the Alofi
North and South tanks will overflow. This was observed during the trip.
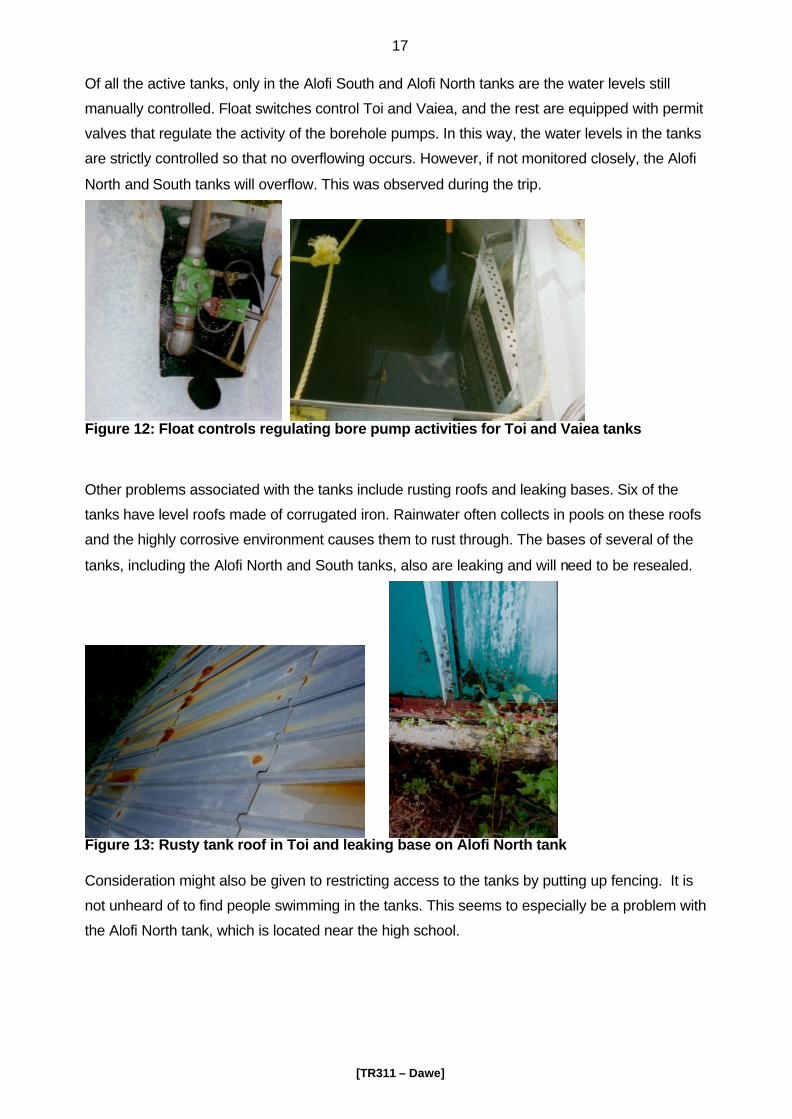
Figure 12: Float controls regulating bore pump activities for Toi and Vaiea tanks
Other problems associated with the tanks include rusting roofs and leaking bases. Six of the
tanks have level roofs made of corrugated iron. Rainwater often collects in pools on these roofs
and the highly corrosive environment causes them to rust through. The bases of several of the
tanks, including the Alofi North and South tanks, also are leaking and will need to be resealed.
Figure 13: Rusty tank roof in Toi and leaking base on Alofi North tank Consideration might also be given to restricting access to the tanks by putting up fencing. It is
not unheard of to find people swimming in the tanks. This seems to especially be a problem with
the Alofi North tank, which is located near the high school.
[TR311 – Dawe]
18
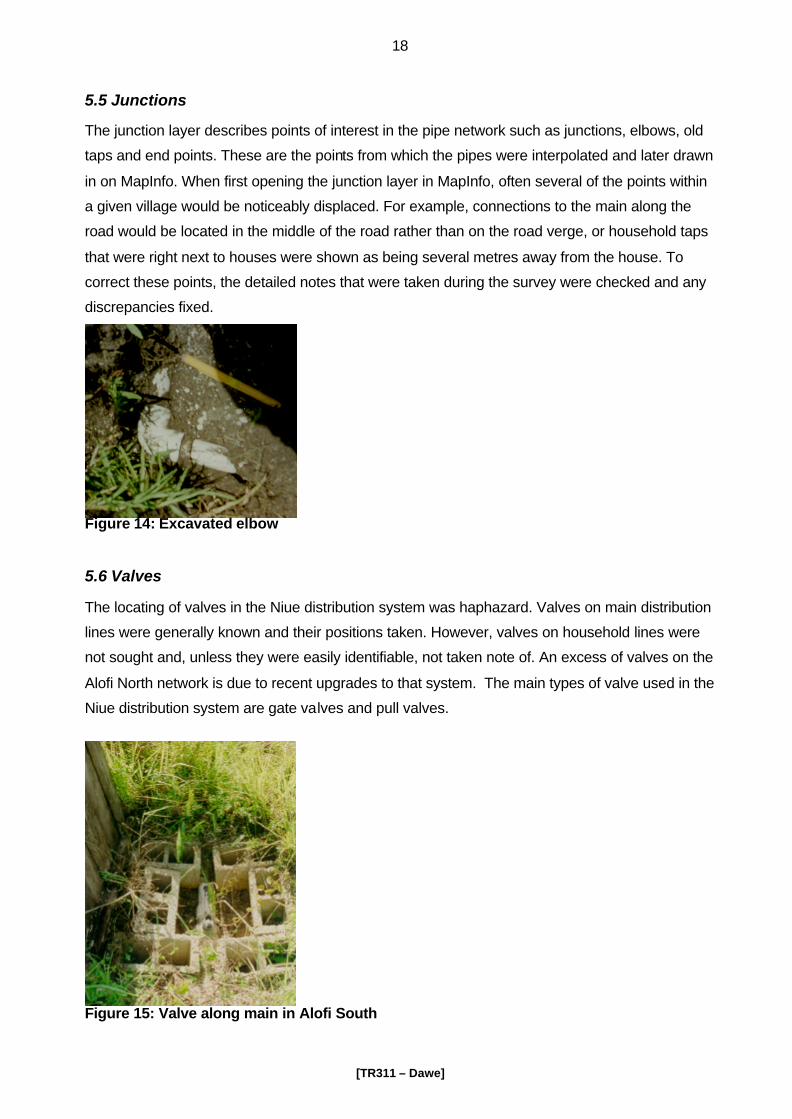
5.5 Junctions
The junction layer describes points of interest in the pipe network such as junctions, elbows, old
taps and end points. These are the points from which the pipes were interpolated and later drawn
in on MapInfo. When first opening the junction layer in MapInfo, often several of the points within
a given village would be noticeably displaced. For example, connections to the main along the
road would be located in the middle of the road rather than on the road verge, or household taps
that were right next to houses were shown as being several metres away from the house. To
correct these points, the detailed notes that were taken during the survey were checked and any
discrepancies fixed.
Figure 14: Excavated elbow
5.6 Valves
The locating of valves in the Niue distribution system was haphazard. Valves on main distribution
lines were generally known and their positions taken. However, valves on household lines were
not sought and, unless they were easily identifiable, not taken note of. An excess of valves on the
Alofi North network is due to recent upgrades to that system. The main types of valve used in the
Niue distribution system are gate valves and pull valves.
Figure 15: Valve along main in Alofi South
[TR311 – Dawe]
19
5.7 Pipes
The GPS rover was capable of recording point, line and area information. Although pipes could
have been recorded as line data, a more effective and less time consuming method was
considered to be just recording important points – end points, tap stands, junctions, and elbows.
Pipes could then simply be included later by connected the dots.
Main pipes typically run along the road verge. Household connections to newer or more isolated
houses generally connect directly to the main line. Piping to older houses involves more
convolution – houses connected to other house lines, which are connected to old village taps.
The vast majority of piping in Niue is made of PVC. During excavation, however, several lengths
of galvanised iron and polyethylene pipe were unearthed. The age of pipe material could be
determined by its colour. Older PVC pipe is grey while the newer pipe is white.
In several locations, the layout of the pipe network was interpolated from existing knowledge and
how the network was typically laid out. This was done because the pipe could not be found with
excavation, because it was buried too deep or lay underneath the road and was inaccessible. In
the following locations the pipe layout in the GIS is perhaps suspect:
• in Tamakauton where the Fonuakula Road connects with the coastal road, the house
connections in the immediate area were assumed
• in Tamakauton the connection of the house opposite the community centre was assumed to
be to the old tap line
• in Tamakauton the connection to the three houses on the Alofi side of the haunted house was
assumed to cross the street
• in Avatele, the connection to the main of the three houses up from the road behind the church
in the Alofi direction and the two houses opposite is assumed
• in the far end of Avatele, the connection of the last house to the house opposite is assumed
• the connection to the old school in Avatele is assumed
• the connection to the house opposite the road going up to Talamaitoga is assumed
• the connections behind the airport and to the fire and Meteorological station located behind it
are assumed because access to these was restricted
• the pipe layout of the cul-de-sac just down from the airport was not included as upgrades are
intended to this subdivision soon
• the pipe connections to the buildings in the Public Works in Alofi South are not
comprehensive
• the point where the main leaves the road to the south west of the Halamahaga School is
assumed
[TR311 – Dawe]
20
• the location where the pipe crosses the road just down from the Halamahaga School is assumed
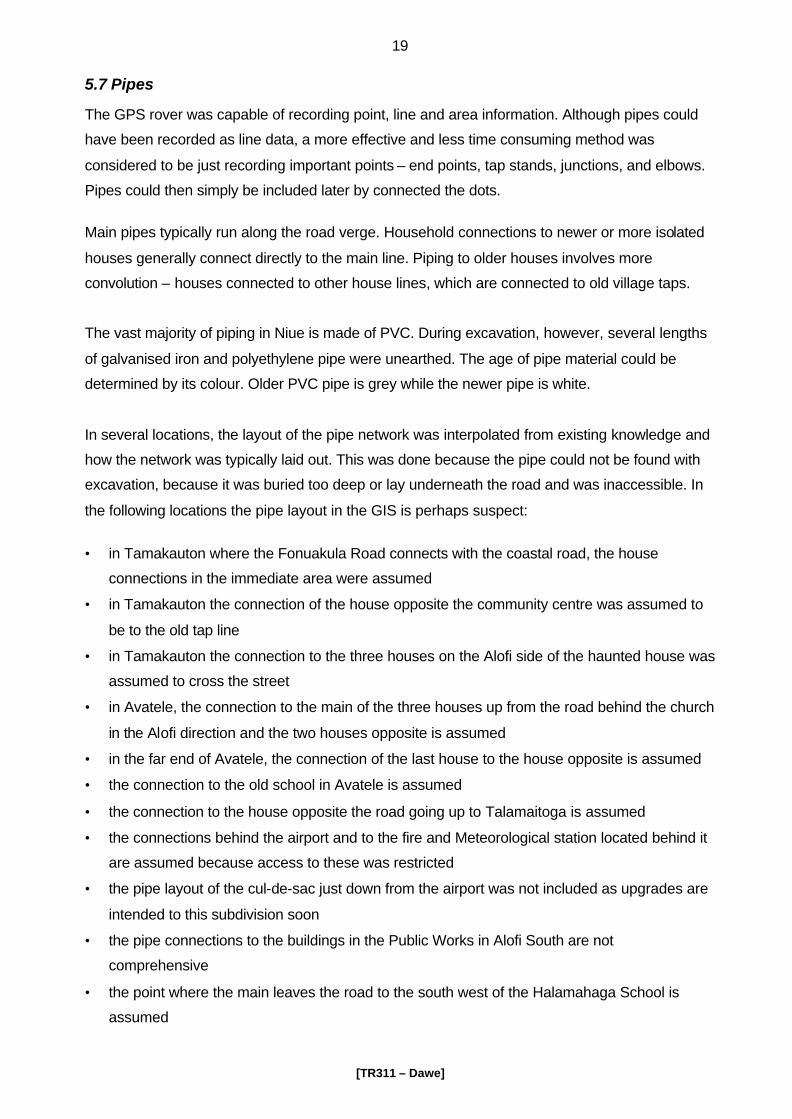
5.8 Fire Hydrants
Five fire hydrants were surveyed during the trip. These hydrants consist of tall standpipes with a
hose attached at the end, as can be seen in the following picture.
Figure 16: Fire hydrant at Liku borehole
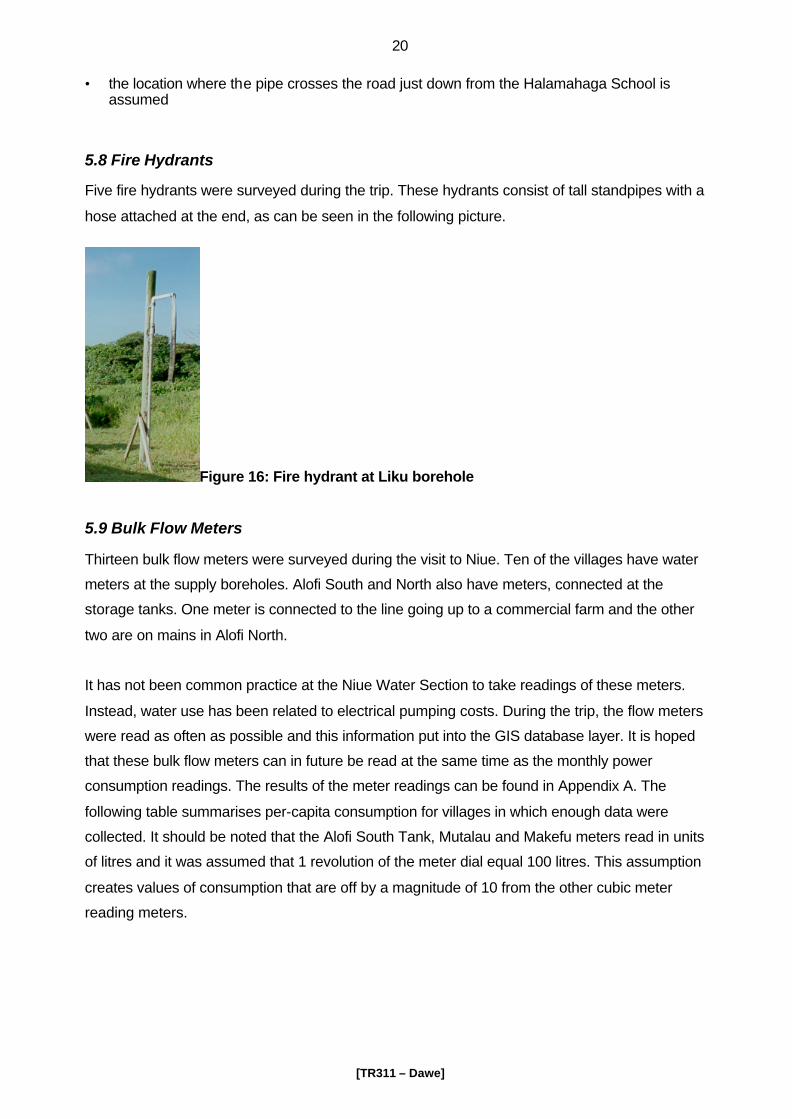
5.9 Bulk Flow Meters
Thirteen bulk flow meters were surveyed during the visit to Niue. Ten of the villages have water
meters at the supply boreholes. Alofi South and North also have meters, connected at the
storage tanks. One meter is connected to the line going up to a commercial farm and the other
two are on mains in Alofi North.
It has not been common practice at the Niue Water Section to take readings of these meters.
Instead, water use has been related to electrical pumping costs. During the trip, the flow meters
were read as often as possible and this information put into the GIS database layer. It is hoped
that these bulk flow meters can in future be read at the same time as the monthly power
consumption readings. The results of the meter readings can be found in Appendix A. The
following table summarises per-capita consumption for villages in which enough data were
collected. It should be noted that the Alofi South Tank, Mutalau and Makefu meters read in units
of litres and it was assumed that 1 revolution of the meter dial equal 100 litres. This assumption
creates values of consumption that are off by a magnitude of 10 from the other cubic meter
reading meters.
[TR311 – Dawe]
21
Table 3: Per-capita consumption in Niue as determined from bulk meter readings Village Population Usage (L/person/day) Alofi South Tank 412 32.3 Avatele 143 245.6 Hakupu 258 1737.9 Liku 92 191.3 Lakepa 125 307.4 Mutalau 148 27.7 Hikutavake 68 116.1 Tuapa 196 484.6 Makefu 338 30.7
Figure 17: Bulk flow meter
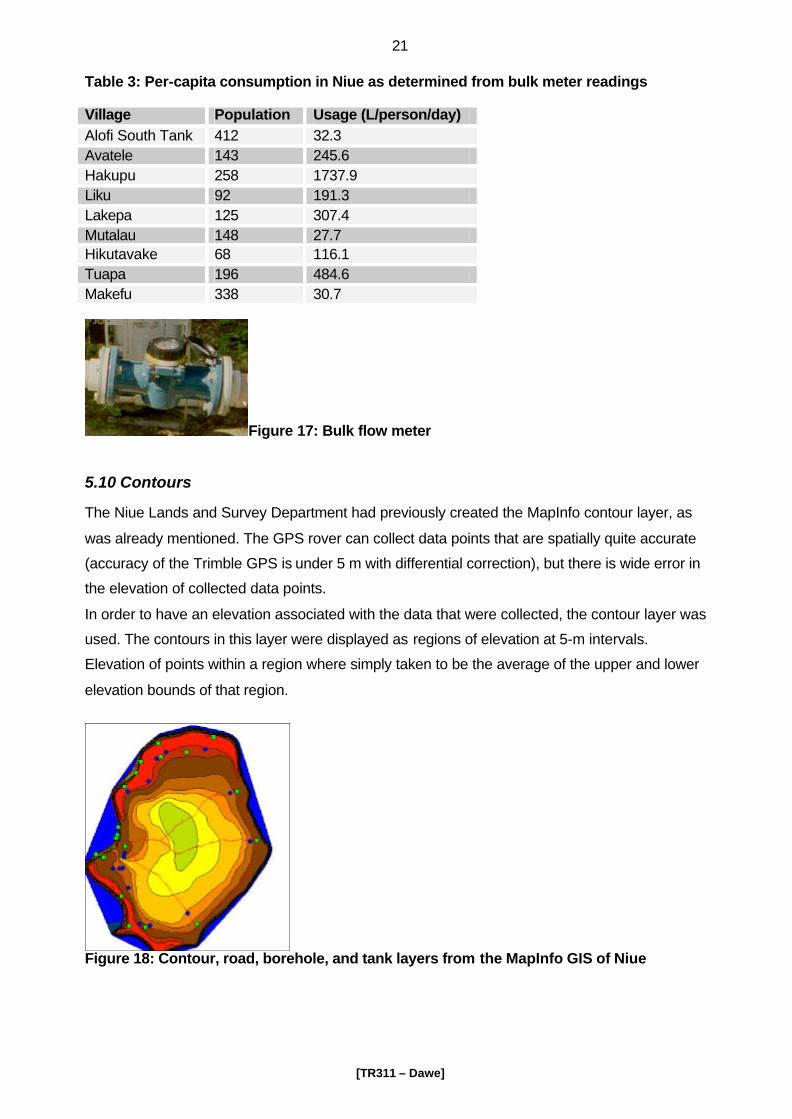
5.10 Contours
The Niue Lands and Survey Department had previously created the MapInfo contour layer, as
was already mentioned. The GPS rover can collect data points that are spatially quite accurate
(accuracy of the Trimble GPS is under 5 m with differential correction), but there is wide error in
the elevation of collected data points.
In order to have an elevation associated with the data that were collected, the contour layer was
used. The contours in this layer were displayed as regions of elevation at 5-m intervals.
Elevation of points within a region where simply taken to be the average of the upper and lower
elevation bounds of that region.
Figure 18: Contour, road, borehole, and tank layers from the MapInfo GIS of Niue
[TR311 – Dawe]
22
6.0 CONCLUSIONS AND RECOMMENDATIONS
The pipe-detection work carried out in Niue was quite successful, even though less than half of
the villages meant to be surveyed were completed. The RD-500 PVC pipe detector was found to
work very well with the Niue distribution system, and expedited the work considerably.
The transfer of positional information into the GIS was hindered by software problems, but once
these were rectified, the creation of the MapInfo database went smoothly. It is hoped that the
linkage of information with the geographical location of water utility assets will be of assistance in
the planning, management and maintenance of the Government of Niue’s Water Supply Section.
In considering the work that was performed with this task, a fair amount still needs to be done in
order to see this work completed. The following recommendations are put forward for the
consideration of the Water Supply Section of the Niue Public Works Department.
• That pipe-detection surveys of Makefu, Tuapa, Namukulu, Hikutavake, Toi, Mutalau, Lakepa,
Liku and Hakupu villages be carried out and information concerning the layout, location,
physical characteristics and function of the assets of the water-distribution system be added
to the existing GIS.
• That water meters continue to be read on a monthly basis in addition to the electrical
consumption meters.
• That maintenance be carried out on the various tanks requiring it. This would include the
replacement of flat roofs on the Toi, Lakepa, Liku, Vaiea, and Tamakautoga tanks, and the
resealing of bases on Alofi North and Alofi South tanks.
• That a member of the Water Section receives MapInfo training so that proper maintenance of
the GIS created can be performed.
• That continued pipe-detection work be carried out in the cool season if possible.
• That a check be made with the manufacturer of the litre reading bulk flow meters to check
whether they read as 1 rev equals 100 or 1000 litres.
• That additional information concerning the Water Section’s assets be entered in the database,
including dollar values of items, pressure readings at specific junctions, pipe roughness,
pump characteristics, last date of maintenance, etc.
Although a fair amount of data concerning the assets of the water utility were entered in the GIS,
there were certain gaps in this information that need to be filled in. Specifically, the following
information was not available at the time of the GIS’s creation:
[TR311 – Dawe]
23
• information on the old Vaiea and SP5 boreholes - pump type, water depth, bore diameter,
power supply, etc.
• dwelling owners for most properties
• number of occupants at each property
• typical roughness values of the pipes in the system
• information about the pumps: capacity, maximum head, power, efficiency, pump curve,
speed, maximum discharge pressure (probably provided in the pump specification sheets)
• pressure at selected junctions (requires a pressure meter)
• demand data and demand patterns (requires a flow meter)
• location of valves that were missed in Tamakauton, Avatele, Vaiea, and Alofi South
• types of valves
• rock type the bore holes are drilled through
• bore hole casing type
• maximum and minimum water levels of Hikutavake tank
• height and diameter of Vaiea, Namukulu and Tuapa tanks
• diameter, height, and capacity of old tanks and whether they're still used
• costs and values of the water utility assets
[TR311 – Dawe]
24
7.0 REFERENCES
Asian Development Bank. 1999. Cook Islands Urban Infrastructure Project Preparatory Technical
Assistance.
Green, Vic. 1999. PACTAF Water Supply Project: Niue Island, South Pacific. Government of Niue
Public Works Department.
McGhee, Terence J. 1991. Water Supply and Sewerage, 6th ed. McGraw-Hill Inc. New York.
McIntosh, Arthur C., Yniguez, Cesar E. 1997. Second Water Utilities Data Book- Asian and
Pacific Region. Asian Development Bank.
Secretariat of the Pacific Community. 1997. Niue Population Profile. Government of Niue.
WHO. 1993. Guidelines for drinking-water quality. Volume 1, Recommendations. World Health
Organisation. Geneva.

[TR311 – Dawe]
25
Appendix A: Information Held in the Different
MapInfo Layer Tables

[TR311 – Dawe]
26
Appendix B: Pipe Layout Maps