physiological causes of yield variation in cassava (manihot
TRANSCRIPT
PHYSIOLOGICAL CAUSES OF YIELD VARIATION
IN CASSAVA (MANIHOT ESCÜLENTA CRANTZ)
Ml I III • IM l i n • - - - •
0000 0118 2381

Promotor: dr.ir. M. Flach,
hoogleraar in de tropische plantenteelt
Co-promotor: dr.ir. G.H. de Bruijn,
wetenschappelijk hoofdmedewerker
^MO?2o) , (bSö
H.J. Veltkamp
Physiological causes of yield variation
in cassava (Manihot esculenta Crantz)
Proefschrift
ter verkrijging van de graad van
doctor in de landbouwwetenschappen,
op gezag van de rector magnificus,
dr. C.C. Oosterlee,
in het openbaar te verdedigen
op woensdag 18 september 1985
des namiddags te vier uur in de aula
van de Landbouwhogeschool te Wageningen.
B I B L I O T H E E K DEK
LANDBOUWHOGESCHOOL WAGENLNGEM
CONTENTS page
1 INTRODUCTION 1
2 REVIEW OF LITERATURE ON PHYSIOLOGICAL DETERMINANTS
OF CASSAVA STORAGE ROOT YIELD 1
2.1 Planting and rate of sprouting 7
2.2 Development of the leaf area 7
2.2.1 Leaf formation rate per apex 7
2.2.2 Number of apices and branching patterns 8
2.2.3 Leaf size 8
2.2.4 Leaf life 9
2.2.5 Leaf area index (LAI) and leaf area duration 9
2.3 Photosynthesis in attached leaves 10
2.4 Initiation and growth of storage roots 11
2.5 Sink-source relationships 12
2.6 Growth period 14
3 MATERIALS AND GENERAL METHODS 15
3.1 Location 15
3.2 Clones 15
3.3 Cultural practices 20
3.4 Experimental design, number of border rows
and number of sample plants 21
3.5 Measurements of the growth process 21
3.5.1 Plant height, leaf formation rate, branching
pattern 21
3.5.2 Leaf life 23
3.5.3 Leaf size 23
3.5.4 Light interception by the foliage 24
3.5.5 Diagnosis of nutritional status of the
crop during the growth period 24
3.5.6 Fallen leaves 25
3.5.7 Fresh and dry weights 25
3.5.8 Total leaf area 25
3.5.9 Number of storage roots 26
jj/uo/^Zol, /ö6ö-
B I B L I O T H E E K I>KK
LANDBOUWHOGESCHOOL WAGüNlWGEü
STELLINGEN
1. Als selectie parameters bij cassave verdienen de ESRP (de 'efficiency of storage root production') en de AISS ('apparent initial start of starch accumulation') de voorkeur boven de HI (harvest index).
Dit proefschrift
2. Onderzoek naar kloonverschillen bij cassave voor wat betreft de fotosynthese snelheid van bladeren met het doel de resultaten te gebruiken in een kruisingsprogramma gericht op de verhoging van de opbrengst aan verdikte wortels is momenteel niet zinvol.
Mahon, J.D., S.B. Lowe and L.A. Hunt (1977). Variation in the rate of photosynthetic C02 uptake in cassava cultivars and related species of «anihot. Photosynthetica 11 (2) 131 - 138. Palta, J.A. (1982). Gas exchange of four cassava cultivars in relation to light intensity. Expl. Agric. 18 : 373 - 382.
3. Meer nog dan nieuwe, verbeterde klonen kan op korte termijn toepassing van verbeterde teeltmethoden bijdragen aan de verhoging van de opbrengst aan verdikte wortels van cassave.
De Vries, CA., J.D. Ferwerda en M. Flach (1967). Choice of food crops in relation to actual and potential production in the tropics. Neth. J. of agric. Sc. 15 : 241 - 248.
4. Verhoging van de harvest index voor verdikte wortels leidt bij cassave tot een toename van de nutriënten efficiency.
Veltkamp, H.J. Publication in preparation.
5. De waarheid van het gezegde 'Wie schrijft die blijft' dient men zich bij het landbouwkundig onderzoek en de landbouwvoorlichting in tropische landen veel meer aan te trekken.
6. Adviezen voor de teelt van cassave waarbij bemesting, in welke vorm dan ook, niet nodig wordt geacht dienen als onjuist ter zijde te worden gelegd.
Toro, J.C. and C.B. Atlee (1980). Agronomic practices for cassava production: a literature review. In: Weber, E.J. et al. (eds.), Cassava cultural practices. Proceedings of a workshop, Salvador, Bahia, Brazil, 18-21 March 1980. International Research Development Center, Ottawa, IDRC -151e, pp. 13 - 28.
7. Veel meer nog dan nieuwe onderzoeksresultaten dienen overzichten van resultaten van reeds verricht onderzoek in voor de tropen 'toegankelijke' tijdschriften te worden gepubliceerd. Zij zullen bijdragen tot een versnelling van het beschikbaar komen van voor de praktijk bruikbare resultaten.
8. Voor een goede overdracht van resultaten van landbouwkundig onderzoek naar de boeren via de Landbouwvoorlichtingsdienst is het gewenst dat ieder onderzoeksstation in de tropen ook een afdeling Kontakten-met-de-Landbouwvoorlichting kent die daar zorg voor kan dragen en tevens bij kan dragen aan de gewenste informatiestroom vanuit de praktijk naar de onder-zoeksstations.
9. Landbouwbladen in de tropen dienen veel meer aan te sluiten bij de dagelijkse gang van zaken op de boerenbedrijven.
10. Het CIAT Cassave onderzoeksprogramma richt zich niet in de eerste plaats op het gebruik van de verdikte wortels van cassave in de voeding van de mens, ofschoon dat gezien het gebruik voor de hand zou liggen.
11. Onderzoek op het gebied van de onkruidkunde en de onkruidbestrijding in de tropen dient extra te worden gestimuleerd vanwege de grote arbeids-behoefte voor de bestrijding van onkruid.
12. De introductie van de aardappel in Oost Nederland heeft plaatsgevonden vóór 1700. De verspreiding van de aardappelteelt over Nederland behoeft niet vanuit het zuiden te hebben plaatsgevonden.
Roessingh, H.K. (1976). Het begin van de aardappelteelt en de aardappel consumptie in Gelderland. Gelders Oudheidkundig Contactbericht nr. 68: 1 - 9 . Vooys, A.C. de (1954). De verspreiding van de aardappelteelt in ons land in de 18e eeuw. Geografisch tijdschrift 7 : 1 - 5 .
13. Voor het verrichten van een promotie-onderzoek op teeltkundig gebied verdient voor een uitvoering binnen de daarvoor door de Landbouwhogeschool geboden periode van 3 jaar bij de gewaskeuze tuinkers veruit de voorkeur boven cassave.
14. Toevoegen van niet plezierig geurende stoffen aan bestrijdingsmiddelen die worden gebruikt in de land- en tuinbouw zal leiden tot een voorzichtiger en zorgvuldiger omgaan met die middelen in de tropen.
15. Een peul van kouseband (Vigna unguicuiata var. sesquipedaiisj lijkt meer op een yardlong bean dan op een haricot kilomètre.
Proefschrift van H.J. Veltkamp Physiological causes of yield variation in cassava (»anihot escuJenta Crantz) Wageningen, 18 september 1985.
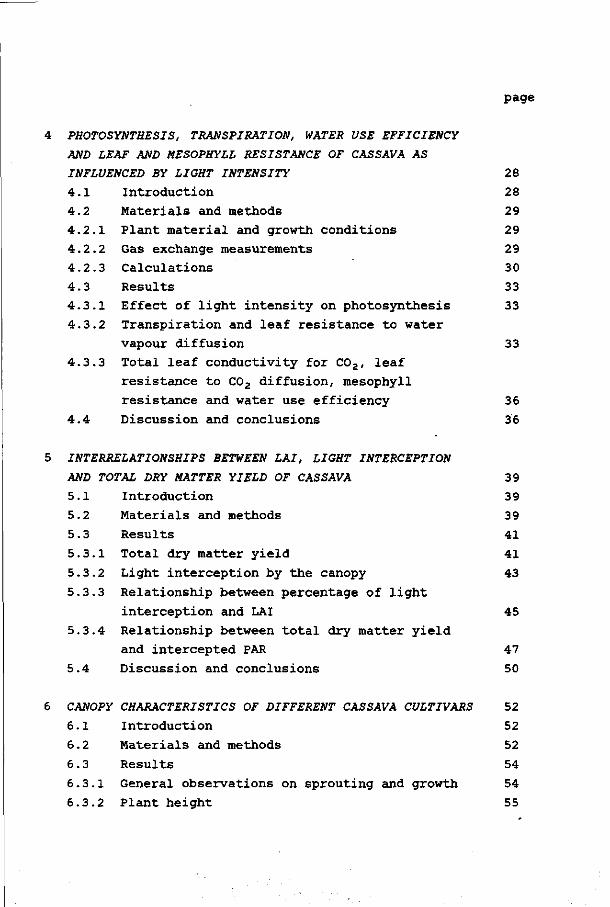
page
PHOTOSYNTHESIS, TRANSPIRATION, WATER USE EFFICIENCY
AND LEAF AND MESOPHYLL RESISTANCE OF CASSAVA AS
INFLUENCED BY LIGHT INTENSITY 28
4.1 Introduction 28
4.2 Materials and methods 29
4.2.1 Plant material and growth conditions 29
4.2.2 Gas exchange measurements 29
4.2.3 Calculations 30
4.3 Results 33
4.3.1 Effect of light intensity on photosynthesis 33
4.3.2 Transpiration and leaf resistance to water
vapour diffusion 33
4.3.3 Total leaf conductivity for C02, leaf
resistance to C02 diffusion, mesophyll
resistance and water use efficiency 36
4.4 Discussion and conclusions 36
INTERRELATIONSHIPS BETWEEN LAI, LIGHT INTERCEPTION
AND TOTAL DRY MATTER YIELD OF CASSAVA 39
5.1 Introduction 39
5.2 Materials and methods 39
5.3 Results 41
5.3.1 Total dry matter yield 41
5.3.2 Light interception by the canopy 43
5.3.3 Relationship between percentage of light
interception and LAI 45
5.3.4 Relationship between total dry matter yield
and intercepted PAR 47
5.4 Discussion and conclusions 50
CANOPY CHARACTERISTICS OF DIFFERENT CASSAVA CULTIVARS 52
6.1 Introduction 52
6.2 Materials and methods 52
6.3 Results 54
6.3.1 General observations on sprouting and growth 54
6.3.2 Plant height 55
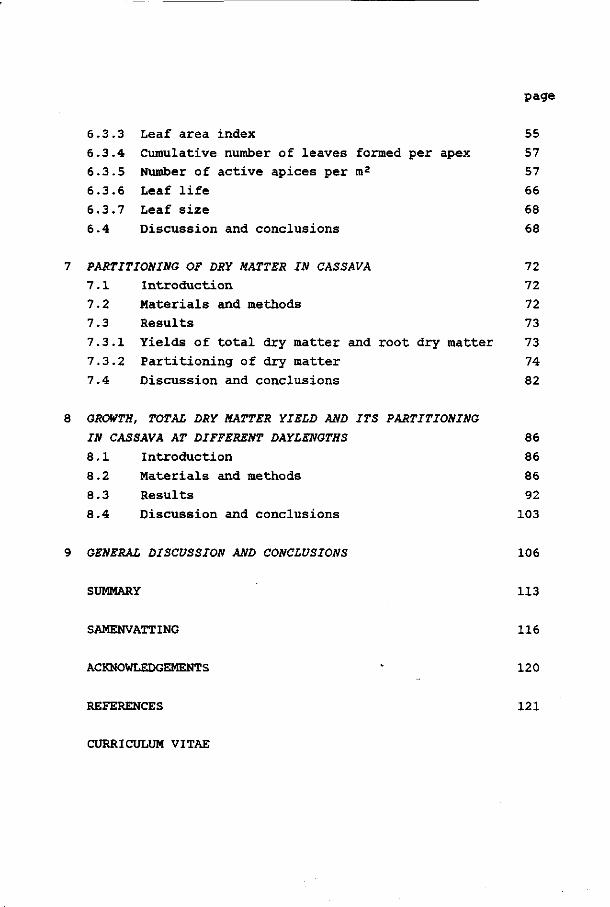
page
6.3.3 Leaf area index 55
6.3.4 Cumulative number of leaves formed per apex 57
6.3.5 Number of active apices per m2 57
6.3.6 Leaf life 66
6.3.7 Leaf size 68
6.4 Discussion and conclusions 68
7 PARTITIONING OF DRY MATTER IN CASSAVA 72
7.1 Introduction 72
7.2 Materials and methods 72
7.3 Results 73
7.3.1 Yields of total dry matter and root dry matter 73
7.3.2 Partitioning of dry matter 74
7.4 Discussion and conclusions 82
8 GROWTH, TOTAL DRY MATTER YIELD AND ITS PARTITIONING
IN CASSAVA AT DIFFERENT DAYLENGTHS 86
8.1 Introduction 86
8.2 Materials and methods 86
8.3 Results 92
8.4 Discussion and conclusions 103
9 GENERAL DISCUSSION AND CONCLUSIONS 106
SUMMARY 113
SAMENVATTING 116
ACKNOWLEDGEMENTS * 120
REFERENCES 121
CURRICULUM VITAE
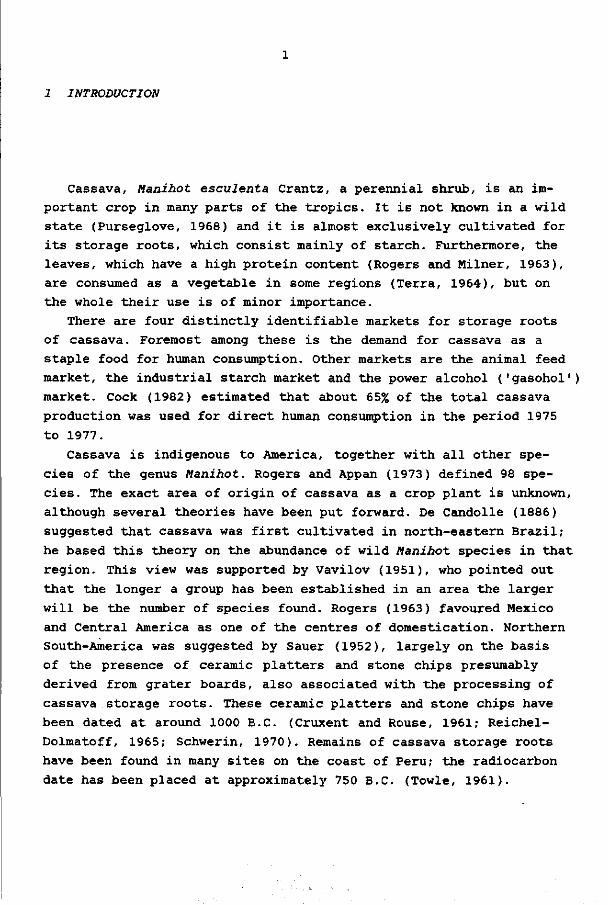
INTRODUCTION
Cassava, Manihot esculenta Crantz, a perennial shrub, is an im
portant crop in many parts of the tropics. It is not known in a wild
state (Purseglove, 1968) and it is almost exclusively cultivated for
its storage roots, which consist mainly of starch. Furthermore, the
leaves, which have a high protein content (Rogers and Milner, 1963),
are consumed as a vegetable in some regions (Terra, 1964), but on
the whole their use is of minor importance.
There are four distinctly identifiable markets for storage roots
of cassava. Foremost among these is the demand for cassava as a
staple food for human consumption. Other markets are the animal feed
market, the industrial starch market and the power alcohol ('gasohol')
market. Cock (1982) estimated that about 65% of the total cassava
production was used for direct human consumption in the period 1975
to 1977.
Cassava is indigenous to America, together with all other spe
cies of the genus Manihot. Rogers and Appan (1973) defined 98 spe
cies. The exact area of origin of cassava as a crop plant is unknown,
although several theories have been put forward. De Candolle (1886)
suggested that cassava was first cultivated in north-eastern Brazil;
he based this theory on the abundance of wild Manihot species in that
region. This view was supported by Vavilov (1951), who pointed out
that the longer a group has been established in an area the larger
will be the number of species found. Rogers (1963) favoured Mexico
and Central America as one of the centres of domestication. Northern
South-America was suggested by Sauer (1952), largely on the basis
of the presence of ceramic platters and stone chips presumably
derived from grater boards, also associated with the processing of
cassava storage roots. These ceramic platters and stone chips have
been dated at around 1000 B.C. (Cruxent and Rouse, 1961; Reichel-
Dolmatoff, 1965; Schwerin, 1970). Remains of cassava storage roots
have been found in many sites on the coast of Peru; the radiocarbon
date has been placed at approximately 750 B.C. (Towle, 1961).

These data certainly indicate that cassava was already being cul
tivated in many parts of America during the first millennium B.C.
The time of initial cultivation is assumed to be considerably more
ancient (De Boer, 1975). By the time of Columbus's discovery of Amer
ica cassava had reached its present limit of cultivation in America
(Purseglove, 1968).
The cassava plant spread from the American continent in post-
Columbian times. At different times it was carried by the Portu
guese from the east coast of Brazil to their stations on the entire
west coast of Africa from Senegal to Angola (Ross, 1975). The ear
liest successful introductions were probably made on the islands
Säo Tomé, Principe and Fernando Poo in the Bight of Benin, and in
the area around the mouth of the Congo river during the latter half
of the sixteenth century (Jones, 1959). It is only since the begin
ning of the twentieth century that the cultivation of cassava has
spread rapidly into the interior of West Africa. In East Africa
cassava was absent or unimportant in most of the region in 1850,
except right along the coast (Ross, 1975). The main expansion has
taken place since 1920. Cassava was encouraged, as in West Africa,
as a famine reserve. The most likely period of introduction of cas
sava into Java is around 1810 (Koch, 1934). The introduction of
cassava into India has been set at 1794 (François, 1938; Kiok, 1934).
As at most African locations, in India and Java the adoption of cas
sava was also slow at first.
The present-day distribution of cassava is worldwide in regions
between latitudes 30° north and south. According to FAO (1982) cas
sava is now cultivated in more than 80 countries in Africa, Latin
America, the Far East and Oceania.
In 1981 the total area cultivated with cassava was approximately
14.1 x io6 ha, an increase of 3.3 x io6 ha since the period 1969-
1971. World production of storage roots increased from 97 to 127
million tons in the same period (FAO, 1982). In 1981 nearly 70% of
the world production came from only six countries (Brazil, Thailand,
Indonesia, Zaire, Nigeria and India), while 90% of the total pro-
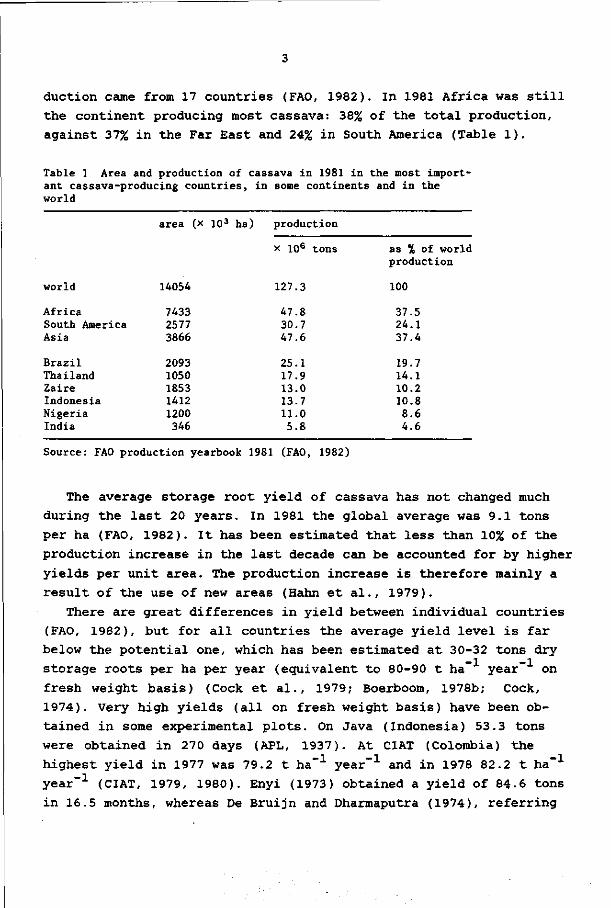
auction came from 17 countries (FAO, 1982). In 1981 Africa was still
the continent producing most cassava: 38% of the total production,
against 37% in the Far East and 24% in South America (Table 1).
Table 1 Area and production of cassava in 1981 in the most important cassava-producing countries, in some continents and in the world
area (x 103 ha)
world 14054
Africa South America Asia
Brazil Thailand Zaire Indonesia Nigeria India
7433 2577 3866
2093 1050 1853 1412 1200 346
production
x 106 tons
127.3
47.8 30.7 47.6
25.1 17.9 13.0 13.7 11.0 5.8
as % of world production
100
37.5 24.1 37.4
19.7 14.1 10.2 10.8 8.6 4.6
Source: FAO production yearbook 1981 (FAO, 1982)
The average storage root yield of cassava has not changed much
during the last 20 years. In 1981 the global average was 9.1 tons
per ha (FAO, 1982). It has been estimated that less than 10% of the
production increase in the last decade can be accounted for by higher
yields per unit area. The production increase is therefore mainly a
result of the use of new areas (Hahn et al., 1979).
There are great differences in yield between individual countries
(FAO, 1982), but for all countries the average yield level is far
below the potential one, which has been estimated at 30-32 tons dry
storage roots per ha per year (equivalent to 80-90 t ha~ year" on
fresh weight basis) (Cock et al., 1979; Boerboom, 1978b; Cock,
1974). Very high yields (all on fresh weight basis) have been ob
tained in some experimental plots. On Java (Indonesia) 53.3 tons
were obtained in 270 days (APL, 1937). At CIAT (Colombia) the
highest yield in 1977 was 79.2 t ha year"1 and in 1978 82.2 t ha
year"1 (CIAT, 1979, 1980). Enyi (1973) obtained a yield of 84-6 tons
in 16.5 months, whereas De Bruijn and Dharmaputra (1974), referring
to Indonesian literature data on yield of Mukibat cassava (Manihot
glaziovii grafted onto cassava), reported a yield of about 96 t ha~
year- .
Several constraints to higher yields have been reported: lack of
adequate clones, poor weed control, poor disease and pest manage
ment, lack of fertilizers and generally poor agronomic practices
(Cock, 1979; Hahn et al., 1979).
Until recently, cassava was neglected in agricultural research.
In their study of the choice of food crops in relation to actual and
potential production in the tropics, De Vries et al. (1967) con
cluded that root and tuber crops, including cassava, should play an
important role in the search for increasing food production.
In the early 1970s, two international research centres, the Inter
national Institute of Tropical Agriculture (UTA) at Ibadan (Nigeria)
and the Centro Internacional de Agricultura Tropical (CIAT) near Cali
(Colombia), started extensive research programmes on cassava. One of
the objectives of the CIAT Cassava programme was formulated as: 'To
study the problems associated with the production of energy in the
form of roots and hence to develop varieties and cultural practices
that will give high levels of productivity' (CIAT, 1972).
Breeding for the improvement of cassava has received very little
attention in the past compared with many other crops (Hahn et al.,
1979; Kawano, 1978). Serious breeding of cassava was probably star
ted in Indonesia by Van der Stok (1910) in approximately 1908.
The aim of* CIAT's cassava breeding programme is to obtain new
genotypes that give maximum caloric yield per unit area per unit
time over a wide range of climatic conditions and with limited use
of chemical inputs, by genetic modification of the plant structure,
including protection against pests and diseases. In recent years,
achieving the highest potential yield has been the primary interest
(Kawano, 1978).
In order to modify the plant structure of cassava in such a way
that new promising genotypes can be obtained by breeding, the con
struction of a model plant or ideotype of cassava was initiated by
the cassava physiology programme of CIAT (CIAT, 1974; Cock et al.,
1979).
The approach of constructing model plants or ideotypes was orig
inally proposed by Donald" (1968). An ideotype was defined as 'a
biological model which is expected to perform or behave in a pre
dictable manner within a defined environment'. The following steps
for the construction of an ideotype can be distinguished (e.g.
Adams (1973)):
- identifying those morphological and physiological components re
lated to yield, for which genetic variation exists
- formulating one or more plausible plant-type models
- constructing plausible ideotypes by suitable breeding processes
- testing the constructed cultivars against standard cultivars
- after testing, reassessing of the models to determine whether
adjustments in particular components would lead to better perfor
mance. If so, a reformulation followed by new constructions will
proceed.
Under optimal growing conditions the growth of a root crop such
as cassava is mainly determined by:
- rate of photosynthesis per unit leaf area
- magnitude of the leaf surface available for photosynthesis
('source')
- capacity of the plant to translocate assimilates from the leaves
to the storage roots
- capacity of the storage roots to accept assimilates ('sink')
- respiratory activity.
In cassava the storage roots are the predominant sink during the
root-filling period and the photosynthetically active parts of the
plants act as the 'source'. Early in the growth period the shoots
form an important sink (Mason, 1972; CIAT, 1978; Tan and Cock,
1979a).
The aim of this study was to obtain more information on physio
logical determinants of storage root and total dry matter produc
tion of cassava in order to get a better insight into how storage
root yield can be increased. Furthermore, the variation in morphol
ogical characteristics in a selected number of clones was investi-
gated. The research, the results of which are reported in the fol
lowing chapters, was done from August 1978 to July 1981. In the next
chapter the literature on physiological determinants of cassava
storage root yield is reviewed. In Chapter 3 the ecological condi
tions under which the field experiments were conducted are described
and questions related to the general methods followed and materials
used are discussed. The results of a study on photosynthesis and
transpiration of attached leaves of four cassava clones are reported
in Chapter 4. Interrelationships between LAI, light interception and
total dry matter yield are discussed in Chapter 5. Canopy character
istics of different cultivars are described in Chapter 6.. Chapter 7
comprises a study of the partitioning of produced dry matter in cas
sava. In Chapter 8 the effects of daylength on growth, total dry
matter production and its partitioning are described. A general dis
cussion of the results follows in Chapter 9, especially with respect
to their implications for improving cassava production.

2 REVIEW OF LITERATURE ON PHYSIOLOGICAL DETERMINANTS OF CASSAVA
STORAGE ROOT YIELD
Hunt et al. (1977) have reviewed the information on the growth
physiology of cassava contained in research published up to circa
1974. Since 1974 considerable physiological data on cassava growth
have been collected. All data available until 1983 have been re
viewed in this chapter.
2.1 PLANTING AND RATE OF SPROUTING
In commercial production, cassava is propagated exclusively by
stem cuttings of varying length (generally 15 to 35 cm), which are
planted horizontally, vertically, or at slant. The basal part of cut
tings planted vertically or at a slant is inserted 5 to 10 cm deep
in the soil (Purseglove, 1968). Toro and Atlee (1980) have reviewed
the literature on the effect on the storage root yield of the size
of the cuttings, the planting position and the planting depth.
Cours (1951) reported that under the climatic conditions of the
Malagasy Republic the first leaves appeared 10 days after planting.
Keating and Evenson (1979) found that the minimum temperature for
sprouting ranged from 12°C to 17°C, w^th the optimum temperature
being from 28.5°C to 30°C. Time to 50% sprouting was 150-210 degree-
days above a base of 13°C. Cock and Rosas (1975) observed large
clonal differences in rate of sprouting at a site 2300 m above sea
level, near the equator (mean temperature circa 17°C).
2.2 DEVELOPMENT OF THE LEAF AREA
The development of the leaf area per unit ground area depends on
number of plants per unit area, number of active apices (branches),
number of leaves formed per apex, leaf size, and leaf life.
2. 2.1 Leaf formation rate per apex
Cassava plants produce new leaves continuously. The pattern of
leaf formation rate per apex has been detailed in several publica-

tions (CIAT, 1976; CIAT, 1977; Irikura et al., 1979; Cock et al.,
1979). With one exception (MCol 72), little variation was found be
tween the clones studied (CIAT, 1977; Tan and Cock, 1979b). The leaf
formation rate per apex decreased with plant age. Leaf formation rate
was lower at 20°C than at 24°C and 28°C (Irikura et al., 1979).
2.2.2 Number of apices and branching patterns
After a certain number of nodes (leaves) have been formed (the
number depends on the clone, the climate and the soil (CIAT, 1979;
Irikura et al., 1979; De Bruijn, 1977; Van der Stok, 1910; ), the
growing point becomes reproductive. At the same time a number of
axillary buds sprout and develop into similarly sized branches
(generally two to four, sometimes up to six (Van der Stok, 1910))
(see also Fig. 3). Later on in the growth period this process can
be repeated, thus giving the second branch level. In all, up to
six branch levels have been observed for plants younger than one
year (Van der Stok, 1910). On the other hand, a clone that did not
branch at all in a growth period of one year has been observed
(CIAT, 1979). Miège (1957) showed that the length of the planted
cuttings (which ranged from 16 to 60 cm in his study) did not in
fluence the length of the period from planting until the first or
second branch level was reached. Neither did the planting method
have any significant effect on the length of the period to the first
branching. Cuttings taken from the main stem branched later than cut
tings obtained from the first to the third branch levels. Unfortu
nately, in his study Miège gave no information on the rate of leaf
formation, so it is not clear whether the observed differences in
time to branching were caused by differences in that rate.
2.2. 3 Leaf size
Leaf size has been found to increase to a maximum and then to
decline in all clones studied and under different ecological condi
tions. The maximum average size of a mature leaf was generally ob
served at 3 to 4 months after planting. Large clonal differences
were observed in maximum leaf size (CIAT, 1976). At higher temper
atures (means of 24°C and 28°C) leaves were larger than at 20°C
(Irikura et al., 1979). Moreover, soil fertility influenced the
average leaf size, the leaves being smaller in less fertile soil
(CIAT, 1979). It has been found that changing the branching pattern
by clipping apices results in bigger leaves when only one apex is
retained (Tan and Cock, 1979a).
2. 2. 4 Leaf life
Mutual shading of leaves greatly limits leaf life. Rosas et al.
(1976) reported that when light absorption by a leaf lamina was pre
vented, a quick abscission of that leaf resulted (in about 10 days).
Leaf life also varies with clone and environmental conditions (Iri
kura et al., 1979). It has been found that leaf life is not nega
tively influenced by rapid storage root growth (Rosas et al., 1976)
and that leaf life is longer when the number of active apices is re
duced (Tan and Cock, 1979a); the latter is presumably a result of
reduced shading. The maximum leaf life is 210 days (Irikura et al.,
1979); the minimum leaf life approximately 40 days (CIAT, 1978).
2. 2. 5 Leaf area index (LAI) and leaf area duration
Generally, the leaf area index (leaf area per unit ground area)
increases slowly during the first 1 to 2 months of the growth peri
od. Then follows a rapid increase and a decline thereafter (Cours,
1951; Enyi, 1972c; Cock, 1976). Until recently, the maximum reported
leaf area indices were about 7 to 8 (Enyi, 1973; Cock, 1976; CIAT,
1979), but these values were maintained during relatively short
periods only. Keating (1982) reported leaf area indices up to and
exceeding 10.0 in periods with long days in Queensland, Australia,
although maximum leaf area indices of 3 to 4 were more normal, al
though only during short periods.
Doku (1965) reported that clones that gave high yields had the
ability to retain a large number of leaves and had a large leaf
area and a large area of green stem. Sinha and Nair (1971) conclu
ded that the leaf area duration is an important factor contributing
to the storage root yield of cassava. They found that the clones
that had a large leaf area duration and relatively high leaf area
indices (in their study the leaf area indices of the clones varied
10
from 0.7 to 2.7) were high yielders. Enyi (1972b,c) reported a posi
tive relationship between leaf area duration and storage root yield
in one study, but not in another (Enyi, 1973). An optimal leaf area
index for storage root growth of 3.0 - 3.5 has been suggested (CIAT,
1976; Cock et al., 1979).
Williams and Ghazali (1969) suggested that storage root yield is
associated with the leaf angle, so clones with vertically orientated
leaves should have a higher yielding ability than those that possess
horizontally disposed leaves. Cock (1976), however, found that there
was little, if any advantage of a more vertical leaf orientation over
a horizontal leaf orientation for clones that had leaf area indices
up to about 4.
2.3 PHOTOSYNTHESIS IN ATTACHED LEAVES
Several studies have been done on photosynthetic C02 uptake of
attached leaf parts of cassava clones and wild Manihot species (Ma
non et al., 1976; Manon et al., 1977a,b; Aslam et al., 1977; CIAT,
1978). Large variations in net photosynthetic rate were observed, -2 -1 ranging from 15 to 29 mg C02 dm h at a photon flux density of
-2 -1
165 nEmstein cm s (400-700 nm) (Mahon et al., 1977b) and from
27 to 33 mg C02 d m " 2 ^ 1 at 100 nEinstein cm~2s_ 1 (400-700 nm) for
plants grown outdoors (CIAT, 1978). Photosynthesis was already light--2 -1 saturated at a photon flux density of 110 nEinstein cm s (Mahon
et al., 1977a). A high C02 compensation point (68 vppm at 25°C) was
found, and also a high ratio of H20 efflux/C02 uptake (109 to 138),
suggesting a C3 photosynthetic pathway in cassava (Mahon et al.,
1977a). The temperature optimum for C02 assimilation was 25°C (Mahon
et al., 1977a). Data from CIAT suggest a very broad optimal range of
temperature (nearly 20-40°C) (Cock, personal communication 1982).
The net photosynthetic rate decreased with leaf age, especially at
saturating light intensities. Significant clonal differences were
observed in the pattern of decline (Aslam et al., 1977). At CIAT
(1979, 1980), however, for one clone no decrease in photosynthetic
rate was observed with leaf ages up to 100 days.
11
2.4 INITIATION AND GROWTH OF STORAGE ROOTS
Planted cuttings start to root some 5 days after planting (Cours,
1951 ). In cassava the development of storage roots starts with the
initiation of secondary growth of the roots. This process has been
observed in plants only three weeks old. The deposition of starch
grains starts some days later and takes place mostly in the second
ary xylem parenchyma cells in the central part of the roots (Indira
and Sinha, 1970; Indira and Kurian, 1977). The starch grains formed
first have a diameter of only 2-6 pm, but they grow relatively rapid
ly during the first two months of the growth period, although less
rapidly thereafter (Cours, 1951). New starch grains are formed con
tinuously. Cours (1951) found that the mean diameter of starch grains
in storage roots of 7- to 27-month old plants of 19 clones varied
from 12.9 to 14.6 \im.
Under field conditions it is difficult to define the moment at
which storage root growth starts. Sometimes storage roots are arbi
trarily distinguished from others by their thickness, i.e. those
thicker than 0.5 cm (Boerboom, 1978a). A thickness of 0.5 cm is
generally reached 2-4 months after planting.
Boerboom (1978a) assumed that during the root filling phase the
partitioning of dry matter in cassava over different plant parts
(storage roots, stems) is constant. To describe this phenomenon he
introduced two terms: the 'efficiency of storage root production
(ESRP)', being the regression coefficient of the linear equation
between the storage root weight and the total dry weight; and the
'initial start starch accumulation (ISS)', being the plant weight at
which storage root production starts. For the latter parameter Flach
(1982) proposed the more exact term 'apparent initial start of starch
accumulation (AISS)", as it is a calculated point. Boerboom's ESRP,
however, does not represent the true efficiency of storage root pro
duction because the weight of the fallen leaves is not included in
the total weight.
The relation between ESRP and harvest index (proportion of root
weight of the total plant weight and a much used selection criterion
(Kawano et al., 1978)), can be described with the help of an asymp
totic function (Boerboom, 1978a). For cassava, a large variation in
harvest indices has been observed. Kawano et al. (1978) reported a
12
range of 0 to 0.75 in an evaluation study of CIAT's germ plasm ac
cessions. In Indonesia, Van der Stok (1910) found a range of 0.23 to
0.61 for 52 clones.
2.5 SINK-SOURCE RELATIONSHIPS
In cassava, sink-source relationships have been studied by chang
ing the sizes of source and sink, varying the branching pattern,
removing apices, removing laminae, girdling plants, removing dif
ferent numbers of storage roots at the beginning of the root filling
period and by experimenting with grafts (Cours, 1951; Mason, 1972;
De Bruijn and Dharmaputra, 1974; Dharmaputra and De Bruijn, 1977;
Cock et al., 1979; Tan and Cock, 1979a; UTA, 1980).
Changing the branching pattern by clipping young apices led to
significantly higher dry root yield (Cock et al., 1979; Tan and Cock,
1979a). But, because both late branching clones (first branching at
six months after planting, with three branches at each branch level)
and early branching clones (with two branches at each branch level)
were found to give high storage root yields (Tan and Cock, 1979a),
it is questionable whether the branching pattern per se caused the
dry root yield increase. At UTA (1980) the highest root yield was
obtained in a plant type that branched at one metre.
In a tracer experiment with 1 4 C0 2 Hume (1975) found that in a
period of rapid growth of storage roots 60% of the labelled assim
ilates had been translocated to the storage roots in the seven days
after labelling, whereas after labelling in a dry period with a low
bulking rate the assimilates were mainly recovered in above-ground
parts. An active root sink apparently leads to a stimulation of the
translocation of assimilates to it. An increase in net assimilation
rate has been linked with an increased root growth rate (Enyi,
1972b,c). Williams (1972) suggested that in cassava the activity of
the root sink affects the photosynthesis. However, Cock et al. (1979)
reported that small reductions of the number of storage roots did
not result in lower yields of storage roots or of total dry matter,
as long as at least 9 storage roots per m2 were present. A further
reduction of the storage root number resulted in lower dry root
yields (Cock et al., 1979), so it seems unlikely that storage roots
have a large excess storage capacity and can accept more assimilates
13
if available (Tan and Cock, 1979a). De Bruijn (1971) found a corre
lation coefficient of 0.69 between the number of storage roots and
the storage root yield.
The effect on total dry weight and root dry weight of stem gird
ling to prevent the translocation of assimilates from the above-
ground parts to the roots was studied by Mason (1972), CIAT (1974)
and Cock et al. (1979). Mason (1972) reported a lower total dry
weight for the girdled plants. The root weight was 25% of that of
the ungirdled plants, whereas the stem weight of girdled plants was
more than 12 times higher. The same tendency was reported by CIAT
(1974). In another experiment Cock et al. (1979) found that the
total dry weight of the plants was not affected by girdling; the
distribution pattern, however, changed in the same way as reported
by Mason (1972) and CIAT (1974). Girdling stems had no effect on
total leaf area per plant, on leaf area per leaf (Cock et al.,
1979), nor on rate of leaf formation per apex (CIAT, 1974). This
suggests that a strong limitation of the root sink, induced by gird
ling, does not affect the source size. When as induced by girdling,
the roots are unable to accept assimilates from the source, these
assimilates are accepted by the stem. Data from Cock et al. (1979)
suggest that the stem is as effective at accepting assimilates as
the root sink. In contrast, in the experiments by Mason (1972) and
CIAT (1974), total dry weight increase was less in girdled plants
than in ungirdled ones.
Hahn (1977) stated that the treatments as mentioned above, to
change sink and source size have the disadvantage that they may
have adverse effects on internal physiological processes. By using
grafting or budding techniques, interference with these processes
can be minimized.
Cours (1951) grafted Manihot glaziovii onto cassava and observed
that the stock functioned as if the whole plant were cassava. The
reciprocal graft with Manihot glaziovii as stock formed fibrous
roots only, as happens with a complete M. glaziovii plant. Mogil-
ner et al. (1967), who made grafts between cassava and Manihot
flabellifolia, also concluded that the scion does not have any ef
fect on the formation of storage roots. So the capacity of a grafted
plant to form storage roots is inherent to the stock.
Grafting a scion of a clone with a low root fraction (0.38) onto
14
a stock of a clone with a relatively high root fraction (0.54) re
sulted in plants with a root fraction similar to that of the stock
(Cours, 1951). This suggests that the distribution of assimilates
is controlled by the stock.
De Bruijn and Dharmaputra (1974) and Dharmaputra and De Bruijn
(1977) reported very high storage root yields with grafted planting
material using Manihot glaziovii as scion and cassava as stock. This
system (the Mukibat system, named after its inventor) is practised
in East Java (Indonesia), where an increasing number of cassava
growers have adopted it since 1952 (De Bruijn and Dharmaputra,
1974). The majority of them came to use this system because they
felt it increased yield (Nugroho, 1976). It is most improbable that
these high yields were caused by a high photosynthetic rate of the
individual leaves, because the C02 uptake rate of Manihot glaziovii
leaves has been found to be lower than the mean photosynthetic rate
of leaves of ten cassava clones (Manon et al., 1977b).
2.6 GROWTH PERIOD
The growth period of cassava varies in practice from about six
months to two years (Purseglove, 1968; Jones, 1959; Ezeilo et al.,
1975). Ezeilo et al. (1975) reported that in a survey of 190 cas
sava-cultivating farmers in Nigeria it was found that on 47% of the
harvested fields the cassava was less than one year old, on 19% it
was between 1 and 1.5 years old and on 33% it was between 1.5 and 2
years old. In Colombia the average growth period was found to be 11
months, or longer at altitudes above 1000 m (Diaz and Pinstrup-
Andersen, 1977). Van der Stok (1910) stated that plants nearly three
year olds were still in good condition, although storage roots were
partly woody and were therefore unsuitable for human consumption.

15
3 MATERIALS AND GENERAL METHODS
This chapter provides the background for the more detailled de
scription of the individual experiments that are described in
Chapters 4-8 inclusive.
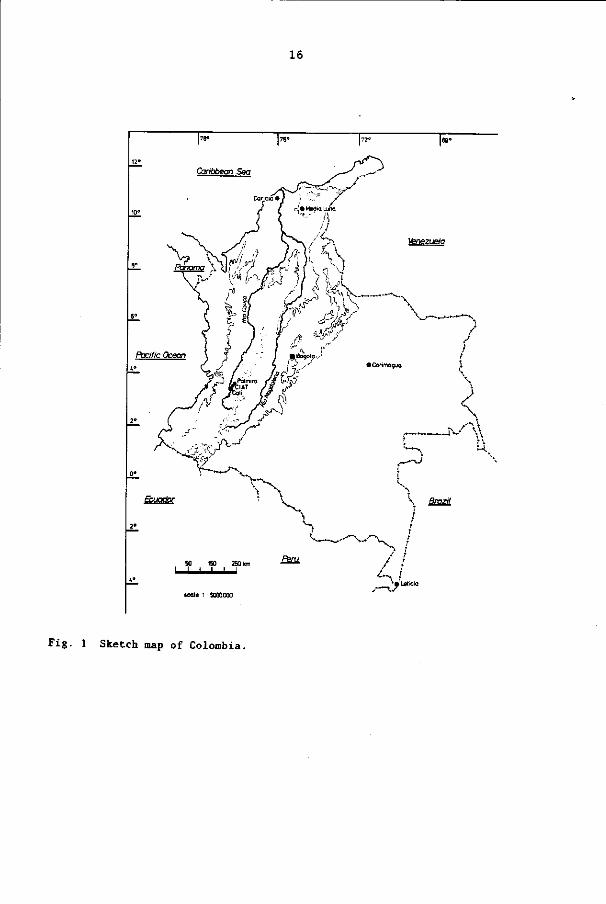
3.1 LOCATION
All the field experiments described in this thesis were conducted
at the experimental farm of the Centro Internacional de Agricultura
Tropical (CIAT) in Palmira, near Cali (Colombia) (Fig. 1), situated
1000 m above sea level at 3°31'N and 76°21'W. One pot experiment was
conducted to measure photosynthesis and transpiration, (see Chapter 4).
These experiments were carried out from December 1978 to March 1981.
Two additional experiments were carried out in a greenhouse at
the Department of Tropical Crops, Agricultural University in Wage
ningen, The Netherlands. These experiments were conducted in the
period October 1980 to July 1981. They are described in Chapter 8.
Meteorological data at Palmira for the period December 1978 to
March 1981 are presented in Table 2.
The soil, a fertile clay loam, has been classified as a Mollisol
(Howeler et al., 1978). Some chemical properties and data on the
particle size distribution of the topsoil (0-20 cm) of the experi
mental fields are given in Table 3.
3.2 CLONES
All the clones used in these experiments were taken from CIAT's
germ plasm bank. In this germ plasm bank (which contains approxi
mately 2400 accessions (Kawano, 1978)) the clones have been cata
logued as follows: first an M, which refers to Manihot esculenta,
followed by a code of three letters indicating the country where
the clone was collected and finally a number representing the CIAT
accession number for that country.
16
Caribbean Sea
Pacific Ocean
Ecuador
scale 1 SOOOa»
Fig. 1 Sketch map of Colombia.

17
Table 2 Meteorological data at C1AT experimental farm in Palmira (Colombia) for the period December 1978 - March 1981
1978 December
1979 January February March April May June July August September October November December
1980 January February March April May June July August September October November December
1981 January February March
tempe
mean
23.4
23.9 24.3 24.2 24.1 23.8 23.7 24.3 23.9 23.6 23.8 23.3 23.6
24.1 24.1 24.8 24.2 23.9 23-9 24.1 24.5 24.5 23.3 23.2 23.1
23.8 23.9 24.3
rature ( JC)
maximum minimum
28.4
29.5 30.4 29.4 29.1 28.8 28.9 30.3 29.4 28.8 29.0 28.4 29.0
30.0 29.7 30.7 29.6 29.3 29.0 30.4 30.8 30.5 28.7 28.6 28.9
30.4 29.6 29.7
19.5
19.0 18.8 19.6 19.6 19.3 19.2 18.7 18.6 18.6 19.2 19.1 18.9
19.2 19.7 19.8 19.6 19.7 19.4 19.2 18.7 19.5 19.2 19.0 18.8
19.0 19.6 19.4
precipitation (mm)
133
23 4
70 123 117 43 46
112 79 62
122 37
40 42 94 62 72 79 8
20 37
129 43 71
13 107 98
class A pan evaporation (mm)
154
168 173 169 153 141 135 181 165 155 145 151 145
173 163 173 157 146 130 173 185 185 152 147 148
194 151 188
relative humidity (%)
76
71 68 74 75 76 76 71 71 74 74 76 75
74 74 71 74 76 75 71 68 70 75 76 75
71 76 75
global radiation , (Jem day )
2012
2201 2092 1995 1894 2037 1705 2003 1823 2218 1701 1810 1945
1924 2192 2617 2848 1882 1882 2108 2276 2113 2142 2302 1739
1823 1823 1940
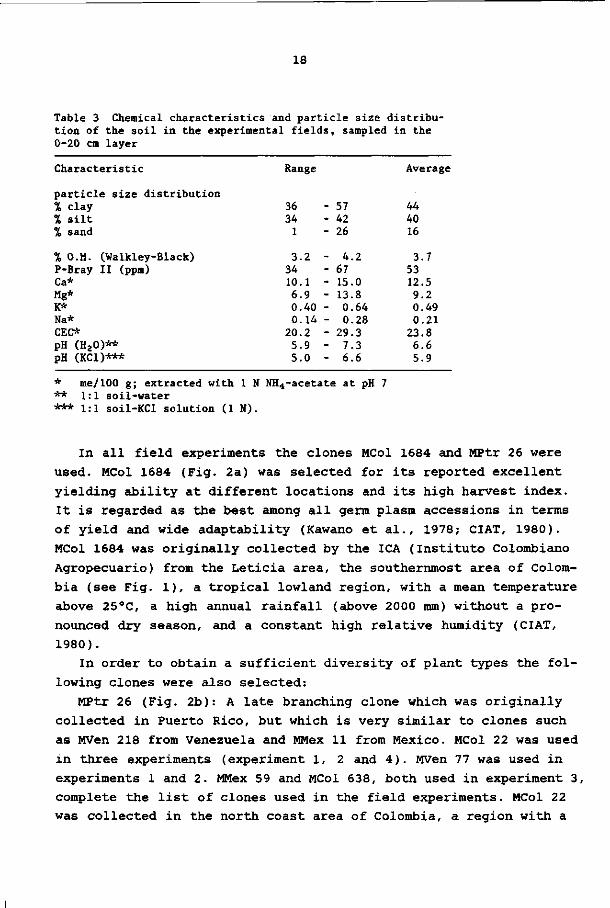
18
Table 3 Chemical characteristics and particle size distribution of the soil in the experimental fields, sampled in the 0-20 cm layer
Characteristic
particle size di % clay % silt % sand
% O.M. (Walkley-P-Bray II (ppm) Ca* Mg* K* Na* CEC* pH (H20)** pH (KCl)***
stribution
Black)
Range
36 34
1
3.2 34 10.1 6.9 0.40 0.14
20.2 5.9 5.0
---
---------
57 42 26
4.2 67 15.0 13.8 0.64 0.28
29.3 7.3 6.6
Average
44 40 16
3.7 53 12.5 9.2 0.49 0.21
23.8 6.6 5.9
* me/100 g; extracted with 1 N NH4-acetate at pH 7 ** 1:1 soil-water *** 1:1 soil-KCl solution (1 N).
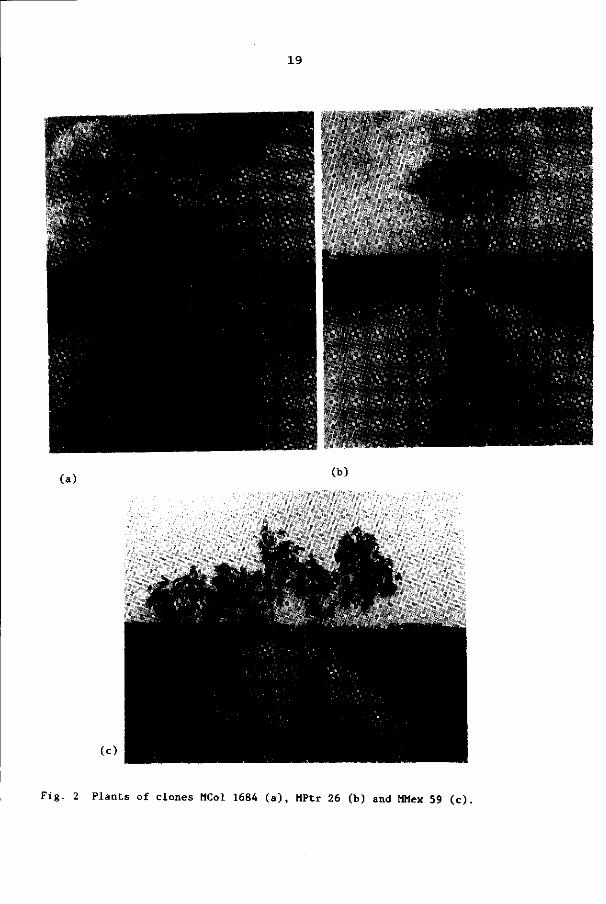
In all field experiments the clones MCol 1684 and MPtr 26 were
used. MCol 1684 (Fig. 2a) was selected for its reported excellent
yielding ability at different locations and its high harvest index.
It is regarded as the best among all germ plasm accessions in terms
of yield and wide adaptability (Kawano et al., 1978; CIAT, 1980).
MCol 1684 was originally collected by the ICA (Instituto Colombiano
Agropecuario) from the Leticia area, the southernmost area of Colom
bia (see Fig. 1), a tropical lowland region, with a mean temperature
above 25°C, a high annual rainfall (above 2000 mm) without a pro
nounced dry season, and a constant high relative humidity (CIAT,
1980).
In order to obtain a sufficient diversity of plant types the fol
lowing clones were also selected:
MPtr 26 (Fig. 2b): A late branching clone which was originally
collected in Puerto Rico, but which is very similar to clones such
as MVen 218 from Venezuela and MMex 11 from Mexico. MCol 22 was used
in three experiments (experiment 1, 2 and 4). MVen 77 was used in
experiments 1 and 2. MMex 59 and MCol 638, both used in experiment 3,
complete the list of clones used in the field experiments. MCol 22
was collected in the north coast area of Colombia, a region with a
19
(a) (b)
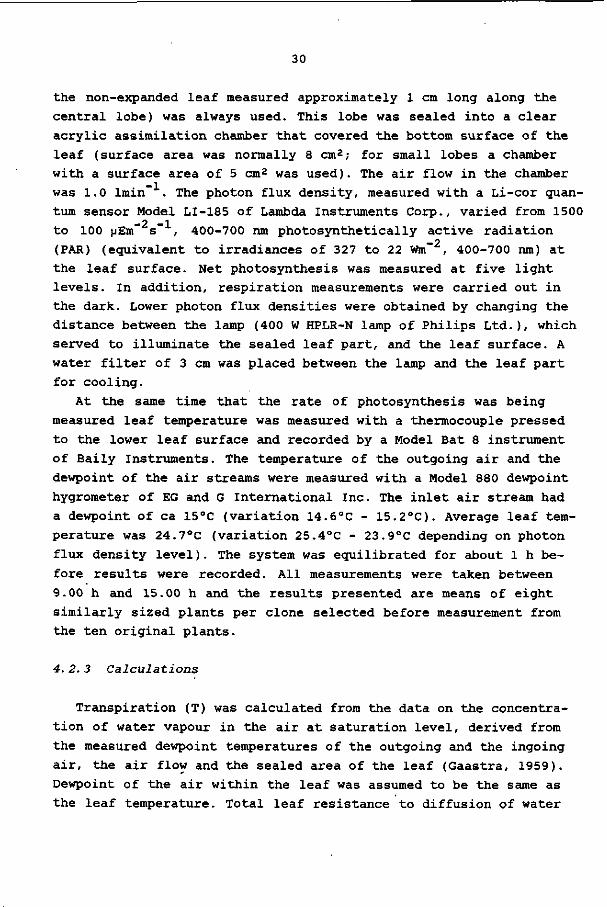
Fig. 2 Plants of clones MCol 1684 (a), MPtr 26 (b) and MMex 59 (c).
20
high average temperature (approx. 28°C), moderate rainfall (700-
1000 mm per year) and a long (3-4 months) dry season. CIAT is doing
research on cassava in this region, at Caribia and Media Luna (for
location see Fig. 1) (Kawano et al., 1978; Toro, 1979). MMex 59
(Fig. 2c) originates from Chiapas, Mexico (average temperature ap
proximately 25°C) (Irikura et al., 1979). Finally, both MVen 77, a
very tall clone, and MCol 638 are well adapted to the high stress
conditions prevailing in the Carimagua experimental station in the
Llanos Orientales of Colombia (see Fig. 1) (Toro, 1979).
3.3 CULTURAL PRACTICES
In each experiment, cuttings approximately 20 cm long (diameter
circa 2 cm), were used.
The selected cuttings were treated by immersing them for 10 min
utes in a mixture of Dithane M-45 (222 g) and Manzate 80 (125 g) per
100 1 water (according to Lozano et al., 1977) plus zinc sulphate,
2 kg/100 1 water (as recommended by Howeler, 1978).
The cuttings were planted at a slant (45°), about 15-18 cm deep
and spaced 1 m x 1 m on ridges. Just after planting 100 kg.ha of N,
P205 and K20 in the form of NPK 15-15-15 composite fertilizer was
applied in bands. Weeds were controlled chemically 2-4 days after
planting by spraying with a mixture of Karmex (diuron 80% a.i.) and
Lasso (alachlor 43% a.i.) in water, at a rate of 1.0 kg and 2.5 1
commercial product, respectively, per hectare, as recommended by Doll
and Piedrahita (1976). During most experiments two or three com
plementary hand weedings were usually performed for good weed control.
Irrigation by gravity was applied if necessary during dry periods.
After sprouting only one shoot was allowed to develop from each
planted cutting, to standardize the basic plant form. Extra shoots
were removed as they appeared. Failed cuttings were replaced 3-4
weeks after planting with plants of the same age that had been
planted in polyethylene bags. It has been shown that this replacement
technique does not affect the storage root yield (CIAT, 1980).
The total growth period of cassava in these experiments varied
from 6 to 12 months, depending on the purpose of the specific ex
periment.
21
3.4 EXPERIMENTAL DESIGN, NUMBER OF BORDER ROWS AND SAMPLE PLANTS
All field experiments were laid out as a randomized complete block
design, replicated four times. In all cases sample plants were sur
rounded on all sides by two border rows of plants of the same clone.
A design with two border rows was chosen, because it had been shown
(CIAT, 1974), (though for only one clone) that storage root yield of
sample plants surrounded by two border rows did not differ from the
yield of sample plants surrounded by three border rows and that, in
contrast the yield of sample plants from plots with only one border
row differed markedly from the yield of those with two border rows
(CIAT, 1974). From a study with different clones with different plant
types and planted at different sites (CIAT, 1980) it was concluded
that for ascertaining yield, it is sufficient to have only one border
row. Thus in the present study is wat decided that two border rows
would be sufficient to give a realistic estimate of the storage root
yield.
The sample size was six plants per plot in the plots harvested
early in the growth period, but was otherwise 9 or 12 plants per
plot.
3.5 MEASUREMENTS OF THE GROWTH PROCESS
A number of measurements were carried out on the plants in the
plots that had been earmarked (by being roped off) for the last
harvest.
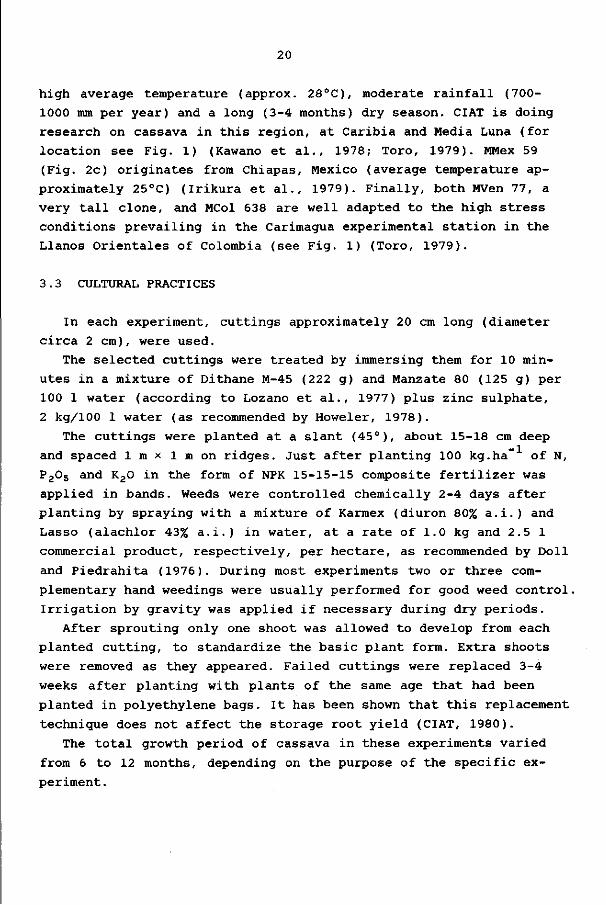
3. 5.1 Plant height, leaf formation rate, branching pattern
Plant height, number of new-formed leaves on one apex, number of
nodes and time taken to produce branching points (Fig. 3), number of
active apices and number of fallen leaves on one apex were measured
and/or calculated at regular intervals, depending on the particular
experiment. The number of fallen leaves was obtained by counting the
number of bare nodes on one apex. Plant height was measured from
soil surface to the general height of the canopy. All these measure
ments were carried out on all sample plants.
22
Fig. 3 Inflorescence of cassava with three branches at the branch level.
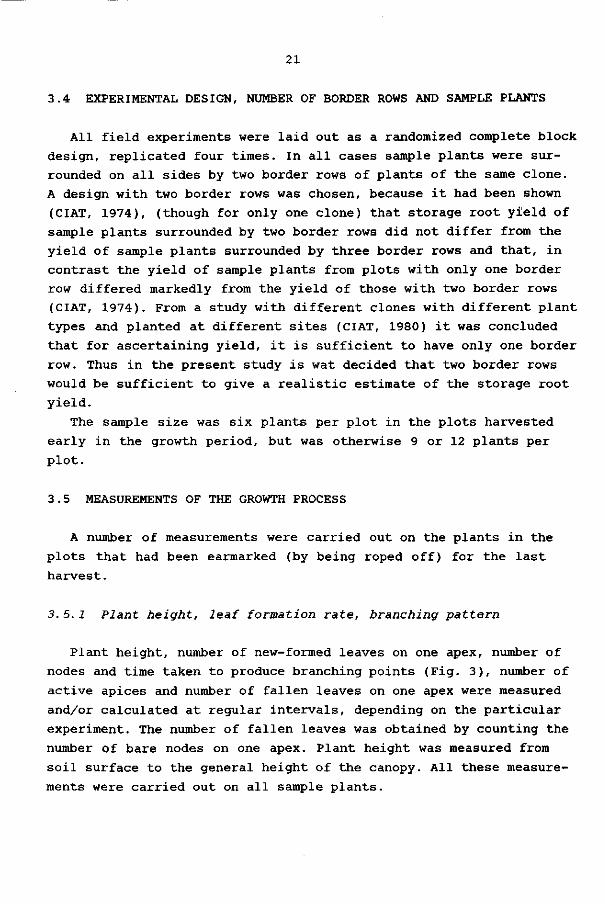
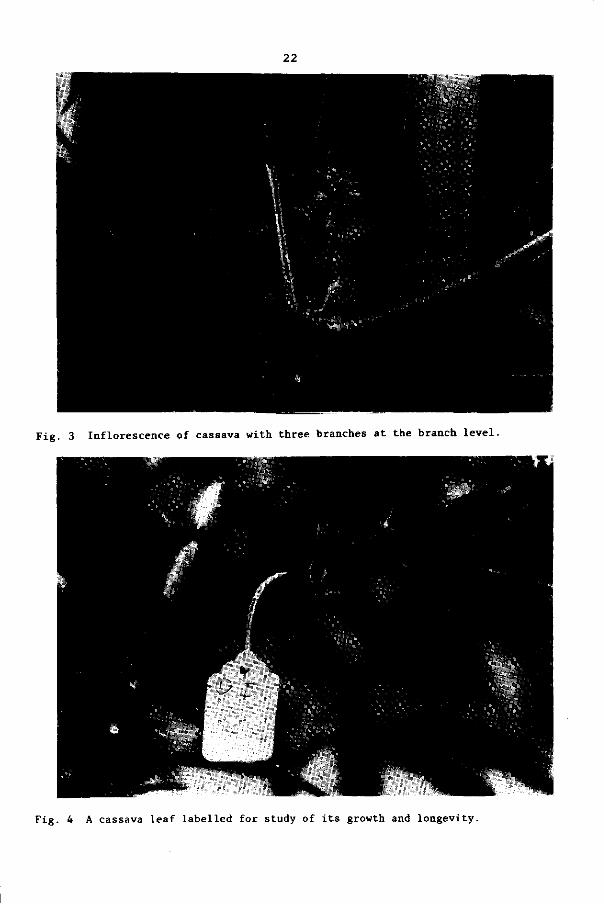
Fig. 4 A cassava leaf labelled for study of its growth and longevity.

23
3. 5.2 Leaf life
Regularly (generally once monthly) one of the youngest leaves
(not unfolded, length approximately 1 cm) per plant of all sample
plants was tagged with a label on which the clone, plant number,
date of labelling and replication number were coded (Fig. 4). The
tagged leaves that had fallen were collected every week, enabling
the life of individual leaves formed at different plant ages to be
calculated.
3.5.3 Leaf size
For two experiments (experiments 1 and 2) the average leaf size
was calculated from data on total leaf area per plant and total num
ber of leaves per plant.
In experiment 3 individual leaf sizes were estimated by regres
sion equations giving the relationship between the length of the
central lobe and the individual leaf area. This relationship was
introduced by Chew and Tan (1969), who compared several non-de
structive methods, all based on linear measurements, for rapidly
estimating the area of individual leaves of cassava. Of the methods
they studied, the measurement of the length of the central lobe,
which correlated well with the leaf area, was the most convenient.
Hammer (1980) also concluded that the length of the central lobe is
a good parameter for estimating the individual leaf area.
The general regression equation is :
y = a*x or In y = aj + bj In x
where
y = leaf area (cm2)
x = length of the central lobe (cm)
a and b = constants, dependent on the clone.
The constants a and b were calculated for each clone. To do this,
112 leaves were collected per clone, to represent the range of cen
tral lobe lengths of fully expanded leaves present in the sample
plants. The areas of these individual leaves were measured with an
24
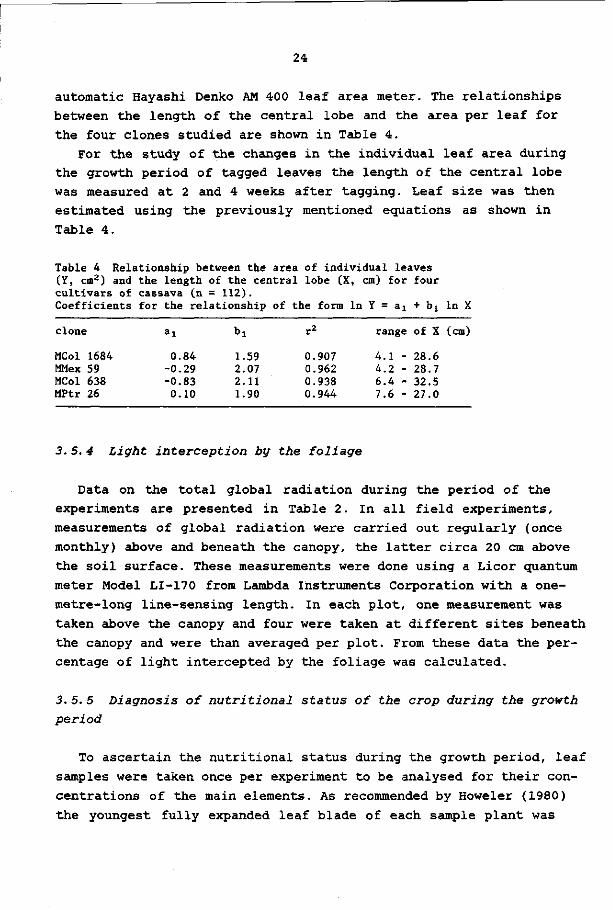
automatic Hayashi Denko AM 400 leaf area meter. The relationships
between the length of the central lobe and the area per leaf for
the four clones studied are shown in Table 4.
For the study of the changes in the individual leaf area during
the growth period of tagged leaves the length of the central lobe
was measured at 2 and 4 weeks after tagging. Leaf size was then
estimated using the previously mentioned equations as shown in
Table 4.
Table 4 Relationship between the area of individual leaves (Y, cm2) and the length of the central lobe (X, cm) for four cultivars of cassava (n = 112). Coefficients for the relationship of the form l n Y = a 1 + b 1 l n X
clone
MCol 1684 MMex 59 MCol 638 MPtr 26
ai
0.84 -0.29 -0.83 0.10
bi
1.59 2.07 2.11 1.90
r2
0.907 0.962 0.938 0.944
range of X (cm)
4.1 - 28.6 4.2 - 28.7 6.4 - 32.5 7.6 - 27.0
3.5.4 Light interception by the foliage
Data on the total global radiation during the period of the
experiments are presented in Table 2. In all field experiments,
measurements of global radiation were carried out regularly (once
monthly) above and beneath the canopy, the latter circa 20 cm above
the soil surface. These measurements were done using a Licor quantum
meter Model LI-170 from Lambda Instruments Corporation with a one-
metre-long line-sensing length. In each plot, one measurement was
taken above the canopy and four were taken at different sites beneath
the canopy and were than averaged per plot. From these data the per
centage of light intercepted by the foliage was calculated.
3.5.5 Diagnosis of nutritional status of the crop during the growth
period
To ascertain the nutritional status during the growth period, leaf
samples were taken once per experiment to be analysed for their con
centrations of the main elements. As recommended by Howeler (1980)
the youngest fully expanded leaf blade of each sample plant was
25
harvested for this analysis. The harvested leaves were bulked per
plot. Samples were dried at 70-80°C until constant weight and then
ground to pass through a 40 p screen in a Wiley laboratory mill.
The analyses were carried out at the CIAT Chemical Laboratory;
samples were analysed for N, P, K, Ca and Mg.
3.5. 6 Fallen leaves
At weekly intervals all the leaves that had fallen in the plots
marked by cord were collected and dried in a forced-draught oven at
70-80°C until constant weight and then weighed. These data, together
with data from the standing crop were used for calculating of the
total dry matter production and the real pattern of distribution of
the assimilates over the different plant parts. Fallen leaves were
collected in all field experiments.
3. 5. 7 Fresh and dry weights
In the different experiments sample plants (6 to 12 per plot)
were harvested periodically. These plants were separated into leaves,
stems, original stem cuttings, storage roots and roots, and bulked
per plot. The fresh weight of the storage roots was measured. The
different plant parts (stems, cuttings and storage roots) were chop
ped into small pieces and then dried in a forced-draught oven at
70-80°c until constant weight before dry weight was determined.
3. 5.8 Total leaf area
At each harvest a subsample of three leaves per plant was taken
for leaf area measurements. To obtain a sample as representative as
possible, the leaf column was arbitrarily stratified into three
parts, top, middle and base, and one leaf was taken from each sec
tion. The leaves were bulked per plot and then divided into leaf
blades and petioles. The leaf blade area was measured with an
automatic Hayashi Denko AM 400 leaf area meter, after which the
leaves (leaf blades plus petioles) were dried and weighed. Using
these data and the total leaf dry weight of the standing crop per
plot, the leaf area in m2 per m2 ground area, i.e. the leaf area

26
index (LAI), was calculated.
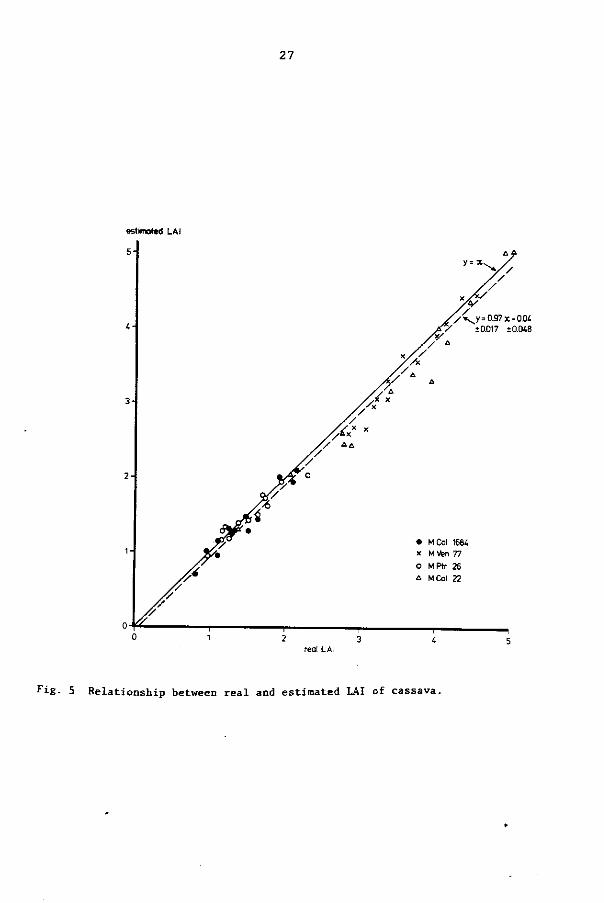
The estimated leaf area indices showed a very good correlation
with the real leaf area indices. In an associated study the results
of these two methods for determination of LAI were compared. To as
certain the real leaf area index for 52 plants (4 clones, 13 plants
each, plant age 4 months) the total leaf area per plant was measured.
This was very laborious. To ascertain the accuracy of the estimated
LAI, sampling was carried out as described before, based on the area
and the dry weight of three leaves per plant and total leaf dry
weight per plant. The relationship between real and calculated LAI
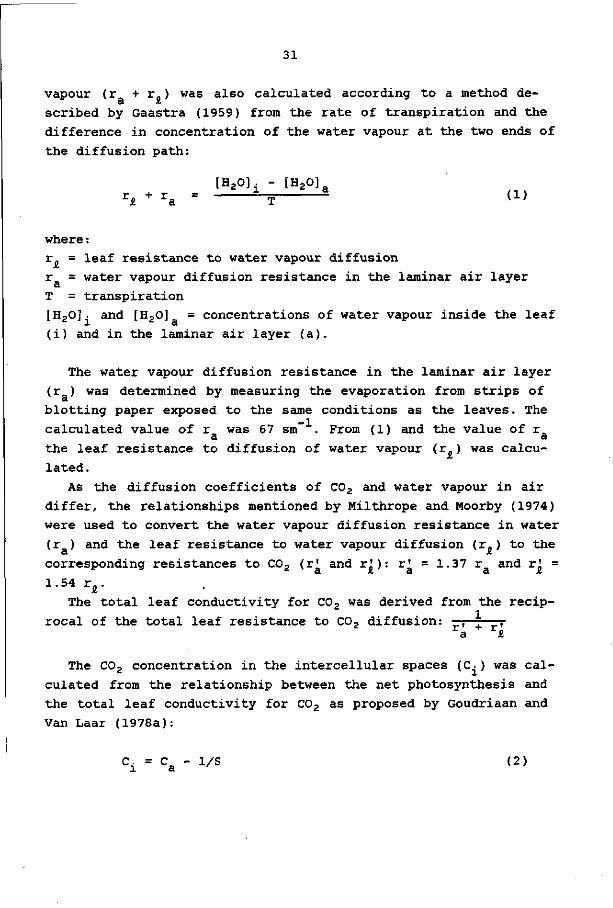
(Fig. 5) did not differ significantly (p = 0.05) from y = x. There
fore, in all harvests, the short-cut method for ascertaining the leaf
area was used, without any correction.
3. 5. 9 Number of storage roots
In one experiment (experiment 1) the number of storage roots per
plant was measured from 4 months after planting onwards. A root was
considered to be a storage root if it was at least 1 cm thick.
27
estimated LAI
5 -
V ' / V = 0.97 x- 0.04
y î 0.017 i 0.048
• M Col 1684
x M Ven 77
O M Ptr 26
û M Col 22
Fig. 5 Relationship between real and estimated LAI of cassava.
28
4 PHOTOSYNTHESIS, TRANSPIRATION, WATER USE EFFICIENCY AND LEAF AND
MESOPHYLL RESISTANCE OF CASSAVA AS INFLUENCED BY LIGHT INTENSITY
4.1 INTRODUCTION
One of the main physiological determinants of the yield of a crop
is the rate of photosynthesis per unit leaf area. Several authors
(Moss and Musgrave, 1971; Loomis et al., 1971) have suggested im
proving the photosynthetic efficiency by seeking genetic variation
in photosynthetic rates among species and cultivars, and by using
genotypes with superior photosynthetic capacity in breeding program
mes - when heritability of photosynthetic rates is sufficiently
large. Considerable differences between cultivars in photosynthetic
rate per unit leaf area have been reported for a number of plant
species (e.g. Zelitch, 1971).
Until recently no data were available on the photosynthesis of
cassava and most other tropical root crops. Only for sweet potato
had studies on the C02 exchange rate been carried out (Tsuno and
Fujise, 1965).
In their publication on the productivity of root crops Loomis
and Rapoport (1977) stated that 'it would be helpful if more in
formation on the photosynthetic capabilities of the root crop spe
cies were available. Response functions to temperature, light and
C02 concentration and their variations are needed'. Research on
this was already in progress when they wrote those words. In 1976
research on the photosynthetic rates of some clones of cassava at
different light intensities was started at CIAT by Cock (CIAT, 1977).
Moreover, a group of researchers at the University of Guelph, Canada,
started similar research on cassava. The first data on the photo
synthesis of attached leaves of cassava were published by Mahon et
al. (1976). Using plants grown under controlled environmental con
ditions, Mahon et al. ( 1977a,b) studied the variation in the rate
of photosynthesis of cassava clones and related species of Manihot,
and the effects of the environment on photosynthesis, transpiration,
and leaf resistance and residual resistance.
29
The purpose of the research reported in this chapter was to study
leaf photosynthesis, transpiration, water use efficiency and resis
tance to water vapour and C02 diffusion of four cassava clones, grown
outdoors at CIAT, Cali, Colombia, as part of a larger study to as
certain the basic differences between these clones. As mentioned in
the preceding chapter, one of the clones used was MCol 1684, which
is considered to be the best accessions in the CIAT cassava germ
plasm bank (Kawano et al., 1978; CIAT, 1980).
4.2 MATERIAL AND METHODS
4. 2.1 Plant material and growth conditions
Stem cuttings approximately 20 cm long, of four clones (MCol 1684,
MVen 77, MPtr 26 and MCol 22) were planted vertically on July 17,
1979, in polythene pots (diameter 25 cm, height 26 cm) filled with
a mixture of peat and sand (1:1 v/v). Two cuttings were planted per
pot and there were ten pots per clone. After sprouting, i.e.2-3
weeks after planting, in each pot the weaker of the two plants was
removed and all shoots but one were removed from the remaining cut
tings. Then 6 g of NPK 14-14-14 composite fertilizer was added per
pot. The plants were sprayed against thrips and spider mite regular
ly. Pots were watered daily. Fertilizing was repeated at 4 weeks
after planting. The plants were grown in the open at natural day-
length at CIAT near Cali, Colombia. Data on photosynthesis and other
parameters were recorded in the period 20-30 August 1979 (35-45 days
after planting). Meteorological data for the growing period have been
presented in Table 2. For the measurements the experimental plants
were moved to a temperature-controlled (25°C) laboratory room.
4. 2. 2 Gas exchange measurements
Photosynthesis by attached leaf parts was measured by a series
225 MK 11 open circuit infrared gas analyser of the Analytical De
velopment Company, calibrated with standard bottled gas. It was
measured in the differential mode and at ambient C02 concentration -3 -3 (340 vppm or 0.622 x 10 kgm ). For this measurement the central
lobe of the first fully grown leaf (age 14 days from the moment that
30
the non-expanded leaf measured approximately 1 cm long along the
central lobe) was always used. This lobe was sealed into a clear
acrylic assimilation chamber that covered the bottom surface of the
leaf (surface area was normally 8 cm2; for small lobes a chamber
with a surface area of 5 cm2 was used). The air flow in the chamber
was 1.0 lmin" . The photon flux density, measured with a Li-cor quan
tum sensor Model LI-185 of Lambda Instruments Corp., varied from 1500 -2-1 to 100 pEm s , 400-700 nm photosynthetically active radiation
_2 (PAR) (equivalent to irradiances of 327 to 22 Wm , 400-700 nm) at
the leaf surface. Net photosynthesis was measured at five light
levels. In addition, respiration measurements were carried out in
the dark. Lower photon flux densities were obtained by changing the
distance between the lamp (400 W HPLR-N lamp of Philips Ltd.), which
served to illuminate the sealed leaf part, and the leaf surface. A
water filter of 3 cm was placed between the lamp and the leaf part
for cooling.
At the same time that the rate of photosynthesis was being
measured leaf temperature was measured with a thermocouple pressed
to the lower leaf surface and recorded by a Model Bat 8 instrument
of Baily Instruments. The temperature of the outgoing air and the
dewpoint of the air streams were measured with a Model 880 dewpoint
hygrometer of EG and G International Inc. The inlet air stream had
a dewpoint of ca 15°C (variation 14.6°C - 15.2°C). Average leaf tem
perature was 24.7°C (variation 25.4°C - 23.9°C depending on photon
flux density level). The system was equilibrated for about 1 h be
fore results were recorded. All measurements were taken between
9.00 h and 15.00 h and the results presented are means of eight
similarly sized plants per clone selected before measurement from
the ten original plants.
4. 2. 3 Calculations
Transpiration (T) was calculated from the data on the concentra
tion of water vapour in the air at saturation level, derived from
the measured dewpoint temperatures of the outgoing and the ingoing
air, the air flow and the sealed area of the leaf (Gaastra, 1959).
Dewpoint of the air within the leaf was assumed to be the same as
the leaf temperature. Total leaf resistance to diffusion of water
31
vapour (r + r. ) was also calculated according to a method de-
scribed by Gaastra (1959) from the rate of transpiration and the
difference in concentration of the water vapour at the two ends of
the diffusion path:
[H20], - [H20] r* + ra » H <*>
where :
r. = leaf resistance to water vapour diffusion
r = water vapour diffusion resistance in the laminar air layer
T = transpiration
[H20]. and [H20] = concentrations of water vapour inside the leaf
(i) and in the laminar air layer (a).
The water vapour diffusion resistance in the laminar air layer
(r_) was determined by measuring the evaporation from strips of
blotting paper exposed to the same conditions as the leaves. The
calculated value of r was 67 sm" . From (1) and the value of r a â
the leaf resistance to diffusion of water vapour (r.) was calcu
lated.
As the diffusion coefficients of C02 and water vapour in air
differ, the relationships mentioned by Milthrope and Moorby (1974)
were used to convert the water vapour diffusion resistance in water
(r_) and the leaf resistance to water vapour diffusion (r„) to the 3 iL
corresponding resistances to C02 (r' and r'): r' = 1.37 r and r' =
1.54 r£.
The total leaf conductivity for C02 was derived from the recip
rocal of the total leaf resistance to C02 diffusion: —;— , ra £
The C02 concentration in the intercellular spaces (C.) was cal
culated from the relationship between the net photosynthesis and
the total leaf conductivity for C02 as proposed by Goudriaan and
Van Laar (1978a):
C. = C - 1/S (2) 1 a.

32
where S = slope of the relation between P and , ra + ri
and C = ambient C02 concentration (340 vppm).
Gross photosynthesis (P ) was calculated by summing the P and dark respiration of the leaf (R):
Pg = P n + R (3)
The relationship between photon flux density (H) and gross photosynthesis was described according to Goudriaan and Van Laar (1978b), i.e. with an asymptotic exponential equation:
P g = Pg,max d " e " Sî x H ) (4)
H = photon flux density incoming visible light p „ m=v = maximum rate of photosynthesis at light saturation HH = level of H required to reach half the light saturation
level.
The efficiency of the use of light at low light intensity (a) is P
represented by the ratio . Jl'Jt^ tro- It is assumed that 80% of the incoming visible light is absorbed.
The mesophyll resistance ( r ) was calculated from:
P n » <Ci "Cchl>/rm <5>
C ., = C02 concentration at the chloroplast level (C02 compensation point). Mahon et al. (1977a) reported a C02 compensation point of 68 vppm for cassava. This value was used in (5) to calculate r . Water use efficiency was ascertained from the ratio of net leaf photosynthesis (P ) to transpiration (T). The greater the ratio the more efficient a clone is in water use.
33
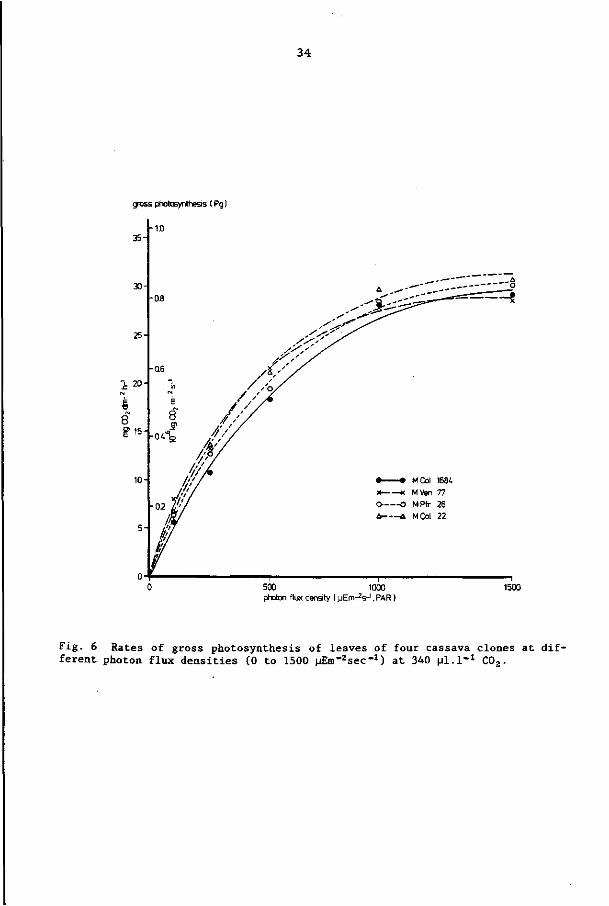
4.3 RESULTS
4. 3.1 Effect of light intensity on photosynthesis
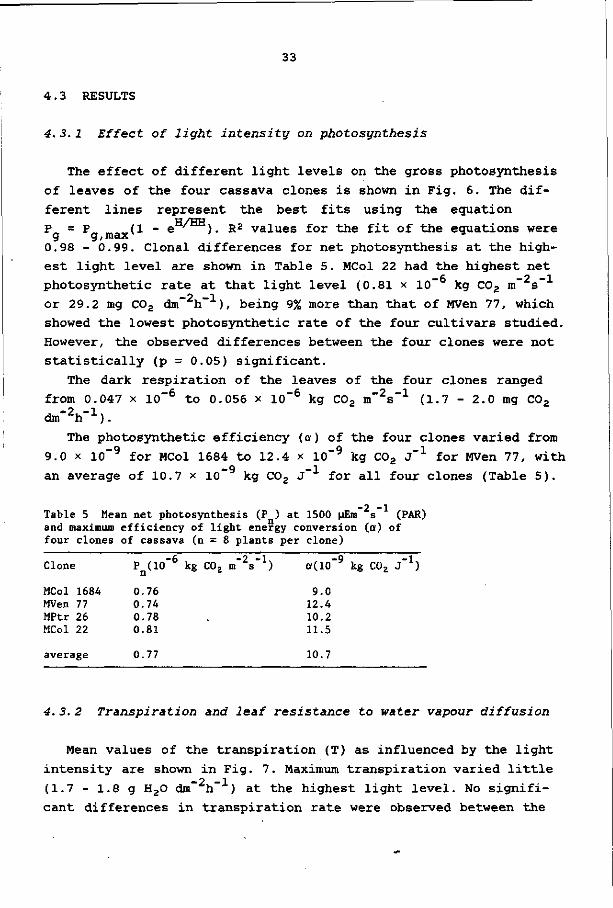
The effect of different light levels on the gross photosynthesis
of leaves of the four cassava clones is shown in Fig. 6. The dif
ferent lines represent the best fits using the equation
P = P (1 - e ' ). R2 values for the fit of the equations were g g,max 0.98 - 0.99. Clonal differences for net photosynthesis at the high
est light level are shown in Table 5. MCol 22 had the highest net —6 —y —l
photosynthetic rate at that light level (0.81 x 10 kg C02 m s -2 -l .
or 29.2 mg C02 dm h ), being 9% more than that of MVen 77, which
showed the lowest photosynthetic rate of the four cultivars studied.
However, the observed differences between the four clones were not
statistically (p = 0.05) significant.
The dark respiration of the leaves of the four clones ranged
from 0.047 x 10~6 to 0.056 x 10 - 6 kg C02 m" 2 s - 1 (1.7 - 2.0 mg C02
dm~ 2 h _ 1 ).
The photosynthetic efficiency (a) of the four clones varied from
9.0 x io"9 for MCol 1684 to 12.4 x 10~9 kg C02 J-1 for MVen 77, with
-9 -1 an average of 10.7 x io kg C02 J for all four clones (Table 5).
-2 -1 Table 5 Mean net photosynthesis (P ) at 1500 ME™ S (PAR) and maximum efficiency of light energy conversion (a) of four clones of cassava (n = 8 plants per clone)
Clone P (IO-6 kg C02 m"2s"1) a(10~9 kg C02 J-1)
9.0 12.4 10.2 11.5
10.7
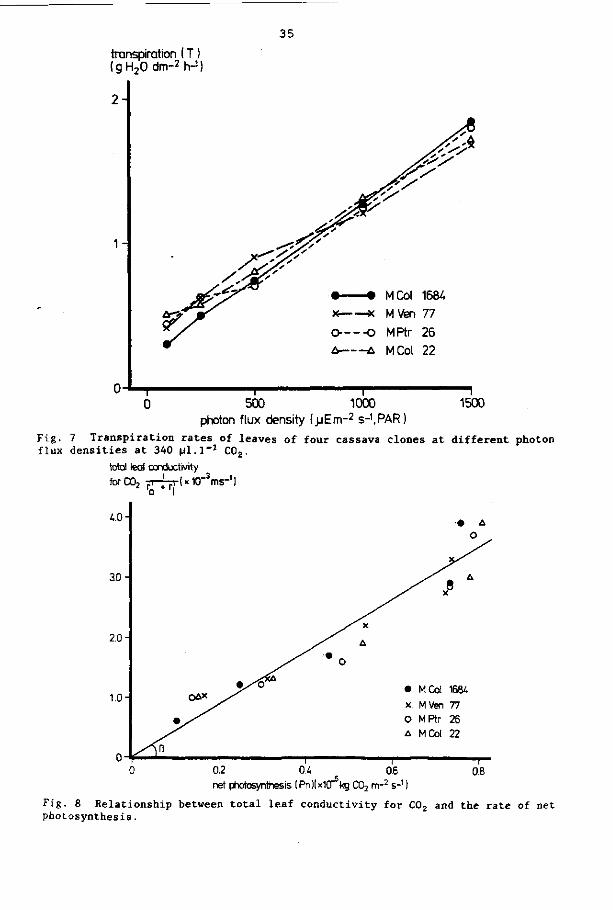
4. 3. 2 Transpiration and leaf resistance to water vapour diffusion
Mean values of the transpiration (T) as influenced by the light
MCol 1684 MVen 77 MPtr 26 MCol 22
average
0 0 0 0
0
76 74 78 81
77
intensity are shown in Fig. 7. Maximum transpiration varied little
(1.7 - 1.8 g H20 dm"2h-1) at the highest light level. No signifi
cant differences in transpiration rate were observed between the
34
gross photosynthesis ( Pg I
-1.0
M Col 1684 x K M\fen 77
O O MPtr 26 a a MCol 22
500 1000 photon flux density ( j jEm^s-1 , PAR )
1500
Fig. 6 Rates of gross photosynthesis of leaves of four cassava clones at different photon flux densities (0 to 1500 MEm^sec"1) at 340 pi.!"1 C02.
35
transpiration ( T ) (g^Odm-Zh-1)
2 -
0-
• M Col 168/. x x M Ven 11 O—--O MPtr 26 a ù. M Col 22
0 T
1500 500 1000 photon flux density (jjEm-2 s-1,PAR )
Fig. 7 Transpiration rates of leaves of four cassava clones at different photon flux densities at 340 pl.l"1 C02.
total leaf conductivity
X
A
• M Col 1684
x MVen 77
O MPtr 26
A M Col 22
0.2 CK 06
net photosynthesis (PnlUlCT6kg C02 m-2 s-1 )
0.8
Fig. 8 Relationship between total leaf conductivity for C02 and the rate of net photosynthesis.
36
four clones.
Leaf resistance to water vapour diffusion varied from 110 -
) sm~ at a pt
different clones
-l -2 -1 140 sm at a photon flux density of 1500 pEm s (PAR) for the
4.3.3 Total leaf conductivity for COz, leaf resistance to C02 diffusion, mesophyll resistance and water use efficiency
The relation between the total leaf conductivity (1/r' + r|) and
the net photosynthesis is presented in Fig. 8: it is a linear re
lation (R2 = 0.98), indicating that the C02 concentration in the
intercellular spaces remained approximately constant. The average -3 -3
i n t e r na l C02 concentra t ion (C.) was 212 vppm (0.387 x 10 kgm ) . The mesophyll r e s i s t ance did not vary much for the four clones
a t a photon f lux dens i ty of 1500 pEm"2s"1 (PAR) (Table 6 ) . In Table 6 the values of l eaf r e s i s t ance to C02 d i f fus ion ( r ! ) a re a lso shown. For a l l four clones the mesophyll r e s i s t ance was higher than the l eaf r e s i s t ance to C02. Differences in water use e f f i c i en cy of the four clones were smal l . MCol 22 was the most e f f i c i e n t in water use (Table 6 ) .
Table 6 Leaf r e s i s t ance to C02 d i f fus ion ( r ' ) , mesophyll r e s i s t ance ( r ) and water„use e f f i c iency (WUÉ) a t a photon flux dens i ty of 1500 pEm s (PAR) for four clones of c as sava (n = 8 p l an t s per clone)
WUE (mg C02/g H20) Clone
MCol 1684 MVen 77 MPtr 26 MCol 22
r^ (sm )
170 220 180 170
r (sm m
340 350 330 320
-1) WUE
15.1 15.6 15.7 17.1
4.4 DISCUSSION AND CONCLUSIONS
A relatively low photon flux density was required for light sat
uration of the photosynthetic rate (Fig. 6). Furthermore, Mahon et
al. (1977a) reported a C02 compensation point of 68 vppm for cassava.
Both of these characteristics are typical of a plant species that
has a C3 type of photosynthesis.
37
Because at a certain site under optimal growing conditions the
maximum leaf photosynthesis (P __„) and the light efficiency at ri f in 3.x
low intensities (a) are very important variables affecting dry
matter production (De Wit, 1965; Goudriaan and Van Laar, 1978b)
clones must be compared for these two characteristics at least. No
significant clonal differences in maximum rate of leaf photosynthesis
were observed between the four clones used in this study (Table 5).
Mahon et al. (1977b), however, when testing a large number of
clones and species belonging to the genus Manihot, observed large
differences. In the present experiment, the measured maximum values -2 -1 of the rate of net leaf photosynthesis (27.7 to 29.2 mg C02 dm h )
were in the range as reported by Mahon et al. (1977a), and are nor
mal values for C3 plants (De Wit et al., 1979). Recently, Palta
(1982) reported similar net photosynthetic rates at high light
levels. As in the present study, MCol 22 showed the highest rate -2 -1 among the clones used at a light level of 1500 pEm s . Also the
calculated values for the initial light use efficiency (a) (C02 ab
sorption per unit intercepted, absorbed radiation) found in the pre--9 -9 -1
sent study (9.0 x io to 12.4 « 10 kg C02 J ) are similar to
values reported for several other C3 crops, e.g. cotton (Constable
and Rawson, 1980), although in other crops (e.g. tomato (Peat, 1970)
and wheat (Planchon, 1979)) somewhat lower efficiencies have been
found. Acock et al. (1971) reported a range for a of 7.4 - 20.3 x -9 -1 10 kg C02 J for large number of plant species. -2 -1 At a high light level (1500 pEm s ) the values of the meso-
phyll resistance to C02 diffusion (r ) were larger than those of
the leaf resistance to C02 diffusion (rj), indicating that r is
the dominant resistance to C02 diffusion into the leaf, as has also
been found for a number of other C3 crops (Aslam et al., 1977).
A constant C02 concentration of approximately 212 vppm was found
in the intercellular spaces of cassava leaves, independent of the
light level. For other crops, too, a stabilization of the internal
C02 concentration has been reported, as e.g. for cotton (Constable
and Rawson, 1980), beans and maize (Goudriaan and Van Laar, 1978b).
In the cases where a stable C02 concentration in the cavity of
the stomata has been reported, this was about 210 vppm for C3 crops
and 120 vppm for C4 crops (De Wit et al., 1979), signifying that for
a C3 crop like cassava the transpiration coefficient (mg H20 trans-

38
pired per mg C02 assimilated) will be about double that of a C4
crop, both at low and high irradiances (De Wit et al., 1978). Under
conditions in which water is limited, stabilization of the internal
C02 concentration is a desirable property. De Wit et al. (1978)
showed that such a stabilization leads to a reduction of up to 50%
in potential transpiration, compared with a situation where stomata
remain open and the internal and ambient C02 concentration are more
or less equal. In this study, and also in the study reported by
Palta (1982), MCol 22 had the most efficient water use of the clones
studied. An efficient water use is crucial for a crop such as cas
sava, which is quite often cultivated under stress conditions such
as water stress (Cock, 1979; Hahn et al., 1979). However, in a field
study a large negative effect on dry matter yield was found for
MCol 22 plants when submitted to water stress during part of the
growing season (Connor et al., 1981). When screening cassava cul-
tivars for efficient water use, laboratory research has to be com
plemented by field testing of clones under water-stress conditions.
39
5 INTERRELATIONSHIPS BETWEEN LAI, LIGHT INTERCEPTION AND TOTAL DRY
MATTER YIELD OF CASSAVA
5.1 INTRODUCTION
For many years, the analysis of the growth and yield of crops was
based on the magnitude of the leaf area per unit ground area - the
leaf area index (LAI) - and the net assimilation rate - the rate of
dry matter production per unit leaf area (Watson, 1952).
For cassava, several authors have suggested that variations in
yield were possibly caused by differences in leaf area or leaf area
duration (Doku, 1965; Sinha and Nair, 1971; Enyi, 1972b,c; Cock,
1976; Cock et al., 1979).
More recently, attention has been focussed on the relationships
between the amount of incoming radiation intercepted by the canopy
of a crop and the dry matter production (Monteith, 1977).
In this chapter, first the results of a study on the relation
between the LAI and the percentage of light interception by the
crop canopy are reported; this is followed by a report of an in
vestigation on the relationships between the cumulative intercepted
radiation and the total dry matter yield for different clones of
cassava.
5.2 MATERIALS AND METHODS
For meteorological data and some general experimental procedures
that were used in this study, see Chapter 3, in which the harvest
procedure, yield determination, procedure for calculating the LAI
and the light interception by the canopy were also described.
Three experiments were conducted. The clones MCol 1684 and
MPtr 26 were used in all three experiments, MVen 77 and MCol 22 in
experiment 1 and 2, while MMex 59 and MCol 638 were planted in ex
periment 3.
Experiment 1 Planting was done on 15 December 1978. First harvest
took place on 15 February 1979 (62 days after planting (DAP)). Sue-
40
cessive harvests followed on 17 April 1979 (123 DAP), 18 June
(185 DAP), 13 August (241 DAP), 15 October (304 DAP) and finally on
12 December 1979 (362 DAP). Light measurements were carried out at
62, 90, 123, 151, 185, 213, 241, 279, 304, 335 and 360 DAP. LAI of
the plants was calculated at 62, 123, 185, 241, 304 and 362 DAP.
The energy content of whole plants was ascertained from plants
harvested on 17 April 1979 (123 DAP) and 15 October 1979 (304 DAP).
Dried material from all four clones was used for the analysis of the
four-month-old plants, whereas for the analysis of the energy content
of 10-month-old plants samples of dried matter from MCol 1684 and
MPtr 26 only were used.
On each harvest date twelve plants were sampled per plot.
Experiment 2 Cuttings of the same four clones were planted on
13 July 1979. During the growth period, which was 178 days, sample
plants were harvested on five occasions. Twelve plants were sampled
per plot per harvest. Harvests took place on 30 August 1979 (48 DAP),
24 September (73 DAP), 9 October (88 DAP), 7 November 1979 (117 DAP)
and finally on 7 January 1980. LAI was calculated on the harvest
dates.
Light measurements were carried out at 48, 73, 88, 115, 125, 144
and 178 DAP.
Experiment 3 The cuttings of MCol 1684, MMex 59, MCol 638 and
MPtr 26 were planted on 29 January 1980. These clones were the con
trol treatments of a study on sink-source relationships of cassava.
The complete results have been reported elsewhere (Veltkamp, 1985).
Sample plants were harvested on 13 June 1980 (138 DAP), 30 July
(185 DAP), 29 September (246 DAP) and 25 November 1980 (303 DAP).
For these dates the LAI was also calculated.
Six plants were harvested per plot for the harvests at 138 and
185 DAP, and nine on the other dates.
At 73, 96, 125, 152, 171, 194, 229, 246, 275 and 303 DAP, measure
ments on light interception by the canopy were taken.
The efficiency (E) with which a cassava crop utilized the inter
cepted light for the production of dry matter was calculated for all
41
three experiments according to the method of Hayashi (1966):
v tv\ - a x produced dry weight , n n E U ) - intercepted PAR x 1 0 °
a = energy content of the dry matter produced by cassava plants.
PAR = photosynthetically active radiation
It was assumed that the photosynthetically active radiation (PAR)
is 50% of the total incoming radiation (Cooper, 1976).
The energy content of the dry matter produced by cassava plants
was ascertained as follows: subsamples of dried entire plants were
ground in a Wiley mill to pass through a 40 p screen. The ground
samples were compressed into pellets, to facilitate the combustion
of the material. The energy content of the dry matter was then de
termined in a Parr adiabatic calorimeter from Parr Instrument Com
pany (Moline, Illinois, USA).
The relation between the percentage of light interception and the
LAI was calculated using the equation proposed by Monsi and Saeki
(1953): In (I/I0) = -K-LAI, where I = light received at about 20 cm
above the soil surface, I0 = incoming light just above the crop
canopy, K = extinction coefficient, which gives an indication of
the arrangement of the leaves in a canopy (Cooper, 1976).
5.3 RESULTS
5.3.1 Total dry matter yield
In experiment 1, total dry matter yield - including the dry weight
of the fallen leaves - continued to increase until the last sampling
at 362 DAP (Fig. 9a). Clonal differences in total dry weight were not
significant on any of the six sampling dates.
Fig. 9b shows the pattern of total dry matter yields at differ
ent times after planting for experiment 2. At 178 DAP, MCol 1684,
MVen 77 and MPtr 26 had produced significantly more dry matter than
MCol 22. Total dry matter yields at 178 DAP were considerably lower,
however, than in these clones at about the same age in experiment 1.

42
( a )
120 180 240 days after planting
total dry matter yield and root dry matter yield ( t. ha -1}
experiment 2
total dry matter yields'
MCol 1684 M Ven 77
0 - - - o MPtr 26 . MCol 22
T 60 120
days after planting
(*)
total dry matter yield and root dry matter yield ( t ha~: )
experiment 3
« • MCol 1684 o O M Mex 59 • • MCol 636 o o MPtr 26
180 240 days after planting
(c )
Fig. 9 Total and root dry matter yield of several cassava clones at different times after planting. In this and other graphs vert ical l ines indicate least significant difference (p = 0,05).
43
In experiment 3, MPtr 26, MCol 1684 and MMex 59 produced the
highest amounts of dry matter at 303 DAP (Fig. 9c). Differences
between these clones were not significant. But these three clones
all yielded significantly more than MCol 638. At all four harvests
MCol 638 gave the lowest total dry matter yield. Total dry matter
yields of MCol 1684 and MPtr 26 at an age of six months were inter
mediate between those of experiments 1 and 3.
5.3.2 Light interception by the canopy
Experiment 1 Patterns of percentage light interception by the can
opies of the four clones are shown in Fig. 10a. On the first two
dates on which light measurements were carried out MCol 22 inter
cepted a lower percentage of the incoming PAR than MCol 1684,
MVen 77 and MPtr 26. At 90 DAP the light interception by the canopy
of MCol 22 was 11% to 16% lower than for the other clones. At that
moment MCol 1684 and MPtr 26 had already reached a light intercep
tion level of at least 90%. High light interception levels were
maintained until about 185 DAP. In a dry period from 190 to 210 DAP
the percentages of light interception decreased considerably be
cause of considerable leaf fall in all clones except MCol 22. At
185 DAP, clonal differences in total intercepted PAR were negli
gible (Table 7). The fraction of the incoming PAR intercepted by
the canopies was 0.66 for the period up to 185 DAP, with only small
differences between clones (Table 7).
Experiment 2 Intercepted PAR at 178 DAP varied from 740 MJm for
MCol 22 to 940 MJm'2 for MCol 1684 and MPtr 26. Differences between
MCol 1684, MVen 77 and MPtr 26 were only small. The intercepted PAR
was 56% of the total incoming PAR on average, and ranged from 47%-
61% (Table 7).
Experiment 3 Percentages of light interception at different times
in the growth period of 303 days are shown in Fig. 10b. MCol 638
showed very low percentages of light interception during the first
three months; this could be attributed to the low sprouting percent
age, which made replacement of some cuttings necessary, and to slugs
that attacked cuttings and young plants, damaging bark and buds in
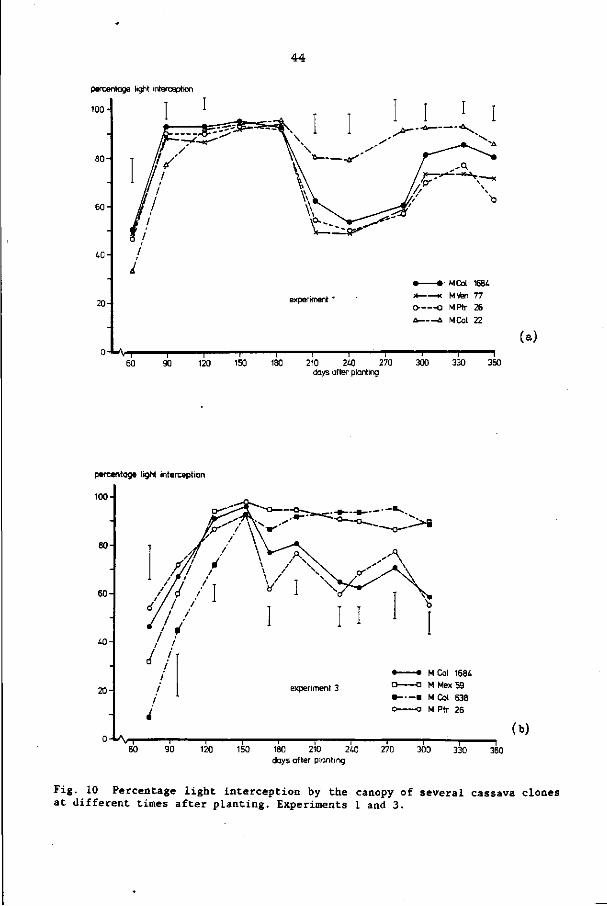
44
percentage light interception
100-
80-
60-
40-
20-
o - H
experiment 1
• • M Col 1684
x x M\fen 77
O- O MPtr 26
û a MCol 22
(a) 1 1 1 1—
60 90 120 150 ~ ~ 180 210 240 270 300 330 360 days after planting
percentage light interception
100-
80-
60
40
20-
o-«A-r
M Col 1684
M Mex59
• • M Col 638
o - — - o M Ptr 26
(b)
60 90 120 150 180 210 240 270 300 330 360 days after planting
Fig. 10 Percentage light interception by the canopy of several cassava clones at different times after planting. Experiments 1 and 3.

45
particular (see also CIAT (1980)). At 152 DAP the light interception
was 90% or more for all four clones. At 125 DAP, MCol 1684, MMex 59
and MPtr 26 had already reached the 90% light interception level.
MCol 638 and MMex 59 maintained high percentages of light intercep
tion until the last harvest at 303 DAP. For MCol 1684 and MPtr 26,
on the other hand, a high percentage of light interception was main
tained for a short period only. The cumulative intercepted PAR at
185 DAP is shown in Table 7. At that time MCol 638 had intercepted -2 -2
only 800 MJm , compared with 1040 to 1080 MJm for the clones MCol 1684, MMex 59 and MPtr 26.
5.3.3 Relationship between percentage of light interception and LAI
LAI data on the clones studied are presented in Chapter 6.
Fig. 11 shows the relationships between the percentage of light
interception and the LAI of the clones in experiment 1. The relation
ships were calculated according to Monsi and Saeki (1953), who sug
gested that the penetration of light down the canopy approximately
followed the law of Lambert-Beer. With this formula good fits were
obtained between the LAI and percentage light interception. The K
values in the formula, being the extinction coefficient, are also
shown in Fig. 11. The high values of K support the observations that
all clones had a canopy with dominantly horizontally-orientated
leaves.
A light interception of 90% was reached at LAI values ranging
from 2.6 (MCol 22) to 3.2 (MVen 77) (Fig. 11).
In experiment 2 the values of K found from the relationships
between LAI and percentage light interception were similar to those
reported for experiment 1.
In experiment 3 the K values for MCol 1684 and MPtr 26 lay in the
range reported for these clones in experiment 1, but the K value of
MMex 59 was 0.68 ± 0.09 and that of MCol 638 was 0.61 ± 0.12. The
leaves of MCol 638 were less horizontal than those of the other
clones.
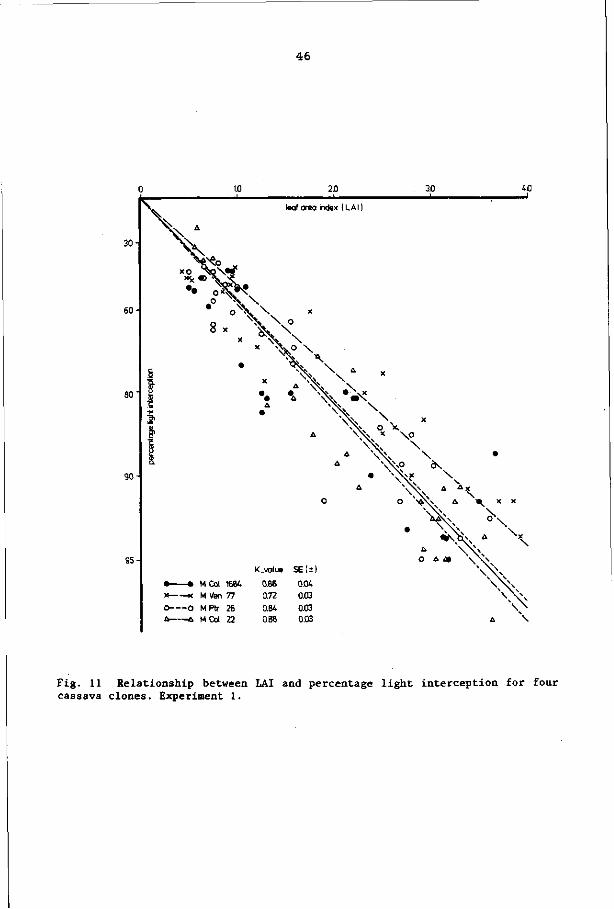
46
0
3 0 -
6 0 -
«r
9 0 -
95-
i 'S.
'S
i & i Î o.
^ \ s "
o -A—
V \ . \ N
X O " x
"•
— X
—o — A
* < ^ o
1.0
^ 0 \ « # • \
0 * 0
• 8
M Col M Ven
MPtr M Col
?*fe.« V s
0 ^
X
X
•
1684 77
26 22
r
\ S. \
X
2ü 3.0 Ui
leaf area index (LAI ]
X
O
\ \
X
% A
•
K.value
0.86
0.72
0.84 0.88
^ \ û X
A \ * » \ vO^ \
\X%. O x.
^ \ X
* \ \ \ »
• ^ X O O ^^A^V. A » X X \ \ \ ^
\X o A m \ \ \
SE(î) V V N
0.04 \ \ \
0.03 \ X 0.03 \ \ 0.03 A \
Fig. 11 Relationship between LAI and percentage light interception for four cassava clones. Experiment 1.

47
5.3.4 Relationship between total dry matter yield and intercepted PAR
In Fig. 12 data on total dry matter yield have been plotted
against the cumulative intercepted PAR, using all data from experi
ment 1. The relationships shown in Fig. 12 are linear for all clones
until approximately six months after planting. There is a close cor
relation between the total dry matter yield and the intercepted PAR.
During the first six months of the growth period dry matter was pro
duced at a rate of 1.34-1.40 g per MJ intercepted PAR. Multiplying
these values by 16.7, which is the average energy content (kJ-g~ )
(Table 8), gives the efficiency of the photosynthetic system (E),
expressed as a percentage (Table 7). These data are shown in Table 7
for the first six months of the growth period of all three experi
ments .
The photosynthetic efficiency of MCol 1684, MVen 77, MPtr 26 and
MCol 22 showed only a small variation between the clones in experi
ment 1, and varied from 2.3% to 2.5% (average 2.4%), based on PAR.
In experiments 2 and 3 average photosynthetic efficiency was lower,
as was the overall efficiency (which is the product of the fraction
of the incoming PAR intercepted by the canopy (f) and the photo
synthetic efficiency (E): see Table 7).
Photosynthetic efficiency was also lower for plants older than
185 days (Fig. 12).

48
total dry matter yield ( t. ha -
32-
24-
16-
M Col 1684
I I I I I I I I 1 I I I I 200 600 1000 1400 1800 2200 2600
intercepted PAR (MJ rrr2)
Fig. 12 Relationship between total dry matter yield and total intercepted PAR for cassava clone MCol 1684. Experiment 1.
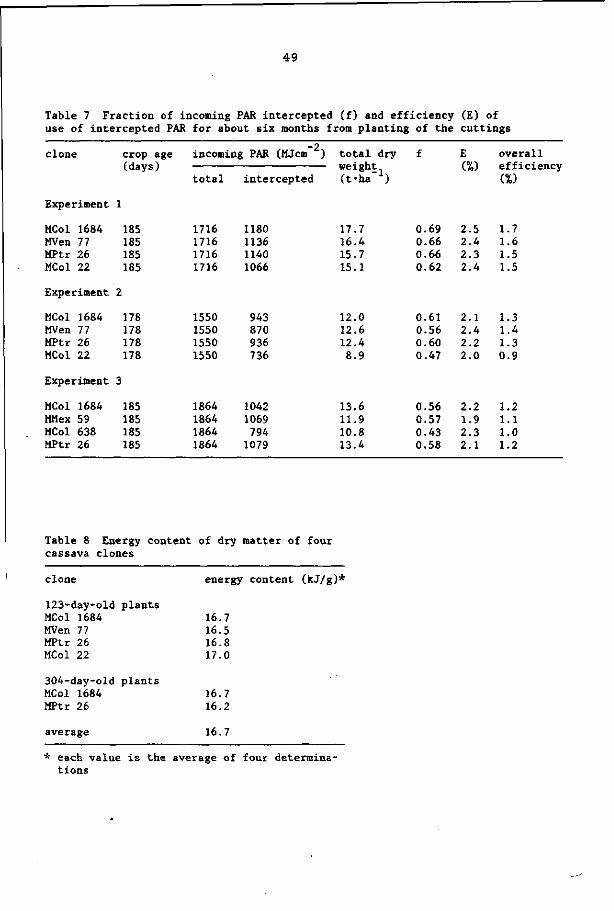
49
Table 7 Fraction of incoming PAR intercepted (f) and efficiency (E) of use of intercepted PAR for about six months from planting of the cuttings
clone
Experiment
MCol 1684 MVen 77 MPtr 26 MCol 22
Experiment
MCol 1684 MVen 77 MPtr 26 MCol 22
MCol 1684 MMex 59 MCol 638 MPtr 26
crop age (days)
1
185 185 185 185
2
178 178 178 178
3
185 185 185 185
incoming PAR
total
1716 1716 1716 1716
1550 1550 1550 1550
1864 1864 1864 1864
(MJcm-2)
intercepted
1180 1136 1140 1066
943 870 936 736
1042 1069 794
1079
total dry weight (fha"1)
17.7 16.4 15.7 15.1
12.0 12.6 12.4 8.9
13.6 11.9 10.8 13.4
f
0.69 0.66 0.66 0.62
0.61 0.56 0.60 0.47
0.56 0.57 0.43 0.58
E (%)
2.5 2.4 2.3 2.4
2.1 2.4 2.2 2.0
2.2 1.9 2.3 2.1
overall efficiency (%)
1.7 1.6 1.5 1.5
1.3 1.4 1.3 0.9
1.2 1.1 1.0 1.2
Table 8 Energy content of dry matter of four cassava clones
clone energy content (kJ/g)"
123-day-old plants MCol 1684 MVen 77 MPtr 26 MCol 22
304-day-old plants MCol 1684 MPtr 26
average
16.7 16.5 16.8 17.0
16.7 16.2
16.7
* each value is the average of four determinations
50
5.4 DISCUSSION AND CONCLUSIONS
For approximately the first six months of the growth period the
total dry matter increase of a cassava crop was proportional to the
intercepted PAR (Fig. 12). The same phenomenon has also been report
ed for several other crops, e.g. soybean (Shibles and Weber, 1966),
wheat (Gallagher and Biscoe, 1978), barley (Monteith, 1977; Gal
lagher and Biscoe, 1978), potato (Monteith, 1977, Allen & Scott,
1980), sugarbeet (Monteith, 1977; Scott and Jaggard, 1978), lettuce
(Bierhuizen et al., 1973) and apple (Monteith, 1977).
The highest dry matter production rate was 1.40 g per MJ inter
cepted PAR, equivalent to a photosynthetic efficiency (E) of 2.5%
(Table 7). Boerboom (1978b) also reported a photosynthetic efficien
cy for a cassava crop of 2.5%, based on PAR, between 17 and 41 weeks
after planting. However, such efficiencies are low compared with
those measured for other crops (potato, sugarbeet) grown under con
ditions of adequate fertilizer and water in experimental plots in
England for which Monteith (1977) reported an increase of dry matter
of about 2.8 g per MJ intercepted PAR, equivalent to a 4.8% effi
ciency, based on PAR.
It remains to be seen which factors can be held responsible for
this much lower photosynthetic efficiency. This also holds for the
lower photosynthetic efficiency found from six months after plant
ing (Fig. 12). For barley it has also been reported that later in
the growth cycle the leaf surface was less responsive to intercep
ted radiation (Biscoe and Gallagher, 1977). For cassava there may
be a relation with drought stress later in the growth period. In
order to prevent the storage roots from rotting the experimental
plots were not irrigated during dry periods when plants were about
6.5-9 months old (experiment 1). Palta (CIAT, 1981) observed that
rates of leaf photosynthesis in pot-grown cassava plants fell to
about 20% of those of non-stressed plants within one week after the
stress was induced. Connor et al. (1981) also reported a decrease
in the total dry matter yield for plants grown under waterstress
for several weeks. Other reasons for the lower photosynthetic ef
ficiency may be an increase in the crop respiration (Veitkamp et
al., 1985) or a limitation of the growth of the storage root sink
(Veltkamp, 1985) resulting in a decrease in the photosynthesis, as

51
suggested by Williams (1972). Cock et al. (1979) and Tan and Cock
(1979a), however, suggested that root sink activity does not nor
mally limit photosynthetis in cassava. Another possible explanation
of the lower photosynthetic efficiency of cassava may be a decrease
in the crop photosynthesis, resulting from a mobilization of nitro
gen from the leaves in high-yielding crops, (see Evans, 1975). For
several crops, a linear relationship between the nitrogen content
of a leaf and its photosynthetic rate has been suggested (Natr,
1972 ). For cassava it has been found that from the moment leaves
reached their final size the nutrient contents decreased again
(Howeler et al., 1983; Veitkamp, unpublished results), while the
nutrient contents of the first fully expanded leaves decreased with
time (CIAT, 1981). However, there are no data available for cassava
on the relation between the nutrient contents in the leaves and the
photosynthetic rates of those leaves.
The calculated values of the extinction coefficients (K) ( 0.72-
0.88 in experiment 1) correspond with a canopy with a planophile
leaf distribution and are of the same order as reported for white
clover, cotton and potato (Cooper, 1976; De Wit, 1965). In only one
clone (MCol 638) was a lower K value (0.61) found. Williams and
Ghazali (1969) suggested that a more vertical orientation of the
upper foliage, permitting a better light penetration to the lower
leaf layers, would result in a greater crop photosynthesis and in
creased storage root yield of cassava. Models for simulation of
crop photosynthesis (De Wit, 1965; Duncan et al., 1967), however,
showed that only in crops with high LAI values (6 and more) dom-
inantly vertical leaves do show a clear advantage.
The energy content of cassava dry matter varied from 16.2 to
17.0 kJg~ . These values lay in the range from 15.1 to 18.1 kJg~
reported for whole herbaceous plants (Loomis et al., 1971).
52
6 CANOPY CHARACTERISTICS OF DIFFERENT CASSAVA CULTIVARS
6.1 INTRODUCTION
Selection of morphological characteristics that have physiolog
ical significance has been shown to be highly successful in the pro
cess of breeding for yield in several crops, e.g. rice and wheat
(Austin et al., 1980; Jennings, 1964).
The leaf area is one such characteristic. For wheat a number of
authors have reported a linear relationship between the leaf area
duration (LAD) after ear emergence and the grain yield (Evans et
al., 1975).
A positive correlation between the leaf area or LAD and the yield
of storage roots of cassava has also been suggested (Doku, 1965;
Sinha & Nair, 1971; Enyi, 1972b,c; Cock, 1976; Cock et al., 1979).
These findings imply that the supply of assimilates e.g. the rate
of leaf photosynthesis, plus the development of leaf area are im
portant in determining storage root yield of cassava. The results
of the study reported in Chapter 5, on the relationships between
the LAI and the percentage of light intercepted by the canopy on
the one hand, and the cumulative intercepted light and the total
dry matter yield on the other hand, support this hypothesis.
For cassava the leaf area per plant depends on the number of ac
tive apices, that is the branching pattern, the number of leaves
formed per apex, the leaf size and the leaf life.
The objective of this study was to characterize several cassava
cultivars according to the development of leaf area and its compo
nents .
6.2 MATERIALS AND METHODS
General experimental procedures and data on meteorological con
ditions were described in Chapter 3 and also in Chapter 5. The clones
MCol 1684, MVen 77, MPtr 26 and MCol 22 were planted in experiments
1 and 2, whereas MCol 1684, MMex 59, MCol 638 and MPtr 26 were used
53
in experiment 3.
Experiment 1 Planting was done on 15 December 1978. Measurements
of plant height and leaf area development (number of leaves formed
per apex, number of active apices, number of branches per branching
point and number of nodes up to different branch levels) were car
ried out at 62, 90, 123, 151, 185, 213, 241, 279, 304, 335 and
360 DAP. These measurements were done on twelve plants in the plots
harvested at the last harvest, i.e. on 12 December 1979 (362 DAP).
Average leaf size was calculated from the total leaf area per plant
and the number of leaves on the plants. Data on average leaf size
are only available for the moments at which plants were harvested,
namely at 62, 123, 185, 241, 304 and 362 DAP. For those dates the
LAI of the different clones was also calculated. At 59, 91, 123,
153, 189, 213, 241, 277 and 305 DAP the youngest leaf per plant was
tagged with a ticket. The fallen tagged leaves were collected weekly.
Experiment 2 Cuttings of the same four clones as used in experi
ment 1 were planted on 13 July 1979. The total growth period was
178 days. The same measurements as mentioned for experiment 1 were
conducted in this experiment, on nine plants per clone per replica
tion. Plants were measured at 48, 73, 88, 117, 144 and 175 DAP.
Average leaf size and LAI were calculated as described for experi
ment 1, on the harvest dates (48, 73, 88, 117 and 178 DAP). The
procedure followed for calculating of the leaf life was the same as
mentioned for experiment 1. Youngest leaves were tagged at 48, 73,
88, 117 and 144 DAP.
Leaf blade samples for diagnosis of the nutritional status of the
crops were taken at 118 DAP, according to a procedure described by
Howeler (1980) (see also Chapter 3), and analysed for N, P, K, Ca
and Mg. Plants were sprayed once to control an attack by thrips.
Experiment 3 The cuttings were planted on 29 January 1980. Nine
plants per replication per cultivar were measured for the same para
meters as reported for experiments 1 and 2, at 54, 89, 131, 159, 194,
227, 264 and 294 DAP. Individual leaf size at different times after
planting was determined according to a method described in Chapter 3.
To ascertain leaf life leaves were tagged at 54, 89, 103, 117, 131,

54
145, 157, 194 and 262 DAP. LAI was calculated at the harvest dates
(138, 185, 246 and 303 DAP). The last harvest was on 25 November
1980 (303 DAP). Leaf samples for nutritional diagnosis were taken
on 150 DAP and analysed for N, P, K, Ca and Mg.
6.3 RESULTS
6. 3.1 General observations on sprouting and growth
In experiments 1 and 2, sprouting of the cuttings was good for
all clones. Sprouting of MCol 22 was about one week later than that
of MCol 1684, MVen 77 and MPtr 26. In experiment 3 sprouting of
MCol 638 was variable; this was also a result of the activities of
slugs (identified as Vaginulus (Sarasinula) plebeius (Veronicellidae) (CIAT, 1980)), which consumed parts of the bark of the cuttings and
sprouting buds and leaves of the young plants.
Results of the leaf blade analysis revealed that in experiment 2
the N, P and K contents of MCol 22 were somewhat below the critical
levels proposed by Howeler (1980) (Table 9). In the other clones
the N and P contents were slightly below the critical levels. In ex
periment 3 the nutrient concentrations (N, P, K, Ca and Mg) in the
youngest fully expanded leaves were above the critical levels at
150 DAP, in all four clones.
Table 9 Nutrient concentration in youngest fully expanded leaves of four clones of cassava at 118 DAP (Experiment 2)
Clone
MCol 1684 MVen 77 MPtr 26 MCol 22
Concentration (%
N
4.9 4.9 4.6 4.3
P
0.36 0.37 0.35 0.29
of dry
K
1.6 1.4 1.4 1.1
weight)
Ca
0.9 0.8 0.7 0.7
Mg
0.45 0.38 0.33 0.45
Critical level 5.0 0.4 1.2 0.7 0.3 (Howeler, 1980)

55
6.3.2 Plant height
Fig. 13a,b shows the plant heights of the clones studied in ex
periment 1 (Fig. 13a) and experiment 3 (Fig. 13b) at different times
after planting. The heights of the plants in experiment 2 were sim
ilar to those in experiment 1. Considerable differences in plant
height were observed between the clones under study. MVen 77 was an
exceptionally tall clone, being more than 3.5 m at 362 DAP (experi
ment 1) (Fig. 13a). MCol 22 and MCol 638 were shorter, with MCol 22
being 1.9 m at 362 DAP in experiment 1 and MCol 638 being 1.8 m at
294 DAP in experiment 3.
6. 3. 3 Leaf area index
Experiment 1 MCol 1684, MPtr 26 and MVen 77 reached an LAI of 1.0
by approximately 62 DAP (Fig. 14a). The leaf area development of
MCol 22 was somewhat slower, possibly because it took longer to
sprout: (nearly three weeks, whereas for MCol 1684, MVen 77 and
MPtr 26 it took two weeks).
In the period from 62 to 123 DAP LAI increased greatly, reaching
an average value of 2.8 at 123 DAP. At that date there was no signif
icant clonal difference in LAI. From 123 to 185 DAP, LAI values con
tinued to increase, peaking on average at 3.4. Just after the sam
pling at 185 DAP a dry period occurred. In the period from about 190
to 220 DAP a tremendous leaf fall was observed, resulting in very
low LAI's at 241 DAP for all clones except MCol 22. The decrease in
LAI in that clone was much less. At 241 DAP, MCol 22 had an LAI of
1.9, which was significantly higher than that for the other clones,
which had an average LAI value of 0.6. Until the last sampling at
362 DAP, MCol 22 maintained a higher LAI than the other clones.
In the rainy season from October to November 1979, LAI values in
creased again for all clones, but especially in MCol 1684 and
MVen 77.
Experiment 2 Leaf area development, expressed as LAI, during the
growth period of 178 days is shown in Fig. 14b. At 48 DAP, LAI
values ranged from 0.21 for MCol 22 to 0.34 for MPtr 26. At 73 DAP
MCol 1684 and MPtr 26 had already passed the LAI=1 level, while

56
plant height (cm I
400-
300-
200-
100-
experiment 1
60 120 180
days after planting
• • M Col 1684 x x M Ven 77
0- 0 MPtr 26
û û MCd 22
240 300
plant height (cm I
300-
200-
100-
0 -
experiment 3
pr n - - - -
/ /m
/ / ^ ^
'7 / ' '7 / 7
i 1
^ - a
^.xr'"
^_,o- o
**
a a M Mex 59
• * MCol 638
O 0 MPtr 26 (*)
60 120 180 days after planting
240 300
(a)
360
Fig. 13 Plant height as a function of plant age, in six cassava clones.
57
MVen 77 and MCol 22 were approaching it. Great increases in LAI
were observed from 73 to 88 DAP. Maximum LAI values reached in this
experiment were relatively low (2.0-2.4). Until 117 DAP, MCol 22 had
significantly lower LAI values than MPtr 26, with MCol 1684 and
MVen 77 being intermediate. At 178 DAP clonal differences in LAI
values were not statistically significant.
Experiment 3 Significant clonal differences in LAI values were
found for all sampling dates. Although initial leaf area development
of MCol 638 was very slow, at 138 DAP this clone had already reached
a LAI of 3.7 and did not differ significantly from MMex 59, which had
already peaked (4.7) at that time (Fig. 14c). On the other sample
dates MMex 59 and MCol 638 had statistically significant higher LAI
values than MCol 1684 and MPtr 26, although the differences between
both groups decreased gradually.
6. 3. 4 Cumulative number of leaves formed per apex
The number of leaves formed per apex for the four clones in ex
periment 1 is shown in Fig. 15a. New leaves were formed continuously.
As plants grew older, the number of new-formed leaves per apex de
creased. At 59 DAP no clonal differences in leaves formed per apex
were observed. From 91 DAP, MPtr 26 had a significantly higher num
ber of leaves formed per apex than the other clones, whereas MVen 77
formed more leaves per apex than either MCol 1684 or MCol 22.
In experiment 2 the leaf production showed the same patterns as
in experiment 1 (Fig. 15b). At 175 DAP, MPtr 26 had produced signif
icantly more leaves per apex than the other clones (Table 10).
In experiment 3 the cumulative number of leaves formed per apex for
MPtr 26 was significantly higher than that for the other clones from
89 DAP (Fig. 15c). The number of leaves formed per apex at 194 and
294 DAP are shown in Table 12.
6. 3. 5 Number of active apices per mz
The number of active apices can be studied in terms of three as
pects : the duration of the period from planting until the first
branch level is reached; duration of the periods until subsequent
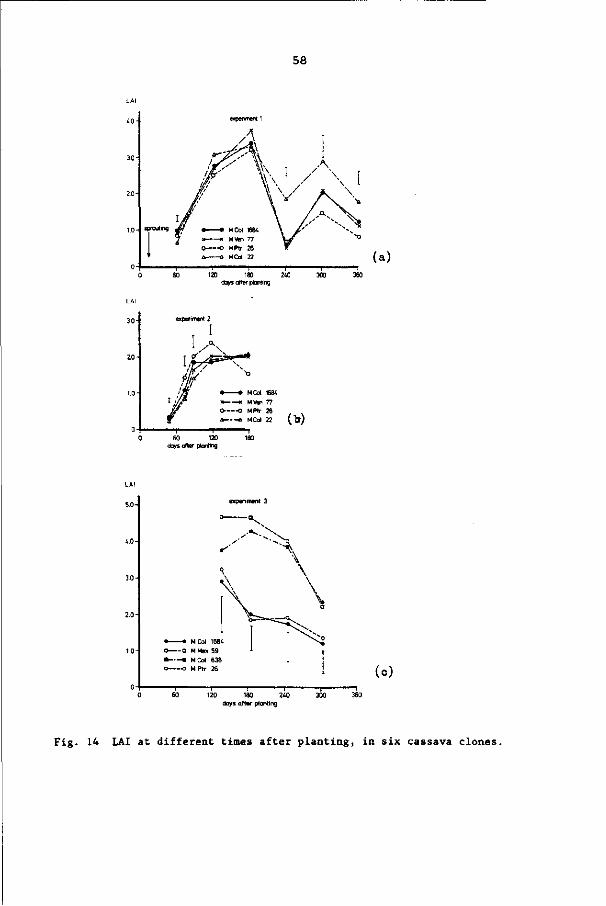
58
60 120 180 240 days after planting
( a ) 300 360
» » M Col 168« >• « MVèn 77 » O MPtr 26 » - - - * MCol 22 ( b )
60 120 days after planting
180
LAI
5.0- experiment 3
. a
\
• — — • MCol 168 0 a MMex 59 • • MCol 638 o — o MPtr 26
•
i -^^
\ \ \
a —-c
T
60 120 180 240 300 days after planting
(o )
Fig. 14 LAI at different times after planting, in six cassava clones
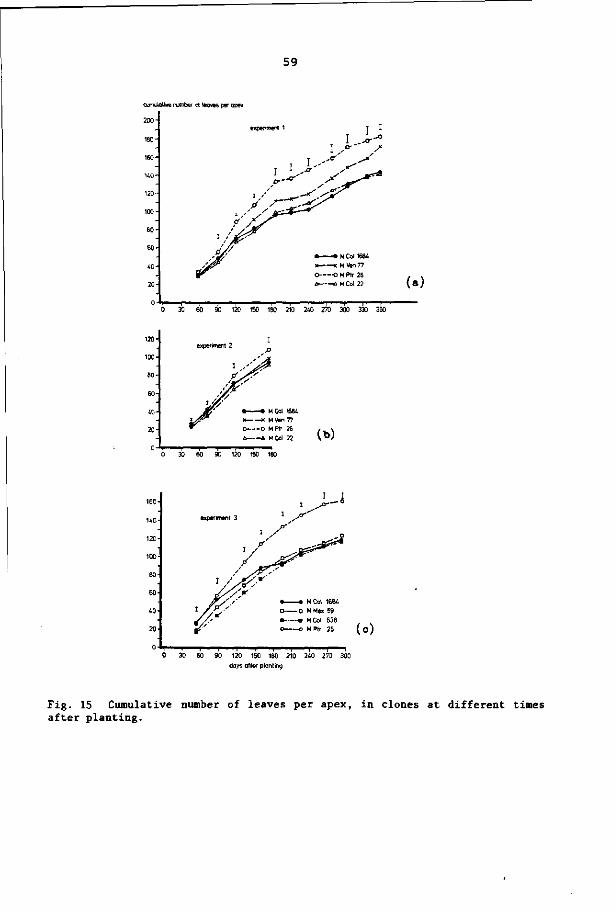
59
cumulative number o? leaves per apex
200-
140'
120-
100-
80
60-
40
20
160-
140-
120-
100-
60
60
40-
20
M Col 1664 «——K M ven 77
O OMPtr 26 û â M Col 22
30 60 90 120 150 180 210 240 270 300 330 360
M Col 1684 x— —x M Ven 77 o O MPir 26 Ä A MCol 22 (*)
30 60 90 120 150
I ,
, /S' S'* V'
1 / f
/ y ' stf.-Yf
• , • • MCol 1684 D D M Mex 59 • « MCol 638 o o MPtr 26 ( o )
30 60 90 120 150 180 210 240 270 300 days after planting
(a)
Fig. 15 Cumulative number of leaves per apex, in clones at different times after planting.

60
u Ol Q.
ca CU u H O. 10
<u >
Q 03 -4
W 09 (U J J I
b
MH O
• o c <8
X 0) O . 10
u 01 o .
• o o> u a
• o o u o ,
CH O
kl II
42
CU C M >
•f-4 * J u a « eu
'S s
3 -i-t S u 3 n u o ,
X - w
09
** > M -H
PH
e u
3 <u O
—I 'M
« 'M H O
un
CN CN
O o
CN
0> in
o
CJ>
ca
CN i
CN
en i
ï Î
pH ^
O0 O
CN
v O
ca
o u S
00
M M d r l CN CS en »a- « j
ID CN
cu > PH pH 11 CU CU
PH > > eg oi
J 3 r-H rH O c . e j 3
o o e e «
u J3
kl h •u xi xi .. «
a u T3 - o 0 - M a SH kl 'M O -rt
'M O JS O « (J
ta 4J co 01 o
' S 90 O 4 O C 4J CS 'H T3
4J M C ' M a ca o
cu > PH pH « V U
rH > > 01 01
X i PH PH u O J S J3 a) o u 1 - . C C x> o o
kl h 4-1 -O X I 09 JH -O ' S
•pt e M 'M O 'H
U X I i o v u
M ia
o o .
eo a
• H X I u e «
x i <-* PH Ol pH
kl 01 > CU m > <u > O, 01 PH U
PH PH 09
Ck. < a
U a m kl
X)
• o 01
X i u <0 01 k l
o
o
Ou
II
o SS
> . 00 o n e u
•o -H
o
oi x i o x l • a u a o u e <o a m 10 kl X I kl X I
x i - o « a -o
' M ia o ki O kl u -H
H « i
a 10 kl
Xt
•o 01 u
•v < o o ki O. I /1
ca PH 01 > 4J 10 10 oi <
eu 01 < > Q
01
kl (M
2 e
01 u S I O 01 o
T3 • •H O
01
O 01 se a,:
01
Il o
& a
IM m
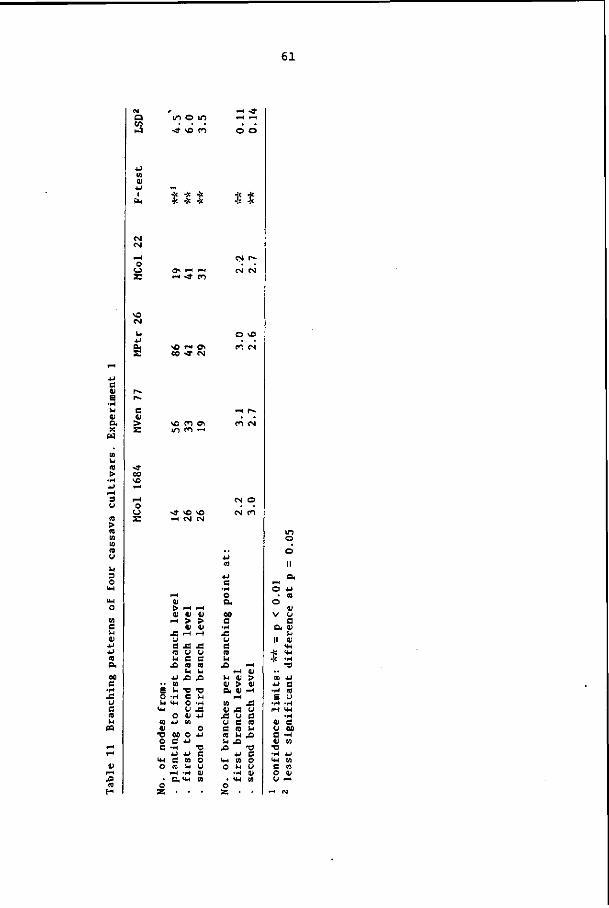
61
a Vi • J
m o m «ï vo co
I-H -3-»—I I—I
O O
t %t
x! u C to
X>
e -
CM CM
O
u
- H
•U
c ID E
•H kl U O,
W
u kl 10
> •H ±J r-l 3 U
10
>
\ 0 CM
kl 4 J PH
s
(̂ r~
S V
£
«3-00 VO i—t
i—1 0
u
M5 <-i ON 0 0 - 3 - CM
vo co o> in co i-<
CM r -
CM CM
O vO
CO CM
- H r -
CO CM
»J VC VO - H CM CM
CM O
CM CO
O a. 00 c
X I -H .-H X i
kl XS
E O kl UH
C ki
O l u 10 *J u CJ o
• o OC O *J o e -u C -H - o
4J j j e <M e « o o m ki o
i-H -i-I «J • Cu IH w
o SR • • •
i-H OJ <H OJ > <D > OJ a , ai ^H
^H
w x! « £ u J3 u e u s a e « u « U Xi U X I
X I T> 4-> S
MH U O O U O
m o
li a.
I -* O 4J
• 10 o tl
v u e a, v u il u
MH •Ü MH
•o
•u e •H 10 E U
00
O 55
M
u c (U 10
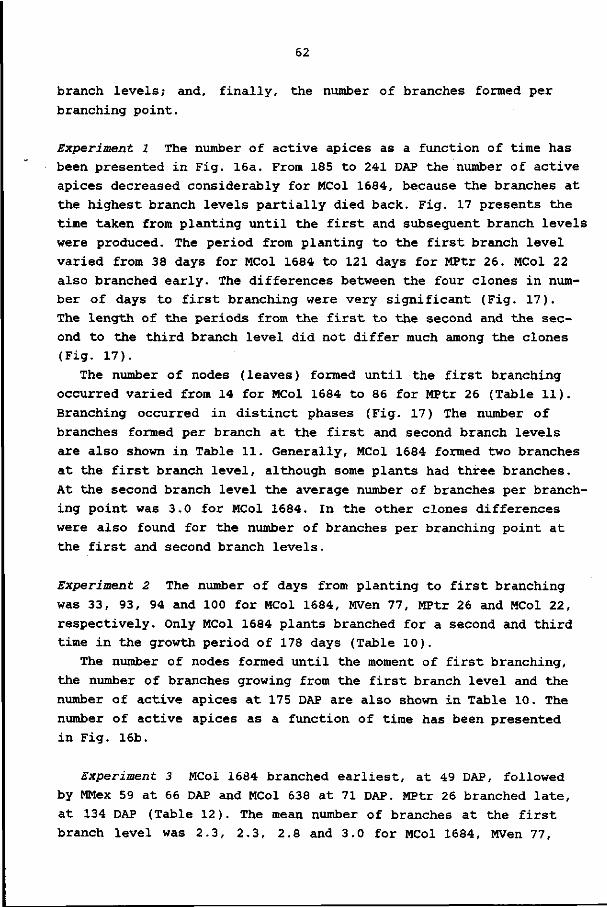
62
branch levels; and, finally, the number of branches formed per
branching point.
Experiment 1 The number of active apices as a function of time has
been presented in Fig. 16a. From 185 to 241 DAP the number of active
apices decreased considerably for MCol 1684, because the branches at
the highest branch levels partially died back. Fig. 17 presents the
time taken from planting until the first and subsequent branch levels
were produced. The period from planting to the first branch level
varied from 38 days for MCol 1684 to 121 days for MPtr 26. MCol 22
also branched early. The differences between the four clones in num
ber of days to first branching were very significant (Fig. 17).
The length of the periods from the first to the second and the sec
ond to the third branch level did not differ much among the clones
(Fig. 17).
The number of nodes (leaves) formed until the first branching
occurred varied from 14 for MCol 1684 to 86 for MPtr 26 (Table 11).
Branching occurred in distinct phases (Fig. 17) The number of
branches formed per branch at the first and second branch levels
are also shown in Table 11. Generally, MCol 1684 formed two branches
at the first branch level, although some plants had three branches.
At the second branch level the average number of branches per branch
ing point was 3.0 for MCol 1684. In the other clones differences
were also found for the number of branches per branching point at
the first and second branch levels.
Experiment 2 The number of days from planting to first branching
was 33, 93, 94 and 100 for MCol 1684, MVen 77, MPtr 26 and MCol 22,
respectively. Only MCol 1684 plants branched for a second and third
time in the growth period of 178 days (Table 10).
The number of nodes formed until the moment of first branching,
the number of branches growing from the first branch level and the
number of active apices at 175 DAP are also shown in Table 10. The
number of active apices as a function of time has been presented
in Fig. 16b.
Experiment 3 MCol 1684 branched earliest, at 49 DAP, followed
by MMex 59 at 66 DAP and MCol 638 at 71 DAP. MPtr 26 branched late,
at 134 DAP (Table 12). The mean number of branches at the first
branch level was 2.3, 2.3, 2.8 and 3.0 for MCol 1684, MVen 77,
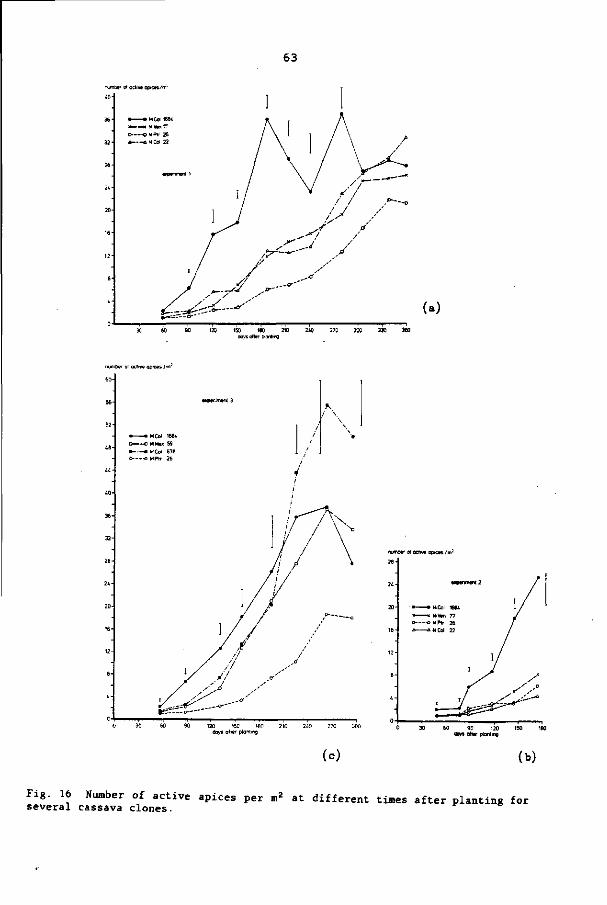
63
numDef o* oct i« apices/"•-
•——•MCo l 166* » K M l * i 7 7
O-—-OMPtr 26 A - . - A M C o l 22
(a)
3C 60 90 120 150 180 210 240 270 300 330 Öoys after planting
number of oc
60-
56-
52-
44 -
40'
36 -
32-
-26-
24-
20-
16-
12-
8-
0-
ve apices
— • MCol D — O M Me*
»-o - -- • M C o l - •o MPtr
m'
1684
59
638 26
B-S-™
experiment 3
1 /
-o-""
1/ / /
-••'
i
! /
\ '•
1
4 f
\r7\ V / \
/ / \ \ / X
f \ /
/ ,
120 15C 180 210 240 770 JOO days offer planting
numoer of active apices / i
30 60 90 120 150 1B0 days after planting
( c ) (b)
Fig. 16 Number of active apices per m2 a t different times after planting for several cassava clones.
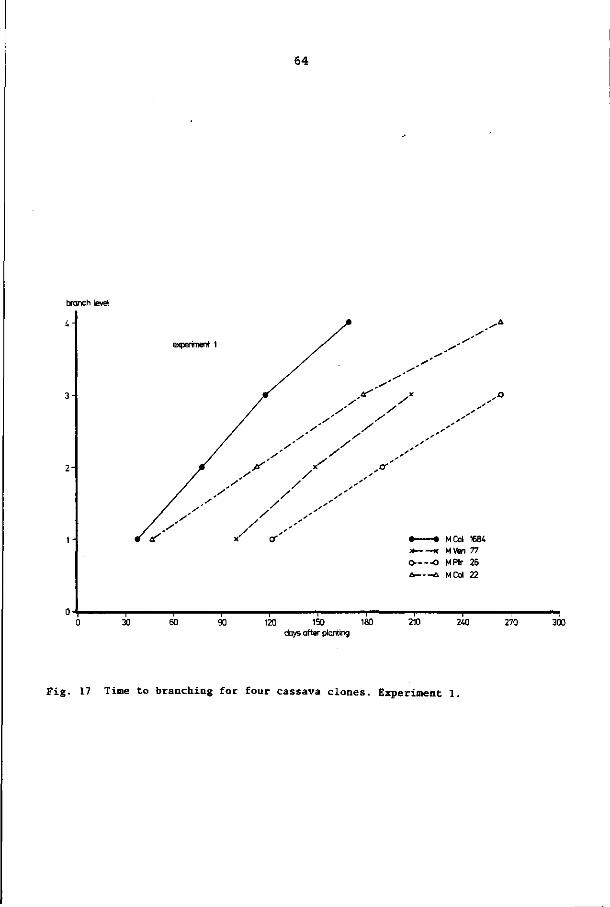
64
branch level
4 -
2H
experiment 1
• • M Col 1684 x K M Ven 77 O—-o MPtr 26 £. û M Col 22
30 60 90 120 150 180 210 days after planting
240 270 300
Fig. 17 Time to branching for four cassava clones. Experiment 1.

65
Oi
m 10 u
u 3 O
I M
I M O
OS
c u <u
4 J 4 J 10
a, oa s
• H f U
e
« t 3 e a X a i
a a h 01
o.
•a m E
NO CM
h 4 J a. s
0 0 en vO
i—1 O
C J
s
OS m
X a i
I
-» O0 VO i—i
| M 0
o s
ai xi
C M I -H
a i »M A 10
H
ai E
' H k l a i a X
U ]
INI
O co 1-4
es r-- ï •*
CM ON
-» en
• M CM
o s • *
~* CM
O
it a a t
en CM en vo
ON 1-1
NC OO
ON en
vo oo m CM CM CM
en NO
i l ON
r-- -a-
o o en en
oo i-i CM en
03 01
> 10 01
~-t
m o ki 01
- C
3 c 01
> •M 4-1 10
pH
3
i u
0 0 ON
CM ON
4-> 10
X 01 a. 10
k l 01 O i D , <
O • D 01 < • E ON kl — O
I M .
«a-CM
oo
OL,
< Q
- ï ON CM
Ë 0 k i
<n
m 01
• o
o e
U-I
o
o ss
r--CM
CM CM
i-i 01 > 01
I M
xi u c 10 k l
X3
4-1 01 kl
• H >H
O 4J
oo s
• H 4-1
e 10
i-H CL,
O en
0 0 CM
i—1 01
> 01 pH
X !
u s 10 k l
X I
T 3 C O o 01 03
O 4-1
4-1 03 k l
• H VM
NO CM
f*-CM
i—1 01
> 01
^ X !
o 3 10 kl
x>
•o k l
• H
x: 4->
O 4-1
• o c 0 u 01 03
E o k l
MH
03
>> 10 • o
HJ
o
o SS
NO NO
ON
01
> 01 i - l
x: o
m
•*
NO <n
i H 01
> 01 i-H
S XI 10 kl
x> 4-1 03 k l
• H M-l
o 4-1
ac 3
• H 4J
3 10
f-4
u s 10 kl
X I
• o 8 o u 01 03
O 4-1
4J 03 kl
• H
a ' M
4-1
a 4-1
s •H 0
& oc c
• H
X! U 3 n M
x> kl 01 a. 03 01
XI u 3 10 ki
X i
I H
0
O
Z
m
CM
en
CM
i-H 01
> 01
*-< X I u e 10 k i
X ,
4-1 03 k l
• H «H
r**
CM
ON
CM
t-H 01
> 01 t-4
XI u 3 10 k l
X I
•o 3 O u 01 m
4-1 8 10 U
•H IM •H S 00
•M 03 i 3 0 8 M 03
8
|M O
d V
o.
u
% 03 4J • H
E • H P H
01 u 8 01
•o • H >M 8 0 U
un o
o
II
a »H INI
XI u 8 10 k l
X I
4-1 10
X 4 J
•T3 01
X I u ta 01 H
^ pH « 4 J O 8
• o 10
X I
03 4J
3
« » H O .
01 X I 4 J
01 03
3 10 u 01
X I
• •
<0 4-> 10
•o
o 8
m
O-i
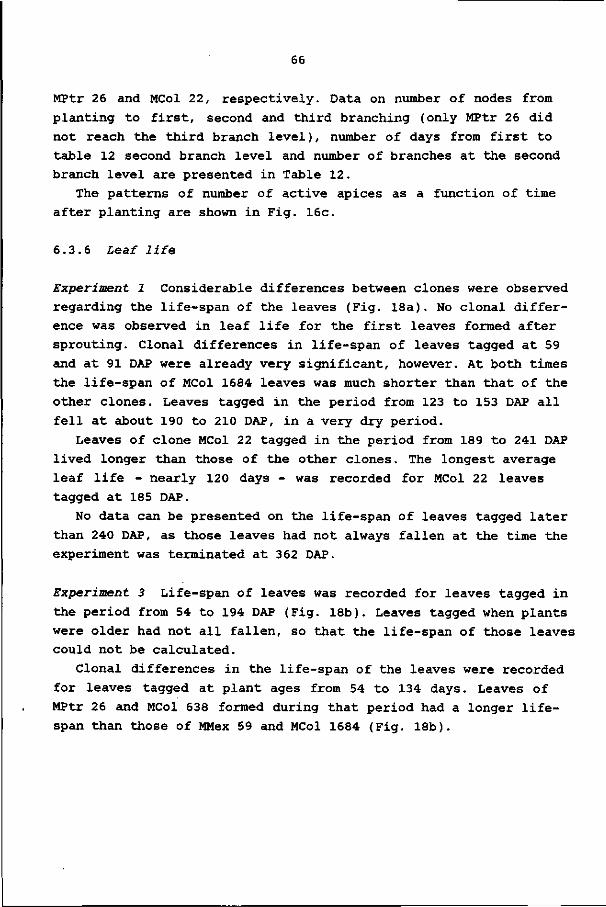
66
MPtr 26 and MCol 22, respectively. Data on number of nodes from
planting to first, second and third branching (only MPtr 26 did
not reach the third branch level), number of days from first to
table 12 second branch level and number of branches at the second
branch level are presented in Table 12.
The patterns of number of active apices as a function of time
after planting are shown in Fig. 16c.
6.3.6 Leaf life
Experiment 1 Considerable differences between clones were observed
regarding the life-span of the leaves (Fig. 18a). No clonal differ
ence was observed in leaf life for the first leaves formed after
sprouting. Clonal differences in life-span of leaves tagged at 59
and at 91 DAP were already very significant, however. At both times
the life-span of MCol 1684 leaves was much shorter than that of the
other clones. Leaves tagged in the period from 123 to 153 DAP all
fell at about 190 to 210 DAP, in a very dry period.
Leaves of clone MCol 22 tagged in the period from 189 to 241 DAP
lived longer than those of the other clones. The longest average
leaf life - nearly 120 days - was recorded for MCol 22 leaves
tagged at 185 DAP.
No data can be presented on the life-span of leaves tagged later
than 240 DAP, as those leaves had not always fallen at the time the
experiment was terminated at 362 DAP.
Experiment 3 Life-span of leaves was recorded for leaves tagged in
the period from 54 to 194 DAP (Fig. 18b). Leaves tagged when plants
were older had not all fallen, so that the life-span of those leaves
could not be calculated.
Clonal differences in the life-span of the leaves were recorded
for leaves tagged at plant ages from 54 to 134 days. Leaves of
MPtr 26 and MCol 638 formed during that period had a longer life
span than those of MMex 59 and MCol 1684 (Fig. 18b).
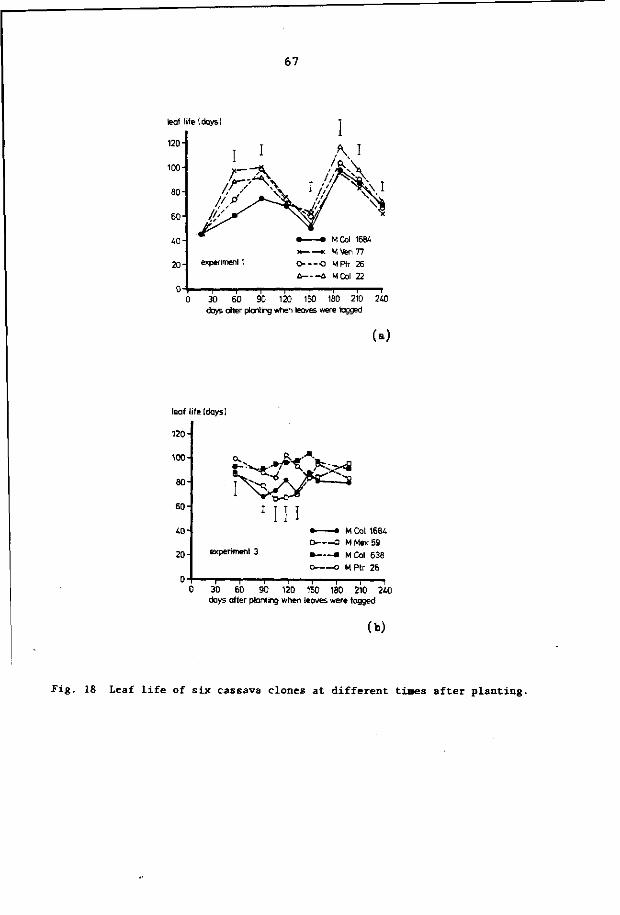
67
M Col 1684
x x M Ven 77
O O MPtr 26
û û M Col 22
0 30 60 90 120 150 180 210 240 days öfter planting when leaves were tagged
( a )
leaf life (days!
120-
100
80-
60-
40
20 experiment 3
M Col 1684 D D M Mex 59
• • M Col 638
o o M Ptr 26
0 30 60 90 120 150 180 210 240 days after planting when leaves were tagged
(b)
Fig. 18 Leaf life of six cassava clones at different times after planting.
68
6.3. 7 Leaf size
For experiments 1 and 2 the average leaf size was calculated from
the total leaf area per plant and the total number of leaves per
plant. In experiment 3 the individual leaf size was derived from
the calculated relationships between the length of the central lobe
and the leaf size (see Chapter 3).
Experiment 1 Large clonal differences in average leaf size were
observed (Fig. 19a). At 62 DAP, MVen 77 had the biggest average leaf
blade size. By then, MCol 1684 and MVen 77 had already reached their
maximum average leaf size. The maximum size for both MCol 22 and
MPtr 26 was found at 123 DAP. The average leaf size decreased tre
mendously in the period from 123 to 185 DAP. At 185 DAP, MPtr 26 had
the biggest leaves. The average leaf size declined further from
185 DAP onwards. In the period from 241 to 362 DAP the average leaf
size was less than 100 cm2 for all four clones. For that period
clonal differences in leaf size were not statistically significant.
Experiment 2 Already at 48 DAP significant clonal differences in
average leaf size were observed (Fig. 19b). The maximum average leaf
size for MCol 1684 and MPtr 26 was reached at 73 DAP. Leaf sizes of
MCol 22 and MVen 77 declined after 88 DAP. At all sampling dates
MCol 1684 had the smallest leaves.
Experiment 3 The leaf sizes mentioned for this experiment refer to
the size of individual leaves. Fig. 19c gives the patterns of leaf
size during the growth period. MMex 59 and MPtr 26 had the biggest
leaves during the whole growth period. The size of the leaves tagged
at 54 DAP and measured at 68 DAP already showed much variation be
tween the clones studied. Leaves of MCol 1684 had their maximum size
at 54 DAP. From 157 to 262 DAP changes in individual leaf size were
only small.
6.4 DISCUSSION AND CONCLUSIONS
Several authors (Doku, 1965; Sinha and Nair, 1971; Enyi, 1972b,c;
Cock, 1976; Cock et al., 1979) have suggested that the leaf area is
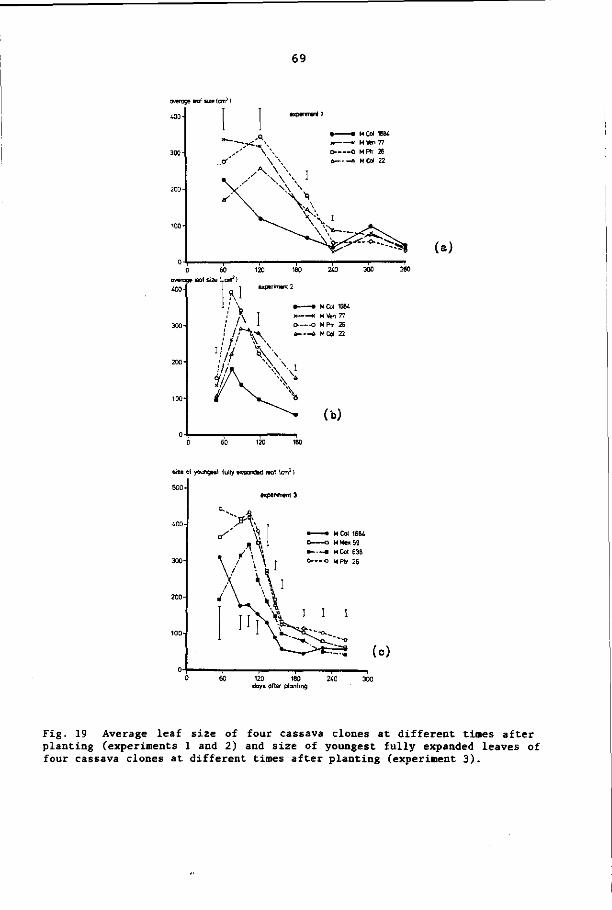
69
average teaf size icmî )
400-
300-
200-
100-
expenment 1
1 1 « » m MCol 1684
* — — — - £ ^ , \ x — — K M «en 77 \ \ o 0 MPtr 26
çf' \ \ b û MCol 22
' N \ \ ] >/*' N \ ^V
"" \ \ ^
* \ _ ^ \ ' \ ' j*
^ " " " " " - • ^ W ^ ^ - - ^ ^ ^ - (a)
60 120
L O T 1 I
I ,
T experiment 2
* 1 ,' V • • MCol 1684
.' ?\ | *—--K M ten 77 .' A \ J O- 0 MPtr 26 ' / / V * » — 4 MCol 22
•'A ^ \
i N^ v»
^ ^ (b)
size of youngest fully expanded leaf [cm2 )
500-
0-t
• — • M Col 1684
D o M Mex 59
• - — • MCol 638
o — « MPtr 26
(o )
120 180 240 300 days after planting
Fig. 19 Average leaf size of four cassava clones at different times after planting (experiments 1 and 2) and size of youngest fully expanded leaves of four cassava clones at different times after planting (experiment 3).
70
crucial in determining the crop growth rate and the storage root
bulking rate of cassava. Cock et al. (1979) found the optimal LAI
for storage root bulking rate to be 3 to 3.5. Irikura et al. (1979)
suggested that this optimum LAI existed over a wide range of tempe
ratures . In order to obtain a high storage root yield it seems to
be necessary for a cassava crop to reach an LAI of 3 to 3.5 as quick
ly as possible and to maintain that LAI for as long as possible.
In this study it was found that initial leaf area development was
slow, taking 60-80 days from planting before an LAI of 1.0 was reached
(Fig. 6a,b). An LAI = 3, which coincides with a light interception by
the canopy of approximately 90%, was reached between 120 to 150 DAP
(Fig. 14a,c), i.e. approximately 40% of the crop growth period elapsed
before the reported optimal LAI was reached. For one experiment
(experiment 2) an LAI = 3 was never reached (Fig. 14b). Genotypes
with very different canopy characteristics took approximately the
same time to attain an LAI = 3.
The development of LAI depends on several factors, such as leaf
formation rate, leaf longevity, branching pattern and leaf size. For
all these factors significant genotypic variations were found in
this study, but environmental conditions, too, were of influence.
An important interaction between genotype and planting date was
found for the period from planting until the first branch level was
produced (Fig. 17 and Tables 10 and 11), even though temperature and
daylength variation during the year are relatively small at the ex
perimental site (Table 2). Data from Irikura et al. (1979) suggest
that differences in temperature may be responsible for the variation
observed in the period from planting until first branching, but the
temperature range in their study was much larger (20-28°C) than that
at the CIAT experimental farm area. In Chapter 8 it is shown that
under long days (16 hours) the final branch number was greater, but
no general reaction to daylength was found in the period from plant
ing until the first branch level was produced (Chapter 8). Miège
(1957) found that cuttings taken from the main stem branched later
than cuttings taken from the first to the third branch levels. In
the present study, all the cuttings were taken from the middle part
of the plants, including the main stem and the first and sometimes
also second branch levels, so the variation in period from planting
until the first branching observed in this study cannot be explained

71
in this way. Cassava clones grafted onto different stocks branched
at similar times, suggesting that the period from planting till
first branching is scion determined (Veltkamp, 1985).
Large clonal differences were found in leaf longevity (Fig. 18).
Rosas et al. (1976) reported that shading of the leaf blade and the
presence of an active apex strongly shortened the leaf life. How
ever, the storage root bulking rate did not influence the leaf life,
making selection possible for a high root bulking rate on the one
hand and for a long leaf life on the other. Leaf life was influenced
strongly by a drought stress that occurred during the growth period
of the plants in the experiment 1 from 190 to 210 DAP.
At first, leaf size increased with plant age, but later it de
creased. Genotypic variation was found in the plant age at which
maximum leaf size was obtained (Fig. 19). Maximum leaf size varied
by clone and by planting date (Fig. 19). Leaf size was influenced
by changing the branching pattern; larger leaves were produced when
the number of active apices was reduced (Tan and Cock, 1979a).
To date, little variation has been found in leaf formation rate
per apex (Cock et al., 1979; Tan and Cock, 1979a,b; Irikura et al.,
1979). Of the cultivars tested in this study, however, MPtr 26
showed a significantly higher leaf formation rate in all three
experiments (Fig. 15; Tables 10 and 12).
The results of this study show that even small variations in en
vironmental conditions (Table 2) can lead to significant differences
in canopy characteristics. For successful modelling of leaf area
development of a cassava crop, detailed studies under controlled
conditions of the effects of temperature and light on the canopy
characteristics of diverse cassava genotypes are also necessary,
with emphasis on interactions between the different components
that contribute to the development of the leaf area.
72
7 PARTITIONING OF DRY MATTER IN CASSAVA
7.1 INTRODUCTION
It has been shown (Chapter 5) that in cassava there is a close
correlation between the total dry matter yield and the intercepted
PAR. Because in cassava the storage root yield is more relevant than
the total dry matter yield, it is important to study the distribu
tion of produced dry matter among the different plant parts, partic
ularly in the storage roots.
Indira and Sinha (1970) and Cours (1951) reported that secondary
growth of the roots had already started by three weeks after the
cuttings were planted, with starch deposition in the secondary xylem
of the roots following approximately one week later. The capacity
for initiating storage roots of cassava is an inherent character
istic of the genotype of the roots (Cours, 1951).
Boerboom (1978a) suggested that during the storage root filling
period the distribution of dry matter over the different plant parts
can be described by a linear regression equation with an intercept.
However, in this equation the intercept with the axis of root dry
matter production is only a calculated point. Therefore Flach (1982)
preferred the term 'apparent initial start of starch accumulation'
(AISS). The slope of the linear equation represents the efficiency
of storage root production (ESRP). Boerboom's ESRP does not repre
sent the true distribution of produced dry matter, because the
weight of fallen leaves has not been included in the model.
The partitioning process of dry matter over the different plant
parts with emphasis on storage roots is reported in this chapter
for different cultivars.
7.2 MATERIALS AND METHODS
The experimental designs, site and meteorological conditions have
been described in Chapter 3 and supplemented in Chapters 5 and 6.
73
MCol 1684, MVen 77, MPtr 26 and MCol 22 were the clones used in
experiments 1 and 2. In experiment 3, MCol 1684, MMex 59, MCol 638
and MPtr 26 were used.
'Measured' harvest index was calculated as the fraction of the
dry matter yield of the standing crop that had been allocated to
the storage roots. For calculating the 'real' harvest index the
dry weight of the fallen leaves, which were collected weekly, was
included in the total dry matter yield.
To study the partitioning of the produced dry matter two models
were tested. Two equations relating the dry storage root weight to
the total dry matter weight were fitted separately to the harvest
data per plot of experiment 1. The first relationship was a non
linear regression equation: In y = A + b. In (x - x 0 ) , where y = dry
storage root yield, x0 = the total dry matter yield at which the
storage roots were apparently initiated, x = the total dry matter
yield, A = intercept with the y-axis and b = slope of the regres
sion line. In the second relationship a linear regression with an
intercept was tested: In y = a + In (x - X 0 ) . For each plot the
values for A, b and x0 in the first equation and a and X0 in the
second equation were calculated. Also, the variance, being s2 =
N = I {In y - (In y)2}(N - k), was estimated for each plot, to fit the
1 regression equations. N = the number of harvests and k = the number
of parameters, being 3 for the first model tested and 2 in the case
where b is assumed to have a value of 1.0.
For experiments 2 and 3 only the second model
In y = a + In (x - X 0 ) , was fitted to the harvest data.
7.3 RESULTS
7. 3.1 Yields of total dry matter and root dry matter
Changes in the total dry matter yield are shown for all three
experiments in Chapter 5.
In experiment 1 no storage roots (roots with a diameter of more
than 1.0 cm) were found at 62 DAP. At 123 DAP all sample plants
had storage roots. None of the four clones showed significant
changes in the number of storage roots per m2 during the growth pe-
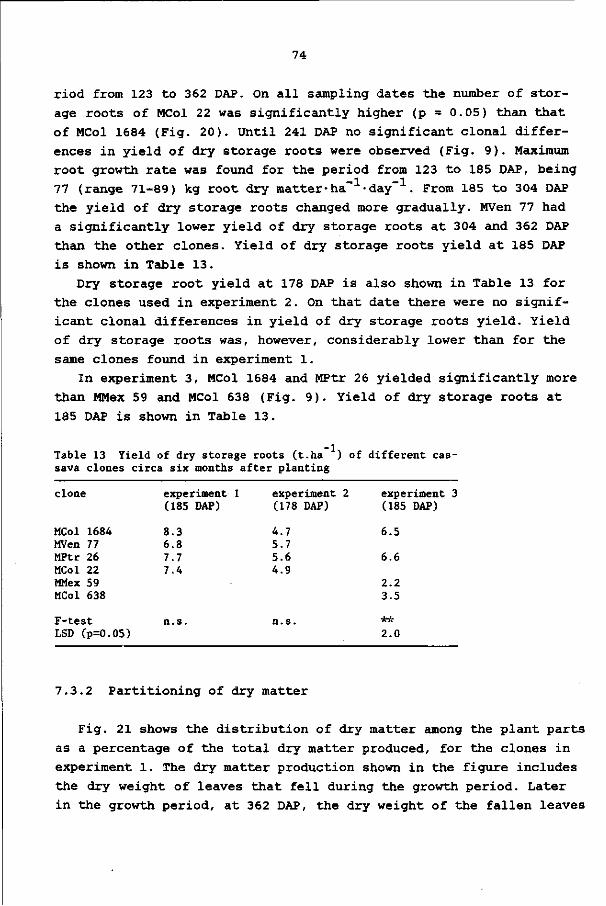
74
riod from 123 to 362 DAP. On all sampling dates the number of stor
age roots of MCol 22 was significantly higher (p = 0.05) than that
of MCol 1684 (Fig. 20). Until 241 DAP no significant clonal differ
ences in yield of dry storage roots were observed (Fig. 9). Maximum
root growth rate was found for the period from 123 to 185 DAP, being
77 (range 71-89) kg root dry matter-ha"1-day-1. From 185 to 304 DAP
the yield of dry storage roots changed more gradually. MVen 77 had
a significantly lower yield of dry storage roots at 304 and 362 DAP
than the other clones. Yield of dry storage roots yield at 185 DAP
is shown in Table 13.
Dry storage root yield at 178 DAP is also shown in Table 13 for
the clones used in experiment 2. On that date there were no signif
icant clonal differences in yield of dry storage roots yield. Yield
of dry storage roots was, however, considerably lower than for the
same clones found in experiment 1.
In experiment 3, MCol 1684 and MPtr 26 yielded significantly more
than MMex 59 and MCol 638 (Fig. 9). Yield of dry storage roots at
185 DAP is shown in Table 13.
Table 13 Yield of dry storage roots (t.ha ) of different cassava clones circa six months after planting
clone
MCol 1684 MVen 77 MPtr 26 MCol 22 MMex 59 MCol 638
F-test LSD (p=0.05)
experiment 1 (185
8.3 6.8 7.7 7.4
n.s.
DAP) experiment 2 (178 DAP)
4.7 5.7 5.6 4.9
n.s.
experiment 3 (185 DAP)
6.5
6.6
2.2 3.5
** 2.0
7.3.2 Partitioning of dry matter
Fig. 21 shows the distribution of dry matter among the plant parts
as a percentage of the total dry matter produced, for the clones in
experiment 1. The dry matter production shown in the figure includes
the dry weight of leaves that fell during the growth period. Later
in the growth period, at 362 DAP, the dry weight of the fallen leaves
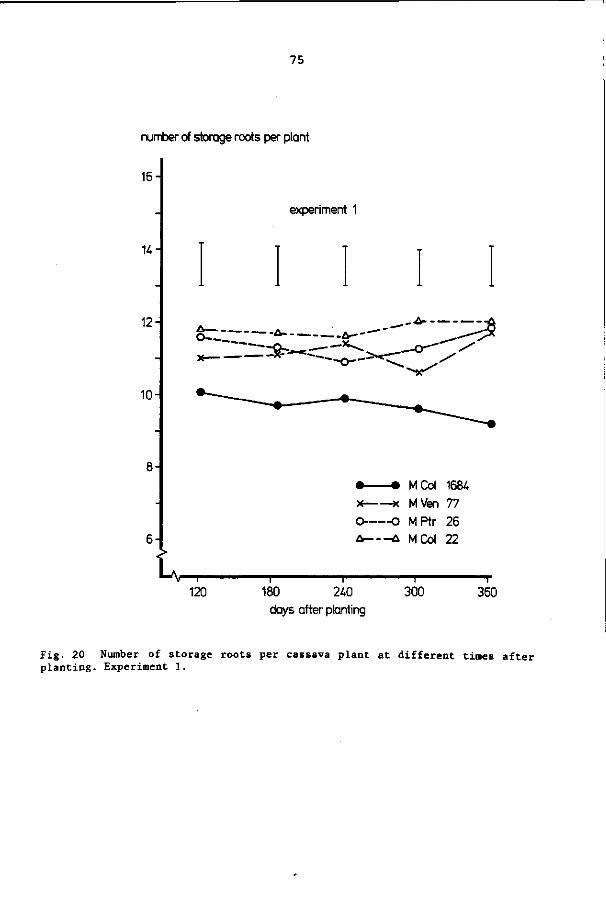
75
number of storage roots per plant
16
U-
12-
10-
6-
experiment 1
.-•£>
O ——zg^—crj
^
• • M Col 1684
x x M Ven 77
O O MPtr 26
ù, A M Cot 22
tw 120 180 240
days after planting 300 360
Fig. 20 Number of storage roots per cassava plant at different times after planting. Experiment 1.
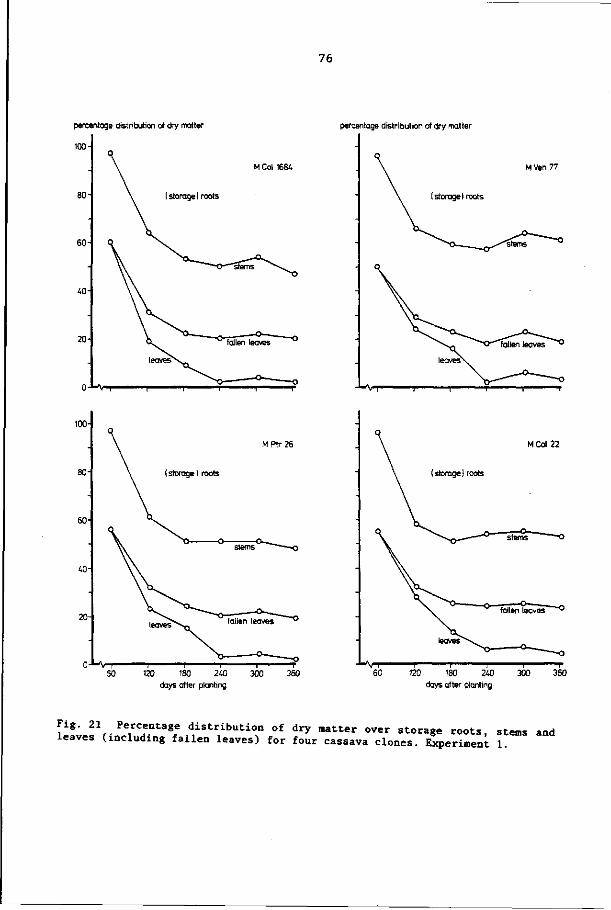
76
percentage distribution of dry matter percentage distribution of dry matter
00-
80-
60-
-
40-
20-
•*r-r—
M Col 1684
\ ( storage ) roots
-O—sterns \ ^
OL fallen leaves
leavesN—
M Ven 77
M r n ~
100-
80-
60-
40-
20-
O-Mr 60
MPtr26
( storage ) roots
120 180 240 300 days after planting
360
M Col 22
(storage] roots
• * - \ I I I I I I 60 120 180 240 300 360
days after planting
Fig. 21 Percentage distribution of dry matter over storage roots, stems and leaves (including fallen leaves) for four cassava clones. Experiment 1.

77
made up an appreciable percentage of the total dry matter yield,
varying from 15.5% to 18.6%, depending on the clone. Plots of the
'real' harvest index against the 'measured' harvest index are shown
in Fig. 22: the difference between these indices is substantial, par
ticularly in the older plants (i.e. more than 8 months). The 'mea
sured' harvest index overestimates the 'real' part of the total dry
matter production that has been stored in the storage roots. At
362 DAP the differences between 'real' and 'measured' harvest index
were on average, 0.10, with a range of 0.07 to 0.11.
In Table 14, the values for A, b and x0 in the non-linear regres
sion equation In y = A + b In (x - x0 ) and the values a and X0 in
the equation In y = a + In (x - X0) are shown for each plot of ex
periment 1, together with the estimates of the variance (s2). The
standard errors for a and X0 were much smaller in the model where b
was assumed to have a value of 1.0, whereas the estimates of the
variance for the different plots were not substantially or system
atically higher for the model In y = a + In (x - X 0 ) . Therefore, the
regression equation In y = a + In (x - X ) is more suitable for
testing differences in cultivars for the efficiency of storage root
production and for the plant weight at which the storage root pro
duction apparently started. If this logarithmic equation is trans
formed to a linear equation, the ea values (the efficiency of storage
root production (ESRP)) are obtained. The ESRP values are presented
in Table 15 for the plots of experiment 1, together with the values
of X0, the crop weight at which storage root production apparently
started (AISS values). Analysis of variance of ESRP and AISS values
shows that MCol 1684 and MPtr 26 had the highest ESRP values; they
were significantly higher than the value of 0.43 found for MVen 77.
Also in this experiment significant clonal differences for AISS were
found; they were lowest for MCol 22 (1.0 t'ha" ). In experiment 2,
MCol 22 also had the lowest AISS value (Table 16). In experiment 3,
MMex 59 had the highest AISS value and the lowest ESRP. The ESRP
values of MMex 59 and MCol 638 were 0.32 and 0.37 respectively.
Relatively large differences in ESPR and AISS values were found for
the same clones in different experiments (Tables 15 and 16).
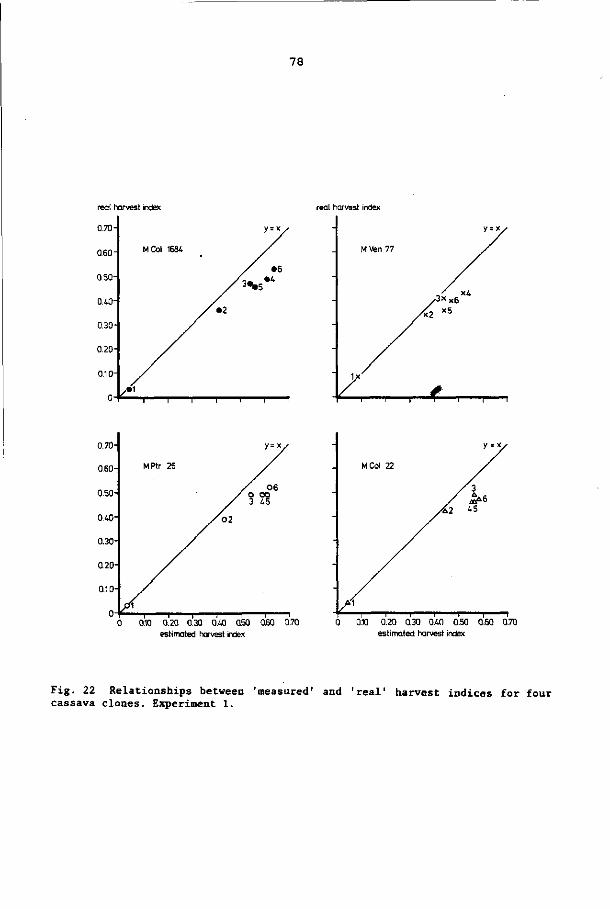
78
real harvest index real harvest index
0.70-
0.60-
0.50-
0.40-
0.30-
0.20-
0.10-
o-<*
M Col
i
1684
/ • I
I
y=y
/ »6 / , _ «4
3,»5
0.70-
0.60-
0.50-
0.40-
0.30-
0.20-
0.10-
o-
MPtr
p\
26
/°2
y = x /
/ 06 3 45
M Col 22
^ , , ,
X.2
v = y
/.3 & 6 45
0 0.10 0.20 0.30 0.40 Q50 Q60 0.70 estimated harvest index
0 0.10 0.20 0.30 0.40 0.50 0.60 0.70 estimated harvest index
Fig. 22 Relationships between 'measured' and 'real' harvest indices for four cassava clones. Experiment 1.
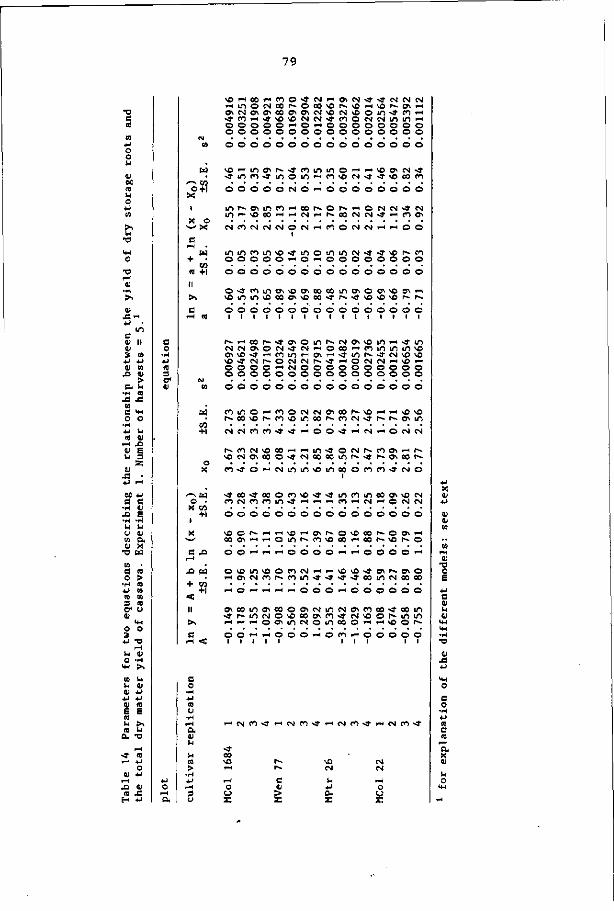
79
• o
s ra a
4-> O
o k l
i l a o to k i 0
j j to
t>. h
t J
MH 0
•o I—( tu
• H
>> <u
J 3 - " * J •
m es V I I A l S (0
4 J 4-> OJ to
X > V
> S . k i • i-I 10 x i j e m
a >H o o
•I-I 4-1 k l a o j
- H X I <u e U 3
ss <u
* J l-H
M 4 J
e e • H u X > E • H - H k l k l U il w 0. V X
•a a
10 •
a ra 0 >
• H 10 4-1 U to t o 3 ra
o1 o V
<H O 0 s 4J t )
c o
• H 4-1
ra 3
er u
u a i
4 J UI E
« k i
ra O i
~ ï i—i
l > •—i X i 10
H
U 4-1 4-1
ra E
>> k i
•o r H to
4-1 O
4-1
n x: 4 J
/-*. en o + i
X
X • w '
c 1-4
+ 10
I I
>> e
o X
l d
c/i +i
co + l
o
o •
+1 I
C/j
+1
s
p. Ol kl
« m o c N j o o r » O M v O r ^ v O f - i v û r ^ O N r - i w N o c A o o o i s i N i e i M i c o i n J d H
O O O O O i - i O > - i O O O O O O O O
o o o o o o o o o o o o o o o o o o o o o o o o o o o ' o o o o o
s O > - i t r > O N r — « 3 , m u " l i / 1 0 ' - « - » \ C C f i < N ^ - j i n n j i n o u i « n i C N - j > » ' e » i » i 0 0 © 0 0 ( M O < - < 0 0 0 0 0 0 0 0
m r ~ e ^ m r o > - i o o r > - o t ~ . i - i O ( s c M J ' C S
« l « \ O 0 0 H H N i i N 0 0 N N - j H n o \
N n c M N N O N H n O N M H M O O
O O O O O — I O - H O O O O O O O O
d o d o o d d d d d d d o o o d
d o o ' o d o d o o d o d o d o d i i i i i i i i i i i i i i i i
N H e o ^ ^ c A O ï / i N N O w o i f l ^ ^ i n N o i w o N ' j N H O < c i m u i i n 1 / n o o > \ D « ^ ' i - i c o i r ) i - i ^ r - i < - i o f ^ < J , c > i \ o \ o v O - a - c M r ^ - o e v i t N l r ^ N ï ' H O C M t S i - i v O i - i O O O O i - i C N O O O O O O O O O O
o o o o o o o o o o o o o o o o d o d o o d o d o d o d o d o d
n m o H t o o t N N a o o M C r t H ^ v o
M M n n - ï - î ' - O O ' J H N r H O N N
i ^ f O c M v O o o i - i t - i m ^ o c N r ^ c O c ^ i - i r ^ ^ O N W f l O O ' Î N Û D W i n N ' J P ^ O l O S N n ^ O H N ^ i / n c i / i c o o r i f i ^ N O
• j t o - n o o c n o ^ - j u i n i n o o o M e N t n N f n t n m ^ H ^ p i t n H N H O N N
d o d d o o d d o d o d o o o d
\ Û O N f H H i f i H O i N O * O O O r ^ O C ^ H o o o \ ' - i ' ^ O i n r ^ n \ D o o > - i o o f - \ o r ~ o
O 0 " - i i - i ' - i O O O O " H i - i O 0 0 0 ' - i
o v o u n o o n N r t H v o i f l ^ m N o v o H o i M n N n i n - j - J ^ - J o o i n N o o »
I - I O ' - ' > - H ' - I - - I O O O - H O O O O O O
C A o o i / i o \ c o o c i M i n i N O M < < i c 0 4 0 3 i n ^ M n N O i o o j o \ n - j N « O M / i i / i ^ H i - i r - i o c ^ m o i o i o o û o - H » - i v o o r ^
O O ' - i ' H O O O ' - i O f O i - i O O O O O
^ C N f j ^ ï ' - i C s I C n N S ' r H C M m ^ i - i C N l r O ^
00 VC
O o s a . S
CM CM
O
u •a o E
QJ X !
a , x n
ki o

80
Table 15 Eff ic iency of s torage root product ion (e ESRP va lues) and crop weight a t which s to rage root product ion apparent ly s t a r t e d (X0 = AlSS-values) of four cassava c lones . Experiment 1. Model: y = e a (x - X0)
cultivar
ESRP
MCol 1684 MVen 77 MPtr 26 MCol 22
F-test LSD (p= 0.
AISS (t'ha
MCol 1684 MVen 77 MPtr 26 MCol 22
F-test
05)
-1)
LSD (p=0.05)
repli
I
0.55 0.41 0.62 0.50
2.6 2.1 3.7 1.4
cation
II
0.58 0.38 0.47 0.52
3.2 -0.1 0.9 1.1
III
0.59 0.50 0.61 0.45
2.7 2.3 2.2 0.3
IV
0.52 0.41 0.55 0.49
2.9 1.2 2.2 0.9
average
0.56 0.43 0.56 0.49
** 0.078
2.8 1.4 2.2 1.0
* 1.27
Table 16 Ef f ic iency of s torage root product ion (ESRP (= e ) ) and the apparent crop weight a t which s to rage roots were i n i t i a t e d (AISS (= XQ)) in s ix cassava c lones . Experiments 2 and 3 .
clone
MCol 1684 MVen 77 MPtr 26 MCol 22 MMex 59 MCol 638
F-test LSD (p=0. 05)
AISS (t •ha
experiment
2.3 2.5 2.5 1.5
** 0.33
-1)
2 experiment 3
2.7
3.3
3.6 1.9
.f—U
0.77
ESRP
experiment 2
0.49 0.53 0.56 0.66
** 0.081
experiment 3
0.64
0.63
0.32 0.37
** 0.062
The r e l a t i on sh ip s between the t o t a l dry matter y i e ld and the l eaf y i e ld and the stem y i e ld r e spec t ive ly of the clones used in expe r i ment 2 were a lso s tud ied . F ig. 23abcd shows the p a r t i t i o n i ng of dry
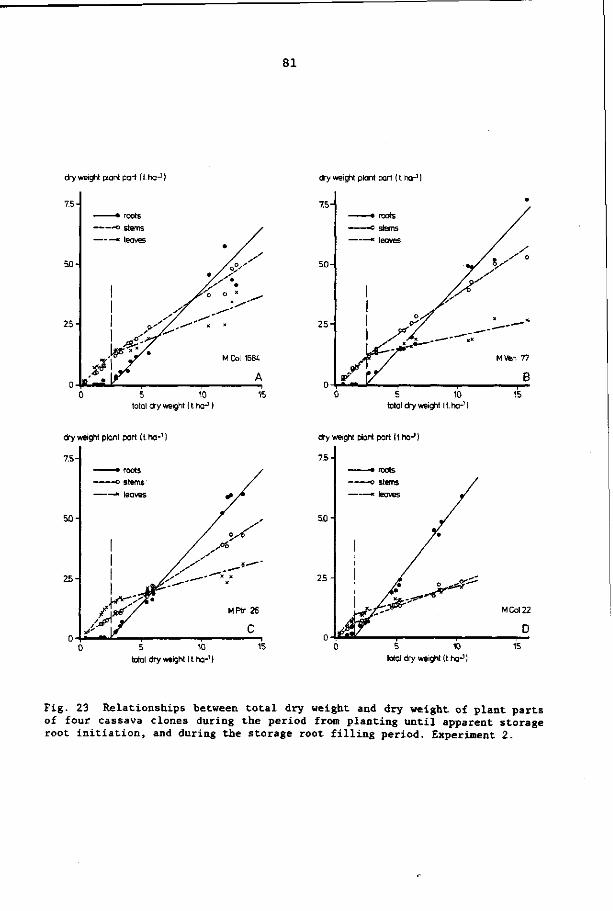
81
dry weight plant part (t.ha-1 )
7.5
dry weight plant part ( t. ha-1 )
0 5 10 total dry weight ( t ha-1 )
7.5-
50-
2.5-
n-
* roots
-o stems
* leaves
I I
I p'/
rf/
•
x X.
M ven 77
B
5 10 total dry weight (t. ha-1 )
15
dry weight plant part (t. ha-1 )
7.5
dry weight plant part It ha-')
7.5-
5 10
total dry weight I t.ha-11
0 5 10 total dry weight It.ha-1)
Fig. 23 Relationships between total dry weight and dry weight of plant parts of four cassava clones during the period from planting until apparent storage root initiation, and during the storage root filling period. Experiment 2.

82
matter over the leaves, stems and roots from the moment that the
storage roots were apparently initiated. Therefore in all cases the
general regression equation In y = a + In (x - X0) was fitted to the
data.
Fig. 23abcd also shows the partitioning of dry matter during the
period before the initiation of the storage roots. The lines were
fitted by eye. From the moment that the storage roots were apparent
ly initiated a lower percentage of produced dry matter was allocated
to the leaves and the stem or stems.
7.4 DISCUSSION AND CONCLUSIONS
Phase until the apparent initiation of storage roots
The formation of storage roots began some time between 73 and
88 DAP for the clones used in experiment 2 and between 62 and
123 DAP for these same clones in experiment 1. (A storage root was
defined as a root with a diameter of at least 1.0 cm). Wholey and
Cock (1974) reported that several clones of the CIAT germ plasm bank
already had storage roots two months after planting. In that study,
however, the definition of a storage root was not specified. The
factors causing storage root initation in cassava are not yet well
understood. The factors that cause tuber initiation in other plants
e.g. potato are not understood either (Lovell and Booth, 1967). In
cassava no clear changes in plant growth habit occur in the above-
ground parts during the period when storage roots are apparently
initiated (Chapter 6). Significant clonal differences in plant
weight existed at the apparent start of storage root formation
(Tables 15 and 16). De Bruijn (1982) reported significant dif
ferences in the plant weight at which storage root formation
apparently started for cassava cultivated under widely differing
environmental conditions. The scion as well as the stock of dif
ferent cassava clones appears to influence the plant weight at
which storage root formation apparently starts (Veltkamp, 1985).
Krochmal and Samuels (1970) found that high nitrogen levels promoted
top growth and prevented storage root formation. In Chapter 8 the
effects of daylength on phenomena such as the initiation of storage
roots and the partitioning of dry matter are discussed.

83
During the period from planting the cuttings until the apparent
initiation of storage roots it seems the pattern of partitioning of
dry matter over the plant parts remains constant (Fig. 23abcd). A
similar dry matter distribution pattern has also been reported for
potato (Wittenrood, 1958) and sugarbeet (Van der Sande Bakhuysen,
1950).
Number of storage roots per plant
In experiment 1 it was shown that by 123 DAP the storage roots
had reached their final number (Fig. 20). These results are similar
to those obtained by other authors (Hunt et al., 1977). On the other
hand, in a few clones, Wholey and Cock (1974) observed an increase
of the number of storage roots up to seven months after planting.
They did not mention, however, whether the increase was statisti
cally significant. This also holds for data presented by Soetono et
al. (1982), who observed an increase until the last harvest at
60 weeks after planting. De Bruijn (1982) observed that the number
of storage roots increased slightly but significantly with time,
the most important increase taking place between 12 and 15 months.
Cours (1951) also reported an increase in the number of storage
roots for one-year-old plants after a cold, dry season with low
growth activity, at the onset of a second period of root filling.
The factors influencing the number of storage roots of cassava
are not well understood. Orioli et al. (1967) observed a positive
effect of fertilization on the number of storage roots. Environmen
tal conditions significantly influenced the number of storage roots
in a study by De Bruijn (1982). Comparing Mukibat cassava (Manihot
glaziovii grafted onto ordinary cassava) with ordinary cassava,
Soetono et al. (1982) found that, in general, Mukibat cassava had
slightly more storage roots than ordinary cassava. In dense popula
tions, plants have fewer storage roots per plant than at lower plant
densities (Enyi, 1972a; Cock et al., 1977; Soetono et al., 1982).
The number of shoots per plant was found to influence the number of
storage roots per plant, there being more storage roots when plants
had more than one shoot (Enyi, 1972ac).
84
Harvest index
Data on harvest index are shown in Fig. 21 for experiment 1.
Boerboom (1978a) stated that with increasing total dry weight the
values of the relation between the total dry weight and the harvest
index approach the values of the efficiency of storage root produc
tion, as also recently shown by De Bruijn (1982), who concluded that
this is mathematically evident because of the decreasing relative
importance of the AISS.
Usually, researchers presenting data on harvest index record the
ratio of weight of storage roots to the weight of the standing crop
(e.g. Kawano et al., 1978; Cock, 1976; De Bruijn, 1982), and ignore
the weight of the leaves shed during the growth period. As mentioned,
for experiment 1 the weight of the fallen leaves at 362 DAP amounted
to 15.5% to 18.6%, of the total dry matter yield, depending on the
clone.
The difference between the 'real' and the 'measured' harvest in
dices increased with plant age (Fig. 22), because the amount of
fallen leaves increased. The relationship between the 'real' and
'measured' harvest index is not consistent and there is not a sys
tematic bias between the two, at least not for plants of approxi
mately 10 to 12 months old, as reported by CIAT (1978). Therefore,
for realistic estimations of the harvest index or the efficiency of
storage root production, it is necessary to include the weight of
the fallen leaves too. This implies that the harvest index will be
based on a dry weight basis. The 'measured' harvest indices reported
in the literature are usually calculated from fresh weight (e.g.
Kawano et al., 1978), and therefore are again removed from reality,
because of the differences in dry matter content of the different
plant parts.
Partitioning of dry matter after the initiation of storage roots (
The partitioning of dry matter during the storage root filling
period for the experiments reported in this study could be ade
quately described by the linear model In y = a + In (x - X0 ) or
equivalently y = ea (x - X 0 ) . For each field the efficiency of stor
age root production (ea)(ESRP) and the plant weight at which storage
roots were apparently initiated (X0) could be calculated, enabling
85
a clonal selection to be made for ESRP for each statistical design
chosen. Significant clonal differences in ESRP were found (Tables
15 and 16). The ESRP value is largely stock-determined, but a sig
nificant scion effect was also found. When used as a scion, culti-
vars such as MMex 59 and MCol 638, which have LAI values of 4 and
more for much of the growth period (Fig. 14) induced lower ESRP
values than the less leafy cultivar MCol 1684 (Veltkamp, 1985).
There are several suggestions in the literature that the trans
location of assimilates in plants is controlled hormonally: The
greater part of the discussion relates to hormones released from
sinks (Moorby, 1968). Gifford and Evans (1981) concluded, however,
that hormonal influences have not yet been sufficiently defined for
generalizations in relation to assimilate partitioning to be made.
86
8 GROWTH, TOTAL DRY MATTER YIELD AND ITS PARTITIONING IN CASSAVA
AT DIFFERENT DAYLENGTHS
8.1 INTRODUCTION
Cassava is cultivated between latitudes 30°N and 30°S. The most
northerly regions where cassava is cultivated are the coastal area
of the southern states of the USA (Tan and Bertrand, 1972) and the
southernmost provinces of China (Anonymous, 1979). In the southern
hemisphere the most southerly regions where cassava is still of im
portance are in South America in the provinces of Missiones and, to
a lesser extent, Corrientes, in northern Argentina (Henain and Cenoz,
1968), in Africa in the northern part of Natal province in South
Africa (Daphne, 1980), while in Australia cassava is cultivated on
a limited scale in Queensland, at least as far as 26°S (Hammer, 1980)
Most of the area planted with cassava, however, lies between 15°N
and 15°S (Cock and Rosas, 1975). Jones (1959) suggested that this
limited distribution was related to negative effects of daylength
on the growth and storage root yield of cassava.
Literature on the effects of daylength on growth and storage root
yield of cassava is limited (Bolhuis, 1966; Lowe et al., 1976; In
dira and Ramanujam, 1979; Keating, 1982).
At the Centro Internacional de Agricultura Tropical (CIAT) in
Cali, Colombia, preliminary research under field conditions on the
effects of daylength on storage root yield and harvest index of cas
sava was started in 1972. An extensive study of the effects of day-
length on growth and on total and storage root dry matter yields
was conducted in 1980-1981. Two similar experiments were carried
out in a greenhouse at the Department of Tropical Crops of the Agri
cultural University in Wageningen, The Netherlands. The results of
these investigations are reported in this chapter.
8.2 MATERIALS AND METHODS
Three experiments were conducted. The first one (experiment 4)
was a field experiment and was carried out on the CIAT experimental

87
farm in Palmira, near Cali (Colombia). Meteorological data and some
general experimental procedures have been described in Chapter 3.
The other two experiments (experiments 5 and 6) were conducted in a
greenhouse at the Department of Tropical Crops, Agricultural Univer
sity in Wageningen, The Netherlands.
Experiment 4 Three clones, MCol 1684, MPtr 26 and MCol 22, were
grown under two daylengths, the natural daylength at CIAT and a day-
length of 16 h that was held constant during the whole growth period.
Data on the natural daylength at CIAT were calculated from data pre
sented by Francis (1972) and are shown in Fig. 24.
For this experiment an area was divided into two blocks, each
30 m x 38 m, and separated by a 15 m-wide strip. Fig. 25 shows a
general view of a part of the experimental area. In one block an
installation was constructed to prolong the natural daylength. Two
rows of concrete poles with a height of 5-6 m above the soil level
were placed 38 m apart. Each row contained 7 poles, spaced 5 m apart.
Wires were strung across the field from pole to pole. On the wires
300 W incandescent bulbs were hung at 5 m intervals in a triangular
pattern. In all, there were 53 light bulbs on this part of the experi
mental area. The distance between the light bulbs and the soil level
at planting was about 2 m. With this distance between the bulbs and
the soil level a minimum light intensity of 25 lux (measured with a
Toshiba SPI-7 photocell illuminometer) was reached over the whole
block. This is substantially more than the minimum light intensity
of 10 lux required for a daylength effect on cassava (Cock, unpub
lished results). During the first six months of the growth period a
distance of about 2 m was maintained between the light bulbs and
the tops of the plants, by raising the wires on which the bulbs were
strung. Because of large clonal differences in plant height this
distance could not be fully maintained above the taller clones in
the last part of the growth period.
The illuminated block and the control block were 15 m apart: at
that distance the light intensity was practically zero at soil level
in the first row of the control block. For added protection six rows
of cassava and a 2 m-wide strip of tall maize were planted between
the experimental blocks at the same time as the cassava, to prevent
the artificial light from influencing the plants of the control block
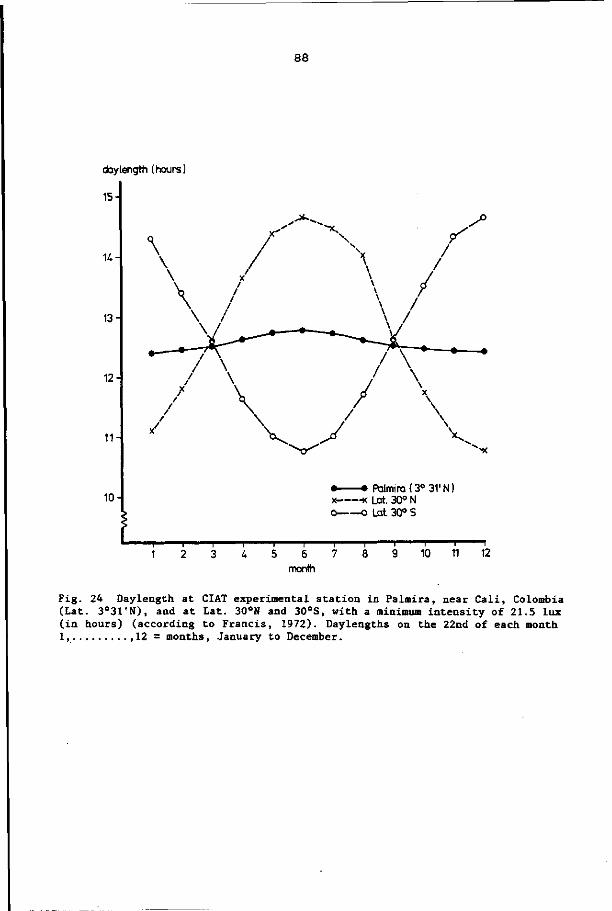
88
daylength ( hours )
15-
U -
13-
12-
11-
10-
\ \
\ x
\ /
- > - ^ "X . s /°
/
\ \ V J
\ \ \ \ \
\ \ \
/ /
/ /
/
/ /
/
\ - — ~ ^ _ \ \
X \ \ \
Palmira (3° 31' N) x -x bat. 30° N o——o bat. 30° S
10 11 6 month
12
Fig. 24 Daylength at CIAT experimental station in Palmira, near Cali, Colombia (Lat. 3°31*N), and at Lat. 30°N and 30°S, with a minimum intensity of 21.5 lux (in hours) (according to Francis, 1972). Daylengths on the 22nd of each month 1, 12 = months, January to December.
89
•
Fig. 25 General view of the experimental area, with plants grown at natural day-length on the left.
•A
^00^'--''"''''
Fig. 26 A view of part of the experimental site in the greenhouse.
90
with the natural daylength.
Planting was on 24 June 1980. Plot size per clone per daylength
and per replication within each block was 7 m x 15 m. Clones were
replicated three times per plot. There were three harvests. Six
plants per plot were sampled on the harvests at 86 and 177 DAP and
nine on the last harvest at 272 DAP. A preliminary harvest consis
ting of three plants per clone and three replications was done at
51 DAP.
At 78 and 123 DAP, leaf blades that had just expanded fully were
collected (one per sample plant) for diagnosis of the nutritional
status of the crop. Samples were analysed for N, P, K, Ca and Mg.
At 52, 83, 108, 133, 159, 176, 205, 238 and 265 DAP, plant height,
number of newly formed nodes per apex, number of nodes to different
branch levels, and the number of active apices were measured. These
measurements were only carried out on the sample plants that had
been earmarked for the final harvest. Individual leaf size of the
youngest fully expanded leaves was calculated at regular intervals
(approximately once a fortnight), according to a method described
in Chapter 3. To ascertain individual leaf life during the growth
period, young leaves about 1 cm long (one per sample plant) were
tagged with a label also approximately once every 14 days. Fallen
tagged leaves were collected weekly for calculating the leaf life.
Light measurements were carried out at 83, 105, 127, 157, 176, 204,
237 and 272 DAP. LAI was calculated on the harvest dates (51, 86,
177 and 272 DAP). On harvesting plants were divided into leaves,
stems and roots (including storage roots), and bulked per plot. Dry
weights of all plant parts were determined. Weekly, fallen leaves
were collected, dried and weighed.
To study the distribution of dry matter the regression equation
In y = a + In ( x - X 0 ) [ y = e ( x - X 0 ) ] was used (see Chapter 7).
In this equation ea represents the efficiency of storage root pro
duction (ESRP) and X0 the crop weight at which the storage root
production apparently started (AISS).
91
Experiment 5* First greenhouse experiment. In this experiment the
effects of a daylength of 11 h or 14 h on the growth and production
of four cassava clones, MCol 1684, MPtr 26, MCol 22 and Llanera,
were studied. Plants were grown in a greenhouse, in trucks on rails,
so they could be transferred into and out of dark sheds. At both
daylengths, plants were grown under natural light conditions for
9 hours per day, supplemented with 2 or 5 hours of low intensity
light from luminous tubes and incandescent bulbs in the dark sheds.
The equipment for supplementary light was operated by electric time
switches. Each truck (1.8 m x 1.6 m) was divided into four by wooden
partitions, and one cutting was planted per compartment in a mixture
of sand and humus. A view of a part of the experimental site is
shown in Fig. 26.
Cuttings were planted on 25 October 1980. Because of the low light
intensity in the winter season the daily 9 h period of natural day
light was boosted with 'daylight' lamps. Harvesting took place on
2 March 1981, 127 DAP, because the plants of some clones had then
grown so high that the daily transfer to and from the dark sheds
caused insuperable problems. Average weekly temperature varied from
24° to 26°C during the day and from 21° to 23°C during the night.
Observations and measurements of plant height, number of living
leaves per apex, number of fallen leaves per apex, occurrence of
branching and number of apices were carried out. At harvest the
plants were divided into leaves, stems and roots including storage
roots. Total leaf area per plant was determined by a Licor auto
matic leaf area meter. To ascertain the dry weights of the different
plant parts the whole root fraction was dried, as well as subsamples
of the other parts, at 105°C in a forced-draught oven.
Experiment 6 Second greenhouse experiment. This experiment was car
ried out in the same trucks as described for experiment 5. The ex
perimental design and procedure were the same as in experiment 5,
except that Llanera was replaced by Betawi, a clone that had been
used by Bolhuis (1966) in daylength studies. Four cuttings from
each clone were planted on 23 March 1981. They were harvested in
* This experiment was carried out by Mr. F. van den Bosch, as partial fulfilment for a 'doctoral' (M.Sc.) study on tropical crop husbandry
92
the period 27-30 July 1981, i.e. at circa 127 DAP; thus the duration
of growth of these plants was the same as that of plants in experi
ment 5. During daytime the plants were not supplemented with addi
tional light, because this experiment was conducted in the summer
season at a much higher radiation level. Average weekly temperature
varied from 25° to 29°C during the day period and from 21° to 24°C
during the dark period.
Measurements on plant height, leaf formation rate per apex, num
ber of fallen leaves per apex, number of apices, branching pattern
and leaf size were carried out. Leaf size was measured using the
technique described in Chapter 3. Young leaves (about 1 cm long)
were tagged and the central lobe length was measured 14 days after
tagging. At final harvest dry plants were divided into leaves, stems,
cuttings and storage roots, and then dried before being weighed.
8.3 RESULTS
Experiment 4 Plants germinated well and showed uniform initial
growth. No visible differences were observed in the initial growth
of the plants in the two main blocks under natural daylength and
under 16 h daylength. By 52 days after planting the plants experi
encing 16 h days were taller than those experiencing the natural
days. These differences continued to increase until final harvest
(Fig. 27). LAI was similar in natural and 16 h treatments at 51 DAP
and 86 DAP but thereafter was greater in the plants grown under 16 h
days (Fig. 28). The increased LAI under 16 h days could not have
resulted from changes in leaf size because this parameter was not
significantly different between light treatments at any harvest.
For all clones the number of leaves formed per apex was similar
in natural and 16 h days up to about 150 days after planting. There
after the number of leaves per apex was greater under 16 h days in
MPtr 26 and MCol 1684, but hardly any effect of 16 h daylength was
found in MCol 22 (Fig. 29). The total number of leaves formed per
plant depends not only on leaf formation rate per apex, but also on
apex number per plant, i.e. on branching pattern. MCol 22 and
MPtr 26 branched earlier under 16 h days (Table 17), but the num
ber of branches was the same in natural and 16 h days at the first
branch level (Table 17). The interval between first and second

93
plant height (cm)
250-
200
150-
100-
50-
MCol 1684 _ o — o
natural daylength 16 hours
60 120 180 240 300 days after planting
plant height (cm )
250-
MPtr 26
200'
150-
100 H
50-
o-V
_ - o ^
natural daylength 16 hours
0 60 120 180 240 300
plant height (cm]
250-
MCol 22
200-
150-
100-
50- /f * — * natural daylength / / û — A 16 hours
I I I I I 60 120 180 240 300
days after planting
days after planting
Fig. 27 Effect of daylength on plant height of three cassava clones at different
times after planting.
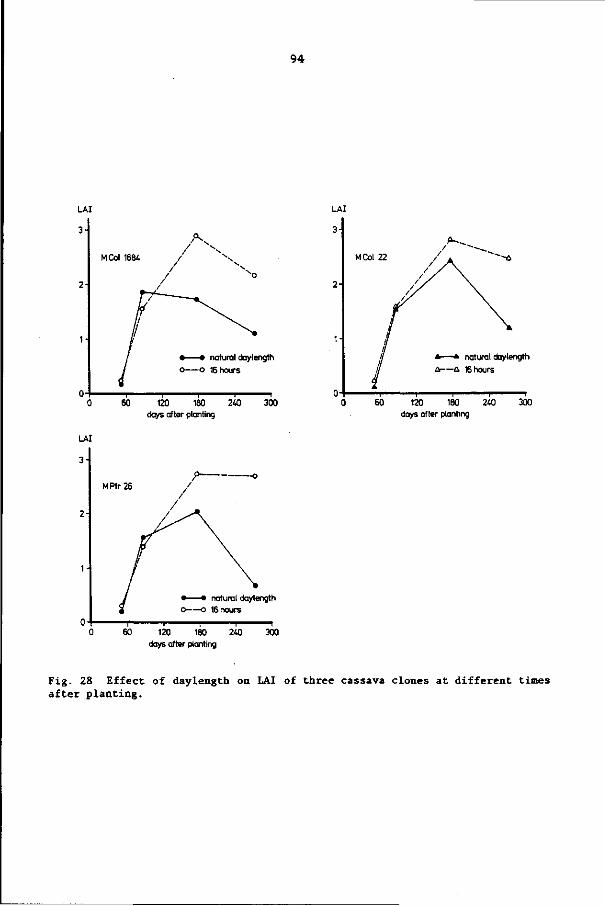
94
LAI
3
2-
MCol 1684
natural daylength o ~ o 16 hours
60 120 180 240 300 days after planting
LAI
3-P-^
natural daylength £ — ^ 16 hours
0-1 1 1 1 1 1 0 60 120 180 240 300
days after planting
LAI
3-
2-
MPtr26
natural daylength 16 hours
~ ~ 60 120 180 240 300 days after planting
Fig. 28 Effect of daylength on LAI of three cassava clones at different times
after planting.
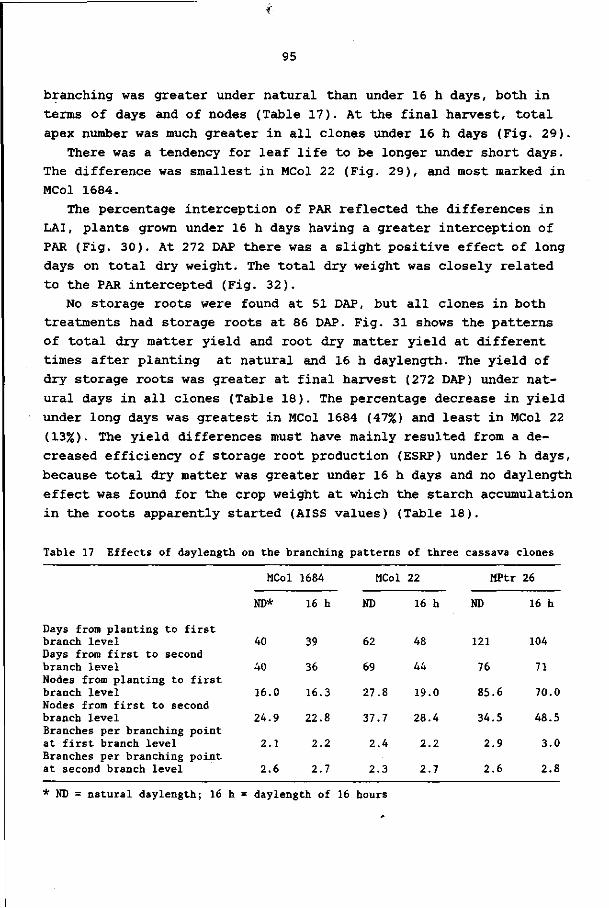
95
branching was greater under natural than under 16 h days, both in
terms of days and of nodes (Table 17). At the final harvest, total
apex number was much greater in all clones under 16 h days (Fig. 29).
There was a tendency for leaf life to be longer under short days.
The difference was smallest in MCol 22 (Fig. 29), and most marked in
MCol 1684.
The percentage interception of PAR reflected the differences in
LAI, plants grown under 16 h days having a greater interception of
PAR (Fig. 30). At 272 DAP there was a slight positive effect of long
days on total dry weight. The total dry weight was closely related
to the PAR intercepted (Fig. 32).
No storage roots were found at 51 DAP, but all clones in both
treatments had storage roots at 86 DAP. Fig. 31 shows the patterns
of total dry matter yield and root dry matter yield at different
times after planting at natural and 16 h daylength. The yield of
dry storage roots was greater at final harvest (272 DAP) under nat
ural days in all clones (Table 18). The percentage decrease in yield
under long days was greatest in MCol 1684 (47%) and least in MCol 22
(13%). The yield differences must have mainly resulted from a de
creased efficiency of storage root production (ESRP) under 16 h days,
because total dry matter was greater under 16 h days and no daylength
effect was found for the crop weight at which the starch accumulation
in the roots apparently started (AISS values) (Table 18).
Table 17 Effects of daylength on the branching patterns of three cassava clones
Days from planting to first branch level Days from first to second branch level Nodes from planting to first branch level Nodes from first to second branch level Branches per branching point at first branch level Branches per branching point at second branch level
MCol
ND*
40
40
16.0
24.9
2.1
2.6
1684
16 h
39
36
16.3
22.8
2.2
2.7
MCol
ND
62
69
27.8
37.7
2.4
2.3
22
16 h
48
44
19.0
28.4
2.2
2.7
MPtr
ND
121
76
85.6
34.5
2.9
2.6
26
16 h
104
71
70.0
48.5
3.0
2.8
* ND = natural daylength; 16 h = daylength of 16 hours
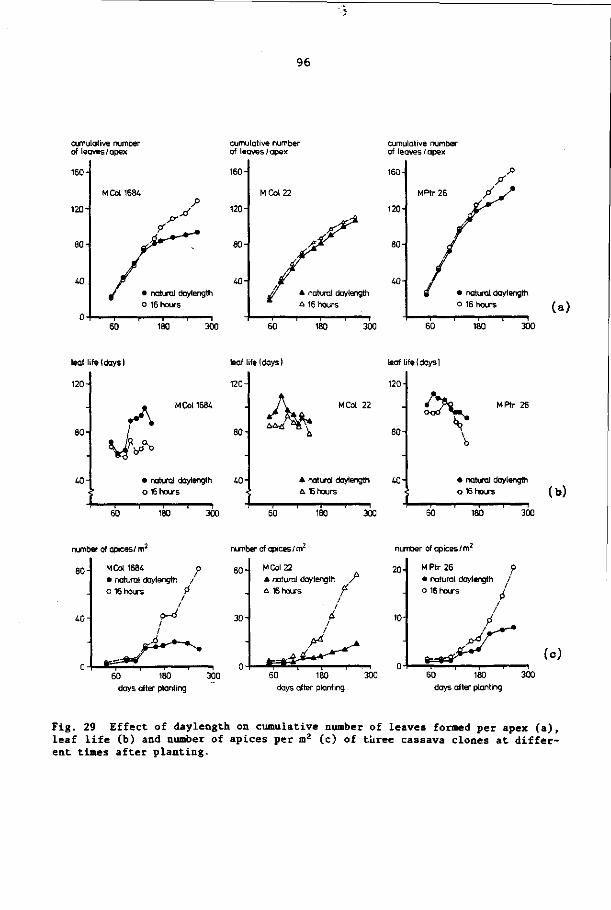
96
cumulative number of leaves/apex
160
120-
80
40
M Col 1684 P
^ ?
• natural daylength
o 16 hours
cumulative number of leaves/apex
160-
120
80
40-
M Col 22
cumulative number of leaves /apex
160-
120-
80
40-
à. natural daylength û 16 hours
MPtr 26
• natural daylength
o 16 hours (a )
60 180 300 60 180 300 60 180 300
leaf life (days I
120-
80-
40-
leaf life (days I
120-
v^ M Col 1684
80
1 • natural daylength 40-o 16 hours
60 180 300
leaf life (days I
120-
Ä& Cot 22
i 80-
* natural daylength 40 û 16 hours
OocC MPtr 26
V
60 180 300
• natural daylength
o 16 hours ( b )
I I I I i 60 180 300
number of apices/ n r
M Col 1684
number of apices / rrr number of apices/m2
• natural daylength / o 16 hours 0
60 -
.
30-
0 -
M Col 22 * natural daylength /
A 16 hours f 1
1
/ /
A = * ^ * ^ É r ^ ^
20-
10-
M Ptr 26 o • natural daylength / o 16 hours i
P*J (o )
days after planting
60 180 300
days after planting
60 180 300
days after planting
Fig. 29 Effect of daylength on cumulative number of leaves formed per apex (a), leaf life (b) and number of apices per m* (c) of turee cassava clones at different times after planting.
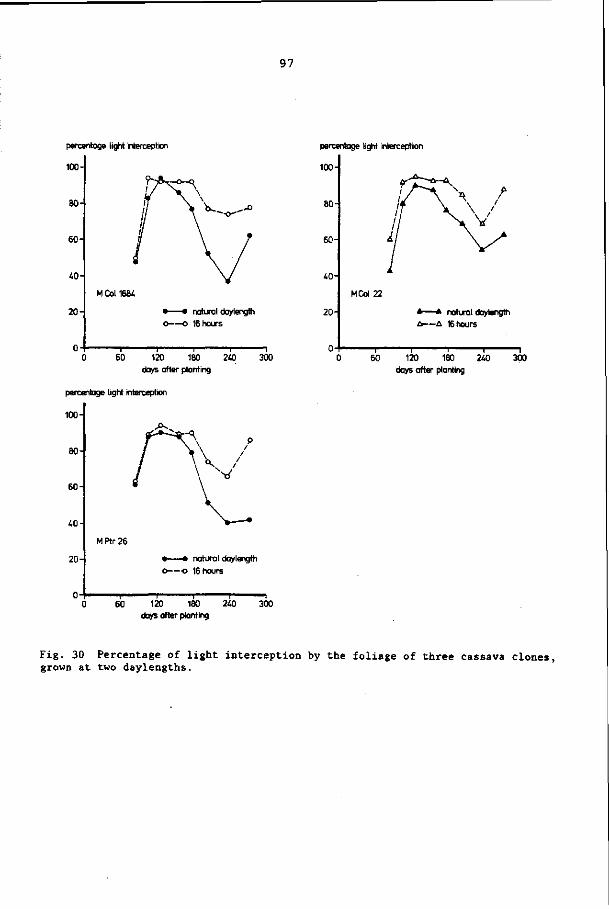
97
percentage light interception
100-
80-
percentage light interception
60'
40 H
20-
M Col 1684
natural daylength 16 hours
I I I I I 0 60 120 180 240 300
days after planting
percentage light interception
100-
80-1
60-
40 H
20-
MPtr26
—• natural daylength
—o 16 hours
OH 1 1 1 1 1 0 60 120 180 240 300
days after planting
00-
80-
60-
40-
20-
0-
MCol 22
7 \
* — * natural daylength £ — A 16 hours
1 1 1 I 60 120 180 240 300
days after planting
Fig. 30 Percentage of light interception by the foliage of three cassava clones, grown at two daylengths.
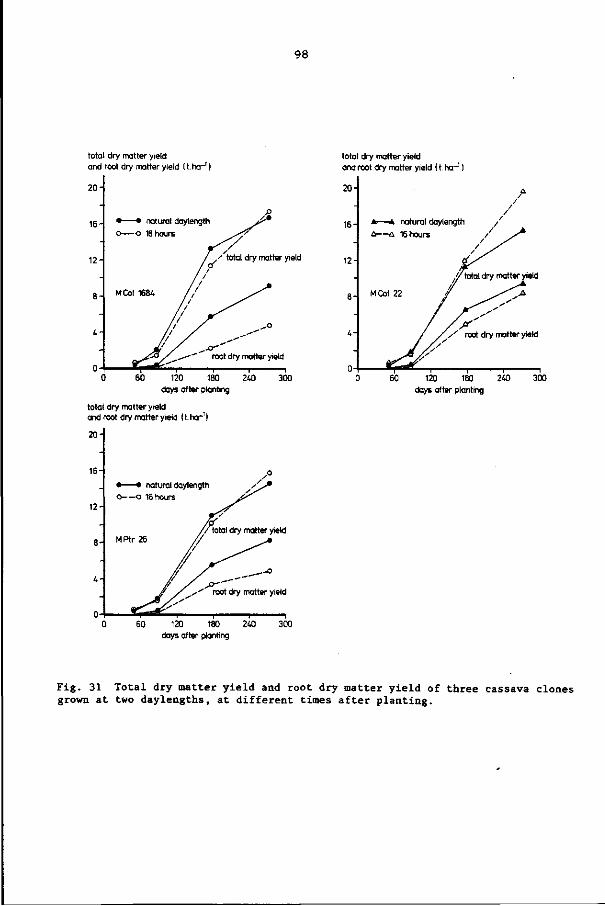
98
total dry matter yield and root dry matter yield I t .ha-' I
' total dry matter yield
days after planting
total dry matter yield and root dry matter yield ( t. ha-'!
20
* • natural daylength o— —o 16 hours
12-1
MPtr26 / total dry matter yield
-a
f s ' ' root dry matter yield
60 120 180 203 300 days after planting
total dry matter yield and root dry matter yield ( t. ha-' )
20-
days after planting
Fig. 31 Total dry matter yield and root dry matter yield of three cassava clones grown at two daylengths, at different times after planting.
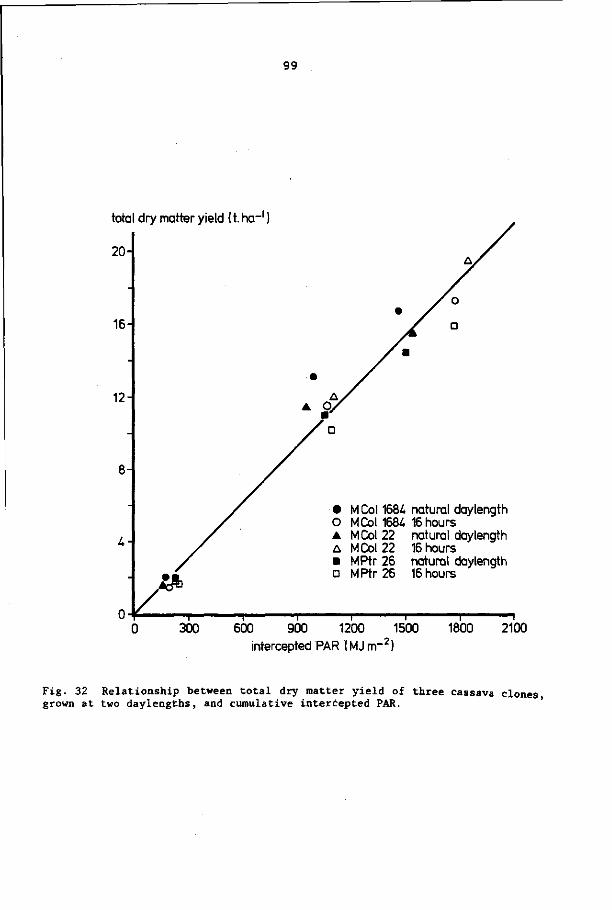
99
total dry matter yield ( t. ha-1
20
16-
12-
M Col 1684 natural daylength M Col 1684 16 hours M Col 22 natural daylength M Col 22 16 hours MPtr 26 natural daylength MPtr 26 16 hours
0 300 600 900 1200 intercepted PAR ( M J rrr
1500 1800 2100
Fig. 32 Relationship between total dry matter yield of three cassava clones grown at two daylengths, and cumulative intercepted PAR.
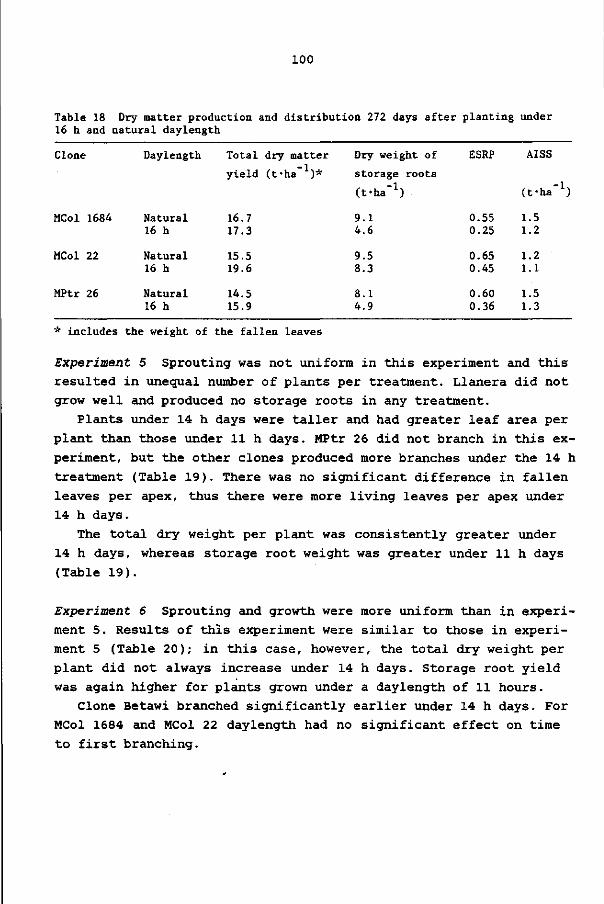
100
Table 18 Dry matter production and distribution 272 days after planting under 16 h and natural daylength
Clone
MCol 1684
MCol 22
MPtr 26
Daylength
Natural 16 h
Natural 16 h
Natural 16 h
Total
yield
16.7 17.3
15.5 19.6
14.5 15.9
dry
(t-
matter
ha' ' ) *
Dry weight of
storage roots
(fha"1)
9.1 4.6
9.5 8.3
8.1 4.9
ESRP
0.55 0.25
0.65 0.45
0.60 0.36
AISS
(fha-1)
1.5 1.2
1.2 1.1
1.5 1.3
* includes the weight of the fallen leaves
Experiment 5 Sprouting was not uniform in this experiment and this
resulted in unequal number of plants per treatment. Llanera did not
grow well and produced no storage roots in any treatment.
Plants under 14 h days were taller and had greater leaf area per
plant than those under 11 h days. MPtr 26 did not branch in this ex
periment, but the other clones produced more branches under the 14 h
treatment (Table 19). There was no significant difference in fallen
leaves per apex, thus there were more living leaves per apex under
14 h days.
The total dry weight per plant was consistently greater under
14 h days, whereas storage root weight was greater under 11 h days
(Table 19).
Experiment 6 Sprouting and growth were more uniform than in experi
ment 5. Results of this experiment were similar to those in experi
ment 5 (Table 20); in this case, however, the total dry weight per
plant did not always increase under 14 h days. Storage root yield
was again higher for plants grown under a daylength of 11 hours.
Clone Betawi branched significantly earlier under 14 h days. For
MCol 1684 and MCol 22 daylength had no significant effect on time
to first branching.
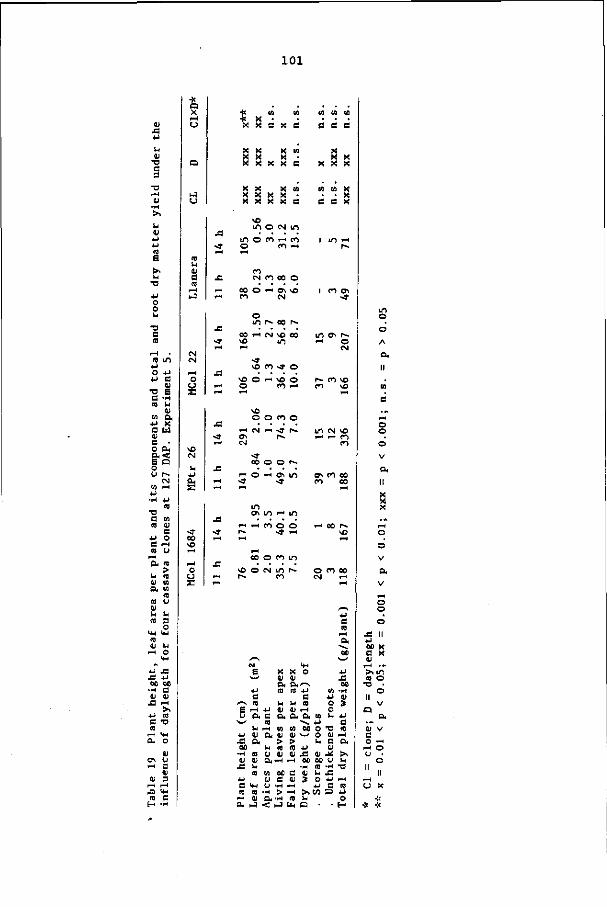
101
Ol -a 4-1
« 01 •o e 3
•o i—t Ol
'H
>> W Ol
4 J 4-1 CO
E
>> IM
•o 4J O O
u •c c ID
r U • co ID
4 J O *-> •p e
Ol •O E C -H ra u
V 10 Cu
4 J X C M oi e • O OH
g . < E n o O r »
CM to i - i
4J • H 4 J
« • a C co RS Ol
e 4-1 O e r u co o
i—i
a m > >H n
t l 10
a, a co ra o 01 u u co 3
o Uu U H
10 01 u
r H O Uu
r
4J J = x : 4-1
so oo • H C 01 01
X ! r H
>> 4 J CO
e -o co
r-4 4-1 Ou O
01 ON o ru c
01 01 3
r H i—1 X > Uu co C
H -H
% X I—1
o
Q
h l
o
01
e CO
r H r ü
<N CM
i—1 O
CJ
s
NO <N
lu 4-1 OH S
<• CO NO 1—4
r H
o o s
x i
<• t - H
xs r H
*"*
X I
-» r H
X i
t - H
i—1
X !
•3 i—f
x: i - H
J=
-» i—t
X !
r H
1—4
•k « co •Î* X • * X X 3 !< e
X X X <n X X X •
x x x x e
X X X 09 X X X X •
x x x x a
NO i n O N i n
m o en 4-4 co O CO 4-4 4—t
CO CM co e» o
0 0 O 4-4 O N NO CO CM
O i n N o o r s
t • • i
CO r u CM NO 0 0 vc i n 4—4
~ ï NO co »» o
• * • • NO O r u N O O O CO 4-4 4—1
NO O O CO o
r H CM 4-4 » f f ^ ON r -CM
~J oo o o r^
r H O r H ON IT I -3- > ï 4—4
i n ON m 4-4 m
r H r H CO O O r*- * * r H 4—t
oo o co m
* O N i O N r— CO
,—\ M UU E X X O
N _ - oi 01 0 4 & * - >
4-1 CO CO 4-1
e a r \ a lu U CO E r U 4-1 01 01 r U
u a c a a a N—' CO » - . u H CO (9 0 0
4-1 01 O H 01 01 N—' X! Cu > > 0 0 U CO CO 4J
• H CO 01 01 01 JS 01 0> B 4 4 - 4 r U 0 0
X i M - H co w oo e tu
4J oi e oi 3 O - H U U r l
. u n «
C C C
X X X
X X X
CO M X • • X
es e x
1 i n r H r*-
1 CO ON
»»
m ON r~»
—< o CM
I— CO NO CO NO
r H
m CM NO r u r H CO
CO
O N CO 0 0 CO 0 0
H oo r -NO
O CO 0 0 CM r u
r H
/-\ 4-1 S co
4-4 0 .
\ oo
4-1
x: 00
CO - H 4-> 01 O » O
a u u 4J c
c o « O 01 r U
u o eu 01
01 M >, oo u lu CO -r4 T 3 u si 0 4-1 P—t
4-1 C CO CO CO - r i > —1 > < V 1 3 > 1
r H 01 CU - H CO SU O H 1-5 < r J t u O
o • • H
m o o A
Cu
II
. (0
e
*«> 1—4
O
o o V
O H
II
X X X
• *> r -H
O
O
V
o. V
r u O
o o
x: M 4-1 OO X
e x <U
r U • -t x m
m o •V •
o n
V
a o,
01 V
e O r H
r H O U •
O II
II r U CJ X
-J; * -it
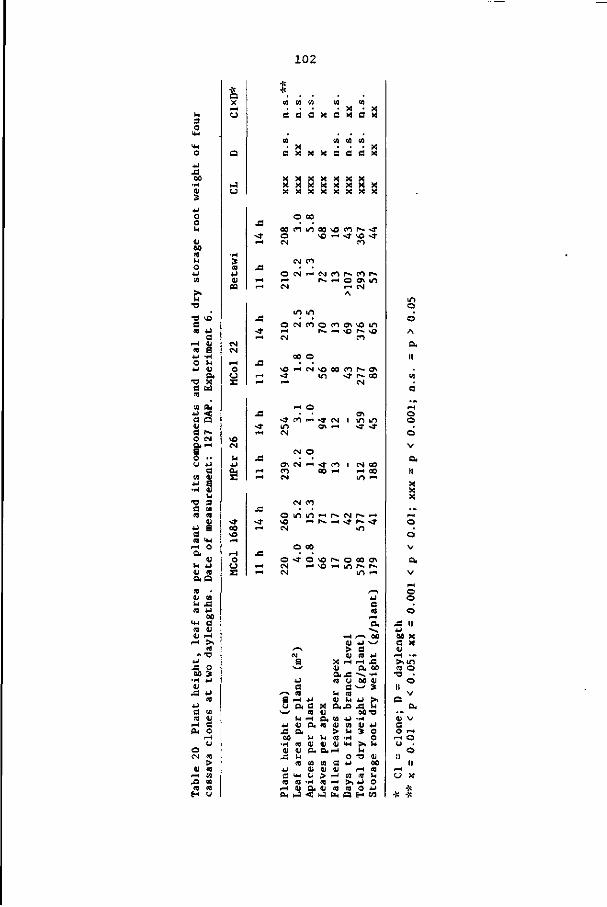
1 0 2
x
oo
o o u tu oo
-o \o a a u a
n tu to E 4J -H O h 4-1 0J
p . •o X e i d co M O H
4J < a a <u C t-> O «M
î-o •• U 4-1
e 4J S •H U
U Ti a
ai co Q . Q
05 • tU U h j = a 4->
oo m e a <u CU i-l
r i > , co
u •a o so »
•ri 4J U
J= 4J co
4J
CO u r i e eu o
o CM CO
10 to H O
ai
CM tN
O O
VO CM
X -*
-3-
00
O U
M
S
w w co co • X • X
c a x c x es x
CO [fl (fl 10 • X • • • X
a x x x s e e x
X X X X X X X x x x x x x x x x x x x x x x x
o o e o m o o v o c o r - - - *
CM CO
CM C O
O C M n c M c o r ^ c o r -n N H O O l tfl CM i - i CM
A
O C M C O O C O e j v v O m —< N p i IJS r * * û CM CO
v O r i c v J v o o O C O r - e j v . ~ï in •* r~ oo —i CM
«* CO ri «J CM m oS i-t CM
en in m
cr\ CM n ^ co i CM oo co 00 ri i-l oo C M m ri
o i n i n i - i r - * C M r - - i - t vo -i r— i—i ^- f** <r CM m
O - f O v O N O l O O V CM i-i vo —t uo r~ f*» CM m r i
"̂\ evj
a
4->
a /—. (0 S r i (J Q,
s ^
u 4j m .c a oo
• H CO tu tu
— U CO
u C V« co co
r i eu CL. H 3
4-1 C CO
r i
a,
u tu o.
« tu u
- H
a <
x tu o. to
h
tu
r i
tu > tu
X i-l tu a, J3 CO U
c U C0
tu u a. xi ta *j tu to > V4 C0 ' H CU VH
a n
co tu > C0 tu
V-J
O S 4J CU
p i to
s~\ 4J S es
r i
a. -̂» >~\ 60
4J •—> a CO 4J
r i J 3 a , so
•~» -ri so eu
w 3 4J >, A U 60 •O
• r ( eu 4J * O
O
>> -< U -O eu
6 0 n co 10 l<
H > , U O C0 C0
fe a O 4J H en
O o
o XS II 4-1 00 X e x tu
r i • *. > v i n co o
13 • o
I I V
o
- °* OJ V
fi O r i r i O U •
O II
I I r i U X
•j*. •it -le
o
a. i l
o
a u x X X
o o
103
8.4 DISCUSSION AND CONCLUSIONS
With one exception, the results of the experiments reported here
support previous reports that yields of cassava storage roots- are
reduced by long days (Bolhuis, 1966; Mogilner et al., 1967; Lowe et
al., 1976; Cock and Rosas, 1975 and Keating, 1982). The exception
was MCol 22, in which very little storage roots yield reduction was
observed. Therefore the storage root production of this clone can
be considered as being largely insensitive to effects of day length.
The yield reduction does not appear to be related to a delay in
storage root initiation, but rather to a change in the distribution
patterns of dry matter. Keating (1982) suggests that shoot develop
ment is affected by photoperiod, whereas root development (as op
posed to growth) is not, thus implying that the photoperiod primar
ily affects shoots, and a secondary response occurs in the roots.
Cock et al. (1979) and Tan and Cock (1979a) suggest that top growth
has preference over root growth and that root growth occurs after
the tops' requirements have been fulfilled. Tan and Cock (1979a)
also found that by artifically reducing the number of branches the
yield of roots could be increased because dry matter distribution
changed within the plant.
In the experiments reported here a major effect of long days was
the increase of branching. In all experiments where branching oc
curred the final number of apices per plant was greater under long
days than under short days. Keating (1982) also reports an increase
in the number of growing points per plant with daylengths greater
than 12 h. This suggests that long photoperiods may increase the
growth requirements of the tops and hence reduce the excess carbo
hydrate available for root growth. Keating (1982), however, reported
effects of changes in plant height and leaf area per plant before
branching occurred, indicating that not all the difference in assim
ilate distribution results from changes in branching pattern. In
experiments 5 and 6 MPtr 26 did not branch before harvesting at
127 DAP and yet the harvest index was reduced from 0.21 under 11 h
days to 0.04 under 14 h days in experiment 5 and, correspondenly,
from 0.37 to 0.10 in experiment 6. Leaf area per plant was also
greatly increased under long-day conditions. These data clearly
demonstrate that daylength as well as having an effect on branching
also affects dry matter distribution.
104
It may also be that changes in the distribution pattern of the
dry matter produced by plants grown at different daylengths are hor-
monally controlled. Spraying cassava plants with gibberellic acid
resulted in less of the of produced dry matter being allocated to
the storage roots (Boerboom, 1978b). Menzel (1980) and Lovell and
Booth (1967) obtained similar results for potato. Menzel (1980)
suggested that gibberellins and inhibitors play a role in the pro
cess of distribution of dry matter. Lovell and Booth (1967) report
ed that the change in the distribution pattern preceded any large
morphological change in the shoot. Menzel (1980) confirmed this,
working with single-node cuttings that grew only at the axillary
bud, thus largely eliminating possible competition between shoots
and tubers.
Long days had no effect on leaf size (experiment 4), but did in
crease the number of leaves formed per apex in all experiments where
this parameter was measured (experiments 4, 5 and 6), except in the
clone Betawi and only to a limited degree in MCol 22. Thus long days
may promote top growth not only through increased branching, but
also by boosting the number of leaves formed per apex. The increase
in number of leaves formed per apex and in branching under long days
led to a large leaf area, which resulted in more light being inter
cepted. The larger total dry matter yield under long days in experi
ment 4 was probably caused by a higher amount of intercepted light,
because the total dry matter production per unit intercepted light
was not influenced by daylength (Fig. 32). In MCol 22 the dry weight
increase was sufficient to substantially offset the decreased per
centage distribution of dry weight to the roots. Thus the percent
age reduction in storage root yield in MCol 22 was less than in
MCol 1684 and MPtr 26. This clone, however, is not less sensitive
to photoperiod in terms of effects of long days on final number of
branches.
De Bruijn (1977) suggested that cassava is a quantitative long-
day plant in terms of flowering (branching). Whilst it is true that
branching is normally stimulated by long days, this is not always
so. The time to the first branch level was not affected by daylength
in MCol 1684, was decreased in MPtr 26 and Betawi, and increased
(experiment 6) or decreased (experiment 4) in MCol 22 under
long days. Nevertheless, in all experiments where branching occur-
105
red, the final branch number was greater under long days. This
finding is in agreement with data obtained by Keating (1982 ).
Because the number of apices per m2 increased under long days,
with no important increase in the number of branches per branching
point, the potential number of inflorescences per plant increased:
it is known (Van der Stok, 1910; Hunt et al., 1977) that branching
occurs at the apex of the stem when the apical meristem changes to
the reproductive state. This could be of considerable importance in
a cassava breeding programme. In practice, however, clonal reac
tions to flower initiation and flowering are more complicated. Gen
erally, the clones that branch frequently are the flowering ones,
but there are exceptions, i.e. because of the early abortion of the
whole inflorescence (Van der Stok, 1910).
106
9 GENERAL DISCUSSION AND CONCLUSIONS
Donald (1968) proposed an approach to plant breeding, known as
breeding a crop ideotype (a plant with model characteristics known
to influence positively photosynthesis, growth and yield). Donald's
approach has also been adopted for cassava, by CIAT in 1972 (CIAT,
1974; Cock et al., 1979). It remains to be seen whether, given the
results of the present study, development of a cassava ideotype is
useful. Ecological conditions greatly influence cassava plant hab
itus (Chapter 8), and there are large genotype x site interactions
on storage root yield (e.g. Irikura et al., 1979; CIAT, 1981). The
research reported in this thesis increases our knowledge of the plant
properties that can positively influence the yield of storage roots.
When the existing variation for each property in the available geno
types is also known, the breeding of improved cultivars of cassava
will be facilitated.
Useful characteristics of a cassava cultivar for a high yield of storage roots
As early as 1951 Cours published a list of useful characteristics
for a cassava cultivar with a high-yielding ability when grown in a
fertile soil. A number of plant properties that could be useful for
a higher yield of storage roots will be discussed below:
- ESRP (efficiency of storage root production), AISS (apparent
initial start of starch accumulation), and harvest index
LAI, leaf canopy characteristics and light interception by the
canopy
leaf photosynthetic rate
sink potential
ESRP, AISS and harvest index
Cours (1951) mentioned a high storage root fraction as a useful
characteristic of a cassava cultivar. Kawano et al. (1978) at CIAT
107
used the harvest index as a selection criterion as early as 1973,
when the evaluation of CIAT cassava germ plasm bank started. How
ever, the ESRP and AISS have to be preferred as selection criteria
over the harvest index, because these properties give an insight
into the growth of a cassava plant in the two most important growth
phases that can be distinguished, namely before and after the start
of storage root filling (Chapter 7). Moreover, the ESRP as a selec
tion criterion appears to be constant for any length of the growth
period and is therefore more useful than the time-dependent harvest
index. In practice, the length of the growth period is very variable
(e.g. Purseglove, 1968), particularly because no ripening phase can
be distinguished. Measurements of ESRP and AISS are more laborious,
because they require that plants be harvested at least three times.
For a proper comparison of the ESRP and AISS values of different
genotypes the dry weight of the plant or the plant parts must be used
- contrary to practice at CIAT (Kawano et al., 1978) - and the weight
of the already fallen leaves must be included because this forms a
substantial part of the total dry weight (16-19% in experiment 1 of
this study: Chapter 7). The results of this study show that the sys
tematic relation reported by CIAT (1978) between the 'measured'
harvest index (ignoring the weight of the fallen leaves) and the
'real' harvest index (Fig. 22) does not, in fact, exist.
Stem weight forms a substantial part of the total plant weight.
Several authors have drawn attention to cassava clones and Manihot
species that have a much lower stem weight fraction than normal.
Rogers (1972) mentioned M. anomal a and M. stipularia, both short-
stemmed with a dense leaf canopy. Jennings (1959) considered that
hybrids between cassava and M. melanobasis (a herbaceous species
with a long leaf life and now also considered to belong to the
species M. esculenta) have a great yield potential.
Assuming that the stem weight of the clones used in experiment 1
would have been only 50% of the values actually observed at one year
after planting the cuttings and that there was no change in total
dry matter weight and AISS value, then the yield of dry storage roots
would have been 36% higher (Table 21).
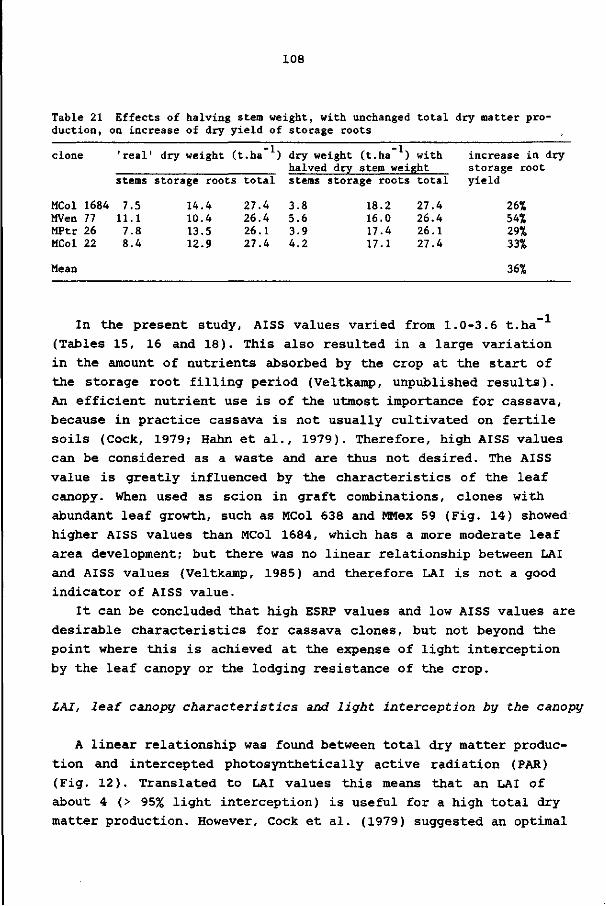
108
Table 21 Effects of halving stem weight, with unchanged total dry matter production, on increase of dry yield of storage roots
clone
MCol 1684 MVen 77 MPtr 26 MCol 22
Mean
'real'
stems
7.5 11.1 7.8 8.4
dry weight (
storage roots
14.4 10.4 13.5 12.9
t.ha"1)
total
27.4 26.4 26.1 27.4
dry weight (t.ha ) with halved dry stem weight stems storage roots total
3.8 18.2 27.4 5.6 16.0 26.4 3.9 17.4 26.1 4.2 17.1 27.4
increase in dry stora yield
ge root
26% 54% 29% 33%
36%
In the present study, AISS values varied from 1.0-3.6 t.ha"
(Tables 15, 16 and 18). This also resulted in a large variation
in the amount of nutrients absorbed by the crop at the start of
the storage root filling period (Veltkamp, unpublished results).
An efficient nutrient use is of the utmost importance for cassava,
because in practice cassava is not usually cultivated on fertile
soils (Cock, 1979; Hahn et al., 1979). Therefore, high AISS values
can be considered as a waste and are thus not desired. The AISS
value is greatly influenced by the characteristics of the leaf
canopy. When used as scion in graft combinations, clones with
abundant leaf growth, such as MCol 638 and MMex 59 (Fig. 14) showed
higher AISS values than MCol 1684, which has a more moderate leaf
area development; but there was no linear relationship between LAI
and AISS values (Veltkamp, 1985) and therefore LAI is not a good
indicator of AISS value.
It can be concluded that high ESRP values and low AISS values are
desirable characteristics for cassava clones, but not beyond the
point where this is achieved at the expense of light interception
by the leaf canopy or the lodging resistance of the crop.
LAI, leaf canopy characteristics and light interception by the canopy
A linear relationship was found between total dry matter produc
tion and intercepted photosynthetically active radiation (PAR)
(Fig. 12). Translated to LAI values this means that an LAI of
about 4 (> 95% light interception) is useful for a high total dry
matter production. However, Cock et al. (1979) suggested an optimal
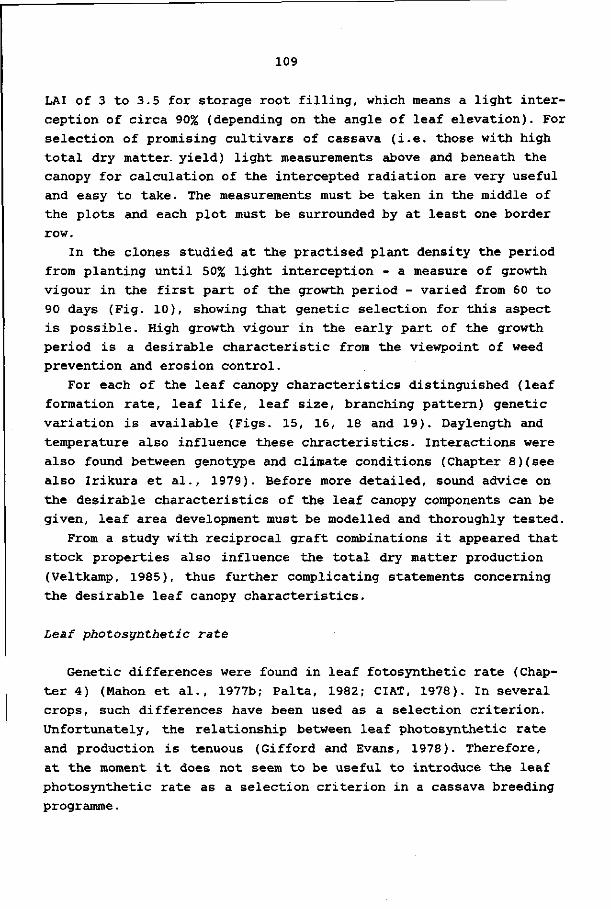
109
LAI of 3 to 3.5 for storage root filling, which means a light inter
ception of circa 90% (depending on the angle of leaf elevation). For
selection of promising cultivars of cassava (i.e. those with high
total dry matter, yield) light measurements above and beneath the
canopy for calculation of the intercepted radiation are very useful
and easy to take. The measurements must be taken in the middle of
the plots and each plot must be surrounded by at least one border
row.
In the clones studied at the practised plant density the period
from planting until 50% light interception - a measure of growth
vigour in the first part of the growth period - varied from 60 to
90 days (Fig. 10), showing that genetic selection for this aspect
is possible. High growth vigour in the early part of the growth
period is a desirable characteristic from the viewpoint of weed
prevention and erosion control.
For each of the leaf canopy characteristics distinguished (leaf
formation rate, leaf life, leaf size, branching pattern) genetic
variation is available (Figs. 15, 16, 18 and 19). Daylength and
temperature also influence these chracteristics. Interactions were
also found between genotype and climate conditions (Chapter 8)(see
also Irikura et al., 1979). Before more detailed, sound advice on
the desirable characteristics of the leaf canopy components can be
given, leaf area development must be modelled and thoroughly tested.
From a study with reciprocal graft combinations it appeared that
stock properties also influence the total dry matter production
(Veltkamp, 1985), thus further complicating statements concerning
the desirable leaf canopy characteristics.
Leaf photosynthetic rate
Genetic differences were found in leaf fotosynthetic rate (Chap
ter 4) (Mahon et al., 1977b; Palta, 1982; CIAT, 1978). In several
crops, such differences have been used as a selection criterion.
Unfortunately, the relationship between leaf photosynthetic rate
and production is tenuous (Gifford and Evans, 1978). Therefore,
at the moment it does not seem to be useful to introduce the leaf
photosynthetic rate as a selection criterion in a cassava breeding
programme.
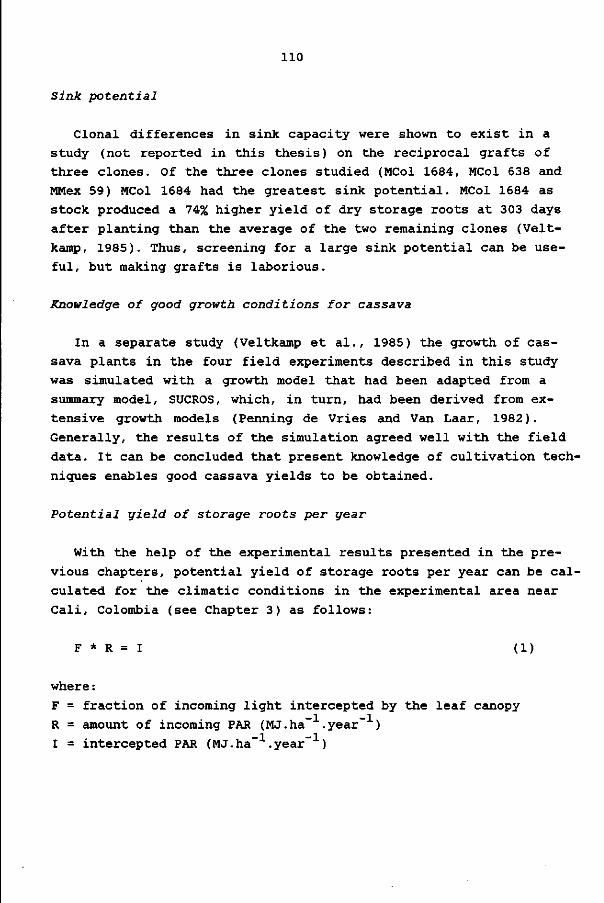
110
Sink potential
Clonal differences in sink capacity were shown to exist in a
study (not reported in this thesis) on the reciprocal grafts of
three clones. Of the three clones studied (MCol 1684, MCol 638 and
MMex 59) MCol 1684 had the greatest sink potential. MCol 1684 as
stock produced a 74% higher yield of dry storage roots at 303 days
after planting than the average of the two remaining clones (Velt-
kamp, 1985). Thus, screening for a large sink potential can be use
ful, but making grafts is laborious.
Knowledge of good growth conditions for cassava
In a separate study (Veltkamp et al., 1985) the growth of cas
sava plants in the four field experiments described in this study
was simulated with a growth model that had been adapted from a
summary model, SUCROS, which, in turn, had been derived from ex
tensive growth models (Penning de Vries and Van Laar, 1982).
Generally, the results of the simulation agreed well with the field
data. It can be concluded that present knowledge of cultivation tech
niques enables good cassava yields to be obtained.
Potential yield of storage roots per year
With the help of the experimental results presented in the pre
vious chapters, potential yield of storage roots per year can be cal
culated for the climatic conditions in the experimental area near
Cali, Colombia (see Chapter 3) as follows:
F * R = I (1)
where :
F = fraction of incoming light intercepted by the leaf canopy
R = amount of incoming PAR (MJ.ha- .year" )
I = intercepted PAR (MJ.ha- .year" )
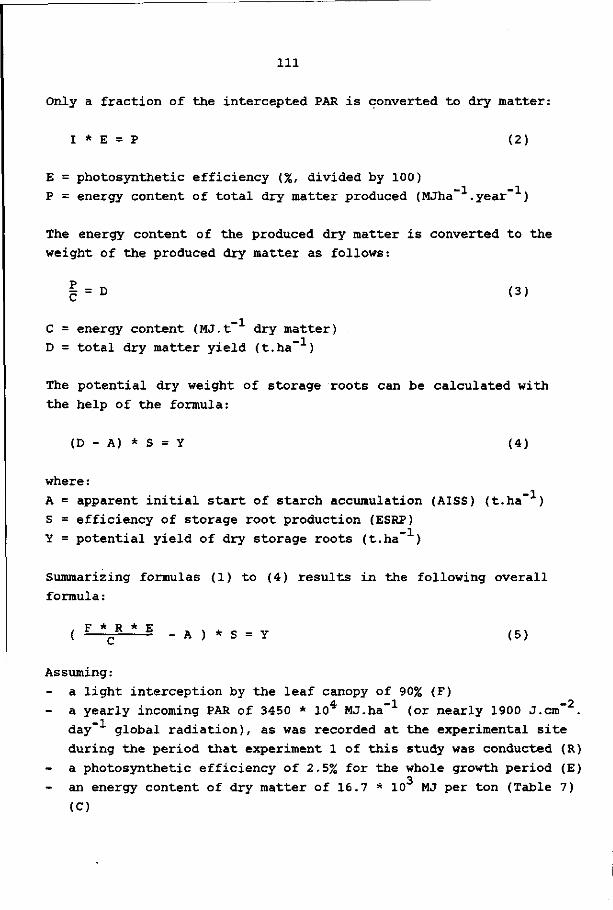
Ill
Only a fraction of the intercepted PAR is converted to dry matter:
I * E = P (2)
E = photosynthetic efficiency (%, divided by 100)
P = energy content of total dry matter produced (MJha~ .year" )
The energy content of the produced dry matter is converted to the weight of the produced dry matter as follows:
§ = D (3)
C = energy content (MJ.t~ dry matter) D = total dry matter yield (t.ha)
The potential dry weight of storage roots can be calculated with the help of the formula:
(D - A) * S = Y (4)
where :
A = apparent initial start of starch accumulation (AISS) (t.ha" ) S = efficiency of storage root production (ESRP) Y = potential yield of dry storage roots (t.ha" )
Summarizing formulas (1) to (4) results in the following overall formula :
F * D * E ( — c ^ — - - A ) * S = Y (5)
Assuming: a light interception by the leaf canopy of 90% (F)
4 -1 -2
- a yearly incoming PAR of 3450 * 10 MJ.ha (or nearly 1900 J.cm . day" global radiation), as was recorded at the experimental site during the period that experiment 1 of this study was conducted (R) a photosynthetic efficiency of 2.5% for the whole growth period (E)
3 an energy content of dry matter of 16.7 * 10 MJ per ton (Table 7) (C)

112
- an AISS of 1.5 t.ha"1 (A) (Chapter 7) - an ESRP of 0.66 (Chapter 7) (S),
then the potential yield of dry storage roots is about 30 't.ha- . year" and the potential total dry matter yield about 46 t.ha~ . year" . This potential yield of dry storage roots is of the same order as reported by Boerboom (1978b) and by Cock et al. (1979). Assuming a storage root dry matter content of 33%, the potential yield of fresh storage roots will be about 90 t.ha" .year" . Such a yield has already been reported by several authors. At the experimental farm of CIAT near Cali, Colombia, the highest recorded yield, namely 82 t.ha" of fresh storage roots, is of that order and was attained after a growth period of one year (CIAT, 1980).
Cassava growing at higher latitudes
This study has shown (Chapter 8) that one of the clones tested (MCol 22) is suited for growing at daylengths occurring at higher latitudes. This is the first report of a cassava clone whose production of storage roots is nearly day-neutral. Further testing is recommended e.g. at the daylength installation at CIAT (Fig. 25) and at higher latitudes. At higher latitudes the length of the growing season must be shortened, because temperatures are lower for part of the year.
i\ / 3450 * 104 * 0.9 * 0.025 . c . * „ ,, _ ,n 1) ( 16.7 * 103 _ 1.5 ) * 0.66 = 30
113
SUMMARY
Cassava (Manihot esculenta Crantz) is an important crop in many
parts of the tropics, being mainly cultivated for its storage roots.
Farmers' yields are low and one of the constraints to higher yields
is the lack of adequate clones. At the beginning of the 1970s an
extensive cassava research programme was started at CIAT (Colombia).
One of its aims was to develop high-yielding clones by genetic mo
dification of the plant habitus.
This thesis begins with a literature review in which the available
information on the physiological determinants of the yield of cassava
storage roots is described.
Next, a series of experiments carried out to deepen and to
broaden this knowledge on physiological causes of yield variation
in cassava is described. MCol 1684 (the best cultivar of the CIAT
cassava germ plasm bank) and MPtr 26 were used as the reference cul-
tivars in the experiments, both in the field and in the greenhouse.
Rate of leaf photosynthesis was measured by infrared gas analysis.
Measurements of the photosynthetic rate were carried out using the
youngest fully expanded leaf from plants growing outdoors that were
35 - 45 days old. Maximum photosynthetic rates varied from 0.74 x
10"6 to 0.81 x 10"6 kg C02.m"2 leaf.s"1. MCol 22 had the highest
leaf photosynthetic rate. A relatively low photonflux density level
was required for light saturation of the photosynthetic rate. This
is characteristic for a plant species with a C_ cycle. Photosynthesis -2 -1 increased only slightly from 1000 to 1500 pE.m .s PAR (photosyn-
thetically active radiation). Light efficiency at low light inten-
sities (a) varied from 9.0 x 10 to 12.4 x 10 kg CO_.J . The C02
concentration remained at an approximately constant level in the
intercellular spaces, independent of the light level, being 212 vppm -3 -2 -2 -1
(0.387 x 10 kg.m ). At a photonflux density of 1500 piE.m .s mesophyl resistance was higher than leaf resistance to CO, (335 s.m
-1 compared with 185 s.m ). Transpiration rates did not differ between clones, but increased with light intensity. Water use efficiency (WUE)
varied from 15.1 to 17.1 mg CO, uptake per g H-O, and was most ef
ficient for MCol 22.
Linear relationships were found between total dry matter yield
and the amount of intercepted PAR. Photosynthetic efficiency varied
114
from 1.9% to 2.5%, based on PAR during the first six months of the
growth period, and decreased markedly in older plants. The fraction
of incoming intercepted PAR varied from 43% to 69% during the first
six months. Cultivars had an extinction coefficient (K) of 0.72 to
0.88 and their leaves were dominantly planophile.
A leaf area index (LAI) of 1.0 (about 50% light interception) was
attained at 60 to 90 days from planting. An LAI = 3, which coincides
with a light interception by the leaf canopy of approximately 90%
was reached 120 to 150 days after planting, so about 40% of a growth
period of one year had elapsed before complete ground cover was
achieved. Genotypes with very different canopy characteristics
reached an LAI of 3 in approximately the same time.
Cassava has an indeterminate habit with sympodial branching. The
length of the period until first branching depended on genotype and
planting date. Large genetic differences were found in leaf life,
leaf size, plant age at which maximum leaf size was reached and leaf
formation rate per apex. Small variations in environmental conditions
caused significant differences in canopy characteristics.
During the growth period of cassava two periods with constant dry
matter partitioning could be distinguished, with the apparent initi
ation of the filling of storage roots (AISS) being the crucial point.
A constant proportion of the dry matter formed is distributed to
the storage roots: this is the efficiency of storage root production
(ESRP). Genetic differences were found for ESRP and AISS.
The influence of daylength on growth and yield was studied. Day-
length was increased by light bulbs, while the other growth con
ditions remained similar. Daylength had only a very slight influence
on AISS value. ESRP was negatively influenced by long days. Differ
ences in ESRP were the main cause of differences in yield of storage
roots for plants grown at different daylengths. For MCol 22, the ESRP
value was also considerably lower under long-day conditions, but the
yield of storage roots was nevertheless only slightly reduced,
because of the higher total dry matter yield. MCol 22 is the first
detected cassava clone whose yield of storage roots is nearly day-
neutral and thus it is suitable for cultivation at higher latitudes.
Long-day conditions caused a large increase in LAI. The higher LAI
values were caused by a higher leaf formation rate per apex and 2
a larger number of apices per m . Photosynthetic efficiency was
115
not influenced by daylength.
The implications of the findings are discussed. Plant properties
that could be useful for improving storage root yield are: a high
ESRP value, a low AISS value, a high growth vigour (short period
until 50% light interception), a light interception of about 90%
as long as possible, and a good sink potential.
Present knowledge of cassava cultivation techniques is such that
high yields are possible. Potential yield of storage roots is about
30 t.ha" .year" on dry weight basis and about 90 t.ha" .year' on
fresh weight basis. The highest recorded yield of fresh storage
roots at the CI AT experimental farm is of that order (namely
82 t.ha" ), and was achieved after a growth period of one year.
116
SAMENVATTING
Cassave (Manihot esculenta Crantz) is een belangrijk gewas in
grote delen van de tropen. Het wordt hoofdzakelijk geteeld voor
de verdikte wortels. De gemiddelde opbrengst in de praktijk op de
boerenbedrijven is laag (circa 9 ton verse, verdikte wortels per
hectare). Eén van de oorzaken van deze lage opbrengst is het on
voldoende beschikbaar zijn van goed producerende klonen. In het
begin van de zeventiger jaren werd op het CIAT, het Centro Inter-
nacional de Agricultura Tropical, in Colombia een omvangrijk onder
zoeksprogramma met cassave gestart. Eén van de doeleinden was het
ontwikkelen van zeer produktieve klonen door genetische verandering
van de morfologie van de plant.
Dit proefschrift vangt aan met een overzicht van de literatuur,
waarin de beschikbare informatie over de fysiologische factoren,
die de opbrengst aan verdikte wortels van cassave bepalen, wordt
beschreven.
Daarna worden een aantal proeven beschreven en besproken die
werden uitgevoerd om de kennis van de fysiologische oorzaken van
verschillen in opbrengst aan verdikte wortels van cassave te ver
diepen en te verbreden. MCol 1684, de beste cultivar van de op het
CIAT aanwezige genenbank van cassave, en MPt r 26 werden in alle
proeven gebruikt, dus zowel in het veld als in de kas. In totaal
werden er acht klonen gebruikt. De veldproeven werden alle uitge
voerd in de CIAT proeftuin bij Cali in Colombia, terwijl er twee
proeven plaatsvonden in één van de kassen van het kassencomplex van
de vakgroep Tropische plantenteelt van de Landbouwhogeschool in
Wageningen.
De fotosynthesesnelheid van bladeren werd bepaald met behulp van
de infrarood-absorptie methodiek. Voor de bepaling van de fotosyn
thesesnelheid werd het jongste volledig ontvouwde blad gebruikt van
35-45 dagen oude planten die buiten werden opgekweekt. De maximale
fotosynthesesnelheid varieerde tussen de onderzochte klonen van —6 —6 2
0,74 x 10 tot 0,81 x 10 kg CO» per m blad per seconde, waar
bij de hoogste waarde werd verkregen met MCol 22. Reeds bij een
relatief lage lichtintensiteit was er sprake van lichtverzadiging.
De fotosynthesesnelheid nam nog slechts in geringe mate toe bij een ... . - 2 - 1
stijging van de lichtintensiteit van 1000 tot 1500 uEm .s (foto-
117
synthetisch actief licht). Dat is kenmerkend voor een plantesoort
met een C,-cyclus. De fotochemische efficiëntie bij lage lichtinten-. -9 -9 -1
siteiten varieerde van 9,0 x 10 tot 12,4 x 10 kg CO, .J . De
CO,-concentratie bleef, onafhankelijk van de lichtintensiteit, on
geveer constant in de intercellulaire holten in de bladeren, name-- 3 - 2
li]k 0,387 x 10 kg.m (212 vdpm). Bij een lichtintensiteit van -2 -1 1500 pE-m .sec was de restweerstand (mesofyl weerstand)(r ) groter dan de huidmondjesweerstand voor CO, (r'), namelijk respec-
-1 -1
tievelijk 345 s.m tegen 185 s.m
De transpiratiesnelheid verschilde niet tussen de onderzochte
klonen, maar nam wel toe met de lichtintensiteit. De efficiëntie
van het watergebruik (WUE) varieerde van 15,1 tot 17,1 mg CO, per
g H,0, waarbij MCol 22 de meest efficiënte kloon was.
Er werd een rechtlijnig verband gevonden tussen de totale droge
stof produktie en de onderschepte fotosynthetisch actieve straling.
De fotosynthetische efficiency varieerde van 1,9 tot 2,5% gedurende
de eerste zes maanden van de groeiperiode, en nam daarna af. Ge
durende de eerste zes maanden van de groeiperiode werd 43 tot 69%
van de inkomende straling door het gewas onderschept. De onderzochte
cultivars hadden een uitdovingscoëfficiënt (K) van 0,72 tot 0,88.
De bladeren waren overwegend horizontaal geplaatst.
Een bebladeringsindex (BI, in het Engels LAI) van 1,0 (ongeveer
50% onderschepping) werd bereikt op 60 tot 80 dagen na het planten
van de stekken. Een BI van 3, wat overeenkomt met een lichtonder-
schepping van circa 90% werd op 120 tot 150 dagen na het planten
van de stekken bereikt, zodat pas nadat zo'n 40% van de veel voor
komende groeiperiode van 1 jaar voorbij was het gewas de bodem vol
ledig bedekte. Klonen met een zeer verschillende plantarchitectuur
bereikten een BI van 3 in ongeveer dezelfde tijd.
De cassave plant kent geen eindgroei en heeft een sympodiaal
vertakkingspatroon. De lengte van de periode vanaf het planten
van een stek tot de eerste vertakking hangt af van de kloon en
de planttijd. Er werden grote verschillen tussen de klonen ge
vonden voor wat betreft de levensduur van de bladeren, de blad
grootte, de leeftijd van de planten waarop de maximale bladgrootte
werd bereikt en de bladafsplitsingssnelheid per groeipunt. Kleine
verschillen in milieuomstandigheden hadden reeds wezenlijke ver
schillen in de plantarchitectuur tot gevolg.
118
Er kunnen tijdens de groeiperiode van cassave twee perioden
worden onderscheiden waarin een vaste verdeling van de droge stof
produktie over de verschillende delen (bladeren, stengels, (ver
dikte) wortels) plaatsvindt. Het moment waarop de verdikking van
de wortels begint neemt hierbij een centrale plaats in. Het gewicht
dat de planten hebben bij de start van de wortelverdikking wordt
aangeduid met de term AlSS-waarde. Het vaste deel van de geprodu
ceerde droge stof, dat nadien terecht komt in de verdikte wortels,
wordt aangeduid als de ESRP-waarde. Er werden wezenlijke verschil
len gevonden tussen de onderzochte klonen voor wat betreft de ESRP
en de AlSS-waarde.
Ook werd de invloed van de daglengte op de groei en de opbrengst
van cassave bestudeerd. De dagen werden verlengd met behulp van
gloeilampen, terwijl de overige groeiomstandigheden niet veranderden.
De daglengte had geen invloed op de AlSS-waarde. De ESRP-waarde was
in alle gevallen kleiner bij lange dagen (16 u licht). De gevonden
verschillen in de ESRP-waarden waren de voornaamste oorzaak van de
verschillen in opbrengst aan verdikte wortels voor planten die bij
verschillende daglengten groeiden. Ook bij MCol 22 was de ESRP-
waarde onder lange dag omstandigheden aanzienlijk lager dan bij de
natuurlijke daglengte van omstreeks 12 uur, maar toch verschilden
de opbrengsten aan verdikte wortels van planten opgegroeid bij ver
schillende daglengten maar weinig van elkaar. Dat werd veroorzaakt
door de grotere totale droge stof produktie bij lange dag omstandig
heden. MCol 22 is de eerste cassavekloon waarvan bekend is dat de
opbrengst aan verdikte wortels bijna niet wordt beïnvloed door de
daglengte. Met andere woorden: MCol 22 is daglengte-neutraal voor
wat betreft de opbrengst aan verdikte wortels en kan daarom voor
wat betreft de daglengte zonder opbrengstverlies op hogere breedte
graden worden geteeld. Lange dag omstandigheden veroorzaakten een
sterke toename van de BI. Deze hogere BI-waarden werden veroorzaakt
door een hogere bladafsplitsingssnelheid per groeipung en een groter
aantal groeipunten per oppervlakte-eenheid. De efficiëntie van de
fotosynthese werd niet beïnvloed door de daglengte.
De gevolgtrekkingen uit de resultaten van dit onderzoek worden
besproken. Planteigenschappen die nuttig kunnen zijn om te komen tot
een verhoging van de opbrengst aan verdikte wortels zijn: een hoge
ESRP-waarde, een lage AlSS-waarde, een sterke groeikracht in de

119
beginperiode van het groeiseizoen (anders gezegd: een korte periode
tot 50% van de inkomende straling door het gewas wordt onderschept),
een lichtonderschepping van circa 90% gedurende een zo groot mogelijk
deel van de totale groeiperiode, en een goed vermogen om de droge
stof in de zich verdikkende wortels op te slaan.
De huidige kennis omtrent teelttechnieken voor cassave is zodanig
dat goede opbrengsten aan verdikte wortels mogelijk zijn. De poten
tiële opbrengst aan verdikte wortels bedraagt ongeveer 30 t.ha~ . -1 -1 -1
3aar op droog gewicht basis en ongeveer 90 t.ha .jaar op vers
gewicht basis. De hoogste tot nu toe op de CIDT proeftuin bij Cali
in Colombia verkregen opbrengst bedroeg na een groeiperiode van één
jaar, 82 ton aan verse verdikte wortels per hectare.
120
ACKNOWLEDGEMENTS
I am greatly indebted to Prof.Dr.Ir. M. Flach for his counsel, en
couragements and suggestions made at the right moments, especially
during his visit to CIAT in 1979; they were essential for the com
pletion of this study.
I am particularly grateful to Dr.Ir. G.H. de Bruyn for his interest,
suggestions and guidance, especially during the long phase of writing
this thesis.
I thank the Centro Internacional de Agricultura Tropical, especially
Dr. J.H. Cock, for the oppertunity to perform research, some of which
is described in this thesis.
I wish to express my warm appreciation to those who faithfully help
ed me with the experimental work at CIAT. Luis Barona, Alberto Ramirez,
and ing. German Parra and the members of the cassava physiology field
team.
Sincere thanks are due to Ir. Wout van Hoof for his help and comments.
I am grateful to: Mr. R. Boekelman for his excellent work on the fig
ures ; Mr. E. Granados and Ir. P.H. van Ewijk for their statistical
advice; Mr. M. Keuls, whose helpful comments on Chapter 7 were much
appreciated; Mrs. J. Burrough-Boenisch for editing the English;
Mrs. I.E. Diraoui and Mrs. T.T. Neijennuis for typing the manuscript.

121
REFERENCES
Acock, B., J.H.M. Thornley and J. Warren Wilson, 1971. Photosynthesis
and energy conversion. In: Wareing, P.F. and J.P. Cooper (Eds),
Potential crop production, a case study. Heinemann Educational
Books, London, pp. 43-75.
Adams, M.W., 1973. Plant architecture and physiological efficiency
in the field bean. In: Seminar on potentials of field beans
and other food legumes in Latin America. Centro Internacional
de Agricultura Tropical, Cali, Colombia. Series Seminars no.
2E: 266-278.
Allen, E.J. and R.K. Scott, 1980. An analysis of growth of the potato
crop. J.Agric.Sci., Camb., 94: 583-606.
Anonymous, 1979. People's republic of China seeks CIAT's coopera
tion on cassava research. Cassava newsletter no. 7: 12-13.
APL, 1937. Verslagen 1929-1936. Algemeen Proefstation voor de Land
bouw (APL), Bogor, Indonesia. In: De Vries et al. (1967).
Aslam, M., S.B. Lowe and L.A. Hunt, 1977. Effect of leaf age on pho
tosynthesis and transpiration of cassava (Manihot esculenta).
Can.J.Bot. 55: 2288-2295.
Austin, R.B., J. Bingham, R.D. Blackwell, L.T. Evans, M.A. Ford,
C.L. Morgan and M. Taylor, 1980. Genetic improvements in winter
wheat yields since 1900 and associated physiologic changes.
Annals appl. Biol. 83: 425-446.
Bierhuizen, J.F., J.L. Ebbens and N.C.A. Koomen, 1973. Effects of
temperature and radiation on lettuce growing. Neth.J.agric.Sei.
21: 110-116.
Biscoe, P.V. and J.N. Gallagher, 1977. Weather, dry matter production
and yield. In: Landsberg, J.J. and C.V. Cutting (Eds), Environ
mental effects on crop physiology. Proc. Symp. Long Ashton Re
search Station, 13-16 April 1975. Academic Press, London, pp.
75-100.
Boerboom, B.W.J., 1978a. A model of dry matter distribution in cas
sava (Manihot esculenta Crantz). Neth.J.agric.Sei. 26 (3):
267-277.
Boerboom, B.W.J., 1978b. Growth and development of cassava (Manihot
esculenta Crantz) and the effect of growth regulators. Ph.D.
thesis, Univ. West Indies, Faculty of Agriculture, 80 pp.
122
Bolhuis, G.G., 1966. Influence of length of the illumination period
on root formation in cassava (Manihot utilissima Pohl). Neth.
J. of agric.Sci. 14: 251-254
Chew, W.Y. and M.H. Tan, 1969. A preliminary investigation on the
leaf area of tapioca (Manihot utilissima Pohl.). Agronomy Branch,
Division of Agriculture, Kuala Lumpur, West Malaysia, 12 pp.
CIAT, 1972. Cassava program review conference; summary and projec
tions. Centro Internacional de Agricultura Tropical, 10-12
January, 1972. CIAT, Cali, Colombia, 24 pp.
CIAT, 1974. Annual report Centro Internacional de Agricultura Trop
ical for 1973, Cali, Colombia.
CIAT, 1976. Annual report Centro Internacional de Agricultura Trop
ical for 1975, Cali, Colombia.
CIAT, 1977. Annual report Centro Internacional de Agricultura Trop
ical for 1976, Cali, Colombia.
CIAT, 1978. Annual report Centro Internacional de Agricultura Trop
ical for 1977, Cali, Colombia.
CIAT, 1979. Annual report Cassava program for 1978. Centro Interna
cional de Agricultura Tropical, Cali, Colombia, 100 pp.
CIAT, 1980. Annual report Cassava program for 1979. Centro Inter
nacional de Agricultura Tropical, Cali, Colombia, 93 pp.
CIAT, 1981. Annual report Cassava program for 1980. Centro Interna
cional de Agricultura Tropical, Cali, Colombia, 93 pp.
Cock, J.H., 1974. Agronomic potential for cassava production. In:
Araullo, E.V., B. Nestel and M. Campbell (Eds), Cassava proces
sing and storage. Proceedings of an interdisciplinary workshop,
Pattaya, Thailand, 17-19 April 1974. International Research
Development Center, Ottawa, IDRC-031e, pp. 21-26.
Cock, J.H., 1976. Characteristics of high yielding cassava varie
ties. Expl. Agric. 12: 135-143.
Cock, J.H., 1979. Cassava research; editorial. Field Crops Research
2: 185-191.
Cock, J.H., 1982. Cassava: a basic energy source in the tropics.
Science 218: 755-762.
Cock, J.H., D. Franklin, G. Sandoval and P. Juri, 1979. The ideal
cassava plant for maximum yield. Crop Science 19: 271-279.
Cock, J.H. and C. Rosas, 1975. Ecophysiology of cassava. Centro In
ternacional de Agricultura Tropical, Cali, Colombia, 14 pp.
123
Cock, J.H., D. Wholey and 0. Gutierrez de las Casas, 1977. Effects
of spacing on cassava (Manihot esculenta). Expl.Agric. 13:
289-299.
Connor, D.J., J.H. Cock and G.E. Parra, 1981. Response of cassava to
water shortage. Field Crops Research 4: 181-200.
Constable, G.A. and H.M. Rawson, 1980. Effect of leaf position, ex
pansion and age on photosynthesis, transpiration and water use
efficiency of cotton. Aust.J.Plant Physiol. 7: 89-100.
Cooper, J.P., 1976. Photosynthetic efficiency of the whole plant.
In: Duckham, A.N., J.G.W. Jones and E.H. Roberts (Eds), Food
production and consumption: the efficiency of human food
chains and nutrient cycles. North-Holland Publishing Company,
Amsterdam, pp. 107-126.
Cours, G., 1951. Le manioc à Madagascar. Mém.Inst.Scient.Madagascar,
série B tomo 3, fascicule 2: 203-400.
Cruxent, J.H. and I. Rouse, 1961. Archeologica cronologica de Vene
zuela, Vol. 1. Union Panamericana, Washington. Estudios mono-
graficos 6, 320 pp.
Dahniya, M.T., 1979. Defoliation and grafting studies of cassava
(Manihot esculenta Crantz) and sweet potatoes (Ipoinoea batatas
L.). Ph.D. thesis, University of Ibadan, Ibadan, Nigeria,
188 pp.
Daphne, P., 1980. Cassava, a South African venture. Optima 29(1):
61-68.
De Boer, W.R., 1975. The archeological evidence for manioc cultiva
tion: a cautionary note. American Antiquity 40(4): 419-433.
De Bruijn, G.H., 1971. Etude du caractère cyanogénétigue du manioc
(Manihot esculenta Crantz). Meded. Landbouwhogeschool, Wage
ningen, The Netherlands 71-13, 140 pp.
De Bruijn, G.H., 1977. Influence of daylength on the flowering of
cassava. Tropical Root and Tuber Crops Newsletter 10: 1-3.
De Bruijn, G.H., 1982. Performance and dry matter distribution of
cassava at different ages and ecological conditions in Ivory
Coast. Proceedings Fifth symposium International Society for
Tropical root crops, held in Manila, The Philippines, Sep
tember 1979, p. 323-337.
De Bruijn, G.H. and T.S. Dharmaputra, 1974. The Mukibat system, a
high-yielding method of cassava production in Indonesia. Neth.
J.agric.Sci. 22.-* 89-100.
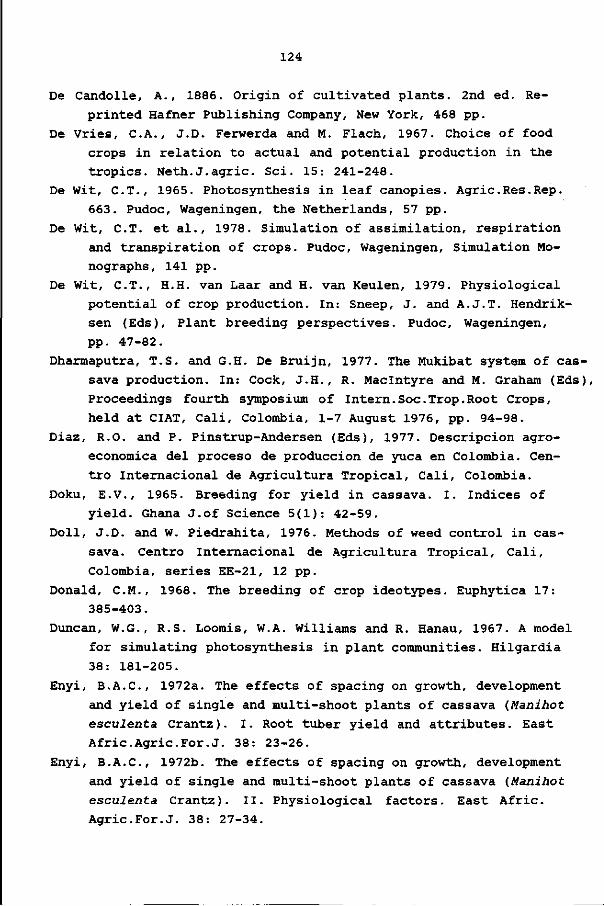
124
De Candolle, A., 1886. Origin of cultivated plants. 2nd ed. Re
printed Hafner Publishing Company, New York, 468 pp.
De Vries, CA., J.D. Ferwerda and M. Flach, 1967. Choice of food
crops in relation to actual and potential production in the
tropics. Neth.J.agric. Sei. 15: 241-248.
De Wit, C T . , 1965. Photosynthesis in leaf canopies. Agric.Res.Rep.
663. Pudoc, Wageningen, the Netherlands, 57 pp.
De Wit, C T . et al., 1978. Simulation of assimilation, respiration
and transpiration of crops. Pudoc, Wageningen, Simulation Mo
nographs, 141 pp.
De Wit, C T . , H.H. van Laar and H. van Keulen, 1979. Physiological
potential of crop production. In: Sneep, J. and A.J.T. Hendrik-
sen (Eds), Plant breeding perspectives. Pudoc, Wageningen,
pp. 47-82.
Dharmaputra, T.S. and G.H. De Bruijn, 1977. The Mukibat system of cas
sava production. In: Cock, J.H., R. Maclntyre and M. Graham (Eds),
Proceedings fourth symposium of Intern.Soc.Trop.Root Crops,
held at CIAT, Cali, Colombia, 1-7 August 1976, pp. 94-98.
Diaz, R.O. and P. Pinstrup-Andersen (Eds), 1977. Descripcion agro-
economica del proceso de produccion de yuca en Colombia. Cen-
tro Internacional de Agricultura Tropical, Cali, Colombia.
Doku, E.V., 1965. Breeding for yield in cassava. I. Indices of
yield. Ghana J.of Science 5(1): 42-59.
Doll, J.D. and W. Piedrahita, 1976. Methods of weed control in cas
sava. Centro Internacional de Agricultura Tropical, Cali,
Colombia, series EE-21, 12 pp.
Donald, CM., 1968. The breeding of crop ideotypes. Euphytica 17:
385-403.
Duncan, W.G., R.S. Loomis, W.A. Williams and R. Hanau, 1967. A model
for simulating photosynthesis in plant communities. Hilgardia
38: 181-205.
Enyi, B.A.C, 1972a. The effects of spacing on growth, development
and yield of single and multi-shoot plants of cassava (Manihot
esculenta Crantz). I. Root tuber yield and attributes. East
Afric.Agric.For.J. 38: 23-26.
Enyi, B.A.C, 1972b. The effects of spacing on growth, development
and yield of single and multi-shoot plants of cassava (Manihot
esculenta Crantz). II. Physiological factors. East Afric.
Agric.For.J. 38: 27-34.
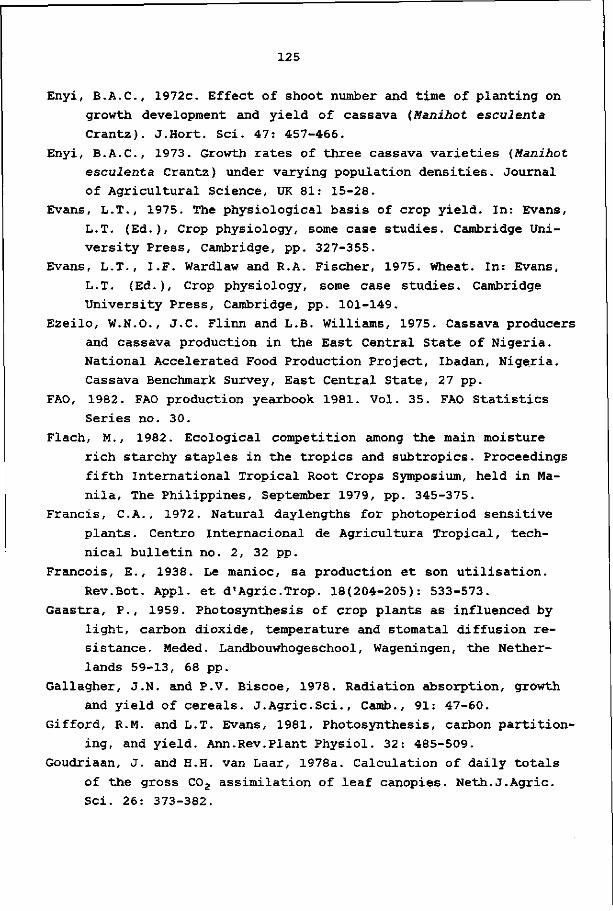
125
Enyi, B.A.C., 1972c. Effect of shoot number and time of planting on
growth development and yield of cassava (Manihot esculenta
Crantz). J.Hort. Sei. 47: 457-466.
Enyi, B.A.C., 1973. Growth rates of three cassava varieties (Manihot
esculenta Crantz) under varying population densities. Journal
of Agricultural Science, UK 81: 15-28.
Evans, L.T., 1975. The physiological basis of crop yield. In: Evans,
L.T. (Ed.), Crop physiology, some case studies. Cambridge Uni
versity Press, Cambridge, pp. 327-355.
Evans, L.T., I.F. Wardlaw and R.A. Fischer, 1975. Wheat. In: Evans,
L.T. (Ed.), Crop physiology, some case studies. Cambridge
University Press, Cambridge, pp. 101-149.
Ezeilo, W.N.O., J.C. Flinn and L.B. Williams, 1975. Cassava producers
and cassava production in the East Central State of Nigeria.
National Accelerated Food Production Project, Ibadan, Nigeria.
Cassava Benchmark Survey, East Central State, 27 pp.
FAO, 1982. FAO production yearbook 1981. Vol. 35. FAO Statistics
Series no. 30.
Flach, M., 1982. Ecological competition among the main moisture
rich starchy staples in the tropics and subtropics. Proceedings
fifth International Tropical Root Crops Symposium, held in Ma
nila, The Philippines, September 1979, pp. 345-375.
Francis, C.A., 1972. Natural daylengths for photoperiod sensitive
plants. Centro Internacional de Agricultura Tropical, tech
nical bulletin no. 2, 32 pp.
Francois, E., 1938. Le manioc, sa production et son utilisation.
Rev.Bot. Appl. et d'Agric.Trop. 18(204-205): 533-573.
Gaastra, P., 1959. Photosynthesis of crop plants as influenced by
light, carbon dioxide, temperature and stomatal diffusion re
sistance. Meded. Landbouwhogeschool, Wageningen, the Nether
lands 59-13, 68 pp.
Gallagher, J.N. and P.V. Biscoe, 1978. Radiation absorption, growth
and yield of cereals. J.Agric.Sci., Camb., 91: 47-60.
Gifford, R.M. and L.T. Evans, 1981. Photosynthesis, carbon partition
ing, and yield. Ann.Rev.Plant Physiol. 32: 485-509.
Goudriaan, J. and H.H. van Laar, 1978a. Calculation of daily totals
of the gross C02 assimilation of leaf canopies. Neth.J.Agric.
Sei. 26: 373-382.
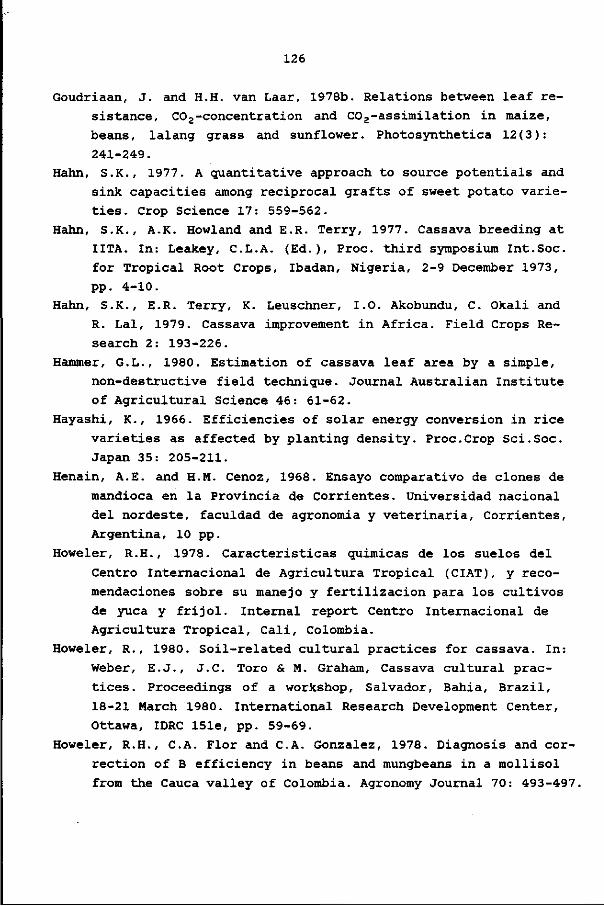
126
Goudriaan, J. and H.H. van Laar, 1978b. Relations between leaf re
sistance, CO2-concentration and CO2-assimilation in maize,
beans, lalang grass and sunflower. Photosynthetica 12(3):
241-249.
Hahn, S.K., 1977. A quantitative approach to source potentials and
sink capacities among reciprocal grafts of sweet potato varie
ties. Crop Science 17: 559-562.
Hahn, S.K., A.K. Howland and E.R. Terry, 1977. Cassava breeding at
UTA. In: Leakey, C.L.A. (Ed.), Proc. third symposium Int.Soc.
for Tropical Root Crops, Ibadan, Nigeria, 2-9 December 1973,
pp. 4-10.
Hahn, S.K., E.R. Terry, K. Leuschner, I.O. Akobundu, C. Okali and
R. Lai, 1979. Cassava improvement in Africa. Field Crops Re
search 2: 193-226.
Hammer, G.L., 1980. Estimation of cassava leaf area by a simple,
non-destructive field technique. Journal Australian Institute
of Agricultural Science 46: 61-62.
Hayashi, K., 1966. Efficiencies of solar energy conversion in rice
varieties as affected by planting density. Proc.Crop Sci.Soc.
Japan 35: 205-211.
Henain, A.E. and H.M. Cenoz, 1968. Ensayo comparativo de clones de
mandioca en la Provincia de Corrientes. Universidad nacional
del nordeste, faculdad de agronomia y veterinaria, Corrientes,
Argentina, 10 pp.
Howeler, R.H., 1978. Caracteristicas quimicas de los suelos del
Centro Internacional de Agricultura Tropical (CIAT), y reco-
mendaciones sobre su manejo y fertilizacion para los cultivos
de yuca y frijol. Internal report Centro Internacional de
Agricultura Tropical, Cali, Colombia.
Howeler, R., 1980. Soil-related cultural practices for cassava. In:
Weber, E.J., J.C. Toro & M. Graham, Cassava cultural prac
tices. Proceedings of a workshop, Salvador, Bahia, Brazil,
18-21 March 1980. International Research Development Center,
Ottawa, IDRC 151e, pp. 59-69.
Howeler, R.H., C A . Flor and C.A. Gonzalez, 1978. Diagnosis and cor
rection of B efficiency in beans and mungbeans in a mollisol
from the Cauca valley of Colombia. Agronomy Journal 70: 493-497.
127
Howeler, R.H. and L.F. Cadavid, 1983. Accumulation and distribution
of dry matter and nutrients during a 12-month growth cycle of
cassava. Field Crops Research 7: 123-139.
Hume, D.J., 1975. Translocation of 14C-labelled photosynthetic as
similates in cassava (Manihot esculenta Crantz). Ghana
J.Agric.Sci. 8: 69-75.
Hunt, L.A., D.W. Wholey and J.H. Cock, 1977. Growth physiology of
cassava (Manihot esculenta Crantz). Field Crop Abstracts 30(2):
77-91.
UTA, 1980. Annual report of the International Institute of Tropical
Agriculture for 1979, Ibadan, Nigeria, 152 pp.
Indira, P. and T. Kurian, 1977. A comparative study of the anatomical
changes associated with tuberization in the roots of cassava
and sweet potato. In: Leakey, C.L.A. (Ed.), Proceedings of the
third symposium of the International Society for Tropical Root
Crops, UTA, Ibadan, Nigeria, 2-9 December 1973, pp. 78-80.
Indira, P. and T. Ramanujam, 1979. Effect of photoperiod on tuber
ization in cassava, J.Root Crops 5 (1/2): 39-42.
Indira, P. and S.K. Sinha, 1970. Studies on the initiation and devel
opment of tubers in Manihot esculenta Crantz. Indian Journal
of Plant Physiology 13: 24-39.
Irikura, Y., J.H. Cock and K. Kawano, 1979. The physiological basis
of genotype-temperature interactions in cassava. Field Crops
Research 2: 227-239.
Jennings, P.R., 1964. Plant type as a rice breeding objective. Crop
Sei. 4: 13-15.
Jennings, D.L., 1959. Manihot melanobasis Müll. Arg. - a useful
parent for cassava breeding. Euphytica 8: 157-162.
Jones, W.O., 1959. Manioc in Africa. Stanford University Press,
Stanford, California, 315 pp.
Kawano, K., 1978. Genetic improvement of cassava (Manihot esculenta
Crantz) for productivity. Tropical Agriculture Research Series
no. 11. Tropical Agriculture Research Center, Ministry of Agri
culture and Forestry, Japan, pp. 9-21.
Kawano, K., P. Daza, A. Amaya, M. Rios and W.M.F. Goncalves, 1978.
Evaluation of cassava germplasm for productivity. Crop Science
18: 377-380.
128
Keating, B.A. and J.P. Evenson, 1979. Effect of soil temperature on
sprouting and sprout elongation of stem cuttings of cassava
(Manihot esculenta Crantz). Field Crops Research 2: 241-251.
Keating, B.A., 1982. Environmental effects on growth and develop
ment of cassava (Manihot esculenta Crantz) with special re
ference to photoperiod and temperature. Cassava newsletter
no. 10: 10-12.
Kiok, W., 1934. Der Maniok; ein Beitrag zur Wirtschaftsgeographie
der warmen Länder. Ph.D.thesis, Universität Greifswald, Ger
many, 75 pp.
Koch, L., 1934. Eenige geschiedkundige feiten met betrekking tot de
cassave cultuur. De Indische Mercuur 57(18): 263-264.
Krochmal, A. and G. Samuels, 1970. The influence of NPK levels on the
growth and tuber development of cassava in tanks. Ceiba 16 (2):
35-43.
Loomis, R.S. and H. Rapoport, 1977. Productivity of root crops. In:
Cock, J.H., R. Maclntyre and M. Graham (Eds), Proceedings fourth
symposium of Intern.Soc.Trop.Root Crops, held at CIAT, Cali,
Colombia, 1-7 August 1976, pp. 70-84.
Loomis, R.S., W.A. Williams and A.E. Hall, 1971. Agricultural produc
tivity. Annual review of plant physiology 2: 431-468.
Lovell, P.H. and A. Booth, 1967. Effects of gibberellic acid on
growth, tuber formation and carbohydrate distribution in Sola~
num tuberosum. New Phytol. 66: 525-537.
Lowe, S.B., J.D. Mahon and L.A. Hunt, 1976. The effect of daylength
on shoot growth and formation of root tubers in young plants
of cassava (Manihot esculenta Crantz). Plant Science Letters 6:
57-62.
Lozano, J.C., J.C. Toro, A. Castro and A.C. Bellotti, 1977. Production
of cassava planting material. Centro Internacional de Agricul-
tura Tropical series GE-17, 28 pp.
Mahon, J.D., S.B. Lowe and L.A. Hunt, 1976. Photosynthesis and assim
ilate distribution in relation to yield of cassava grown in
controlled environments. Can.J.Bot. 54(12): 1322-1331.
Mahon, J.D., S.B. Lowe, L.A. Hunt and M. Thiagarajah, 1977a. Environ
mental effects on photosynthesis and transpiration in attached
leaves of cassava (Manihot esculenta Crantz). Photosynthetica
11(2): 121-130.

129
Mahon, J.D., S.B. Lowe and L.A. Hunt, 1977b. Variation in the rate of
photosynthetic C02 uptake in cassava cultivars and related
species of Manihot. Photosynthetica 11(2): 131-138.
Mason, T.G., 1972. A note on growth and the transport of organic
substances in bitter cassava (Manihot utHissima), Scientific
proceedings Royal Dublin society 17: 105-112.
Menzel, CM., 1980. Tuberization in potato at high temperatures:
responses to gibberellin and growth inhibitors. Ann.Bot. 46:
259-265.
Miège, J., 1957. Essais culturaux sur le manioc. J. d'Agric.Trop.
Bot.Appli. 4(9-10): 402-441.
Milthrope, F.L. and J. Moorby, 1974. An introduction to crop physio
logy. Cambridge University Press, Cambridge, 202 pp.
Mogilner, I., J.D. Portuguez Arias, A.D. Gotuzzo and J.A. Acosta,
1967. Influencia de la parte aerea de Manihot flabellifolia en
la formacion de raices reservantes de Manihot esculenta utili-
zado como pie. Bonplandia 2(10): 137-142.
Monsi, M. and T. Saeki, 1953. Über den Lichtfaktor in den Pflanzen
gesellschaften und seine Bedeutung für die Stoffproduktion.
Jap.J.Bot.14: 22-52.
Monteith, J.L., 1977. Climate and the efficiency of crop production
in Britain. Philosophical Transactions of the Royal Society of
London 281: 277-294.
Moorby, J., 1968. The effect of growth substances on transport in
plants. In: Vardar, Y. (Ed.), The transport of plant hormones.
Proceedings of the NATO/EGE University Summer Institute, Octo
ber 1967. North-Holland Publishing Company, Amsterdam, the
Netherlands, pp. 192-206.
Moss, D.N. and R.B. Musgrave, 1971. Photosynthesis and crop produc
tion. Advances in agronomy 23: 317-336.
Natr, L., 1972. Influence of mineral nutrients on photosynthesis of
higher plants. Photosynthetica 6(1): 80-99.
Nugroho, H. (Ed.), 1976. Survey on Mukibat cassava in East Java.
.Faculty of Agriculture, Brawiyaya University, Malang, Indone
sia, 25 pp.
Orioli, G.A., J. Mogilner, W.L. Bartra and P.A. Semienchuk, 1967.
Acumulacion de materia seca, N, P, K y Ca en Manihot esculenta.
Bonplandia 2: 175-182.

130
Palta, J.A., 1982. Gas exchange of four cassava cultivars in rela
tion to light intensity. Expl.Agric. 18: 375-382.
Peat, W.E., 1970. Relationships between photosynthesis and light
intensity in the tomato. Annals of Botany, N.S., 34: 319-328.
Penning de Vries, F.W.T. and H.H. van Laar (Eds), 1982. Simulation
of plant growth and crop production. Simulation monographs,
Pudoc, Wageningen, The Netherlands, 308 pp.
Planchon, C , 1979. Photosynthesis, transpiration, resistance to
C02 transfer, and water efficiency of flag leaf of bread wheat,
durum wheat and triticale. Euphytica 28: 403-408.
Purseglove, J.W., 1968. Tropical crops. Dicotyledons 1. Longmans,
London, 332 pp.
Reichel-Dolmatoff, G., 1965. Colombia. Thames and Hudson series An
cient Peoples and Places, London.
Rogers, D.J., 1963. Studies of Manihot esculenta Crantz and related
species. Bull.Torrey Bot.Club 90(1): 43-54.
Rogers, D.J., 1972. Dwarf, or short-stemmed cassava? Tropical Root
and Tuber Crops Newsletter 5: 36.
Rogers, D.J. and S.G. Appan, 1973. Manihot and Manihotoides (Euphor-
biaceae): a computer assisted study. Organization for Flora
Neotropica, Monograph No. 13, New York, 278 pp.
Rogers, D.J. and M. Milner, 1963. Amino acid profile of manioc leaf
protein in relation to nutritive value. Econ.Bot. 17: 211-216.
Rosas, C , J.H. Cock and G. Sandoval, 1976. Leaf fall in cassava.
Expl.Agric. 12: 395-400.
Ross, H.B., 1975. The diffusion of the manioc plant from South Amer
ica to Africa; an essay in ethnobotanical culture history.
Ph.D. thesis, Colombia University, Faculty of Political
Science, New York, 135 pp.
Sauer, C , 1952. Agricultural origins and dispersals. American
Geographical Society, New York, 110 pp.
Schwerin, K.H., 1970. Apuntes sobre la yuca y sus origenes. Tropi
cal root and tuber crops newsletter 3: 4-12.
Scott, R.K. and K.W. Jaggard, 1978. Theoretical criteria for maximum
yield. Proceedings of the 41st winter congress of the Interna
tional Institute of Sugarbeet Research, pp. 179-198.
Shibles, R.M. and C.R. Weber, 1966. Interception of solar radiation
and dry matter production by various soybean planting pat
terns. Crop Science 6: 55-59.
131
Sinha, S.K. and T.V.R. Nair, 1971. Leaf area during growth and yield
ing capacity of cassava. Indian J.Genetics and Plant Breeding
31(1): 16-20.
Soetono, H., B. Guritno and G.H. De Bruijn, 1982. Growth analysis of
Mukibat and ordinary cassava. Faculty of Agriculture, Brawijaya
University, Malang, Indonesia-, 17 pp.
Tan, K.H. and A.R. Bertrand, 1972. Cultivation and fertilization of
cassava. In: Hendershott, C.H. et al. (1972), A literature re
view and research recommendation on cassava (Manihot esculenta
Crantz), pp. 37-75.
Tan, S.L. and J.H. Cock, 1979a. Branching habit as a yield determinant
in cassava. Field Crops Research 2: 281-289.
Tan, S.L. and J.H. Cock, 1979b. Cassava plant foi.ns and their as
sociated morpho-physiological characters. MARDI Res.Bull. 7,2:
55-69.
Terra, G.J.A., 1964. The significance of leaf vegetables, especial
ly of cassava, in tropical nutrition. Trop.Geogr.Med. 2:
97-108.
Toro, J.C., 1979. Three years of cassava technology evaluation in
Colombia. Field Crops Research 2: 291-308.
Toro, J.C. and C.B. Atlee, 1980. Agronomic practices for cassava
production: a literature review. In: Weber, E.J. et al. (Eds),
Cassava cultural practices. Proceedings of a workshop, Salva
dor, Bahia, Brazil, 18-21 March 1980. International Research
Development Center, Ottawa, IDRC-151e, pp. 13-28.
Towle, M.A., 1961. The ethnobotany of pre-Columbian Peru. Aldine
Publishing Company, Chicago, 180 pp.
Tsuno, Y. and K. Fujise, 1965. Studies on the dry matter production
of sweet potato. VII. The internal factors influencing photo-
synthetic activity of sweet potato leaf. Proc.Crop.Sei.Soc.
Japan 28: 230-235.
Van de Sande Bakhuyzen, H.L., 1950. Groei en productie van suiker
bieten 1. Versl.Landbouwk.Onderz. no. 55.2, 's Gravenhage, the
Netherlands, 227 pp.
Van der Stok, J.E., 1910. Onderzoekingen omtrent het cassavagewas
(Manihot utilissima Pohl.). In: Onderzoekingen omtrent rijst
en tweede gewassen. Mededeelingen uitgaande van het Departe
ment van Landbouw no. 12, Batavia, pp. 120-175.
132
Vavilov, N.I., 1951. The origin, variation, immunity and breeding of cultivated plants. Chronica Botanica 13(1-6), 364 pp.
Veltkamp, H.J. (1985). Sink-source relationships of cassava (Manihot esculenta Crantz). In preparation.
Veltkamp, H.J., J.G. Gijzen, J. Goudriaan>and G.H. De Bruijn (1985). Simulation of dry matter production and partitioning in cassava (Manihot esculenta Crantz). Submitted for publication.
Watson, D.J., 1952. The physiological basis of variation in yield. Advances in agronomy 4: 101-145.
Wholey, D.W. and J.H. Cock, 1974. Onset and rate of root bulking in cassava. Expl.Agric. 10: 193-198.
Williams, C.N., 1972. Growth and productivity of tapioca (Manihot utilissima). III. Crop ratio, spacing and yield. Expl.Agric. 8: 15-23.
Williams, C.N. and S.M. Ghazali, 1969. Growth and productivity of tapioca (Manihot utilissima). I. Leaf characteristics and yield. Expl.Agric. 5: 183-194.
Wittenrood, H.G., 1958. Grafische voorstelling van de ontwikkeling van een plant. Mededeling 18 IBS, Wageningen, pp. 87-94.
Zelitch, I., 1971. Photosynthesis, photorespiration and plant productivity. Academic Press, New York, 347 pp.
CURRICULUM VITAE
H.J. Veltkamp werd op 16 juli 1948 in Warnsveld geboren. Hij bezocht
het Baudartius Lyceum in Zutphen en behaalde het diploma HBS-b in
1966. Hij studeerde van 1966 tot 1972 aan de Landbouwhogeschool. In
1972 studeerde hij met lof af in de studierichting Tropische landbouw
plantenteelt met als keuzevakken plantenfysiologie en humane voeding.
Van 1972 tot 1978 was hij werkzaam bij het Landbouwproefstation van
het ministerie van Landbouw, Veeteelt en Visserij in Paramaribo,
Suriname. In de periode 1972 tot 1974 was hij hoofd van de afdeling
Granenonderzoek, terwijl hij van 1974 tot 1978 als hoofd van de af-
deling Kontakten-met-de Landbouwvoorlichting belast was met de over
dracht van onderzoeksresultaten van het Landbouwproefstation naar
de Landbouwvoorlichtingsdienst. Van 1978 tot 1981 was hij als pro
motieassistent verbonden aan de vakgroep Tropische plantenteelt van
de Landbouwhogeschool en in dat kader als onderzoeker werkzaam op
de afdeling Fysiologie van het Cassave-onderzoeksprogramma van het
Centro Internacional de Agricultura Tropical (CIAT) in Palmira,
Colombia. Na terugkeer in 1981 was hij gedurende bijna één jaar
nog als wetenschappelijk ambtenaar werkzaam bij de vakgroep Tro
pische plantenteelt. Sedert 1982 is hij als docent tropische plan
tenteelt verbonden aan de Rijks Hogere Landbouwschool in Deventer.