characterization of cassava ( manihot esculenta crantz
TRANSCRIPT

Tropical Agricultural Research Vol. 30 (4): 51 – 70 (2018)
51
Characterization of Cassava (Manihot esculenta Crantz) Cultivars in
Sri Lanka using Morphological, Molecular and Organoleptic Parameters
U.H.K. Dissanayake1, R.W.K.M. Senevirathna1, L.T. Ranaweera1,
W.W.M.U.K. Wijesundara1, H.S.M. Jayarathne1, C.K. Weebadde2 and
S.D.S.S. Sooriyapathirana1*
Postgraduate Institute of Science
University of Peradeniya
Sri Lanka
ABSTRACT: Cassava (Manihot esculenta Crantz), an important dietary staple in many
countries, supplies food for one billion people in the world. Due to dietary importance,
currently cassava cultivation is promoted in Sri Lanka. Even though there are different
cassava cultivars grown, no studies have been conducted on cultivar discrimination and
preference on their tubers for consumption. Therefore, the present study was conducted to
study the morphological and genetic diversity, and assess the consumer preference of cassava
cultivars grown in Sri Lanka. Morphological traits of leaves, stems and tubers, chlorophyll
content, ascorbic acid content of leaves, dry matter content of leaves and tubers were recorded.
The genetic diversity was assessed by sequencing and analyzing the ITS, a DNA barcoding
locus. The leaf morphology of wild-accession and Landrace cultivars were considerably
different from the rest. The stem morphology was highly different, mainly in the internodal
length. A significantly high number of tubers were observed in the cultivar Suranimala. The
significant associations were observed from color, aroma, texture, bitterness, hardness and
overall taste vs. cassava cultivars. The nine cultivars were separated through ITS
polymorphism. In phylogenetic analysis, wild-accession was the most genetically distant type
having nine unique SNPs and one INDEL. Other cultivars were mainly divided into two
clusters. Thus, it is possible to employ ITS barcoding marker to discriminate the cultivars of
M. esculenta.
Keywords: Cassava, manioc, SNP profiling, INDEL profiling, UPGMA
INTRODUCTION
Cassava (Manihot esculenta Crantz) which supplies food for one billion people in the world
(Reynolds, 2017; Rodriguez and Sanders, 2015), was originated in South America and mainly
cultivated in the tropical and sub-tropical regions of the world (Hershey, 2017). Cassava plays
a major role in solving food problems as it grows well and produces stable yields under extreme
conditions such as drought, heat stress, diverse environmental and soil conditions (El-
Sharkawy, 2003). It is a versatile crop which can be processed into a broad range of products
including, flour, beer, cassava chips and animal feed (Cock, 1982). Cassava is also gaining
1 Department of Molecular Biology and Biotechnology, Faculty of Science, University of Peradeniya, Sri Lanka 2 Department of Plant, Soil and Microbial Sciences, College of Agriculture and Natural Resources, Michigan State
University, East Lansing, MI, USA
* Corresponding author: [email protected]

Dissanayake et al.
52
more importance by becoming an important biofuel crop (Jansson et al., 2009; Ziska et al.,
2009; Adelekan, 2010).
Cassava is propagated mainly by vegetative means (Elias et al., 2001). Therefore, traditionally,
morphological descriptors have been the basis for germplasm identification and differentiation
(Carvalho and Schaal, 2001). Other than that, isozymes (Lefevre, 1989), biochemical and
genetic markers were also used as alternative methods for characterization. Highly heritable
traits such as root cortex and less heritable traits such as yield and plant height have been used
as vegetative parameters for characterization (Chavarriaga-Aguirre et al., 1999). Carvalho and
Schaal, (2001) have identified plant height, root weight and stored root starch content as the
most variable morphological parameters among cassava cultivars in a diversity analysis. Due
to the identification of potential duplications with isozymes and morphological traits (Jimenez-
Nieto, 1994; Ocampo et al., 1993), rapid and less labor-intensive PCR-based DNA marker
genotyping systems are required in characterization. Studies of cassava diversity analysis at
the molecular level have been successfully carried out using RFLP (Beeching et al., 1993),
RAPD (Marmey et al., 1993), SSR (Fregene et al., 2003, Moyib et al., 2007) and multi-locus
DNA fingerprinting.
Even though these molecular markers play a major role in cultivar identification and diversity
analysis, detection of similar polymorphism in most of the loci within closely related cultivars
is a limitation (Kawuki et al., 2009). In contrast, single nucleotide polymorphisms (SNPs), and
insertions and deletions (INDELS) give the most frequently occurring natural variation
(Kruglyak, 1997) which may provide sufficient disparity to discriminate closely related
cultivars. As cassava is an outcrossing (Da Silva et al., 2003) and inbreeding sensitive crop
like maize and orchids (Conopsea and Bifolia, 2017; Meghji et al., 1984; Rojas et al., 2009),
it is expected to have high DNA polymorphism due to the heterogeneity frequently found in
most of the loci. Kawuki et al. (2009) have characterized SNPs in cassava genes and found 26
SNPs in nine loci with an average of one SNP at every 121 nucleotides. They also found one
SNP at every 181 bp in coding regions, and one SNP in every 53 bp of non-coding regions. A
frequency of one SNP in 66 bp in 33 EST-derived products and one SNP in 49 bp in nine BAC-
end sequence products are also reported in cassava genome (Lopez et al., 2005; Kawuki et al.,
2009). Therefore, closely related cassava cultivars can be discriminated using SNP markers
due to their frequent distribution throughout the genome.
In Sri Lanka, cassava is mainly grown for direct human consumption rather than for
commercial applications although a sound local market exists. Recently, exporting of cassava
tubers became an attractive industry in Sri Lanka due to the high demand especially from
middle-east countries. So far, no studies have been carried out for cultivar discrimination even
though there are several studies published related to disease identification in cassava cultivars
(Jose et al., 2008; Kumarasinghe et al., 2009). Therefore, the present study was conducted to
characterize the morphological, biochemical and molecular traits and, consumer preference of
the cassava cultivars grown in Sri Lanka.
METHODOLOGY
Plant material
The stem cuttings of nine cassava cultivars namely; Wild-accession, MU51, Kirikavadi,
CARI555, Shani, Suranimala, Swarna, Hordi MU1 and Landrace (a cultivar name) were
collected from Horticultural Crop Research and Development Institute, Gannoruwa,

Characterization of Cassava (Manihot esculenta Crantz) Cultivars
53
Peradeniya (7.2757° N, 80.5988° E) and fields at Doluwa (7.1862° N, 80.6063° E), Sri Lanka.
Two replicates of the Wild-accession and three replicates from each of the other cultivars were
grown in a field at Katugastota, Sri Lanka. The uniform stem cuttings were selected for
planting to have accurate comparison of the morphological descriptors.
Morphological parameters
Leaf morphology
Leaf blade length, leaf blade width, number of leaflets and leaf area were measured in ten
leaves from each replicate at the age of seven months. Internodal lengths of four stems from
each replicate were measured in which each stem had a length of ten nodes. The mean diameter
of each stem was taken by measuring the diameter at three different positions and calculating
the mean value. At the harvesting stage, tuber weight, number of tubers, maximum, minimum
lengths and maximum, minimum diameters of tubers were measured.
Chlorophyll content of leaves
Estimation of chlorophyll content was done using two grams of fresh leaf material from each
of the three replicates per cultivar. The leaf samples were ground with 2 ml of 80% acetone
using mortar and pestle. Acetone extract of chlorophyll was collected into test tubes by filtering
through Whatman filter papers (125 mm, Cat No: 1005 125). The homogenate was washed
three times with 1 ml of acetone, and the final volume was made up to 5 ml with 80% acetone.
Then the concentration of total chlorophyll was quantified by reading the optical density at
663 nm and 645 nm. Finally, the chlorophyll content was calculated using the following
formula (Maclachlan and Zalik, 1963).
where,
Total chlorophyll content (mg/g) = 20.2 (A645) + 8.02 (A663) × V1000 × W………..(1)
A = the absorbance at specific wavelengths
V = the final volume of chlorophyll extract
W = the fresh weight of tissue extracted
Ascorbic acid content of leaves
A total of 30 g of leaves were ground from three replicates of each cultivar using 150 ml of
water. Then the ground solution was sonicated and filtered using Whatman filter papers
(2.5 µm) to use for the titrations. A 10 ml aliquots of each sample was taken into separate
beakers and 1 ml of starch indicator solution was added. The samples were titrated with
0.012 mol/l iodine solution, and the endpoint of the titration was identified when dark blue-
black color appeared due to the formation of the starch-iodine complex. Three titrations were
carried out per each replicate and the mean volumes of iodine solution used in concordant titers
were used in the calculations and the ascorbic acid concentration was expressed in mg/g.
Dry matter content of leaves and tubers
Five leaves from different maturity classes (top to bottom) from each replicate were sampled
to get the fresh weight of each leaf sample. Then they were oven dried at 65 ºC for several
days until the weight becomes constant. The dry matter content of each replicate was calculated
by dividing the dry weight of the leaves (mg) by the fresh weight of the leaves (g).
Dissanayake et al.
54
Ten tubers of approximately equal size from each replicate were taken, and the fresh weight
was recorded. Then the tubers were oven dried and the dry matter content of tubers was
calculated using the same calculation procedure described for the leaves.
Assessment of consumer preference of boiled cassava tubers
Three sensory panels were carried out separately after harvesting the tubers for each replicate.
Boiled tuber pieces were provided to 20 panelists to rank them for the desired color, the
preferred level of aroma, texture, bitterness, hardness and overall taste. A three-tier scoring
system was used for each of the parameters, in which the panelists were requested to assign 3
for the highest preference, 2 for the medium preference and 1 for the least preference.
Data analysis
All the data of leaf morphology, chlorophyll content, ascorbic acid content and dry matter
content were subjected to normality testing followed by GLM procedure and LSmeans-pdiff
mean separation using statistical package, SAS 9.4 (SAS Institute, NC, Cary, USA). Principal
component analysis (PCA) was conducted using morphological data of leaves and stems in
Minitab 17 (Minitab Inc. USA). PC1 and PC2 were obtained to draw scatterplots. Similar
procedure was followed to obtained PCA for the tuber parameters (mean number of tubers,
mean tuber weight, mean average length and mean average diameter) using Minitab 17
(Minitab Inc. USA). Another scatter plot was constructed employing the mean chlorophyll
content and mean dry matter content of leaves.
The taste panel data were subjected to association analysis using the chi-squared test and
Cramer’s V coefficient (CVC) available in Minitab 17. A dendrogram was constructed by
using the taste panel data for color, texture, aroma and overall taste of highest preference and
least preference data for hardness and bitterness using the algorithms of Complete Linkage and
Euclidean Distance method in Minitab 17.
The DNA extraction and PCR
Genomic DNA was extracted from leaves using the CTAB method (Doyle, 1991) and DNA
was quantified by measuring the absorbance at 260 nm and 280 nm. The quality of the DNA
was visualized using 1 % agarose gel electrophoresis.
The ITS1 (5’ TCC GTA GGT GAA CCT GCG G 3’) and ITS4 (5’ TCC TCC GCT TAT TGA
TAT GC 3’) (Glass and Donaldson, 1995) primers were used to amplify the ITS region using
a Thermal Cycler (TP600: Takara, Otsu Shiga, Japan). The PCR conditions were as follows.
For ITS primer pair, initial denaturation was done at 95ºC for one min, followed by 40 cycles
of denaturation at 94ºC for 30 secs, then annealing at 50.7ºC for 40 secs. The first extension
was done at 72ºC for 40 secs, and a final extension at 72ºC was carried out for five mins (White
et al., 1990). The PCR products were purified using the QIAquick PCR purification kit
(Catalog No: 28104, Qiagen, Hilten, Germany). The purified PCR products were sequenced
using the Genetic Analyzer 3500 (Catalog No: 622-0010, Applied Bio System®).

Characterization of Cassava (Manihot esculenta Crantz) Cultivars
55
Cultivar discrimination based on ITS sequences
Initially, the quality of the sequences was checked by curating .abl sequencer trace file. Then
the ambiguous regions were cut from the sequences, and consensus sequences were made
using MEGA V7 (Kumar et al., 2016). All the consensus sequences were then aligned using
MEGA by the ClustalW algorithm. The alignment was rechecked again for the detection of
unwanted INDELs that could be added during the automated aligning. The unweighted pair
group method with arithmetic means (UPGMA) tree was built in PAUP V4 (Swofford, 2001)
using uncorrected pairwise distances among the sequences. The resulting tree was modified
using FigTree 1.6b (Rambaut, 2014). Determination of SNPs and INDELs was carried out by
searching the alignment in alignment-explore in MEGA.
RESULTS AND DISCUSSION
Morphological diversity of leaves
Except the Landrace (P<0.05), the length of leaves of other eight cultivars was not
significantly different (Plate 1). The mean length of leaves in Landrace was 13.48 cm,
significantly different from those of other cultivars (Table 1, P<0.05). Except for Wild-
accession and Landrace (P<0.05), the width of leaves of other seven cultivars was not
significantly different. The highest mean width was recorded in Wild-accession (5.97cm)
revealing significant difference from other eight cultivars. The lowest mean leaf width was
observed in Landrace (3.72 cm) (Table 1, P<0.05). The mean number of leaflets among
cassava cultivars was significantly different (Table 1, P<0.05). The lowest mean number of
leaflets was recorded in the Wild-accession (4.25) exhibiting significant difference from other
eight cultivars (Table 1, P<0.05). The mean number of leaflets in MU51 and Shani was not
significantly different (7.83) (Table 1, P<0.05). Except the Landrace, the mean leaf area
among other cultivars was not significantly different (P<0.05). The significantly lowest mean
leaf area was observed in Landrace (132.57cm2) (Table 1, P<0.05).
Morphological diversity of stems
The mean diameters of the stems were significantly different among the cultivars (P<0.0001).
The highest mean diameter was recorded in Wild-accession (9.567cm) followed by Swarna
(8.967cm). The mean diameters of remaining cultivars were not significantly different from
each other (Table 2, P<0.05).
The mean inter-nodal length of stems was significantly different among the cultivars
(P<0.0001). The highest mean inter-nodal length was recorded in Wild-accession (4.299 cm)
followed by Kirikawadi (3.909cm) (Table 2, P<0.05). The significantly lowest mean inter-
nodal length was observed in the cultivar Landrace (2.138cm) (Table 2, P<0.05). Plate 2
displays the morphological variation of stems among the cultivars.
Dissanayake et al.
56
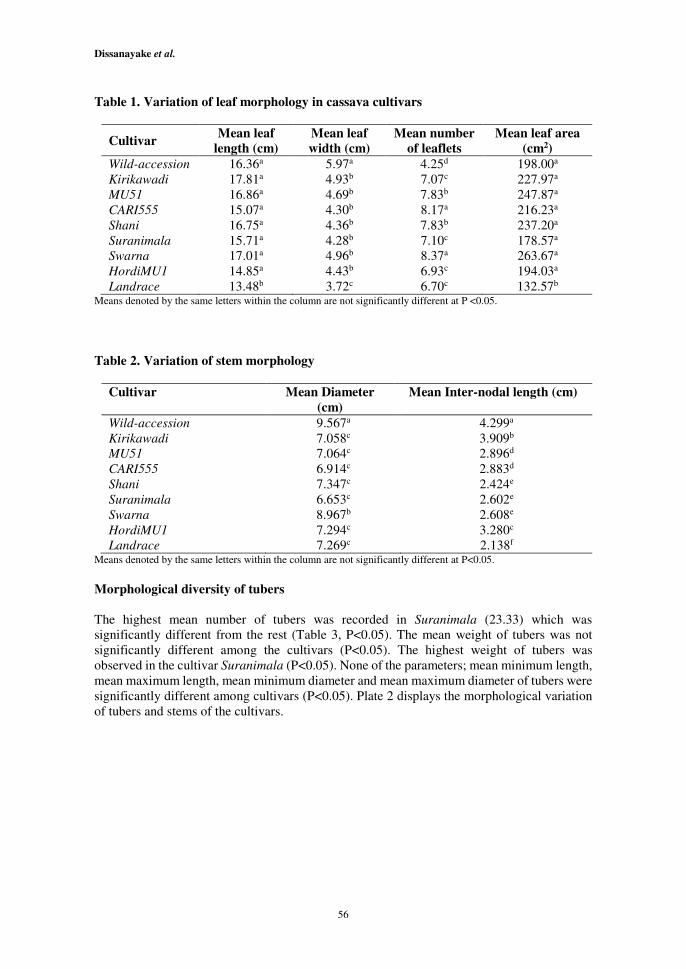
Table 1. Variation of leaf morphology in cassava cultivars
Cultivar Mean leaf
length (cm)
Mean leaf
width (cm)
Mean number
of leaflets
Mean leaf area
(cm2)
Wild-accession 16.36a 5.97a 4.25d 198.00a
Kirikawadi 17.81a 4.93b 7.07c 227.97a
MU51 16.86a 4.69b 7.83b 247.87a
CARI555 15.07a 4.30b 8.17a 216.23a
Shani 16.75a 4.36b 7.83b 237.20a
Suranimala 15.71a 4.28b 7.10c 178.57a
Swarna 17.01a 4.96b 8.37a 263.67a
HordiMU1 14.85a 4.43b 6.93c 194.03a
Landrace 13.48b 3.72c 6.70c 132.57b Means denoted by the same letters within the column are not significantly different at P <0.05.
Table 2. Variation of stem morphology
Cultivar Mean Diameter
(cm)
Mean Inter-nodal length (cm)
Wild-accession 9.567a 4.299a
Kirikawadi
MU51
CARI555
Shani
Suranimala
Swarna
HordiMU1
Landrace
7.058c
7.064c
6.914c
7.347c
6.653c
8.967b
7.294c
7.269c
3.909b
2.896d
2.883d
2.424e
2.602e
2.608e
3.280c
2.138f Means denoted by the same letters within the column are not significantly different at P<0.05.
Morphological diversity of tubers
The highest mean number of tubers was recorded in Suranimala (23.33) which was
significantly different from the rest (Table 3, P<0.05). The mean weight of tubers was not
significantly different among the cultivars (P<0.05). The highest weight of tubers was
observed in the cultivar Suranimala (P<0.05). None of the parameters; mean minimum length,
mean maximum length, mean minimum diameter and mean maximum diameter of tubers were
significantly different among cultivars (P<0.05). Plate 2 displays the morphological variation
of tubers and stems of the cultivars.

Characterization of Cassava (Manihot esculenta Crantz) Cultivars
57
Plate 1. The variation of leaf morphology in cassava leaves. A: Wild-accession, B:
Kirikawadi , C: MU51 , D: CARI555, E: Shani , F: Suranimala , G: Swarna , H:
HordiMU1 , I: Landrace

Dissanayake et al.
58
Table 3. Variation of tuber morphology
Cultivar
Mean
number
of
tubers
Mean
tuber
weight
(kg)
Mean
minimum
length
(cm)
Mean
maximum
length
(cm)
Mean
minimum
diameter
(cm)
Mean
maximum
diameter
(cm)
Wild-
accession 6.00b 2.26a 17.80a 45.80a 8.45a 16.60a
Kirikawadi
MU51
CARI555
Shani
Suranimala
Swarna
HordiMU1
Landrace
12.00b
13.00b
8.33b
9.67b
23.33a
14.67b
13.33b
6.67b
7.61a
5.80a
2.90a
4.15a
7.81a
4.59a
4.64a
2.38a
12.13a
14.97a
13.27a
10.77a
11.93a
10.57a
11.67a
9.80a
49.93a
45.00a
36.83a
47.67a
42.23a
37.60a
43.60a
32.20a
8.00a
7.07a
5.33a
5.73a
5.20a
4.37a
4.87a
5.17a
23.73a
20.50a
19.03a
20.30a
21.43a
20.80a
21.87a
19.37a Means denoted by the same letters within the column are not significantly different at P<0.05.
Plate 2. The representative views of cassava tubers and stems. A: Wild-accession, B:
Kirikawadi, C: MU51, D: CARI555, E: Shani, F: Suranimala, G: Swarna, H:
HordiMU1, I: Landrace .

Characterization of Cassava (Manihot esculenta Crantz) Cultivars
59
Cluster analysis
When considering the vegetative parameters (Figure 1), Landrace and Wild-accession
cultivars were clustered separately from the others. However, when comparing tuber
parameters, the Wild-accession grouped with the rest of the cultivars (Figure 2). According to
the scatter plot (Figure 2), Wild-accession and Shani clustered together whereas HordiMU1
and Suranimala positioned oppositely. Moreover, Kirikawadi and MU51 placed oppositely to
the CARI555, Landrace and Suranimala cultivars. Moreover, Kirikawadi and Suranimala
cultivars were different from the rest and the highest yield was observed in Suranimala.
Figure 1. Scatter plot of the PCA conducted for cassava cultivars based on vegetative
parameters of leaves and stems using Minitab17. Wild-accession and Landrace
cultivars can be discriminated from the rest using vegetative parameters.
Figure 2. Scatter plot of the PCA conducted for cassava cultivars based on tuber
parameters using Minitab17. Kirikawadi and Suranimala cultivars could be
discriminated from the rest of the cultivars using tuber parameters.
Dissanayake et al.
60
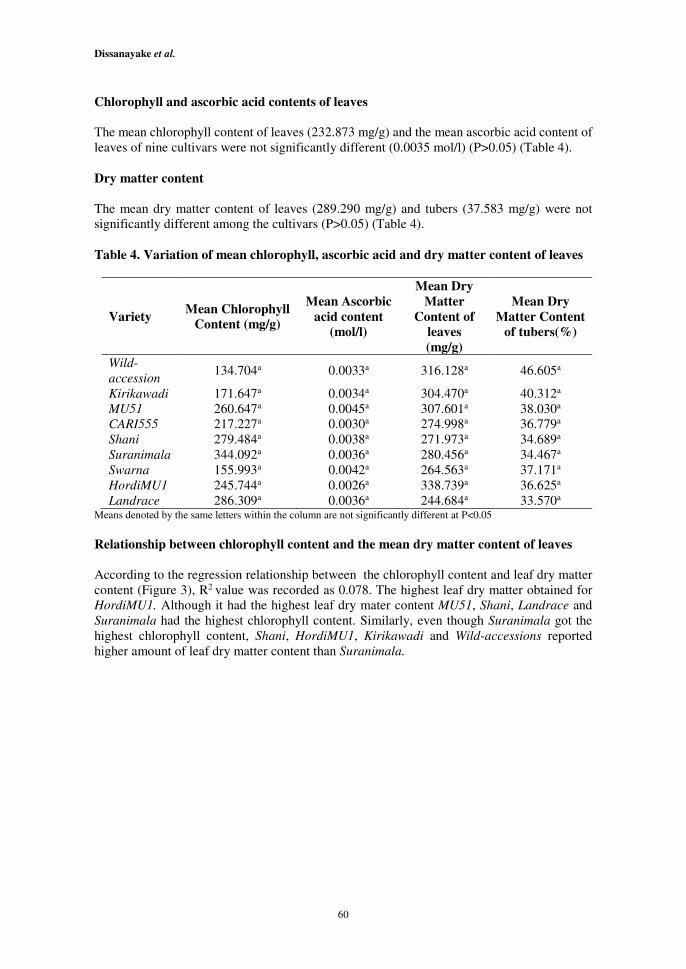
Chlorophyll and ascorbic acid contents of leaves
The mean chlorophyll content of leaves (232.873 mg/g) and the mean ascorbic acid content of
leaves of nine cultivars were not significantly different (0.0035 mol/l) (P>0.05) (Table 4).
Dry matter content
The mean dry matter content of leaves (289.290 mg/g) and tubers (37.583 mg/g) were not
significantly different among the cultivars (P>0.05) (Table 4).
Table 4. Variation of mean chlorophyll, ascorbic acid and dry matter content of leaves
Variety Mean Chlorophyll
Content (mg/g)
Mean Ascorbic
acid content
(mol/l)
Mean Dry
Matter
Content of
leaves
(mg/g)
Mean Dry
Matter Content
of tubers(%)
Wild-
accession 134.704a 0.0033a 316.128a 46.605a
Kirikawadi
MU51
CARI555
Shani
Suranimala
Swarna
HordiMU1
Landrace
171.647a
260.647a
217.227a
279.484a
344.092a
155.993a
245.744a
286.309a
0.0034a
0.0045a
0.0030a
0.0038a
0.0036a
0.0042a
0.0026a
0.0036a
304.470a
307.601a
274.998a
271.973a
280.456a
264.563a
338.739a
244.684a
40.312a
38.030a
36.779a
34.689a
34.467a
37.171a
36.625a
33.570a Means denoted by the same letters within the column are not significantly different at P<0.05
Relationship between chlorophyll content and the mean dry matter content of leaves
According to the regression relationship between the chlorophyll content and leaf dry matter
content (Figure 3), R2 value was recorded as 0.078. The highest leaf dry matter obtained for
HordiMU1. Although it had the highest leaf dry mater content MU51, Shani, Landrace and
Suranimala had the highest chlorophyll content. Similarly, even though Suranimala got the
highest chlorophyll content, Shani, HordiMU1, Kirikawadi and Wild-accessions reported
higher amount of leaf dry matter content than Suranimala.

Characterization of Cassava (Manihot esculenta Crantz) Cultivars
61
Figure 3. Regression relationship between chlorophyll content (X) and leaf dry matter
content (Y).
The boiled tuber samples used for the taste panel analysis are given in Plate 3. Boiled tuber
pieces of Wild-accession and MU51 were observed with intense yellow color whereas the
cultivars Kirikawadi and Swarna showed less intense yellow color. Tuber pieces of CARI555,
Shani, Suranimala and HordiMU1 appeared similar showing whitish yellow color and
Landrace cultivar looked light yellow in color (Plate 3). Association analysis of cassava
cultivars with all the tested parameters (desired color, the preferred levels of aroma, the texture,
bitterness, hardness and overall taste) showed significant association at P<0.05 (Table 5). The
highest association was observed between the cassava cultivar and the overall taste (χ2 =
107.70) followed by the association between cassava cultivar and the hardness (χ2 = 88.74),
texture (χ2 = 80.35), color (χ2 = 47.19) and aroma (χ2= 30.88). However, the strength of the
association was weak as indicated by Cramer's V-square (Table 5). Association between the
color and the other parameters were also significant whereas color and the overall taste showed
the highest association (χ2= 80.69). Texture, bitterness, hardness and overall taste were
significantly associated with aroma. Similarly, overall taste showed the highest association
with the aroma (χ2= 92.34). The texture was significantly associated with the bitterness,
hardness and overall taste. As observed previously, the highest association was observed
between texture and the overall taste (χ2= 216.42). Association between the bitterness was
significant with hardness (χ2= 70.52) and overall taste (χ2= 95.00) but the hardness was only
significantly associated with the overall taste (χ2= 197.18).
The row percentages given in Table 5 of the significant associations revealed that the desired
level of color was highest for MU51, medium for HordiMU1 and least for Suranimala. The
highest preference level of aroma was observed in Kirikawadi (38%) whereas HordiMU1
received the least preferred level of aroma (28%). The highest preference level of texture was
observed in MU51 whereas Wild-accession reported the least preferred level of texture (Table
5, P<0.05). The degree of bitterness was highest for CARI555, medium for Suranimala and
least for Kirikawadi. Preference level of hardness was highest for MU51 and least for Wild-

Dissanayake et al.
62
accession. Kirikawadi reported the highest preferred level of overall taste whereas Shani
reported the medium level and the least preferred level of overall taste was observed for
Landrace.
Table 5. Association analysis of the taste parameters and the Cassava cultivars.
Pearson
χχχχ2 P-Value
Cramer's
V-square
Cassava cultivar vs. Desired Color
Cassava
Cultivar
Desired Colour
47.19 0.000 0.05
Low(1) Medium(2) High(3)
Wild-
accession
12%# 55% 33%
Kirikawadi 12% 37% 51%
MU51 7% 41% 52%
CARI555 27% 51% 22%
Shani 18% 52% 30%
Suranimala 35% 45% 20%
Swarna 13% 45% 42%
HordiMU1 23% 58% 19%
Landrace 22% 48% 30%
Cassava cultivar vs. Preferred level of Aroma
Cassava
Cultivar
Preferred level of Aroma
30.88 0.006 0.03
Low(1) Medium(2) High(3)
Wild-
accession
25% 65% 10%
Kirikawadi 7% 55% 38%
MU51 8% 55% 37%
CARI555 25% 53% 22%
Shani 27% 50% 23%
Suranimala 20% 50% 30%
Swarna 20% 60% 20%
HordiMU1 28% 52% 20%
Landrace 13% 55% 32%
Cassava cultivar vs. Preferred level of Texture
Cassava
Cultivar
Preferred level of Texture
80.35 0.000 0.08
Low(1) Medium(2) High(3)
Wild-
accession
55% 38% 7%
Kirikawadi 10% 38% 52%
MU51 7% 28% 65%
CARI555 17% 46% 37%
Shani 23% 54% 23%
Suranimala 23% 54% 23%
Swarna 15% 47% 38%
HordiMU1 27% 43% 30%
Landrace 10% 47% 43%
Cassava cultivar vs. Degree of Bitterness
Cassava
Cultivar
Preferred level of Texture
26.87 0.015 0.03
Low(1) Medium(2) High(3)
Wild-
accession
40% 40% 20%
Kirikawadi 68% 20% 12%

Characterization of Cassava (Manihot esculenta Crantz) Cultivars
63
Pearson
χχχχ2 P-Value
Cramer's
V-square
MU51 60% 25% 15%
CARI555 47% 28% 25%
Shani 44% 38% 18%
Suranimala 36% 42% 22%
Swarna 58% 35% 7%
HordiMU1 56% 32% 12%
Landrace 63% 27% 10%
Cassava cultivar vs. Preferred level of Hardness
Cassava
Cultivar
Preferred level of Hardness
88.74 0.000 0.09
Low(1) Medium(2) High(3)
Wild-
accession
48% 45% 7%
Kirikawadi 15% 25% 60%
MU51 5% 23% 72%
CARI555 18% 33% 49%
Shani 30% 50% 20%
Suranimala 23% 47% 30%
Swarna 18% 43% 39%
HordiMU1 32% 43% 25%
Landrace 8% 40% 52%
Cassava cultivar vs. Preferred level of Overall Taste
Cassava
Cultivar
Preferred level of Overall Taste
107.70 0.000 0.10
Low(1) Medium(2) High(3)
Wild-
accession
35% 62% 3%
Kirikawadi 8% 25% 67%
MU51 7% 33% 60%
CARI555 12% 60% 28%
Shani 18% 68% 19%
Suranimala 27% 50% 23%
Swarna 18% 45% 37%
HordiMU1 37% 35% 28%
Landrace 7% 48% 45%

Dissanayake et al.
64
Plate 3. The images of boiled cassava tubers. A: Wild-accession, B: Kirikawadi, C: MU51,
D: CARI555, E: Shani, F: Suranimala, G: Swarna, H: HordiMU1, I: Landrace.
Cluster analysis of organoleptic assessment
According to the dendrogram constructed with consumer preference data, three clusters were
observed around 60% similarity level in which the Wild-accession was clustered separately
from the rest of the cultivars (Figure 4). However, around 90% similarity level, all the cultivars
are grouped into individual clusters (Figure 4).

Characterization of Cassava (Manihot esculenta Crantz) Cultivars
65
Figure 4. Dendrogram of consumer preferences analysis constructed using Mintab17.
Wild-accession has a different consumer preference levels than the other
cultivars.
ITS based DNA barcoding
According to the dendrogram obtained, SNPs and INDELS of ITS genomic region were able
to distinguish nine cassava cultivars into eight individual groups at a genetic divergence level
of 0.0025. Among nine cassava cultivars, the Wild-accession was the most distinctly resolving
subject from the rest of the cultivars holding unique mutations (Figure 5). Nucleotide
substitutions of C to T at four positions (23, 73, 322 and 380) and T to C substitution at two
positions (42 and 53) observed in Wild-accession was unique and the INDEL found at the 384th
position of the nucleotide sequence is also unique for the Wild-accession. Other than that, there
were nucleotide substitutions found only in Wild-accession at the positions of 89, 146, 368 and
515 (G89A, A146G, A368T, and A515G) further increasing the discrimination power. Rest of
the eight cultivars was clustered mainly into two groups at a genetic divergence of 0.0037.
Among the eight cultivars, Shani, Suranimala, Landrace, Kirikawadi, and CARI555 were

Dissanayake et al.
66
clustered into one clade sharing two unique SNPs of G at 11th and 14th positions whereas
MU51, HordiMU1 and Swarna were clustered into the other clade sharing the unique SNPs of
A at the same two positions. The generated sequences in the present study were submitted to
GenBank under the accession numbers MK114626-MK114634 (www.ncbi.nlm.nih.gov).
Figure 5. Cultivar discrimination based on UPGMA tree construction and SNP
profiling of the ITS region. The X-axis represents the uncorrected pairwise
distance. SNP profile is shown next to the tree.
A cultivar description based on precise molecular, morphological and organoleptic parameters,
chlorophyll and ascorbic acid contents of leaves, and dry matter content was done in the present
study. Only some of the morphological parameters (mean number of leaflets, mean diameter
and mean internodal length of stems) could be used to discriminate among cultivars, however,
they were not helpful in discriminating the cultivars at initial stages of plant growth. However,
none of the parameters including mean chlorophyll content and mean ascorbic acid content
could not be used to differentiate the cultivars (Table 4). The application of DNA based
identification methods can be used for the precise molecular identification of cassava cultivars
in Sri Lanka. In addition, the detected ITS sequences for each cultivar could be used as DNA
barcodes to authenticate cassava cultivars in the export market. However, another barcode
must be sorted to discriminate the Kirikawadi and CARI555.
The results revealed that the Landrace cultivar was significantly different from the other
cultivars by mean leaf length, mean leaf width and mean leaf area. The mean number of leaflets
of the Landrace cultivar was not significantly different from that of Kirikawadi, Suranimala,
and HordiMU1. Wild-accession was significantly different from other cultivars by mean leaf
width and mean number of leaflets and it showed the highest mean leaf width compared to the
others. The lowest leaf length, leaf width and leaf area were observed in the Landrace cultivar
whereas the lowest number of leaflets was observed in the Wild-accession. Except for
Landrace, the mean length of leaves and mean leaf area of other cultivars were not significantly
different from each other. Weak relationships were observed between mean length of leaves
and cultivar; mean width of leaves and cultivar; and mean leaf area and cultivar whereas a
strong relationship was observed between the mean number of leaflets and cultivar (Plate 1).
When stem morphology was considered, Wild-accession showed significantly highest mean
diameter of stems followed by Swarna whereas the other cultivars were not significantly
different from each other by the mean diameter of stems (Plate 2). The mean internodal length
of stems of nine cultivars was significantly different (P< 0.05).

Characterization of Cassava (Manihot esculenta Crantz) Cultivars
67
Suranimala cultivar had the significantly highest mean number of tubers (P<0.05). All the
other morphological characters of tubers including the mean weight of tubers, mean maximum
and minimum lengths of tubers and mean maximum and minimum diameter of tubers were
not significantly different among the nine cultivars. Strong relationships were observed among
all the tubers mentioned above characters (including the number of tubers) and cultivars. Thus,
this could be used to discriminate the cultivars employed in this study.
Taste panel data revealed that MU51 has the highest desired level of color whereas the
Suranimala cultivar has the least and HordiMU1 has the medium. The association between
cassava cultivar and preference level of aroma indicated that HordiMU1 has the least
preference over the rest of the cultivars whereas the highest preference was observed in
Kirikawadi (Figure 1). Similarly, in terms of desired level of texture and hardness, MU51 has
the highest preference and the Wild-accession has the least preference. Kirikawadi cultivar
shows the least degree of bitterness and the highest preference level of overall taste (Figure 1).
Considering the association between cassava cultivar and the preference level of the overall
taste, Landrace has the least preference over the rest of the cultivars. All the possible
combinations of the parameters mentioned above, such as color and aroma, overall taste and
hardness, texture and bitterness are significantly associated. The bitterness of cassava was
found to be related to the content of cyanoglucoside in sensory evaluation of 38 cassava strains
(Sundaresan et al., 1987). There were no significant differences among the nine cultivars with
regard to other parameters including chlorophyll content of leaves, the ascorbic acid content
of leaves and dry matter content of leaves and tubers. Using vegetative parameters Wild-
accession can be clearly discriminated from rest of the cultivars (Figure 1). Whereas other
cultivars cannot be categorized using vegetative parameters. According to the scattered plot
obtained for the tuber parameters (Figure 2) Kirikawadi and Suranimala can be differentiated
from rest of the cultivars. However, rest of the cultivars could not be distinguished using tuber
parameters. The regression model accounts for 7.62% of the variation (Figure 3). There is no
any significant relationship among chlorophyll and the leaf dry matter contents. According to
the organoleptic parameters, Wild-accession has a much varied preference level than the other
cultivars (Figure 4). It can be inferred that Wild-accession is not preferred by the people
compared to the other cultivars. A clear cultivar separation was obtained from the distance tree
construction for ITS genomic region. Total of 18 SNPs and one INDEL was observed in ITS
region for the nine cultivars (Figure 3). The Wild-accession was traced (0.0075) from the rest
of the group sharing unique SNP position concerning other groups. This is the first study to
report the divergence between commercial cassava cultivars and wild cassava accession found
in Sri Lankan habitats. It is important to infer the molecular phylogeny of wild cassava
accession compared to other cultivars which implied from the ITS haplotype. It is essential to
carry out a complete, molecular systematic study of wild cassava accession as it could be a
new species.
CONCLUSIONS
Morphological assessment of the nine cassava cultivars indicated that the leaf morphology of
Wild-accession and Landrace cultivars is significantly different from the rest of the cultivars.
Stem morphology among the nine cultivars is significantly different mainly by the mean
internodal length of the stems whereas Wild-accession and Swarna cultivars are significantly
different from the rest by the diameter of the stems. With regard to tuber morphology,
Suranimala cultivar is significantly different in comparison to other cultivars in tuber
morphology. The taste panel revealed that the cassava cultivars Wild-accession, Kirikawadi,
MU51, CARI555, Shani, Suranimala, Swarna, HordiMU1 and Landrace have significantly

Dissanayake et al.
68
different levels of preferred color, texture, aroma, hardness, overall taste and degree of
bitterness. The MU51 has the highest preferred color, texture, and hardness, while Kirikawadi
shows the highest preference levels of aroma and overall taste. CARI555 has the highest degree
of bitterness. When the other parameters of leaves and tubers of cassava cultivars including
chlorophyll content of leaves, the ascorbic content of leaves and dry matter content of leaves
and tubers are considered, no significant differences were observed among the cassava
cultivars (232.873 mg/g, 0.0035 mol/l, 289.290 mg/g, 37.583 % respectively). The ITS DNA
barcoding marker ably separated the cultivars. Altogether, 18 SNPs were identified, nine of
them were unique to Wild-accession. It has diverged from the rest of the cultivars elevating
the importance of doing further taxonomic studies.
ACKNOLEDGEMENT
Authors wish to acknowledge Mr. U. Seneviratne, Assistant Director of Department of
Agriculture, Peradeniya.
REFERENCES
Adelekan, B.A. (2010). Investigation of ethanol productivity of cassava crop as a sustainable
source of biofuel in tropical countries. Afr. J. Biotechnol. 9 (35), 5643-5650.
Beeching, J.R., Marmey, P., Gavalda, M.C., Noirot, M., Haysom, H.R., Hughes, M.A. and
Charrier, A. (1993). An assessment of genetic diversity within a collection of cassava (Manihot
esculenta Crantz) germplasm using molecular markers. Ann. Bot. 72 (6), 515-520.
Carvalho. L.J. and Schaal, B.A. (2001). Assessing genetic diversity in the cassava (Manihot
esculenta Crantz) germplasm collection in Brazil using PCR-based markers. Euphytica. 120
(1), 133-142.
Chavarriaga-Aguirre, P., Maya, M.M., Tohme, J., Duque, M.C., Iglesias, C., Bonierbale,
M.W., Kresovich, S. and Kochert, G. (1999). Using microsatellites, isozymes and AFLPs to
evaluate genetic diversity and redundancy in the cassava core collection and to assess the
usefulness of DNA-based markers to maintain germplasm collections. Mol. Breed. 5 (3), 263-
273.
Cock, J.H. (1982). Cassava: a basic energy source in the tropics. Science. 218 (4574), 755-
762.
Conopsea, G. and Bifolia, P. (2017). The ability of spontaneous autogamy in four orchid
species: Cephalanthera rubra, neottia ovata. ACTA BIOL CRACOV BOT, 59 (2), 51-61.
Da Silva, R.M., Bandel, G. and Martins, P.S. (2003). Mating system in an experimental garden
composed of cassava (Manihot esculenta Crantz) ethnovarieties. Euphytica. 134 (2), 127-135.
Doyle, J. (1991). DNA protocols for plants. In Molecular techniques in taxonomy Springer,
Berlin, Heidelberg, pp. 283-293.
Elias, M., Penet, L., Vindry, P., McKey, D., Panaud, O. and Robert, T. (2001). Unmanaged
sexual reproduction and the dynamics of genetic diversity of a vegetatively propagated crop

Characterization of Cassava (Manihot esculenta Crantz) Cultivars
69
plant, cassava (Manihot esculenta Crantz), in a traditional farming system. Mol Ecol. 10 (8),
1895-907.
El-Sharkawy, M.A. (2003). Cassava biology and physiology. Plant Mol. Biol. 53 (5), 621-641.
Fregene, M.A., Suarez, M., Mkumbira, J., Kulembeka, H., Ndedya, E., Kulaya, A., Mitchel,
S., Gullberg, U., Rosling, H., Dixon, A.G. and Dean, R. (2003). Simple sequence repeat marker
diversity in cassava landraces: genetic diversity and differentiation in an asexually propagated
crop. Theor Appl Genet. 107 (6), 1083-1093.
Glass, N.L. and Donaldson, G.C. (1995). Development of primer sets designed for use with
the PCR to amplify conserved genes from filamentous ascomycetes. Appl. Environ.
Microbiol. 61(4), 1323-1330.
Hershey, C.H., (2017). Breeding, delivery, use and benefits of bio-fortified cassava Elizabeth
Parkes and Olufemi Aina, International Institute of Tropical Agriculture (IITA), Nigeria. In
Achieving sustainable cultivation of cassava (Volume 2). Burleigh Dodds Science Publishing,
pp. 191-203.
Jansson, C., Westerbergh, A., Zhang, J., Hu, X. and Sun, C. (2009). Cassava, a potential biofuel
crop in (the) People’s Republic of China. Appl Energy. 86, 95-99.
Jimenez-Nieto, A. (1994). Identificación de duplicados del banco de germoplasma de yuca
(Manihot esculenta Crantz) del CIAT, B.S. thesis. Universidad Nacional de Colombia,
Palmira, Colombia
Jose, A., Makeshkumar, T. and Edison, S. (2008). Host range of Sri Lankan cassava mosaic
virus. J Root Crops. 34, 21-25.
Kawuki, R.S., Ferguson, M., Labuschagne, M., Herselman, L. and Kim, D.J. (2009).
Identification, characterisation and application of single nucleotide polymorphisms for
diversity assessment in cassava (Manihot esculenta Crantz). Mol. Breed. 23 (4), 669-684.
Kruglyak, L. (1997). The use of a genetic map of biallelic markers in linkage studies. Nat.
Genet. 17 (1), 21.
Kumar, S., Stecher, G. and Tamura, K. (2016). MEGA7: Molecular Evolutionary Genetics
Analysis version 7.0 for bigger datasets. Mol Biol Evol. 33 (7), 1870-1874.
Kumarasinghe, N., Salim, N. and Wijayarathne, W. (2009). Identification and biology of two
whitefly species on cassava in Sri Lanka. Journal of plant protection research. 49 (4), 373-377.
Lefevre, F. (1989). Ressources Génétiques et amelioration du Manihoc, Manihot esculenta
Crantz, en Afrique. Institut National Agronomique Paris-Grignon, Paris, France, pp.176.
Lopez, C., Piegu, B., Cooke, R., Delseny, M., Tohme, J. and Verdier, V. (2005). Using cDNA
and genomic sequences as tools to develop SNP strategies in cassava (Manihot esculenta
Crantz). Theor. Appl. Genet. 110 (3), 425-431.

Dissanayake et al.
70
Maclachlan, S. and Zalik, S. (1963). Plastid structure, chlorophyll concentration, and free
amino acid composition of a chlorophyll mutant of barley. Can J Bot. 41(7), 1053-1062.
Marmey, P., Beeching, J.R., Hamon, S. and Charrier, A. (1993). Evaluation of cassava
(Manihot esculenta Crantz) germplasm collections using RAPD markers. Euphytica. 74 (3),
203-209.
Meghji, M.R., Dudley, J.W., Lambert, R.J. and Sprague, G.F. (1984). Inbreeding Depression,
Inbred and Hybrid Grain Yields, and Other Traits of Maize Genotypes Representing Three
Eras 1. Crop Sci. 24 (3), 545-549.
Moyib, O.K., Odunola, O.A. and Dixon, A.G.O. (2007). SSR markers reveal genetic variation
between improved cassava cultivars and landraces within a collection of Nigerian cassava
germplasm. Afr. J. Biotechnol. 6 (23), 2666-2674.
Ocampo, C., Hershey, C.H., Iglesias, F. and Iwanaga, M. (1993). Esterase isozyme
fingerprinting of the cassava germplasm collection held at nCIAT. In: Roca W, Thro AM (eds)
Proc 1st Int Sci Meet Cassava Biotechnol Network. CIAT, Cali, Colombia, pp 81-89.
Rambaut, A. (2014) FigTree, a graphical viewer of aphylogenetic trees [online]. Available on:
http://tree. bio. ed.ac. uk/software/figtree. (Date of access: 20.08.2017).
Reynolds, S.M., (2017). SNP-based genetic linkage mapping and whole-genome diversity
assessment in cassava (Manihot esculenta Crantz) accessions from Africa and Latin America
(Doctoral dissertation, University of Pretoria).
Rodriguez, A. and Sanders, I.R. (2015). The role of community and population ecology in
applying mycorrhizal fungi for improved food security. ISME J.9 (5),1053.
Rojas, M.C., Pérez, J.C., Ceballos, H., Baena, D., Morante, N. and Calle, F. (2009). Analysis
of inbreeding depression in eight S 1 cassava families. Crop Sci. 49 (2), 543-548.
Sundaresan, S., Nambisan, B. and Amma, C.S.E. (1987). Bitterness in cassava in relation to
cyanoglucoside content’. Indian J Agr Sci., 57(1), 37-40.
Swofford, D.L. (2001). Paup*: Phylogenetic analysis using parsimony (and other methods)
4.0. B5.
White, T.J., Bruns, T., Lee, S. and Taylor, J. (1990). In: Innis, A., Gelfand, D.H., Sninsky, J.
J. (Eds.), PCR Protocols, Academic Press, San Diego, USA, pp.315-322.
Ziska, L.H., Runion, G.B., Tomecek, M., Prior, S.A., Torbet, H.A. and Sicher, R. (2009). An
evaluation of cassava, sweet potato and field corn as potential carbohydrate sources for
bioethanol production in Alabama and Maryland. Biomass Bioenergy. 33 (11), 1503-1508.