physical properties, characterization and interaction mechanism
TRANSCRIPT
III
PHYSICAL PROPERTIES, CHARACTERIZATION
AND INTERACTION MECHANISM STUDY
BETWEEN BARIUM SULPHATE AND
DIETHYLENETRIAMINEPENTAACETIC ACID
PENTAPOTASSIUM SALT
SAPIYAH BINTI MOHD SUKRI
Thesis submitted in partial fulfilment of the requirements
for the award of the degree of Bachelor of Chemical Engineering (Gas Technology)
Faculty of Chemical & Natural Resources Engineering
UNIVERSITI MALAYSIA PAHANG
JANUARY 2015
©SAPIYAH BINTI MOHD SUKRI (2015)
VIII
ABSTRACT
The scale formation of inner pipe was a common problem in oil and gas production
industries. This problem resulted in decreasing in the amount of oil and gas produced
and production efficiency, formation damage, emergency shutdown, equipment failure
and increase the maintenance cost. The deposition of scale often resulted from the
incompatibility between injected saline water and reservoir water. The common scales
formed in the oil field are CaCO3, CaSO4 (anhydrite, gypsum), BaSO4 (barite), SrSO4
(celestite) and ferrous scale. Among the scales, BaSO4 was the hardest scale and
difficult to remove chemically or mechanically. Thus, a suitable chelating agent needs
to be identified in order to overcome this problem. In this present study, the physical
properties, characterization and interaction mechanism between BaSO4 and
Diethylenetriaminepentaacetic acid pentapotasium salt (DTPA) used as solvent were
investigated. Based on the findings, the pH value of pure DTPA and DTPA-BaSO4
mixture were same which were 14.00. On the other hand, the pure DTPA viscosity was
7.28 mPa.s and based on the observation, the DTPA-BaSO4 mixture was identified less
viscous than the pure DTPA. The density for pure DTPA was 1.787 g/ml and the
mixture of DTPA and BaSO4 were expected to increase as the mass of solute increase.
The amount of water content for both samples did not change which was 54.10 %.
Besides that, the CHNS and ICP-MS results represented the structure of DTPA. In
addition, the interaction mechanism study based on the FTIR and NMR analysis showed
that DTPA and BaSO4 having hydrogen bonding interaction at CH2 functional group.

IX
ABSTRAK
Pembentukan mendapan di dalam paip adalah masalah biasa dalam industri pengeluaran
minyak dan gas. Masalah ini menyebabkan penurunan dalam pengeluaran minyak dan
gas dan kecekapan pengeluaran, kerosakan formasi, penutupan kecemasan, kegagalan
peralatan dan meningkatkan kos penyelenggaraan. Pemendapan sering terjadi akibat
daripada ketidakserasian di antara air masin dan air dipam ke dalam telaga minyak dan
gas. Mendapan yang biasa terbentuk dalam adalah CaCO3, CaSO4 (anhidrat, gipsum),
BaSO4 (barit), SrSO4 (selestit) dan mendapan ferus. Antara pembentukan mendapan ini,
BaSO4 adalah mendapan yang paling sukar dan susah untuk dihapuskan sama ada
menggunakan bahan kimia atau pun secara mekanikal. Oleh itu, ejen pelarut yang sesuai
perlu dikenal pasti untuk mengatasi masalah ini. Dalam kajian ini, ciri-ciri fizikal,
penyifatan dan kajian mekanisme interaksi antara BaSO4 dan
Diethylenetriaminepentaacetic asid pentapotasium garam (DTPA) yang digunakan
sebagai ejen pelarut telah dianalisa. Berdasarkan kajian ini, nilai pH DTPA asli dan
campuran DTPA- BaSO4 adalah sama iaitu 14.00. Sebaliknya, kelikatan DTPA yang
tulen adalah 7.28 mPa.s dan berdasarkan analisa yang dijalankan, campuran DTPA-
BaSO4 telah dikenal pasti kurang likat daripada DTPA tulen. Ketumpatan tulen DTPA
adalah 1.787 g / ml dan campuran DTPA dan BaSO4 dijangka meningkat kerana
peningkatan jisim bahan larut. Jumlah kandungan air bagi kedua-dua sampel tidak
berubah iaitu 54.10%. Di samping itu, CHNS dan ICP-MS keputusan diwakili struktur
DTPA. Di samping itu, kajian mekanisme interaksi berdasarkan FTIR dan NMR
analisis menunjukkan bahawa DTPA dan BaSO4 mempunyai ikatan hidrogen interaksi
di kumpulan berfungsi CH2.
X
TABLE OF CONTENTS
SUPERVISOR’S DECLARATION ........................................................................... IV
STUDENT’S DECLARATION ................................................................................... V
Dedication .................................................................................................................. VI
ACKNOWLEDGEMENT ......................................................................................... VII
ABSTRACT ............................................................................................................. VIII
ABSTRAK ................................................................................................................. IX
TABLE OF CONTENTS ............................................................................................. X
LIST OF FIGURES ................................................................................................... XII
LIST OF TABLES ................................................................................................... XIII LIST OF ABBREVIATIONS ................................................................................... XIV
LIST OF ABBREVIATIONS .................................................................................... XV
1 INTRODUCTION ................................................................................................. 1
1.0 Background ..................................................................................................... 1
1.1 Motivation....................................................................................................... 1
1.2 Problem statement ........................................................................................... 4
1.3 Objectives ....................................................................................................... 4
1.4 Scope of this research ...................................................................................... 4
1.5 Organisation of this thesis ............................................................................... 5
2 LITERATURE REVIEW ...................................................................................... 6
2.0 Overview ........................................................................................................ 6
2.1 Type of scales ................................................................................................. 6
2.1.1 Calcium carbonate scale ........................................................................... 6
2.1.2 Calcium sulphate scale ............................................................................. 7
2.1.3 Barium sulphate scale ............................................................................... 7
2.2 Deposition of scales ........................................................................................ 8
2.3 Solubility of scales ........................................................................................ 14
2.3.1 Effect of temperature .............................................................................. 15
2.3.2 Effect of pressure ................................................................................... 15
2.3.3 Effect of supersaturation......................................................................... 16
2.3.4 Effect of ionic strength ........................................................................... 16
2.3.5 Effect of carbon dioxide partial pressure................................................. 18
2.3.6 Effect of pH ........................................................................................... 18
2.4 Scale treatments ............................................................................................ 18
2.5 Summary ....................................................................................................... 22
3 MATERIALS AND METHODS ......................................................................... 23
3.0 Overview ...................................................................................................... 23
3.1 Material and chemicals .................................................................................. 23
3.2 Methodology ................................................................................................. 23
3.2.1 pH test.................................................................................................... 23
3.2.2 Viscosity ................................................................................................ 24
3.2.3 Density................................................................................................... 25
3.2.4 Water content analysis............................................................................ 26
3.2.5 ICP-MS analysis .................................................................................... 27
3.2.6 FTIR analysis ......................................................................................... 27
3.2.7 NMR analysis ........................................................................................ 28
XI
3.2.8 Solubility study ...................................................................................... 28
3.2.9 Solubility verification test ...................................................................... 30
3.3 Precaution ..................................................................................................... 30
4 RESULTS AND DISCUSSIONS ........................................................................ 31
4.0 Overview ...................................................................................................... 31
4.1 Physical properties ........................................................................................ 31
4.2 Characterization of pure DTPA ..................................................................... 33
4.2.1 CHNS analysis ....................................................................................... 33
4.2.2 ICP-MS analysis .................................................................................... 34
4.3 Interaction mechanism study ......................................................................... 34
4.3.1 FTIR analysis ......................................................................................... 35
4.3.2 NMR analysis ........................................................................................ 35
4.4 Solubility study ............................................................................................. 37
4.5 Summary ....................................................................................................... 39
5 CONCLUSION ................................................................................................... 40
5.0 Conclusion .................................................................................................... 40
5.1 Recommendation .......................................................................................... 41
REFERENCES............................................................................................................ 42
APPENDICES ............................................................................................................ 46
Appendix A ............................................................................................................. 46
Appendix B ............................................................................................................. 47
Appendix C ............................................................................................................. 48
XII
LIST OF FIGURES
Figure 2-1: Homogeneous nucleation process is where ion pairs forming single crystals in solution (Crabtree et al., 1999) ............................................................................9
Figure 2-2: Heterogeneous nucleation process is growth of scales on pre-existing
surface defects (Crabtree et al., 1999) ....................................................................10
Figure 2-3: Scale in tubing (Sandengen, 2006) ........................................................10
Figure 2-4: Location throughout the flow system where the scale deposition may take
place (Jordan et al., 2008) .....................................................................................12
Figure 2-5: Solubility of common oilfield scales at various temperatures (Connell,
1983). .................................................................................................................15
Figure 2-6: Relative solubility of sulphates in brine (Lindlof & Stoffer, 1983)............17
Figure 2-7: Induction time for BaSO4 precipitation at 70oC and two different
supersaturated brines of barite (Fan et al., 2012) .....................................................21
Figure 2-8: Induction time of BaSO4 precipitation (Fan et al., 2012) .........................21
Figure 3-1: Mettler Toledo FiveEasy pH meter .......................................................24
Figure 3-2: Brookfield viscometer .........................................................................24
Figure 3-3: Cannon-Fenske Routine viscometer ......................................................25
Figure 3-4: Cannon-Fenske Routine viscometer tube ...............................................26
Figure 3-5: Karcl Fischer Titrator ..........................................................................26
Figure 3-6: ICP-MS instrument .............................................................................27
Figure 3-7: FTIR spectrometer ..............................................................................27
Figure 3-8: NMR Spectrometer .............................................................................28
Figure 3-9: Flow chart for the solubility test ...........................................................29
Figure 3-10: KUBOTA centrifuge .........................................................................30
Figure 4-1: Density for pure DTPA using Cannon-Fenske Routine viscometer ...........32
Figure 4-2: Shifting in FTIR result at CH2 functional group .....................................35
Figure 4-3: NMR analysis (A) CH2 bonding showed singlet peak (B) CH2 bonding
showed triplet peak ..............................................................................................36
Figure 4-4: Shifting in NMR result for CH2 (A) functional group..............................36
Figure 4-5: Shifting in NMR result for CH2 (B) functional group ..............................37
Figure 4-6: DTPA-BaSO4 mixture during 2 hours of stirring ....................................37
Figure 4-7: DTPA-BaSO4 mixture after experiment when the mass ratio was less than
0.32 to 100 ..........................................................................................................38
Figure 4-8: DTPA-BaSO4 mixture after experiment when the mass ratio was greater
than 0.32 to 100 ...................................................................................................38
Figure 4-9: DTPA-BaSO4 mixture after centrifuge test ............................................39
XIII
LIST OF TABLES
Table 1-1: Common oilfield scales (Amiri & Moghadasi, 2010) .................................2
Table 2-1: Type of scale inhibitors (Fan et al., 2012) ...............................................20
Table 4-1: Physical properties of pure DTPA and DTPA-BaSO4 mixture at 25oC and 1
atm .....................................................................................................................31
Table 4-2: Summary of CHNS results of pure DTPA ...............................................34
Table 4-3: Summary of ICP-MS results of pure DTPA ............................................34

XIV
LIST OF ABBREVIATIONS
Ba Barium
Ba2+
Barium ion
Ca Calcium
Ca2+
Calcium ion
g Gram (unit of weight)
K’S Molal concentration solubility product
m Mass
M Molarity
m Molality
ml Milliliter (unit of volume)
s Activity coefficient
SO4 Sulphate
SO2- Sulphate ion
Sr2+ Strontium ion
Sr Strontium
v Volume
Z Charge on the ion in solution
% Percentage
Greek
µ Kinematic viscosity
ρ Density
γ Unity at zero ionic strength
Subscripts
m Ionic molality
s Ionic strength
v Viscosity
XV
LIST OF ABBREVIATIONS
C Celcius (unit of temperature)
CHNS Carbon, Hydrogen, Nitrogen, Sulphur
CO2 Carbon dioxide
CO3 Carbonate
DTPA Diethylenetriaminepentaacetic acid
EDTA Ethylenedinitrilotetraacetic acid
Exp. Experimental
F Ferenheit (unit of temperature)
FTIR Fourier Transform Infrared Spectroscopy
HCO3 Bicarbonate
H2O Water
ICP-MS Inductively Coupled Plasma Mass Spectrometry
NaCl Sodium chloride
NMR Nuclear Magnetic Resonance
ppm Parts per million
ZnS Zinc sulphide
1
1 INTRODUCTION
1.0 Background
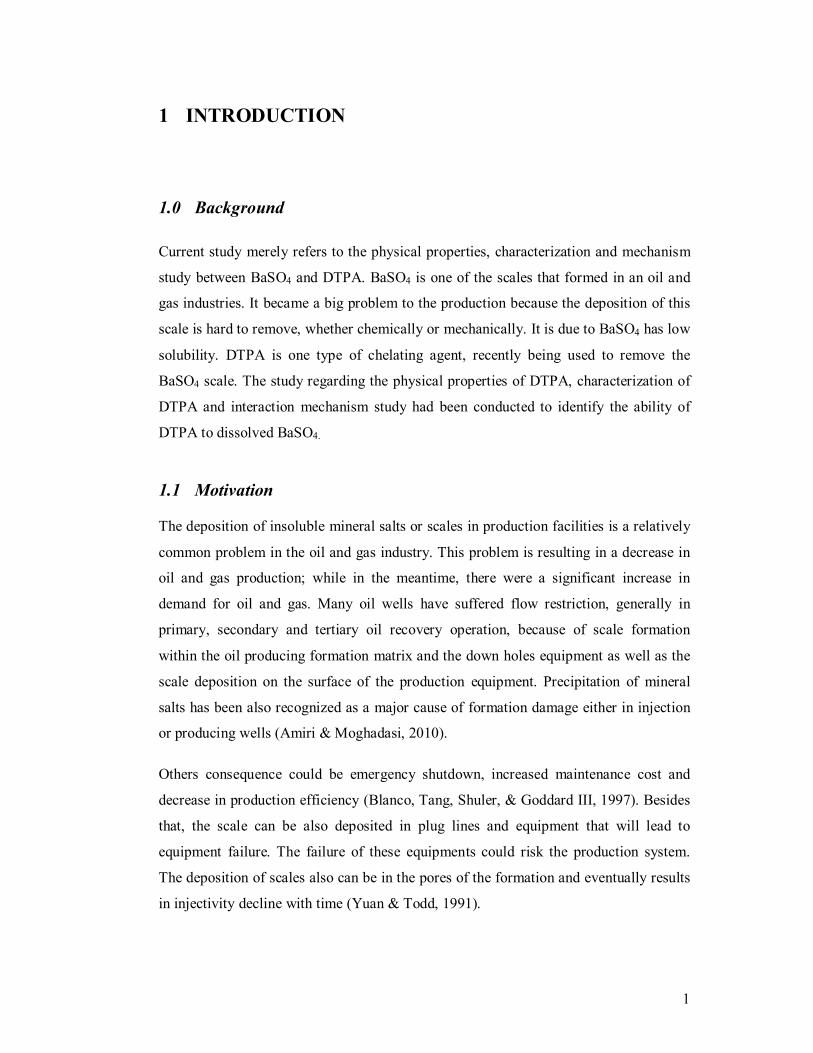
Current study merely refers to the physical properties, characterization and mechanism
study between BaSO4 and DTPA. BaSO4 is one of the scales that formed in an oil and
gas industries. It became a big problem to the production because the deposition of this
scale is hard to remove, whether chemically or mechanically. It is due to BaSO4 has low
solubility. DTPA is one type of chelating agent, recently being used to remove the
BaSO4 scale. The study regarding the physical properties of DTPA, characterization of
DTPA and interaction mechanism study had been conducted to identify the ability of
DTPA to dissolved BaSO4.
1.1 Motivation
The deposition of insoluble mineral salts or scales in production facilities is a relatively
common problem in the oil and gas industry. This problem is resulting in a decrease in
oil and gas production; while in the meantime, there were a significant increase in
demand for oil and gas. Many oil wells have suffered flow restriction, generally in
primary, secondary and tertiary oil recovery operation, because of scale formation
within the oil producing formation matrix and the down holes equipment as well as the
scale deposition on the surface of the production equipment. Precipitation of mineral
salts has been also recognized as a major cause of formation damage either in injection
or producing wells (Amiri & Moghadasi, 2010).
Others consequence could be emergency shutdown, increased maintenance cost and
decrease in production efficiency (Blanco, Tang, Shuler, & Goddard III, 1997). Besides
that, the scale can be also deposited in plug lines and equipment that will lead to
equipment failure. The failure of these equipments could risk the production system.
The deposition of scales also can be in the pores of the formation and eventually results
in injectivity decline with time (Yuan & Todd, 1991).

2
Scale deposition also leads to formation damage. Loss of well performance because of
formation of scale has been discussed in several of articles. The oil recovery was
strongly affected by permeability of reservoir, whether the reservoir permeability can be
kept intact or even improved. Changes in permeability of petroleum wells had a great
deal of concern by the oil and gas industry. This problem was called as formation
damage and it could happen during almost at any stage of petroleum exploration and
production operations.
There are a few types of scale that commonly found in the oil and gas production
system as shown in Table 1-1.
Table 1-1: Common oilfield scales (Amiri & Moghadasi, 2010)
Name Chemical Formula Primary Variables
Calcium Carbonate CaCO3
Partial pressure of CO2,
temperature, total dissolved salts,
pH
Calcium Sulphate:
Gympsum CaSO4.2H2O Temperature, total dissolved salts,
pressure Hemihydrate CaSO4.1/2H2O
Anhydrite CaSO4
Barium Sulphate BaSO4 Temperature, pressure
Strotium Sulphate SrSO4 Temperature, pressure, total
dissolved salts
Iron Compounds:
Ferrous Carbonate FeCO3
Corrosion, dissolved gases, pH Ferrous Sulfide FeS
Ferrous Hydroxide Fe(OH)2
Ferrous Hydroxide Fe(OH)3
The deposition of scale often resulted from the incompatibility between injected saline
water and reservoir water (Todd & Yuan, 1992). Sea water was injected into the
reservoir in order to maintain the pressure and improve the secondary recovery in
offshore production system. Two waters are called incompatible if when mixed them,
they interact chemically and results in minerals precipitation.
3
Typically, sea water contain high concentration of SO42-
and low concentration of Ca2+
,
Ba2+ and Sr2+, while formation or reservoir water contain very low concentration of
SO42- but high concentration of Ca2+, Ba2+ and Sr2+. When these two waters mixed,
supersaturated brine was created and CaSO4, BaSO4 and SrSO4 deposited.
During the production, the water was drained to the surface. This water suffered from
significant pressure drop at various temperatures. The pressure drop leaded to release
the carbon dioxide that resulted an increase in pH value of produced water and
precipitation of CaCO3 (Mackay, 2003).
Precipitation of mineral salts including the solids depositing on the pore walls reduced
the permeability of reservoirs due to the attractive forces between the particles and the
surface of the pore, the pore blocking by a single particle, several particles bridging
across the pore throat. The formation damage was influenced by the characteristics of
the precipitation. The characteristics were the large degree of supersaturation, the
presence of impurities, the changes in temperatures and the rate of mixing that
controlled the quantity and morphology of the deposited minerals (Aliaga et al., 1992).
The production problem that caused by the deposition of mineral scale in oil production
operations had been recognized long ago. Among the problems was caused by sulphate
scale, particularly BaSO4 scale. The deposition of this scale was a difficult problem due
to the low solubility of BaSO4 in the most type of fluids. Besides that, most acids were
commensurate low reactivity with BaSO4 scale. The continuous deposition of BaSO4 on
the surface of production tubular exposed very little surface area for chemical treatment
and thus, this scale was almost impossible to remove once it was deposited.
4
1.2 Problem statement
Scale deposition has been recognized as a major problem in oil and gas production
industries. It contributes to pipeline formation damage, emergency shutdown, increased
maintenance cost and decrease in production efficiency. As a result, they decreased the
amount oil and gas production while the demand for oil and gas significantly increase.
Among the scales formed as shown in Table 1-1, BaSO4 scale is the hardest scale to
remove, whether mechanically or chemically (Guimaraes et al., 2007). Thus, a potential
solvent needs to be applied in order to remove the BaSO4 scale to ensure the continuity
of oil and gas supply.
1.3 Objectives
The following are the objectives of this research:
o To study the dissolution ability of DTPA toward BaSO4
o To investigate the physical properties of DTPA and DTPA-BaSO4 mixture in
term of pH value, water content, density and viscosity
o To characterize the DTPA based on the results of ICP-MS and CHNS
o To identify the interaction mechanism between DTPA and BaSO4 based on the
NMR and FTIR analysis
1.4 Scope of this research
The following are the scope of this research:
i) The correlation of results obtained from characterization tests with the
chemical formula of DTPA
ii) Experimental analysis of the amount of BaSO4 ranging from 0.01 to 0.06 g
that can be dissolved in DTPA at mild condition (temperature of 25oC and
atmospheric pressure)
iii) The difference between the pure DTPA and DTPA-BaSO4 mixture to
identify the interaction mechanism between DTPA and BaSO4.
5
1.5 Organisation of this thesis
The structure of the reminder of the thesis is outlined as follow:
Chapter 2 consists of review regarding the scale deposition, type of scales in the oil and
gas production system, the variable that effected the scale formation, and current
methods for removal of scales. In addition, the general review for DTPA
pentapotassium salt included in this paper.
Chapter 3 told about the laboratory work to analysis the physical properties of DTPA
pentapotassium salt such as analysis of pH value, density, viscosity, water content and
solubility of BaSO4 in DTPA. Besides that, the method for characterization and
interaction mechanism study between BaSO4 and DTPA pentapotassium salt briefly
explained in this section.
Chapter 4 consists of the results and discussion of laboratory work and analysis study.
Those results were summarized. The explanation for the results was briefly discussed.
Besides that, the results from the previous works were also compared with the result
from the experimental work and analysis study.
Chapter 5 concluded the findings and results that obtained from the laboratory work and
analysis. This conclusion contained also some explanation for the results. In addition,
some recommendation was made in order to improve the experimental work and
analysis study. The future work also stated in this section.
6
2 LITERATURE REVIEW
2.0 Overview
The formation of mineral salts in oil production system is a relatively common problem.
Scale deposition can occur due to the mixing of incompatible injection and formation
waters in the well as well as in the tubing.
2.1 Type of scales
The common scales formed in the oil field are CaCO3, CaSO4 (anhydrite, gypsum),
BaSO4 (barite), SrSO4 (celestite) and ferrous scale (Merdhah & Yassin, 2009).
2.1.1 Calcium carbonate scale
Calcium carbonate or calcite scale was frequently encountered in oil and gas production
system. The calcite had a greatest stability in oilfield circumstances. Therefore, it was
the most common scale faced in the oilfield. The CaCO3 crystals were large. However,
the scale appeared uniformly when the scale was found together with the impurities in
the form of finely divided particles. Deposition of CaCO3 scale could be summarized as
below:
���� � ����� � ����� (2.1)
Besides that, the CaCO3 scale also formed by combination of calcium and bicarbonate
ions and this was a major cause of the CaCO3 scale deposition. This was due to only a
small percentage of the bicarbonate ions dissociated at the pH values found in the most
injection waters to form H+ and CO3
2- (Moghadasi et al., 2004b).
In addition, the CaCO3 scale also formed when there was a significant pressure drop and
temperature variations. The water was drained to the surface and suffered from the
significant pressure drop and temperature variations during the production operation.
The continuous pressure drops leaded to degassing of CO2 with an increased in the pH
value of the produced water and precipitation of CaCO3 (Rousseau et al., 2003).
7
When connate or acquifer water passed through the bubble point, the CO3 was evolved.
As the gas evolved, the solubility declined rapidly with the respect to carbonate and
formed the precipitation with divalent ions, commonly calcium, as outlined (Mackay &
Jordan, 2005):
������ � ����� � ��� � �� (2.2)
2.1.2 Calcium sulphate scale
Calcium sulphate was a unique problem in oilfields because it occurred with one of
three different phases. Calcium sulphate existed in several crystalline forms, which were
gypsum (CaSO4.2H2O), hemihydrate (CaSO4.1/2H2O) and anhydrate (CaSO4). These
compounds might be stable depending on temperature and ionic strength.
Gympsum was the most common scale deposited at relatively low temperature, while at
higher temperature (above 100oC), the more stable phase of calcium sulphate than
gypsum predicted was anhydrite. However, hemihydrate had been studied to form at
100 to 121oC, especially in non-turbulent system and in high ionic strength of brines
(Moghadasi et al., 2003). Besides that, they have decreasing solubility with increasing
temperatures.
The mixing of incompatible brines leaded to the formation of these sulphate scale when
the injection water contains sulphate ions (Mackay & Jordan, 2005).
���� � ���� � �� �� (2.3)
2.1.3 Barium sulphate scale
Barium sulphate or barite was a disaster in the water flood projects formed by mixing of
incompatible injected and formation waters. Barite scale was typically grayish in colour
but the pure barite was white. The scales might have impurities or organic material
trapped in the barite scale that gave them a blackish tinge. The specific gravity of
BaSO4 scale was around 4.5 and the Mohr hardness was in the range of 2.5 to 3.5.
8
Usually, the consequent of this formation of scale was the reduction of reservoir
permeability and eventually, decreased the well production. BaSO4 could be deposited
easily related to the thermodynamics condition and kinetics of precipitation. Formation
of BaSO4 scale could be described as:
���� � ���� � �� �� (2.4)
BaSO4 was the most insoluble scale, which it was a hard scale and extremely hard to be
removed. The solubility of barite scale was about a thousand times less than of CaSO4,
at the surface conditions. The BaSO4 solubility also increased when the temperature,
pressure and salt content in the brine was increased. Since the pressure, temperature or
salt content drop would increase precipitation, thus, the prediction of BaSO4 scale was
much easier than the other scales.
Besides that, the BaSO4 scale treatment focussed mainly on its prevention through the
usage of scale-control chemicals. Thus, the severity of the scaling problem was
determined both by the scaling rate and the efficiency of the chemical inhibitors.
2.2 Deposition of scales
Precipitation of solid minerals, which might form scales, would occur if:
i) The water contained ions capable of forming compounds of limited solubility.
ii) There were changes in the physical conditions or water composition, which
lowered the solubility.
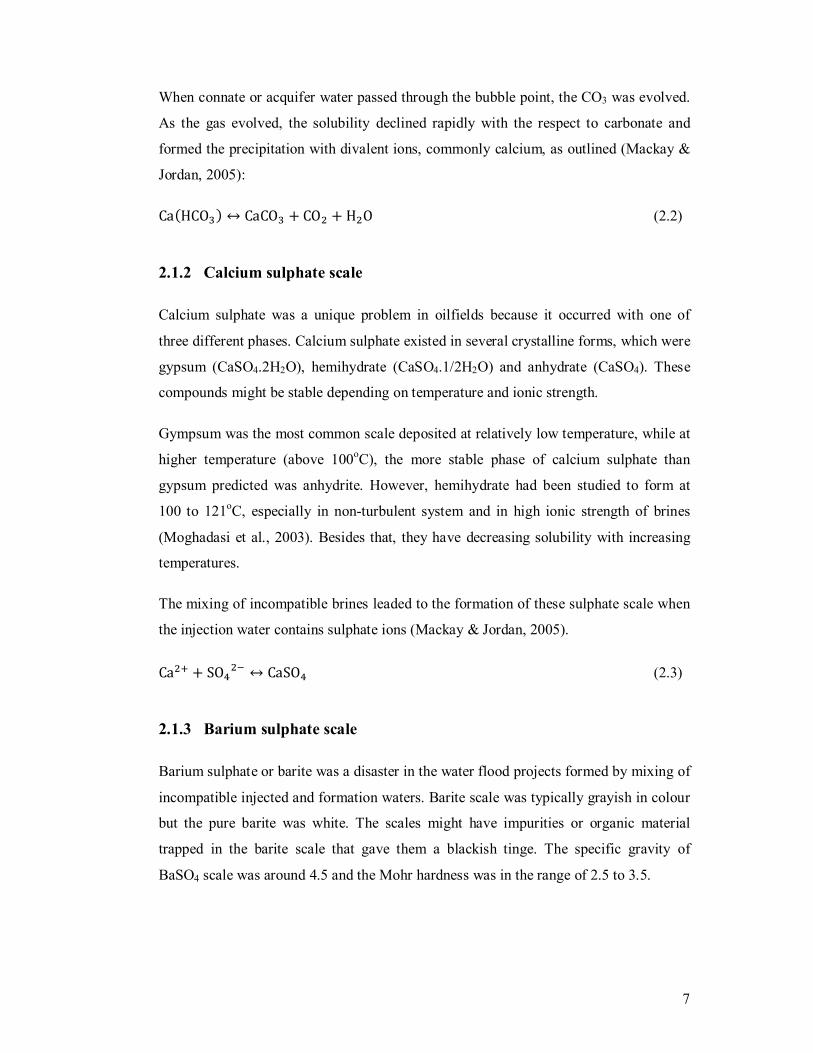
The severity of scale formation may be divided into the following stages (Fan et al.,
2012): (1) nucleation and precipitation of scales; (2) attachment of scales to tubing
surfaces; and (3) crystal growth. The formation of scale grows from solution. The first
development is a formation of unstable clusters of atoms within a saturated fluid
(Crabtree et al., 1999). The process is called homogeneous nucleation (Figure 2-1).
9
The seed crystals, a catalyst for scale formation, grow by ions absorbing on the crystal
surfaces and subsequently, extending the crystal size. The large seed crystals favor
continuing the growth, while small seed crystals may re-dissolve (Harry Y., Steven M.,
& Maria E., 2003) and give a large degree of saturation. Thus, the formation of any seed
crystal will encourage the growth of scale deposits to increase.
Figure 2-1: Homogeneous nucleation process is where ion pairs forming single crystals
in solution (Crabtree et al., 1999)
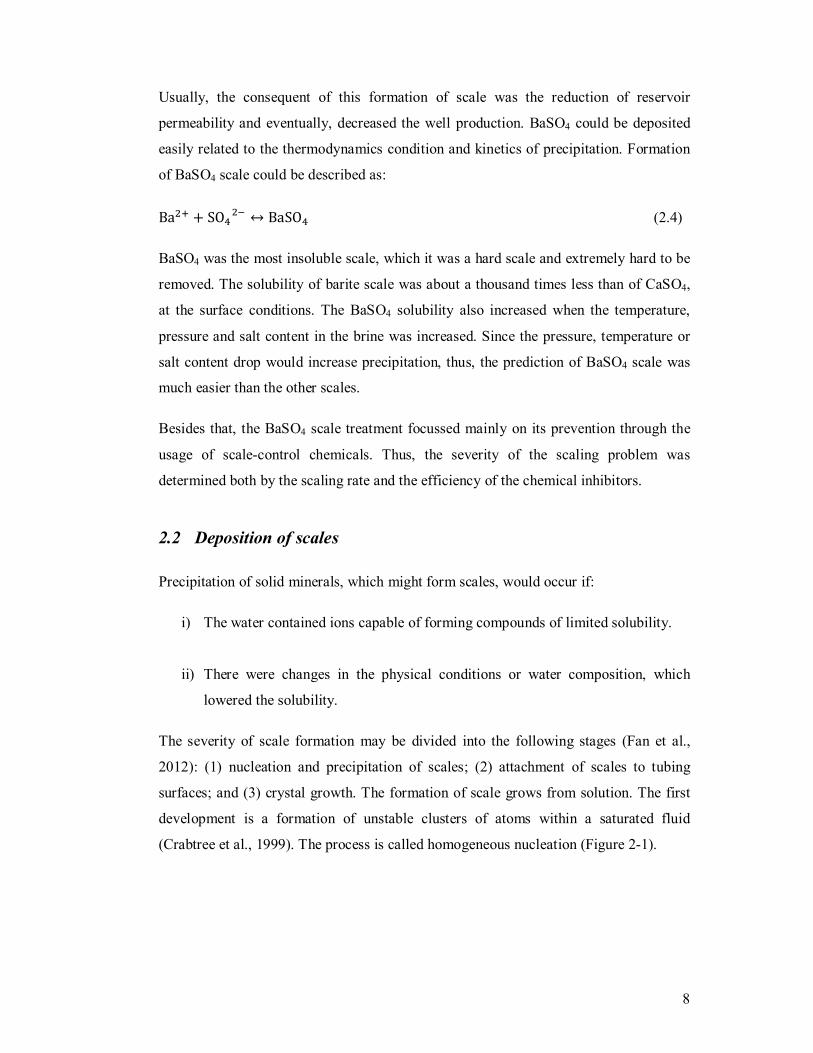
Scale growth also initiates on a pre-existing fluid-boundary surface and this process is
called heterogeneous nucleation as shown in Figure 2-2. The sites for heterogeneous
nucleation are including the surface defects such as pipe surface roughness or
perforations in production liners, or joints and seams in tubing and pipelines. Besides
that, the accumulation of scale can occur in the flowing system at the position of the
bubble point pressure that cause by a high degree of turbulence that catalyze the scale
deposition (Crabtree et al., 1999).
When producing oil and gas there will in most cases also be produced some water,
which contains dissolved salts. These salts may precipitate and they tend to deposit on
surfaces. Deposition of inorganic minerals from brine is called scale, and its formation
causes flow reduction or even blocking of pipes, valves and other equipment.
10
Figure 2-2: Heterogeneous nucleation process is growth of scales on pre-existing
surface defects (Crabtree et al., 1999)
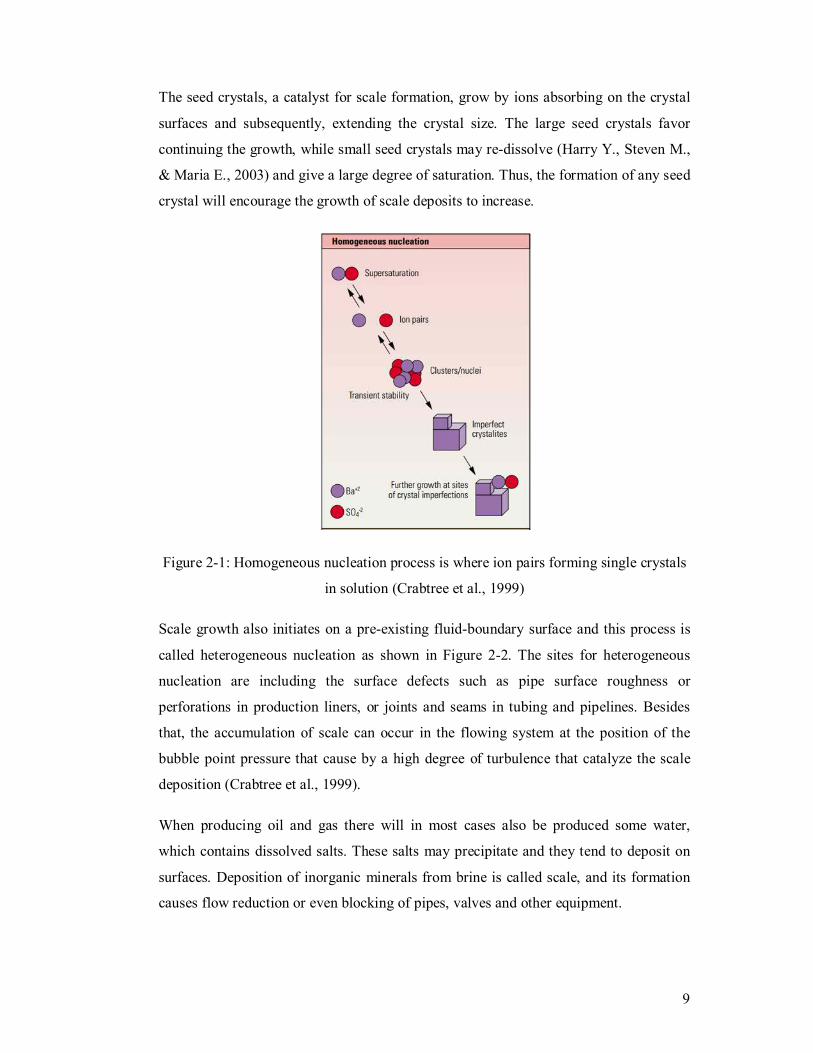
Common types of scale during oil and gas production are CaSO4, SrSO4, BaSO4 and
CaCO3. Flow reduction can lead to a severe decrease in production rate, and may also
lead to safety problems, for example, if scale forms in the down hole safety valve. The
economical impact for both prevention and removal of scale can be serious. In some
cases the scale may even be radioactive due to small amounts of radium, and must
therefore be treated as radioactive waste (Sandengen, 2006). Figure 2-3 shows scale
formation in tubing that obviously will constitute a serious flow restriction.
Figure 2-3: Scale in tubing (Sandengen, 2006)
11
Scale deposition can cause by the mixing of incompatible injection and formation
waters in the well as well as in the tubing. Seawater, typically rich in SO2- anions, is
often injected into reservoirs during secondary to maintain the reservoir pressure and
therefore increase oil recovery. When this encounters the formation water containing
Ca2+
, Ba2+
and Sr2+
it may lead to sulphate precipitation; CaSO4, SrSO4 and BaSO4.
This type of scale is usually fairly easy to predict, but BaSO4 is one of the most serious
scale forming minerals in the oil industry. The SO42-
concentration in sea water is
therefore frequently reduced prior to injection to avoid such problems (Sandengen,
2006).
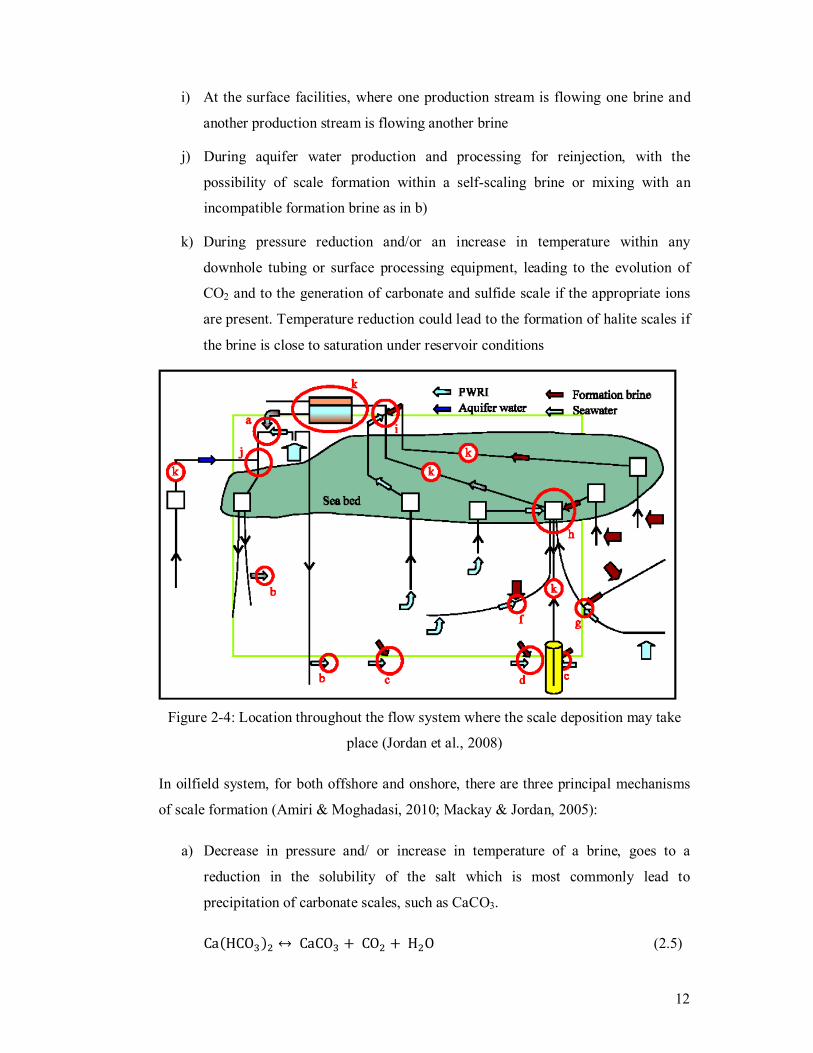
An overview of all possible scale formation environments for sea water, aquifer, natural
depletion and produced water re-injection is shown in Figure 2-4 (Jordan, Collins, &
Mackay, 2008; Jordan & Mackay, 2005).
a) For example, before injection, if seawater injection is supplemented by produced
water reinjection (PWRI)
b) Around the injection well, as injected brine enters the reservoir contacting
formation brine
c) Deep in the formation, owing to displacement of formation brine by injected
brine, or owing to converging flow paths
d) As injection and formation brines converge towards the production well, but
beyond the radius of a squeeze treatment
e) As injection and formation brines converge towards the production well, and
within the radius of a squeeze treatment
f) In the completed interval of a production well, as one brine enters the
completion, while another brine is flowing up the tubing from a lower section, or
as fluid pressure decreases
g) At the junction of a multilateral well, where one branch is producing a single
brine and the other branch is producing incompatible brine
h) At a subsea manifold, where one well is producing one brine and another well is
producing a different brine
12
i) At the surface facilities, where one production stream is flowing one brine and
another production stream is flowing another brine
j) During aquifer water production and processing for reinjection, with the
possibility of scale formation within a self-scaling brine or mixing with an
incompatible formation brine as in b)
k) During pressure reduction and/or an increase in temperature within any
downhole tubing or surface processing equipment, leading to the evolution of
CO2 and to the generation of carbonate and sulfide scale if the appropriate ions
are present. Temperature reduction could lead to the formation of halite scales if
the brine is close to saturation under reservoir conditions
Figure 2-4: Location throughout the flow system where the scale deposition may take
place (Jordan et al., 2008)
In oilfield system, for both offshore and onshore, there are three principal mechanisms
of scale formation (Amiri & Moghadasi, 2010; Mackay & Jordan, 2005):
a) Decrease in pressure and/ or increase in temperature of a brine, goes to a
reduction in the solubility of the salt which is most commonly lead to
precipitation of carbonate scales, such as CaCO3.
������� ������� ����� ���� (2.5)
13
b) Mixing of two incompatible brines where most commonly formation water rich
in cations such as Ca2+, Sr2+ and Ba2+ mixing with sulphate rich seawater,
precipitating the sulphate scales, such as BaSO4.
���������������� ���� �� ���� ���� �������� ������ � ��� (2.6)
Other fluid incompatibilities include sulphide scale where hydrogen sulphide gas
mixes with iron, zinc or lead rich formation water.
���� ��� � � �� ���� (2.7)
c) Brine evaporation which is resulting in salt concentration to increase above the
solubility limit and form salt precipitation as it may occur in high pressure/high
temperature gas wells where a dry gas stream may mix with a low rate brine
stream, resulting in dehydration and most commonly the precipitation of NaCl.
The extensive use of water injection for oil displacement and pressure maintenance,
many oil and gas reservoirs experienced the problem of scale deposition when the
injection water began to breakthrough. The consequence was the formation damage.
According the Moghadasi et al. (2004a), formation damage was a terminology that
referred to the impairment of the permeability of bearing formations of various adverse
processes.
The formation damage was an undesirable operational and economic problem that
occurred during the oil and gas recovery. The recovery from the subsurface reservoirs
involved drilling, production, hydraulic fracturing and work over operations. The
fundamental processes that cause the damage in the petroleum bearing formations were
hydrodynamics, physico-chemical, chemically, thermally and mechanically.
The formation damage mechanisms can be categorized into three major processes
(Leone & Scott, 1988):
1) Hydrodynamics
During the fluid flow, a mechanical force, by exerting a pressure gradient,
mobilized loosely attached fine particles from the pore surface. The movement
of many different types of fine particles, such as clay minerals, quartz,
14
amorphous silica, feldspars and carbonates, might cause mechanical fine
migration damage.
2) Physico-chemical
This mechanism was due to the water sensitivity clays. In equilibrium, the clays
existed with the formation brines until the ionic composition and concentration
of the brine was altered (Crowe, 1986). Decrease of permeability was caused by
the swollen clay that occupied the pore space. However, permeability decline
more often happened because of the fines that released by the swelling.
3) Geochemical
The injected fluid might not be compatible with the native pore fluid during
treatment of wells or water flooding. As a result, there would be no equilibrium
chemical in the porous system. The ions in the source water might react with the
ions in the reservoir fluids in order to form precipitation of solid downstream in
the porous system. This precipitation would plug the pore throats or deposit onto
the pore wall that resulting in the porosity reduction.
2.3 Solubility of scales
Solubility is defined as under a given set of physical conditions, the limiting amount of
solute that can be dissolved in a solvent. When a sufficiently amount of solute was
contacted with a limited amount of solvent, dissolution occurred until the mixture
solution reached one state when the reverse process in equilibrium. This reverse process
was the return of dissolved species to the undissolved state and the process was called
precipitation.
Dissolution and precipitation occurred continuously and at the same rate. The amount of
dissolved solute presented in a given amount of solvent remained constant with time,
where the process was in dynamic equilibrium. This state of equilibrium was known as
a saturated solution. In addition, the solution that contained less solute was called an
unsaturated solution, while the solution with higher concentration of solute than the
amount required for the solvent said to be a supersaturated solution.
15
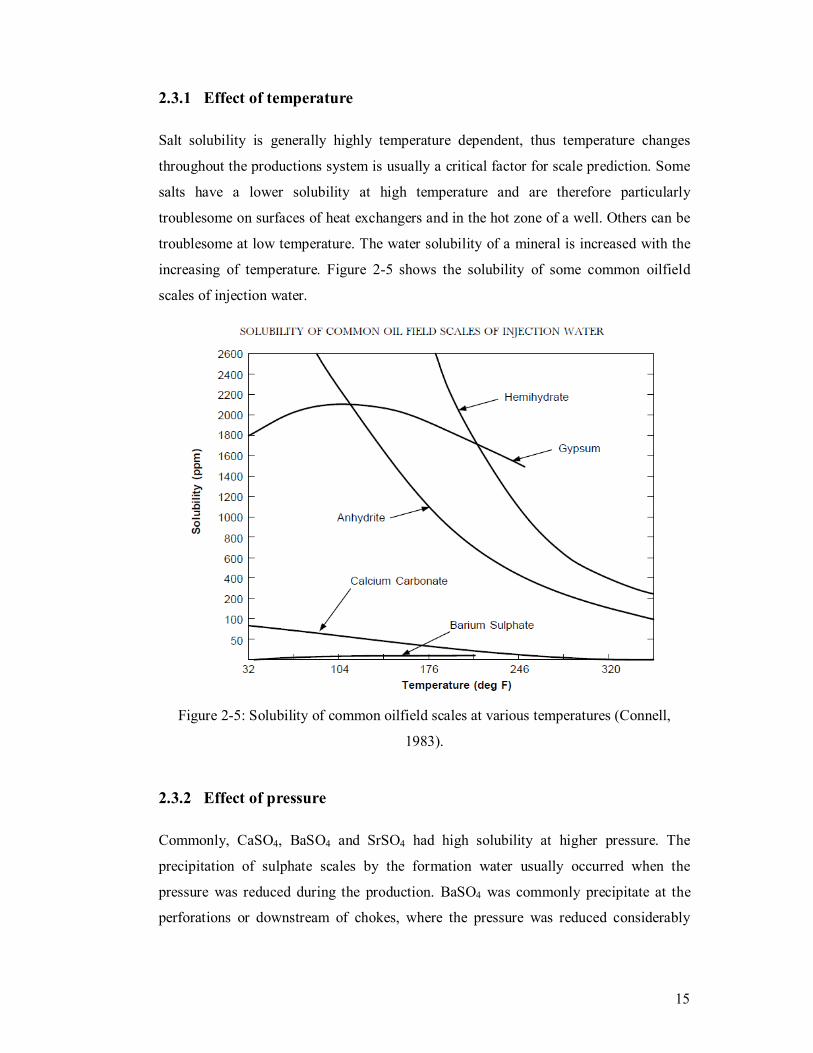
2.3.1 Effect of temperature
Salt solubility is generally highly temperature dependent, thus temperature changes
throughout the productions system is usually a critical factor for scale prediction. Some
salts have a lower solubility at high temperature and are therefore particularly
troublesome on surfaces of heat exchangers and in the hot zone of a well. Others can be
troublesome at low temperature. The water solubility of a mineral is increased with the
increasing of temperature. Figure 2-5 shows the solubility of some common oilfield
scales of injection water.
Figure 2-5: Solubility of common oilfield scales at various temperatures (Connell,
1983).
2.3.2 Effect of pressure
Commonly, CaSO4, BaSO4 and SrSO4 had high solubility at higher pressure. The
precipitation of sulphate scales by the formation water usually occurred when the
pressure was reduced during the production. BaSO4 was commonly precipitate at the
perforations or downstream of chokes, where the pressure was reduced considerably