philippine tax leakages: an assessmentpdf.usaid.gov/pdf_docs/pnadh572.pdf · philippine tax...
TRANSCRIPT

Economic Modernization through Efficient Reforms and Governance Enhancement (EMERGE) Unit 2003, 139 Corporate Center, 139 Valero St., Salcedo Village, Makati City 1227, Philippines
Tel. No. (632) 752 0881 Fax No. (632) 752 2225
Technical Report
Philippine Tax Leakages: An Assessment by Francis Xavier M. Vicente
Prepared for Bureau of Internal Revenue Republic of the Philippines Submitted for review to USAID/Philippines OEDG January 2006
Preface
This report is the result of technical assistance provided by the Economic Modernization through Efficient Reforms and Governance Enhancement (EMERGE) Activity, under contract with the CARANA Corporation, Nathan Associates Inc. and The Peoples Group (TRG) to the United States Agency for International Development, Manila, Philippines (USAID/Philippines) (Contract No. AFP-I-00-00-03-00020 Delivery Order 800). The EMERGE Activity is intended to contribute towards the Government of the Republic of the Philippines (GRP) Medium Term Philippine Development Plan (MTPDP) and USAID/Philippines’ Strategic Objective 2, “Investment Climate Less Constrained by Corruption and Poor Governance.” The purpose of the activity is to provide technical assistance to support economic policy reforms that will cause sustainable economic growth and enhance the competitiveness of the Philippine economy by augmenting the efforts of Philippine pro-reform partners and stakeholders. This technical report was completed by Francis Xavier M. Vicente in January 2006 as requested by the Commissioner of Internal Revenue, Guillermo L. Parayno, Jr., in a letter dated November8, 2004. The views expressed and opinions contained in this publication are those of the author and are not necessarily those of USAID, the GRP, EMERGE or the latter's parent organizations.
Abstract
Prompted by the urgent need to structure and prioritize tax administration measures to address tax leakages, raise revenue collections, and improve governance in tax administration, a technical analysis of tax evasion patterns in the country was conducted and compared with key tax policies and administration measures.
Tax leakage is pervasive in the various direct and indirect taxes collected by the Bureau of Internal Revenue. Studies worldwide identify a wide range of factors that may cause and sustain tax evasion and avoidance. These can be broadly categorized into economic, legal and administrative, social, and psychological factors.
The analysis on evasion focused on individual and corporate income taxes, VAT, and excise tax. An analysis of evasion in capital gains taxes is also included in conjunction with EMERGE/USAID’s technical assistance with the BIR to address the leakages in this tax. Individual and corporate income taxes, VAT, and excise tax account for about 70 percent of the BIR’s total collection while capital gains tax contributes 0.9 percent. This report concludes and suggests the following: (i) Too often, tax policies and administrative measures focus on increasing revenue without
curbing tax evasion and avoidance in mind. Although tax evasion is difficult to eliminate, reducing it is possible. Simply intensifying diligence in collecting taxes offers immediate results.
(ii) To curb individual income tax evasion, measures that lower compliance costs for professional and business income earners promise to significantly improve tax effort over the present system for taxing professionals. Individuals, particularly professionals and business income earners, have been shown to be quite responsive to measures that simplify compliance.
(iii) To curb value-added tax evasion, the BIR has to intensify its intervention in the VAT’s self-policing systems. Past experience has shown that simply relying on the system to “self-police” is insufficient. Taxpayers must be aware that they are being closely monitored.
(iv) To curb corporate income tax and VAT evasion, increasing the probability of detection, or introducing a “fear factor” approach could elicit better taxpayer compliance than offering tax amnesties or reducing the tax rate. Corporate taxpayers have an anticipatory behavior towards tax amnesties. Lowering the corporate tax rate does not always reduce evasion in the corporate income tax as this leads to income and substitution effects.
(v) To curb excise tax leakages, simplifying the system is desirable because players are large and tend to collude with the tax authority in declarations of volumes of goods brought out of the factory. Also, consumers tend to move from higher-taxed to lower-taxed goods to benefit from lower prices.
(vi) To curb capital gains tax evasion, measures that reduce the incentive for collusion between the taxpayer and tax authority would be effective.
(vii) Tax evasion and avoidance is pervasive. It is too complex to be solved by simple policy adjustments. The set of administrative instruments required for controlling it is vast. Thus, continuous and in-depth investigations should complement a structured program of action to address tax leakages. This would provide greater focus and increased rigor in monitoring tax leakages and refining strategies to improve taxpayer compliance.
1

Table of Contents
I. Background.................................................................................................................... 3 II. Concept of Tax Leakages: Tax Evasion, Tax Avoidance, and Tax Non-Compliance ........................................................................................................................ 4
Definitional distinctions are not always clear cut ........................................................... 4 Evolution of the tax evasion theory ................................................................................ 4
III. Measuring Tax Leakages......................................................................................... 11 Gap Approach ............................................................................................................... 11 Elasticity Approach....................................................................................................... 11 Special Amnesties/Audit Approach.............................................................................. 12 Underground Economy Approach ................................................................................ 12
Currency equation procedure ................................................................................... 12 Physical input technique ........................................................................................... 13 Labor market approach ............................................................................................ 13
US-IRS Tax Gap ........................................................................................................... 13 IV. Philippine Tax Leakages.......................................................................................... 15
Two decades of tax leakages......................................................................................... 15 Tax policy and administration measures....................................................................... 17 Income Tax Leakage: Individual and Corporate .......................................................... 19
Individual Income Tax Collection Performance....................................................... 19 Tax Evasion vis-à-vis Policy and Administration Measures ................................ 20
Corporate Income Tax Collection Performance....................................................... 20 Tax Evasion vis-à-vis Policy and Administration Measures ................................ 23
Value Added Tax Leakage............................................................................................ 27 Collection Performance ............................................................................................ 27 Tax Evasion vis-à-vis Policy and Administration Measures .................................... 27
Excise Tax Leakage ...................................................................................................... 30 Collection Performance ............................................................................................ 30 Tax Evasion vis-à-vis Policy and Administration Measures .................................... 30
Capital Gains Tax on Real Property Leakage: ONET3................................................. 32 Collection Performance ............................................................................................ 32 Tax Evasion vis-à-vis Policy and Administration Measures .................................... 32
V. Conclusions ................................................................................................................. 34 References........................................................................................................................ 37 Annex A: Matrix of Philippine Tax Leakages, point estimates .................................. 41
2

Philippine Tax Leakages: An Assessment
Taxation is a game and tax evasion is a genuine sport in making profit I. Background Tax evasion is evidently a major issue in the Philippines. Although the country’s experience is not an isolated one, it is seen in a wide range of taxes. Evasion in direct and indirect taxes decreases tax revenue, impairs the distributive role of the tax system, skews the allocation of resources towards less productive activities in the economy, and consequently, undermines fiscal and monetary policies (Manasan 1988). The BIR’s tax effort trended downwards from a peak of 13 percent in 1997 to a low of 9.9 percent in 2004. Manasan (2002) partly1 attributed the decline to tax evasion. In 1998, tax evasion accounted for 98.4 percent of the decline in the tax effort, although this has dropped to 46.2 percent in 2001. Similarly, income tax evasion accounted for 100 percent of the decline in income tax effort in 1998. This dropped to 50 percent in 2001. However, the impact of excise tax evasion to the decline in the excise tax effort rose from 0 percent in 1998 to 10 percent in 2001 while VAT evasion maintained a 100 percent impact on the decline of VAT effort for the same period. This means that the decline in the VAT effort was purely a result of evasion and not due to changes in the economic structure and policy.
This paper examines tax evasion in the country. It compares tax evasion patterns in the last 20 years with key tax policies and administration measures to make the tax system responsive to economic growth, simple to administer, and consequently, improve taxpayer compliance. The evaluation aims to determine the success or failure of policies and administrative enforcement mechanisms in addressing tax evasion as well as guide legislative and executive decision-making on tax policy and the allocation of resources for tax administration. The paper also limits its analyses to evasion in individual and corporate income taxes, VAT, and excise tax. These taxes account for about 70 percent of the BIR’s total collection. An analysis of evasion in capital gains taxes is also included in conjunction with the EMERGE/USAID’s technical assistance with the BIR to address the leakages in this tax.
1 Other factors are changes in economic structure and tax policy.
3

II. Concept of Tax Leakages: Tax Evasion, Tax Avoidance, and Tax Non-Compliance Definitional distinctions are not always clear cut. Tax leakages have generally been associated with non-compliance of taxpayers.2 Such behavior has been described as an attempt to escape the tax net through tax evasion and avoidance. Simply defined, tax evasion is the act of reducing tax liabilities by illegal or fraudulent means. It is a violation of the tax law, which makes the taxpayer liable to administrative or legal actions from authorities. Tax avoidance, on the other hand, reduce tax liabilities through legal means like taking advantage of tax rate differentials and “loopholes” in the tax code. Note, however, that the application of these definitional distinctions in some cases may be far from clear-cut and perhaps may remain so. Nevertheless, improving the definitions continue, and purposely, the analysis on tax leakages. For instance, Slemrod and Yitzhaki (2000) argued that tax avoidance should be differentiated from “real substitution responses” of taxpayers when the tax law changes the relative prices of different activities of taxpayers and induces taxpayers to respond by choosing a different consumption basket. Thus, avoidance consists in actions that do not change the individual’s consumption basket. Sandmo (2004) goes further in saying that this distinction focuses on the relative price changes for consumption goods, but it neglects the income effects that arise from increases in disposable income. Perhaps, Slemrod and Yitzhaki, and Sandmo’s borderline distinctions between tax avoidance and “ordinary” demand and supply effects, may have some affinity with Stiglitz’s (2000) practical reference to tax avoidance as postponing taxes, shifting due to tax rate differentials, and tax arbitrage.3 Furthermore, Manasan (1988) explained that tax evasion is done by a taxpayer either singly or in collusion with some tax collection functionary, while tax avoidance is done singly or with the help of some tax expert like a lawyer and an accountant. As such, evasion and avoidance are interdependent activities. Significant and well-known tax avoidance could induce evasion. On the part of the individual taxpayer, evasion can substitute for avoidance when increasing the cost of tax avoidance increases tax evasion. Evolution of the tax evasion theory. Most discussions on tax leakages focuses on tax evasion rather than tax avoidance. Studies particularly analyze the factors behind tax
2 The United States Internal Revenue Service (US-IRS) concept of taxpayers’ compliance with federal tax obligations includes but is not limited to tax evasion or tax avoidance. US taxpayer compliance, as measured by the tax gap, has three components: nonfiling, underreporting and underpayment. See “IRS’s Comprehensive Approach to Compliance Measurement,” by Robert E. Brown and Mark J. Mazur, Internal Revenue Service, June 2003. 3 See Joseph E. Stiglitz, “Economics of the Public Sector,” 3rd Edition, Chapter 24 A Student’s Guide to Tax Avoidance, p. 678-692 for a discussion on the principles of (income) tax avoidance and where he cites the case of the U.S. oil industry over a disagreement of what constitutes a tax loophole. Stiglitz says, “Like beauty, (tax) loopholes often are in the eyes of the beholder.” Similarly, Sandmo states that, “Perhaps the borderline between tax avoidance and “ordinary” demand and supply effects must by necessity remain somewhat vague.”
4

evasion activities and attempts to provide empirical estimates of the size of tax evasion4 or the “hidden economy.” Initial interest on tax evasion can be traced to the publication in 1972 of the article “Income tax evasion: A theoretical analysis” by Michael Allingham and Agnar Sandmo. This seminal paper marked the beginning of formal economic theory of tax evasion. Its fundamental assumptions are an application of the economics of crime approach of Gary S. Becker’s 1968 classic paper entitled “Crime and punishment: An economic approach.” The Allingham-Sandmo model, which essentially views the probability of detection and the penalty rate as exogenous, was followed by a large number of contributions to the literature which extended in a number of directions. These extensions, described as second generation models, make the probability of detection endogenous (Sandmo 2004 and Manasan 2000). The table below attempts to summarize the developments in tax evasion theory, and to some extent tax avoidance, in recent decades. The factors causing and sustaining the existence of tax evasion and tax avoidance can be broadly categorized into economic factors, legal and administrative determinants, and psychological attitudes. However, Sandmo (2004) noted some gaps in the theoretical literature, namely: The costs of tax compliance on the part of the taxpayer, which form part of the economy-wide costs of the tax system, are likely to have effects on the structure of industry and occupations in a country, and in the next round on returns to investment and gross wages. This has so far been a rather neglected area of public economics, at least in the theoretical literature.
The theory of optimal taxation can be seen as a recipe for minimizing the costs of taxation. This consists of the more direct costs of administration on the part of the tax authority and compliance on the part of the taxpayer. Both play little or no role in the analyses. Thus, the potential gains from using the insights of the tax evasion literature in the study of optimal taxation and tax design have not been fully exploited, although for some aspects of taxation the evasion perspective is highly relevant. The literature on tax evasion should be seen as a way to bring issues of tax administration into the focus of the theoretical literature on tax design.
4 According to Sandmo (2004), although little of the empirical research was based on an underlying theoretical structure, there is no doubt that the empirical work and the policy discussions that followed from it gave inspiration to further theoretical work, and that theory also gave new directions for empirical investigations.
5

Author Suppositions Allingham and Sandmo (1972) Yitzhaki (1974)
(a) Tax evasion is a function of income reported, marginal tax rate, penalty rates, and probability of detection.
(b) Assumptions: • Part of gross income is not reported. Tax evasion may
increase as gross income increases if taxpayers are more willing to engage in risky activities as they get richer, that is, risk aversion is decreasing.
• Higher penalty rates tend to deter tax evasion. • Higher probability of detection tends to discourage tax
evasion. • Increasing the marginal tax rate has an ambiguous effect
on tax evasion due to income and substitution effects which may increase evasion. Yitzhaki, however, argued that this result depends crucially on the assumption that the penalty is imposed on the amount of income evaded. If instead the fine is imposed on the evaded tax, there would be no substitution effect and accordingly no ambiguity.
Reinganum and Wilde (1985, 1986)
(c) Links the tax collection agency, particularly the policy it follows, in shaping the taxpayer’s probability of detection.
(d) Assumptions: (a) The objective of the tax authority is to maximize
expected tax revenue. (b) The tax authority can commit to an audit rule before
taxpayers report their incomes-the optimal policy involves a cut-off point whereby all returns reporting an income below some critical level are audited, whereas those who report an income higher than this are not audited at all.
i. Spicer and Becker (1980) ii. Spicer (1986) iii. Gordon (1989) iv. Erard and Feinstein (1994) v. Myles and Naylor (1996) vi. Andreoni, Erard and Feinstein
(1998) vii. Vihanto (2000) viii. Frey and Feld (2002) ix. Alm and Vazquez (2001) x. Eide (2002) xi. McCaffery and Slemrod (2004)
(e) Links social norms and social interactions in shaping taxpayers’ tax evasion decisions.
(f) Assumptions: • There are taxpayers that are non-evaders while others are not;
and non-evading behavior arises because people tend to overestimate their probability of detection.
• Social stigma, e.g. guilt and shame or bad conscience that may be attached to being caught in evading taxes leads to a more restrictive condition for tax evasion (social conformity effect).
• Through learning from his peers, a taxpayer may find less costly ways to underreport income, to lower the risk of being caught or to reduce penalties associated with tax audits (social learning effect).
• Individual’s perception of the fairness of his tax burden may influence his tax evasion decisions. Those who believe they are treated unfairly by the tax system are more likely to evade taxes to restore equity (fairness effect).
Implications: i. The negative value attached to evasion as such acts as an
additional penalty - a “conscience tax” - to deter evasion.
ii. It leads to a less optimistic view of the effectiveness of using penalty taxation as deterrence to tax evasion. While an increase in the penalty rate leads to less
6

evasion, the effect of the penalty tax on evasion decreases, as the “conscience tax” goes down. In other words, the stronger extrinsic incentive to truthful reporting reduces the intrinsic incentive to behave honestly.
iii. Explicit economic incentives make taxpayers see it as less imperative to act according to moral standards of behavior.
Pestieau and Possen (1991) Kolm and Larsen (2004)
• Links occupation choice, i.e. regular or black market work, with tax evasion.
• Assumptions: i. Gross income consists of income from wages in
regular market hours and black market hours. The latter is a part of the amount of income evaded.
ii. The taxpayer is risk averse towards variations in his consumption level in the two states of non-detection and detection.
iii. The impact of marginal tax rate on compensated regular labor supply is negative and ambiguous on encouraging black market labor and evasion.
• Implications: i. A stricter enforcement policy may affect tax compliance
via the incentives to choose occupations where the opportunities to evade taxes or engage in black market activities are less.
ii. Individuals can choose between being wage-earners, who have no opportunities for tax evasion, and entrepreneurs, who do. The stricter the enforcement of the tax law, the smaller the fraction of the population who chooses to become entrepreneurs.
Marrelli (1984). Persson and Wissén (1984 Marrelli and Martina (1988) Chen and Chu (2002) Crocker and Slemrod (2003)
• Introduces tax evasion by firms as evaders of indirect taxes, particularly ad valorem taxes, for which they act as tax collectors for the government, and of corporate income taxes whereby the tax evasion decision is in the context of the contractual relationship between the shareholders and the manager of the corporation.
• Assumptions: i. Tax evasion from indirect taxes.
a. Production and evasion decisions of the firm are mutually exclusive.
b. Production is independent of probability of detection and penalty.
c. The optimal tax rate is unaffected by the opportunities for evasion since the aim is achieving some specific policy objective, e.g. to reduce the consumption of a good with negative external effects
d. Evasion, or the amount of underreporting, is controlled by probability of detection and penalty of the firm is risk averse.
ii. Tax evasion from corporate income tax. The analysis is that the effect of policies to control evasion may depend crucially on who is penalized, the corporation or the manager.
7

Cowell (1990) Andvig and Moene (1990)
(a) Links social phenomenon to tax evasion (b) Assumptions:
The taxpayer’s probability of detection is assumed a function both of his own evasion and of his own observations/perception of other taxpayers’ amounts of evasion. If the perception of the amount evaded by others increases, the taxpayer’s subjective probability of detection falls, and he therefore decides to evade more. Others now perceive that he evades more and therefore evade more themselves.
Shoup (1969) Das Gupta and Mookherjee (1998) Mookherjee (1998) Silvani (1992)
Links presence of corruptible tax officials to tax evasion through the probability of detection Assumptions:
Tax evasion does not only depend on the incentives to the taxpayer but also on the incentives to the tax collector and the interaction between the two players.
The probability of evasion being detected is viewed as a function of the cost to the taxpayer of underreporting income. This cost, in turn, depends on the penalty rate and the amount of effort put in tax enforcement.
When evasion is discovered, the tax collector decides whether to report it and impose a penalty. His decision depends on the incentive structure that he faces. Thus, if the tax collector underreports evasion successfully, he gets a bribe in addition to his government salary. However, if he gets caught, he is punished in the form of a fine, transfer to another assignment or, at worst, dismissal from office.
The probability that the errant tax collector gets caught is dependent on the quality of supervision over tax examiners and third party audit. On the other hand, if the tax collector decides to report the delinquent taxpayer, he may be allowed to retain, as a reward or bonus, some portion of the additional revenue that is generated because of his vigilance. In the final analysis, the tax collector’s decision is then dependent on the relative strength of the amount of the bribe, the amount of the reward/bonus, the amount of the fine/penalty and the probability of being caught.
In the situation where a taxpayer decides to evade taxes by some amount, corruption will occur if the collective benefit of the taxpayer and the tax collector (i.e., the expected benefit to the taxpayer in terms of additional retained income less the bribe he has to pay minus the expected cost to the taxman in terms of the penalties for bribery and foregone bonus pay) is positive. Moreover, in a corrupt regime, the taxpayer will select the amount of tax to evade while the tax collector will select the effort devoted to monitoring and, thus, the probability of detecting evasion.
Links tax audit and declared income in improving tax enforcement and the probability of detection. Assumptions: Audit frequency and declared income is negatively related for a given class of taxpayers. A tax administration system that unduly focuses on high income tax returns (large taxpayers) may
8
encourage taxpayers to evade by large amounts as it reduces the probability that they will be subjected to the scrutiny of tax examiners. Conversely, the tax administration system may deter taxpayers from evading “too much” by threatening to audit low-income tax returns (small/medium taxpayers) just as intensively as high-income tax returns. Links tax amnesties on tax evasion/tax revenues and tax compliance. Assumptions:
a. The objective of most tax amnesty programs is to induce taxpayers to report previously hidden income and assets, to curb evasion by expanding the tax net to cover hitherto unreported income and assets.
b. Tax amnesties allow the government to short circuit the tax enforcement process by allowing taxpayers who are currently under investigation or prosecution to “settle” their dues voluntarily, usually by applying a more lenient tax rate. In this sense, the tax amnesty permits the government to save on costs of monitoring and prosecution
c. The model of tax amnesties suggests: (i) if tax enforcement is weak, the amnesty rate may have to be set at a very low rate in order to induce a significant response from delinquent taxpayers; (ii) in deciding whether or not to declare additional income/assets during an amnesty, a taxpayer compares the liability arising from the disclosure with the expected costs of not declaring said income; if the former is smaller than the latter, the taxpayer will decide to declare hidden income.
d. If the tax administration system is ineffective, the expected cost of not disclosing hidden income is small because the probability of said evasion being detected is also small. In such a situation, expected compliance gain from the amnesty is minimal.
e. If the tax amnesty is anticipated (because the government repeatedly offers tax amnesties), there will be an increase in tax evasion prior to the amnesty. Moreover, if tax enforcement is poor, anticipated tax amnesties cause aggregate revenues to fall. The drop in revenues results from the higher incidence of evasion in the years prior to the amnesty and the discounted amnesty rates that delinquent taxpayers pay during the amnesty year.
(c) Links incentive bonuses for tax collectors to tax evasion. (d) Assumptions:
a. Alternative compensation provisions for tax collectors may be an incentive for them to report evasion such as (i) payment of salaries that are higher than the market rate, or (ii) pay-for-performance scheme whereby the tax collector is allowed to retain part of the additional revenues generated from the reported evasion. In both cases, however, where the government’s ability to punish corruption is weak, it may be better not to pay tax collectors higher than market salaries since higher
9

compensation may simply increase the bribe level, increase the tax collectors' desire to stay in their jobs, thereby reducing their interest in reporting evaders with strong political connections, or induce the harassment of taxpayers.
b. The likelihood of taxpayer harassment is greater the higher the bonus rate and the cost of taxpayer appeal are and the lower the rate of success of taxpayer appeal.
Sources: NTRC (1987), Sandmo (2004), Bernard, Lacroix, and Villeval (2004), and Manasan (2000) See also Franzoni (1999). The article provides a comprehensive discussion on developments in tax evasion theory.
10

III. Measuring Tax Leakages Several methodologies have been developed to measure tax evasion: the gap approach, tax elasticity approach, special amnesties approach, audit approach and underground economy approach.5 A major difficulty in the methodologies is that all of them are subject to imprecision and controversy.6 In spite of these measurement issues, empirical estimates and analysis of tax evasion remain an important consideration in designing tax policies and administration reforms. Manasan (1988) opined that it is essential to use different methodologies instead of only one to get a range of estimates rather than a point estimate. Gap Approach. 7 This approach is typically applied to individual income tax. Aggregate personal income reported in the tax returns (ITR) is compared with personal income derived from the national income accounts (NIA). The difference in these two estimates is presumed to be the income evaded for tax purposes. But, for the estimates to be comparable adjustments must be made to account for the conceptual differences in the ITR and NIA definitions of personal income. For instance, personal income in the ITR excludes personal exemptions and allowable deductions while in the NIA does not. These two concepts also differ in the treatment of transfer payments, capital gains, imputed rents, and others. Conceptually, though, national accounts data could also be used to cross-check other broad-based taxes like sales, excise, imports, exports, and other corporate income taxes. The major difficulty with this approach is the scarcity of available data on capital gains and imputed rents which are required before adjustments can be made. But where this information is available, the gap approach is deemed superior to the other procedures discussed below.
Elasticity Approach. This approach estimates potential tax revenues and then the result is compared with actual taxes collected. The difference between the two is a measure of tax evasion.
5 An attempt was also made to determine if microsimulation models have been used for estimating tax evasion. Usage of microsimulation models have remained for distributional and revenue impact analysis of tax policy changes; and its users have recognized that tax avoidance and tax evasion is usually neglected, which is needed since microsimulation models tend to over-estimate potential revenues. See “Using Microsimulation Models for Assessing the Redistribution Function of a Tax-Benefit System,” Petra ŠTEPÁNKOVÁ– Institute of Sociology, Academy of Sciences of the CR, Prague 2002, “Microsimulation and Public Policy,” by Ann Harding, and “EUROMOD: an integrated European Benefit-tax model Final Report: Executive Summary,” edited by Holly Sutherland, June 2001. From 1997 to 2001, thru USAID’s the Fiscal Policy Analysis Activity (FPAA) technical assistance to the Department of Finance, microsimulation models for corporate and individual income tax, value added tax, excise taxes, and capital gains tax were built. 6 See Peacock and Shaw (1982) for detailed comments on the methodologies. 7 The various methodologies discussed herein are quoted from Manasan (1988). These methodologies have been used for estimating and analysis of tax evasion in developed, transition, and developing economies. See also Herschell (1978), Tanzi (1982), Giles (1999), Madžarević-Šujster (2002), and Jin (2005).
11

Potential tax revenues are estimated through a regression equation that regresses actual tax collection with various determinants like tax base and discretionary changes in tax structure. The typical regression equation used is:
ln T= a + b ln Y where T is actual tax revenue and Y is the tax base. This approach assumes that there is no significant change in the composition of the GNP or the tax base. However, this technique tends to underestimate tax evasion if a tax rate increase or a change in the composition of the tax base warrants an increase in taxes. Richupan (1984) asserts that this procedure does not measure total tax evasion but it does provide a good estimate of additional tax evasion and the deterioration of tax administration, valued in terms of the estimation period's mean level. Special Amnesties/Audit Approach. In contrast with the two techniques above, the special amnesties approach measures tax evasion using information derived from tax amnesties returns that are voluntarily supplied by the taxpayers. In the Philippines as in other countries, special tax amnesties have been offered more than once in recent history. Taxpayers are induced to declare their actual incomes in exchange for withdrawal of their liability to fines and penalties. It is thus possible to measure tax evasion using data from these special amnesties. However, this procedure measures only part of the taxes evaded because some taxpayers prefer to make limited use, if at all, of these amnesties. Their reasons are varied: they prefer to remain outside the tax net, they are waiting for another amnesty, or they under-report income while availing of the amnesty. Closely related to the special amnesties approach is the audit approach. It uses the results of the closer audit revenue examiners make on tax returns. The weakness of this technique is that the limited capacity of the revenue agency to audit and the possibility of corruption in the ranks of tax enforcers usually lead to lower estimates of tax evasion. Underground Economy Approach. This approach employs estimates of the so-called parallel economy to arrive at an amount of taxes evaded. There are various ways of measuring the size of the underground economy: the currency equation procedure, the physical input technique, and the labor market approach.
Currency equation procedure. This procedure (Tanzi 1982) assumes that underground activities are the direct result of high taxes and that underground transactions are carried out mainly with the use of cash. It starts with the estimation of a demand for currency equation that permits one to determine the effect of tax changes on that demand. Thus:
ln C/M = a + b ln T +c ln W/Y +d ln r+ e ln y
12

where C is currency holding, M is money supply, T is income tax rate, W/Y is the ratio of wages and salaries to GNP, r is the rate of interest on time deposits and y is the real per capita income. Based on the equation above, two estimates of currency holdings are made, one when the tax variable is assumed to be zero and the other when it is not. The difference between these two is called "illegal money" while the difference between M and "illegal money" refers to "legal money." The size of the parallel economy is obtained by multiplying illegal money by the velocity of legal money (which is equal to GNP divided by legal money). Finally, the amount of tax evasion is computed by applying the average tax rate to the size of the underground economy. Tanzi (1982) asserts that this approach underestimates tax evasion because it considers only evasion associated with both currency use and the underground economy; it does not include evasion arising from the claiming of exaggerated deductions. Similarly, it does not take into account income from illegal activities.
Physical input technique. This assumes a stable relationship between some physical input in the production process and national output abstracting from changes in technology and output composition. This relationship is then used to estimate GNP. The difference between this figure and the official estimate of GNP is attributed to the black economy. Gupta and Mehta (1982) applied this procedure to India assuming a stable relationship between electric power and GNP. The difficulty associated with identifying an input which has a stable relationship with GNP stands as the drawback of this technique.
Labor market approach. The approach estimates the size of the parallel economy on the basis of unreported employment figures and the average productivity of labor (Contins 1981). The major difficulty with this technique stems from the reliability of .the estimate of unaccounted unemployment as well as that of labor productivity. All three variants of the underground economy approach share some common shortcomings when used to estimate tax evasion: a) they involve some overestimation in that they include income legally not subject to tax, and b) they also involve some underestimation by excluding unreported income from "aboveground" activities. US-IRS Tax Gap. The US-IRS experience in the estimation of the US tax gap is briefly mentioned. It differs from the gap approach but has some similarities with the audit approach. By random sampling tens of thousands of individual and small corporation tax returns that undergo special audits every few years, tax gap estimates are then derived on taxpayers’ payment compliance, filing compliance, and reporting compliance.8 8 See also Wayne Thomas, Elinor Convery, Dennis Cox, and Chih-Chin Ho (1996), and Robert E. Brown and Mark J. Mazur (2003).
13
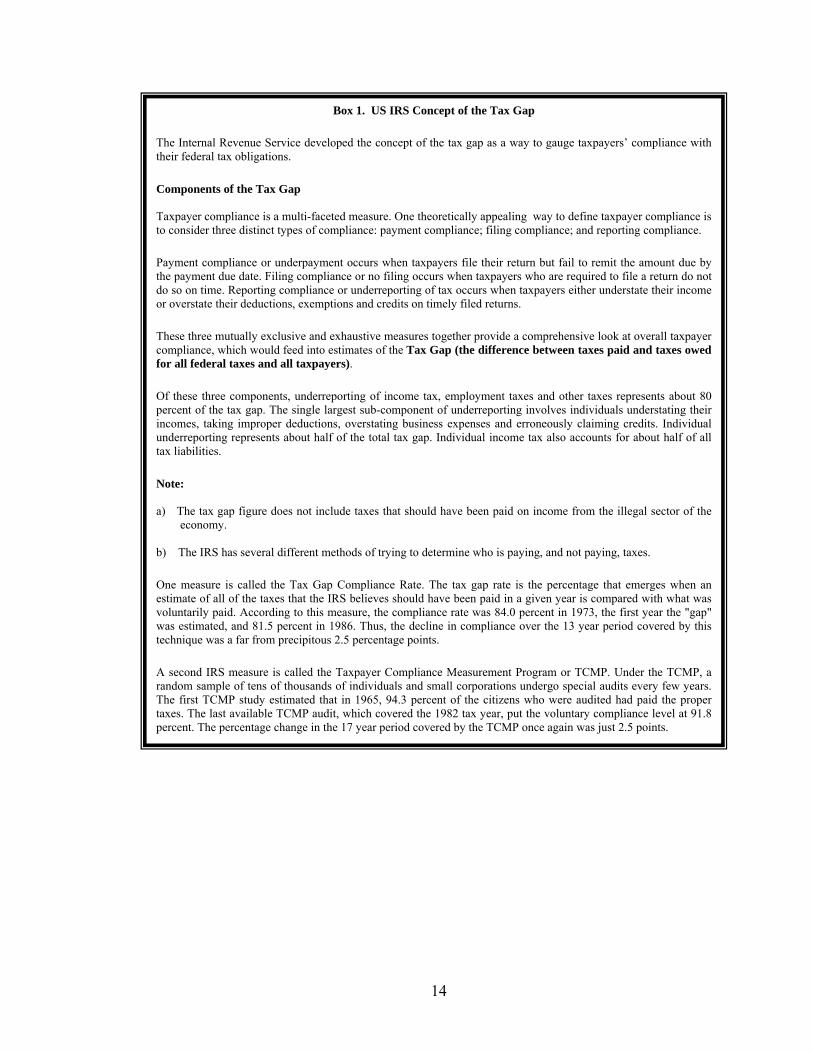
The Internal Revenue Service deve their federal tax obligations.
Components of the Tax Gap Taxpayer compliance is a multi-facto consider three distinct types of co
Payment compliance or underpaym the payment due date. Filing compl do so on time. Reporting complianc or overstate their deductions, exemp
These three mutually exclusive and compliance, which would feed intofor all federal taxes and all taxpay
Of these three components, underr percent of the tax gap. The single l incomes, taking improper deductio underreporting represents about hatax liabilities.
Note: a) The tax gap figure does not in
economy. b) The IRS has several different m
One measure is called the Tax Ga estimate of all of the taxes that the voluntarily paid. According to this was estimated, and 81.5 percent in technique was a far from precipitou
A second IRS measure is called th random sample of tens of thousandThe first TCMP study estimated th taxes. The last available TCMP aud percent. The percentage change in t
Box 1. US IRS Concept of the Tax Gap
loped the concept of the tax gap as a way to gauge taxpayers’ compliance with
eted measure. One theoretically appealing way to define taxpayer compliance is mpliance: payment compliance; filing compliance; and reporting compliance.
ent occurs when taxpayers file their return but fail to remit the amount due byiance or no filing occurs when taxpayers who are required to file a return do note or underreporting of tax occurs when taxpayers either understate their incometions and credits on timely filed returns.
exhaustive measures together provide a comprehensive look at overall taxpayer estimates of the Tax Gap (the difference between taxes paid and taxes owed ers).
eporting of income tax, employment taxes and other taxes represents about 80argest sub-component of underreporting involves individuals understating theirns, overstating business expenses and erroneously claiming credits. Individuallf of the total tax gap. Individual income tax also accounts for about half of all
clude taxes that should have been paid on income from the illegal sector of the
ethods of trying to determine who is paying, and not paying, taxes.
p Compliance Rate. The tax gap rate is the percentage that emerges when anIRS believes should have been paid in a given year is compared with what wasmeasure, the compliance rate was 84.0 percent in 1973, the first year the "gap" 1986. Thus, the decline in compliance over the 13 year period covered by thiss 2.5 percentage points.
e Taxpayer Compliance Measurement Program or TCMP. Under the TCMP, as of individuals and small corporations undergo special audits every few years. at in 1965, 94.3 percent of the citizens who were audited had paid the properit, which covered the 1982 tax year, put the voluntary compliance level at 91.8
he 17 year period covered by the TCMP once again was just 2.5 points.
14

IV. Philippine Tax Leakages This section starts by briefly discussing the empirical studies on Philippine tax leakages. Then, key tax policies and administration measures aimed at improving enforcement and compliance of taxpayers are compared with the available time series estimates on tax evasion to determine the success or failure of policies and administrative enforcement mechanisms in addressing tax evasion. Two decades of tax leakages. An early study on Philippine tax leakages was in 1984 by Avila. His paper, entitled “Notes on Tax Evasion in the Philippines,” highlighted the magnitude of tax evasion in the country. Evasion from income tax on deposits, and specific taxes on alcoholic beverages and fuels and oils was estimated by simply calculating the gap between the potential tax and actual tax collected. Evasion from individual income tax was derived using the elasticity approach. Avila’s work was followed by research papers from the National Tax Research Center (NTRC), Philippine Institute for Development Studies (PIDS), and Department of Finance (DOF). These studies marked the generation of time series data on tax evasion and further disaggregation in tax evasion estimates. Further, the gap approach, which was the commonly used technique, was supplemented with other methodologies as data became available. The NTRC estimated evasion from corporate and individual income taxes using the gap approach. It disaggregated evasion from individual income taxes to compensation and professional/business income taxes. The PIDS used the gap, audit, and elasticity approaches to estimate evasion from corporate and individual income taxes, tax on passive incomes, and value added tax (VAT). The DOF used the gap approach to estimate evasion from corporate and individual income taxes and VAT on domestic sales. Similar to the NTRC study, the DOF’s estimate of evasion from individual income tax was disaggregated to compensation and professional/business income taxes.
Year of Research Name of Institution 1980-1989 1990-1999 2000-2005
Lyceum of the Philippines
1984 “Notes on Tax Evasion in the Philippines” by Antonio A. Avila Jr. Tax evasion from:
erest Income from deposits (savings, time, and deposit substitutes), 1982: GAP Approach
ecific Taxes on alcoholic beverages and fuels and oils, 1981: Elasticity Approach
ividual Income, 1981: Elasticity Approach Revenues from tax amnesties,
1971-1980
National Tax Research Center
1985 and 1986 “Measurement of Tax Evasion” Tax evasion from:
Individual Income: GAP Approach
1991 “Measurement of Tax Evasion: The Gap Approach” Tax evasion from:
Individual Income: GAP
15

Corporate Income: GAP Approach
Approach Corporate Income: GAP
Approach 1994 “Estimation of Income Tax Gap, 1992-1994” Tax evasion from:
Individual Income: GAP Approach Corporate Income: GAP Approach
1997 “Estimation of Income Tax Gap, 1995-1997” Tax evasion from:
(a) Individual Income: GAP Approach
(b) Corporate Income: GAP Approach
Philippine Institute of Development
Studies
1988 “Tax Evasion in the Philippines 1981-1985” by Rosario G. Manasan, Ph.D. Attempts to improve quality of
estimates of NTRC Tax evasion from: Individual Income: GAP, Tax Audit, and Elasticity Approaches Corporate Income: GAP, Tax Audit, and Elasticity Approaches Tax on Passive Incomes-Dividends and Interest: GAP Approach Sales Tax: GAP Approach License and Business Taxes: Elasticity Approach Nonfiling of tax returns-Individual and Corporate: GAP Approach
2000 “Improving Tax Administration: A New View from the Theory of Tax Evasion in a Corrupt Regime” Rosario G. Manasan, Ph.D. Tax evasion from:
Individual Income, 1985-1999
VAT on domestic sales, 1985-1999
2002 “Explaining the Decline in Tax Effort” by Rosario G. Manasan The study measures the
impact of tax evasion as a key factor causing the tax effort’s decline from 1998-2001
Department of Finance
2003 “Tax Gap Estimates: 1998-2002” Tax evasion from:
Individual Income -Compensation and Professional/ Business Income
Corporate Income VAT on domestic sales
Disaggregating tax leakages. The disaggregation of tax leakages reveals the spread of tax evasion in the Philippines. Evidently, evasion can be traced from direct taxes (e.g. income taxes-individual and corporate) to indirect taxes (e.g. VAT, and excise tax). (See Annex: Matrix of Philippine Tax Leakages, point estimates).
Time series estimates on tax evasion from individual and corporate income taxes, and VAT are discussed in the light of tax policies and administrative measures to improve revenue generation and taxpayer compliance. Evasion or avoidance from excise tax is briefly discussed since the government relies on this indirect tax for a constant source of
16

revenues.9 Evasion from capital gains tax on the sale of real property is also included in conjunction with EMERGE/USAID’s current technical assistance with the BIR to address tax leakages and enhance taxpayer compliance.
Tax policy and administration measures. Between 1981 and 2000, the Philippine government initiated two tax reform programs, one in 1986 and the other in 1997, aimed at raising revenues, improving tax administration, minimizing tax avoidance, and promoting greater taxpayer compliance. The reform measures of each reform program are summarized in the table below.
1986 Tax Reform Package (TRP)
1997 Comprehensive Tax Reform Program (CTRP)
Objectives Obtain a simpler, fairer and more efficient tax system. Improve the elasticity of the tax system to increases in economic activity. Promote equity by ensuring that similarly situated individuals and firms bear the same tax burden. Promote growth by withdrawing or modifying taxes that impair incentives to produce. Improve tax administration by simplifying the tax system and promoting tax compliance. Reforms in Income Taxation Individual Unified the dual tax schedules on individual income by adopting the lower 0-35 percent schedule for both compensation and professional incomes. 20 percent tax on passive incomes Personal exemptions were increased to adjust for inflation and to eliminate the taxation of those earning below the poverty threshold income. Married taxpayers were given the option to file separate returns to reduce the tax burden of married couples since both incomes start from a 0 percent rate on the first Php2,500 of taxable income.
iv. Corporate The dual rate system of 25 and 35 percent applicable to taxable income of corporate enterprises was replaced by a uniform rate of 35 percent, the highest marginal tax rate for personal income. Eliminated taxation on inter-corporate dividends and gradually phased out the tax on dividends over a period of three years. Imposed a tax on franchise grantees which previously enjoyed exemption from income taxes. This move put franchise grantees on an equal footing with similarly situated individuals or firms. Reforms in Indirect Taxation v. VAT A uniform 10 percent VAT was introduced (1988) to simplify the tax structure and its
Objectives Make the tax system broad-based, simple and with reasonable tax rates. vii. Minimize tax avoidance allowed by existing flaws and loopholes in the system. viii. Encourage payment by increasing the exemption levels, lowering the tax rate, and simplifying procedures. ix. Rationalize the grant of tax incentives. Reforms in Income Taxation x. Individual Uniform rate schedule for both compensation and professional income of individuals, after a brief experiment with the Simplified Net Income Taxation (or SNITS) which was legislated in 1992. The rate structure was reduced to 7 brackets. Personal and additional exemptions were increased even as the new structure allowed the deduction of premium payments for health and/or hospitalization insurance from gross income.
xi. Corporate Corporate income tax (CIT) rate was reduced from 35 to 34 percent. Effective 1 January 1999, the rate was further reduced to 33 percent and on 1 January 2000 and onwards was reduced to 32 percent. To broaden the base, minimum corporate income tax (MCIT) was authorized to be imposed beginning on the fourth year from the time a corporation commences the business operations. Imposes a tax on fringe benefits granted to supervisory and managerial employees equivalent to the applicable CIT rate of the grossed-up monetary value of the fringe benefit. The tax on dividends was restored. A final tax of six percent (6%) was imposed beginning January 1, 1998; eight percent (8%) beginning January 1, 1999; and ten percent (10%) beginning January 1, 2000 upon the cash and/or property dividends actually or constructively received by an individual from a domestic corporation or from a joint stock company, insurance or mutual fund company, and a
9 See Vicente (2000) where he noted an increasing reliance on indirect taxes rather income taxes by developed and developing countries.
17

administration, to maintain progressiveness, and to introduce tax neutrality for resource-allocation decisions. It replaced the advance sales tax, subsequent sales tax, compensating tax, miller’s tax, contractor’s tax, broker’s tax, film lessors and distributor’s tax, and excise taxes on solvents, matches and processed videotapes. VAT exemption on the sale of basic commodities such as agriculture and marine food products in their original state. Zero rated VAT on exports, and in most cases taxes imports fully.
vi. Excise Tax Additional 20 percent tax is imposed on non-essential articles such as jewelry, perfumes, toilet waters, yacht and other vessels for pleasure and sports.
regional operating headquarters of a multinational company, or on the share of an individual in the distributable net income after tax of partnership (except a general professional partnership) of which he is a partner, or on the share of an individual in the net income after tax of an association, a joint account, or a joint venture or consortium taxable as a corporation of which he is a member or a co-venturer.
Reforms in Indirect Taxation VAT
Restoration of the VAT exempt status of cooperatives (agricultural, electric, credit or multi-purpose, and others provided that the share capital of each member does not exceed P15,000). Expansion of the coverage of the term “simple processes” by including broiling and roasting. Expansion of the coverage of the term “original state” by including molasses. Exemption from VAT coverage the following: importation of meat; sale or importation of coal and natural gas in whatever form or state; educational services rendered by private educational institutions duly accredited by the Commission on Higher Education; house and lots and other residential dwellings valued at P1 million and below, subject to adjustments using CPI; lease of residential units with monthly rental per unit of not more than P8,000, subject to adjustment using CPI; sale, importation, printing or publication of books and any newspaper.
Excise Tax xii. Tax on downstream oil industry was restructured from ad valorem to specific. Taxes were effectively lowered, and no tax was imposed on LPG. xiii. Tax on ‘sin’ products – cigarettes and liquor – were restructured from ad valorem to specific, to fix the existing loopholes in the system.
The CTRP had three reform components- restructuring of excise taxation, income tax reform, and rationalization of fiscal incentives-which was intended to be legislated as a comprehensive measure. However, the CTRP was passed into law in piecemeal fashion, except for the rationalization of fiscal incentives.
The first reform component was enacted into law in June 1996. Republic Act (RA) 8184 provided for the restructuring of the excise tax and tariffs on petroleum products. The following year, on January 1, 1997, RA 8240 took effect. It reverted the excise tax system on fermented liquor, distilled spirits and cigarettes to specific from ad valorem. That same year, RA 8241 and RA 8424 (otherwise known as the Tax Reform Act of 1997) were enacted into law. RA 8241 expanded the items exempted under the expanded
18

value added tax (EVAT)10 while RA 8424 provided for (i) a phased reduction in the corporate income tax rate from 35 percent in 1997 to 32 percent from 2000 onwards, (ii) a levy of a 2 percent minimum corporate income tax rate, (iii) net operating loss carry forward (NOLCO), (iv) accelerated depreciation, (v) cap on deductibility of travel and entertainment expenses, (vi) disallowance of the tax benefits of interest arbitrage, (vii) a tax on fringe benefits; (viii) reimposition of the final withholding tax on dividends; and (ix) a final withholding tax of 7.5 percent on interest earned by residents on foreign currency deposits; (x) increase in the level of personal exemptions for the individual income tax, and (xi) gradual reduction of the top marginal tax rate for the individual income tax from 35 percent in 1997 to 32 percent in 2000 onwards (Manasan 2002).
Alongside the changes in tax policies, various measures were initiated to improve tax administration and promote greater taxpayer compliance. These included the build-up in information and communications technology capacities (e.g. the 5-Year Tax Computerization Program, BIR Blueprint for Development Towards 2010), reorganization, nationwide tax mapping, increased taxpayer audits, taxpayer awareness campaigns, and tax amnesties.
Income Tax Leakage: Individual and Corporate Individual Income Tax Collection Performance
Individual income tax accounts for 22 percent of total BIR collections. However, tax effort down trended from a peak of 2.5 percent in 1997 to a low of 2.1 percent in 2004. This is partly explained by the exemptions from income tax of overseas Filipino workers, higher personal exemptions, and sliding down of the marginal income tax rates.
10 These items are printing, publication, importation or sale of books, newspapers, magazines, reviews or bulletins; operators of taxicabs, rent-a-car companies; operators of tourist buses; small radio and television broadcasting franchise grantees; sale of properties used for low-cost and socialized housing; and the lease of residential units with a monthly rental not exceeding P8,000 per month.
19

Individual Income Tax Effort
-
0.50
1.00
1.50
2.00
2.50
3.00
1990 1991 1992 1993 1994 1995 1996 1997 1998 1999 2000 2001 2002 2003 2004
Rat
io o
f In
divi
dual
Inc
ome
Tax
Col
lect
ed to
GD
P
Tax Evasion vis-à-vis Policy and Administration Measures. There are changing patterns of behavior between individual income tax effort and income tax evasion. From 1998 to 2002, individual income tax evasion slowed down from 11.7 to 8.6 percent of potential collection according to DOF estimates, while the individual income tax effort dropped from 2.4 to 2.2 percent. The tax leakage was lowest at 21.7 percent of potential collections in 2000 when the individual income tax effort was highest at 2.5 percent. During this period, aggregate tax payments declined in proportion to GDP as individuals evaded taxes. However, many factors affect the collective behavior of individual taxpayers. As such, from 1994 to 1999, PIDS reported individual income tax evasion to be on the uptrend when the individual income tax effort was also on the uptrend, showing that the two variables can also move in the same direction. Such happens when taxable income from compliant individual income taxpayers rises, while the underground economy also expands. Interestingly, the economy was booming at that time. Again from 1990 to 1994, PIDS estimates on individual income tax evasion experienced a marked decline while the individual income tax effort rose continually. Similar to the period between 1998 and 2002, an inverse relationship between the two variables is observed. However, from 1998 to 2002, tax effort and tax leakage see-sawed. But 1990 to
20

1994 was much better in that increasing tax effort and progress in plugging tax leakages were ideal conditions which tax authorities would aim for. How did the economy manage to raise its individual income tax effort while reducing individual income tax leakage from 1990 to 1994? The legislation of the Simplified Net Income Tax System (SNITS) on professionals in 1992 caused a dramatic drop in leakages from 1993 to 1994 at the same time that tax administration measures focused on reorganization, building up information technology capacities, tax mapping, and taxpayer audits. The simplification of procedures for professionals encouraged compliance and curbed evasion significantly. However, the scrapping of the SNITS on professionals in 1997 did not seem to have an impact on either evasion or compliance, as shown by the plateauing levels of individual income tax leakage and individual income tax effort over the next two years. Based on NTRC and DOF estimates over different periods, income earned by professionals has been consistently observed to be the highest source of tax leakage (see graph).
21

Individual Income Tax Leakage
PIDSGap81-85
PIDSTALw81-85
PIDS85-99
PIDSTAHg81-85
NTRCGap95-97
NTRCPBYGap95-97
NTRCCYGap95-97
DOFGap98-02
DOFPBYGap98-02
DOFCYGap98-02
0
10
20
30
40
50
60
70
80
90
100
1981 1982 1983 1984 1985 1986 1988 1990 1991 1992 1993 1994 1995 1996 1997 1998 1999 2000 2001 2002
Year
Eva
sion
Rat
e
• 1986 TRP:Shift from schedular to global in taxing individual income from compensation and business/exercise of profession; marginal tax rates harmonized at 0-35 percent. Ceilings on allowable business deductions introduced to minimize revenue decline from the uniform schedule and to preserve relative tax burdens of individuals. But, the measure was not implemented due to strong lobbying of various professional groups.Personal exemptions raised to cushion effects of inflation and to remove from the tax net the poverty threshold income.Separate filing and taxation of spouses to reduce the tax burden of married couples.
• 1997 CTRP:Uniform rate schedule for compensation income and professional income as SNITS for Professionals scrapped.Rate structure reduced to 7 brackets. Personal and additional exemptions increased.Deduction of premium payments for health and/or hospitalization insurance from gross income allowed.
• SNITS for Professionals legislated
• 5-year Tax Computerization Program launched• Tax Mapping Program; Selective Audit Program
• Action Centered Transformation Program launched
22
Corporate Income Tax Collection Performance
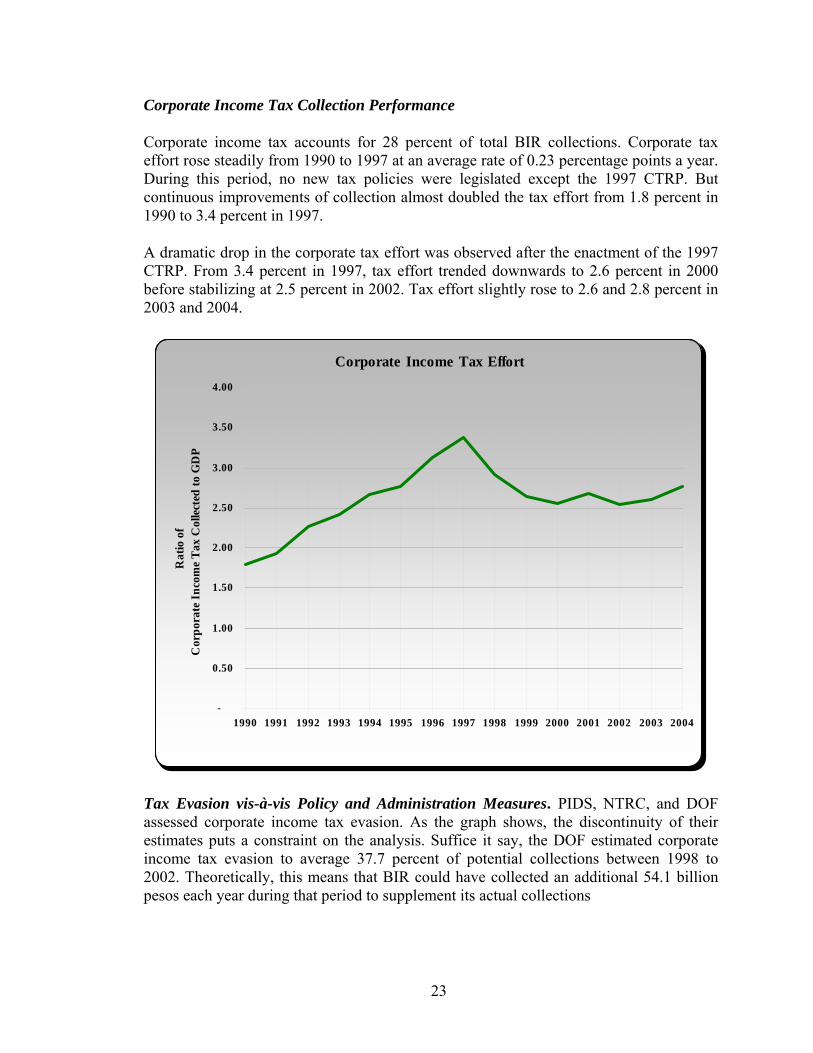
Corporate income tax accounts for 28 percent of total BIR collections. Corporate tax effort rose steadily from 1990 to 1997 at an average rate of 0.23 percentage points a year. During this period, no new tax policies were legislated except the 1997 CTRP. But continuous improvements of collection almost doubled the tax effort from 1.8 percent in 1990 to 3.4 percent in 1997.
A dramatic drop in the corporate tax effort was observed after the enactment of the 1997 CTRP. From 3.4 percent in 1997, tax effort trended downwards to 2.6 percent in 2000 before stabilizing at 2.5 percent in 2002. Tax effort slightly rose to 2.6 and 2.8 percent in 2003 and 2004.
Corporate Income Tax Effort
-
0.50
1.00
1.50
2.00
2.50
3.00
3.50
4.00
1990 1991 1992 1993 1994 1995 1996 1997 1998 1999 2000 2001 2002 2003 2004
Rat
io o
f C
orpo
rate
Inc
ome
Tax
Col
lect
ed to
GD
P
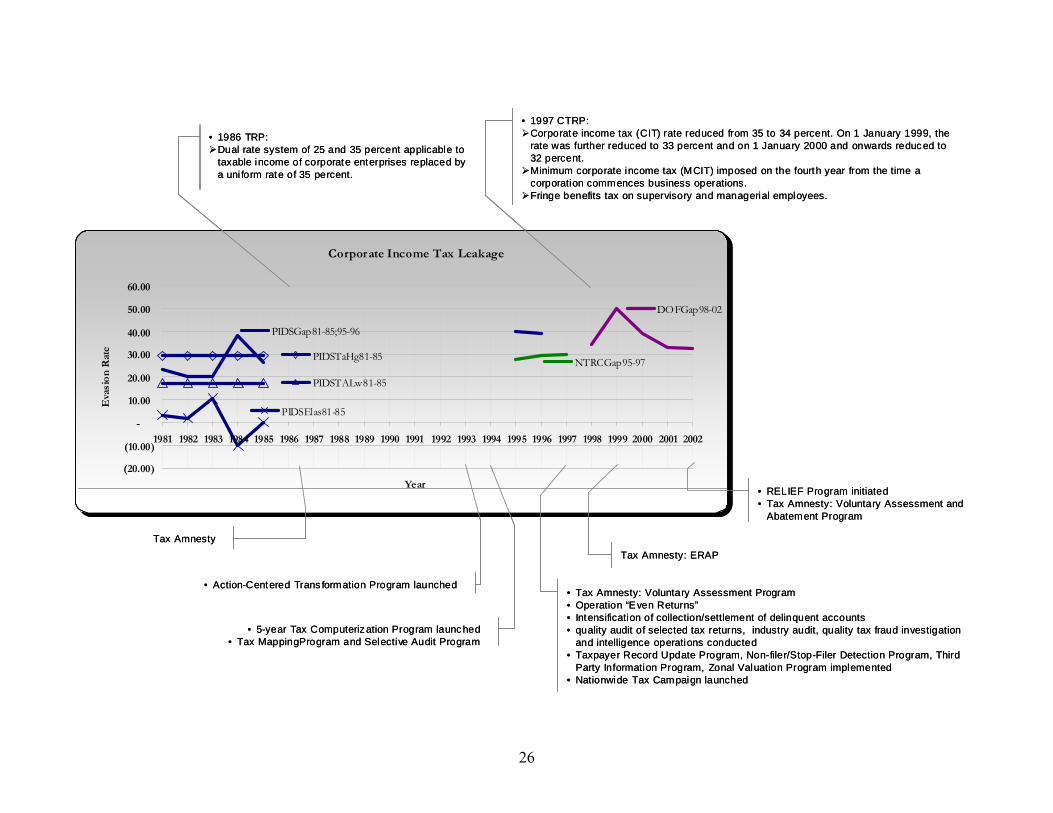
Tax Evasion vis-à-vis Policy and Administration Measures. PIDS, NTRC, and DOF assessed corporate income tax evasion. As the graph shows, the discontinuity of their estimates puts a constraint on the analysis. Suffice it say, the DOF estimated corporate income tax evasion to average 37.7 percent of potential collections between 1998 to 2002. Theoretically, this means that BIR could have collected an additional 54.1 billion pesos each year during that period to supplement its actual collections
23

Marginal Tax Rates. The reduction in corporate income tax rates from 35 percent in 1997, to 34 percent in 1998, and 33 percent in 1999 barely had an impact on reducing corporate income tax evasion. What happened instead is that evasion rose from 34.3 percent in 1998 to 50.2 percent in 1999.
Tax Amnesty. It is also evident from the graph that corporate income tax evasion rises prior to a tax amnesty. Tax evasion jumped from 34.3 percent in 1998 to 50.2 percent in 1999, the year that the ERAP program took effect.11 Similarly, evasion slightly increased from 27.5 percent in 1995 to 29.8 percent in 1997 when the Voluntary Assessment Program (VAP) was implemented along with a range of administration measures.
During a tax amnesty, corporate-tax evasion is reduced somewhat. When the Voluntary Assessment and Abatement Program (VAAP) and the automated RELIEF, a no-contact audit system for assessing taxpayer’s declarations on tax returns, took effect in 2002, tax evasion slowed down from 32.7 in 2001 to 32.2 percent in 2002. However, the slowdown hardly showed any improvement in the tax effort as it slid from 2.7 percent in 2001 to 2.5 percent in 2002.
A common thread about these tax amnesties is that every newly appointed Commissioner, more often than not, uses it as a strategy for raising revenues than curbing tax evasion behavior itself. Throughout the years, the BIR has kept tab of collections resulting from tax amnesties, as shown in the table below, but it has not reported on the extent of tax evasion addressed and a profile of compliance by taxpayers who availed of the tax amnesty.
Collections From Tax Amnesty
1986 to 1987 1997 1999 2001
Jul 2002 to Nov 2003 Administration
in PhP Billions
Pres. Aquino 1.37
Pres. Ramos –VAP 2.76
Pres. Estrada – ERAP 21.19
Pres. Arroyo-VAP, VAAP/RELIEF 3.45 6.93
Source: BIR In summary, the lesson that could be learned in the area of corporate income taxation is that administrative efforts have a far greater impact on collections than changes in policy. Corporate tax evasion has an anticipatory behavior in response to tax amnesties. Moreover, marginal tax rates should not be a policy tool for addressing tax evasion as it has an ambiguous effect. Lowering the tax rate has two related effects-income and substitution (Sandmo 2004). One, it makes the taxpayer richer (income effect) and the
11 There were no significant administrative actions during 1998 to 2001.
24

other, more willing to take risks (substitution effect) to evade taxes. This risk is determined by the probability of getting caught in evading taxes and the penalties for evasion. Because of this behavior, a “fear factor” approach could elicit a more positive response in curbing corporate tax evasion.
25
Corporate Income Tax Leakage
PIDSGap81-85;95-96
PIDSTaHg81-85
PIDSTALw81-85
PIDSElas81-85
NTRCGap95-97
DOFGap98-02
(20.00)
(10.00)
-
10.00
20.00
30.00
40.00
50.00
60.00
1981 1982 1983 1984 1985 1986 1987 1988 1989 1990 1991 1992 1993 1994 1995 1996 1997 1998 1999 2000 2001 2002
Year
Eva
sio
n R
ate
• 1997 CTRP:Corporate income tax (CIT) rate reduced from 35 to 34 percent. On 1 January 1999, the rate was further reduced to 33 percent and on 1 January 2000 and onwards reduced to 32 percent.Minimum corporate income tax (MCIT) imposed on the fourth year from the time a corporation commences business operations. Fringe benefits tax on supervisory and managerial employees.
• 1986 TRP:Dual rate system of 25 and 35 percent applicable to taxable income of corporate enterprises replaced by a uni form rate of 35 percent.
• 5-year Tax Computerization Program launched • Tax MappingProgram and Selective Audit Program
• Action-Centered Trans formation Program launched
Tax Amnesty
• Tax Amnesty: Voluntary Assessment Program• Operation “Even Returns”• Intensification of collection/settlement of delinquent accounts• quality audit of selected tax returns, industry audit, quality tax fraud investigation
and intelligence operations conducted• Taxpayer Record Update Program, Non-filer/Stop-Filer Detection Program, Third
Party Information Program, Zonal Valuation Program implemented • Nationwide Tax Campaign launched
Tax Amnesty: ERAP
• RELIEF Program initiated• Tax Amnesty: Voluntary Assessment and
Abatement Program
26

Value Added Tax Leakage
Collection Performance.
VAT accounts for 17 percent of total BIR collections. The shift of the sales tax system to VAT in 1988 resulted in an increase in the VAT effort from 1.2 percent in 1990 to 2.0 percent in 1997. As the economy slowed down, VAT effort trended downwards to 1.6 percent in 2000. The VAT effort stabilized with a slight increase of 1.61 percent in 2001. The increase was sustained to 2003 at a 1.9 percent tax effort. However, the following year VAT effort slipped to 1.7 percent.
VAT Effort
-
0.50
1.00
1.50
2.00
2.50
1990 1991 1992 1993 1994 1995 1996 1997 1998 1999 2000 2001 2002 2003 2004
Rat
io o
f V
AT
Col
lect
ed to
GD
P
Tax Evasion vis-à-vis Policy and Administration Measures. As PIDS estimates show, the shift to the VAT system in 198812 stemmed tax evasion compared to the sales tax system whereby evasion trended upwards from1981 to 1985. While VAT evasion sharply declined from to 59 percent in 1994 from 77.2 percent in 1989, VAT effort slightly improved to 1.5 percent in 1994 from 1.2 percent in 1990. It appears that the inherent “checking mechanism” in VAT, which Marelli (1984) described as having a self-policing
12 The VAT simplified the sales tax structure and administration as it replaced the following indirect taxes: advance sales tax, subsequent sales tax, compensating tax, miller’s tax, contractor’s tax, broker’s tax, film lessors and distributor’s tax, and excise taxes on solvents, matches and processed videotapes.
27

property in that buyers of intermediate goods have opposing interests to the sellers, has reduced the scope for indirect tax evasion.
VAT evasion somewhat increased to 60.1 and 62.1 percent in 1995 and 1996. At that same period, VAT effort slightly rose to 1.6 and 1.9 percent as more taxpayers were covered in the VAT net. The increase in VAT evasion stabilized at 62.6 percent in 1999.
Tax Amnesty. Similar to corporate income tax evasion, the increase in VAT evasion in 1995 and 1996 preceded the implementation of the VAP and a range of administrative measures in 1997. VAT evasion also went up from 58.9 percent in 1997 to 62.6 percent in 1999, the year when the ERAP took effect.
In summary, the self-policing property in VAT was not sufficient to sustain the decrease in evasion and significantly raise the VAT effort. Why has VAT evasion remained high? Perhaps, part of the reason is that tax administration lacked the capacity to monitor the declarations of VAT taxpayers and detect under declared sales and over claimed purchases.
In late 2002, the BIR set-up a manual RELIEF system to enhance VAT administration. Information/data provided by VAT-registered taxpayers through their submission of Summary Lists of Sales and Purchases (SLSP) were consolidated and matched with tax declarations filed with the BIR to detect under declared sales and over claimed purchases. Since matching of voluminous information/data was manually done, the process of identifying discrepancies from taxpayer declarations moved at a snail’s paces. To enhance the process and tighten the noose on VAT evaders, automation was introduced in the RELIEF system in 2003. Results from a preliminary “desk audit” that compared the sales of twelve (12) VAT taxpayers and the purchases made from them by their buyers revealed significant variances. The discrepancies ranged from as low as 41.3 percent to as high as 92.4 percent.
Taxpayer Sales Per Relief Sales Per VAT Return Discrepancy % Discrepancy
TP 1 9,242,458.80 4,976,417.00 4,266,041.80 46.2%TP 2 15,826,527.22 1,202,560.00 14,623,967.22 92.4%TP 3 31,693,867.40 18,617,819.05 13,076,048.35 41.3%TP 4 8,374,955.40 4,764,066.34 3,610,889.06 43.1%TP 5 5,698,697.26 2,095,437.10 3,603,260.16 63.2%TP 6 10,179,670.82 5,979,000.00 4,200,670.82 41.3%TP 7 4,074,932.92 458,375.59 3,616,557.33 88.8%TP 8 9,658,178.71 1,686,998.00 7,971,180.71 82.5%TP 9 2,017,197.54 444,876.96 1,572,320.58 77.9%TP 10 19,257,778.75 10,623,276.67 8,634,502.08 44.8%TP 11 17,498,821.55 12,063,309.90 5,435,511.65 31.1%TP 12 55,656,433.28 19,333,191.83 36,323,241.45 65.3%Total 189,179,519.65 82,245,328.44 106,934,191.21 56.5%
Prelimenary Discrepancy Report
Source: BIR Deputy Commissioner (Former) Estelita Aguirre. Her presentation, entitled "Reconciliation of Listings for Enforcment (RELIEF) System: A Tool Towards an Effective VAT Audit Program," before Commissioner Guillermo L. Parayno in 2003
28

Sales and VAT Tax Leakage
PIDSSalVATp81-99
DOFVATGap98-02
-
10.00
20.00
30.00
40.00
50.00
60.00
70.00
80.00
90.00
19811982198319841985
19861987
19881989
1990
199119921993
19941995
19961997
199819992000
2001
2002
Year
Eva
sion
Rat
e• VAT system adopted
• VAT coverage expanded to services• VAT exemption coverage expanded
• VAT coverage expanded
Sales Tax system
• RELIEF Program initiated • Tax Amnesty: Voluntary Assessment
and Abatement Program
• Tax Amnesty: Voluntary Assessment Program• Operation “E ven Returns”• Intensification of collection/settlement of delinquent accounts• Quality audit of selected tax returns, industry audit, quality tax fraud
investigation and intelligence operations conducted• Taxpayer Record Update Program, Non-filer/Stop-Filer Detection Program,
Third P arty Inform ation Program, Zonal V aluation Program implemented • Nationwide Tax Cam paign launched
Tax Amnesty: ERAP
29

Excise Tax Leakage
Collection Performance.
Excise tax accounts for 13 percent of total BIR collections. Sixty six (66) percent are taxes from alcohol and tobacco products while 31 percent from petroleum products. Excise tax effort dramatically dropped to 1.3 percent in 2004 from 2.6 percent in 1997. The drop was more pronounced in petroleum excise taxes as tax effort declined from 1.2 percent in 1997 to 0.4 percent in 2004. Compared to alcohol and tobacco excise tax, the tax effort slowed down from 0.6 to 0.3 percent on alcohol products and from 0.7 to 0.5 percent on tobacco products.
Excise Tax Effort
-
0.20
0.40
0.60
0.80
1.00
1.20
1.40
1990 1991 1992 1993 1994 1995 1996 1997 1998 1999 2000 2001 2002 2003 2004
Rat
io o
f E
xcis
e T
ax C
olle
cted
to G
DP
Alcohol Tobacco Petroleum
The slowdown in alcohol and tobacco excise tax efforts can be attributed to non indexation of the excise tax rates, substitution of consumption from the higher priced (and taxed) beer and cigarettes to the lower priced (and taxed) ones, and weaknesses in excise tax administration.
Tax Evasion vis-à-vis Policy and Administration Measures. The excise tax system has been changed through executive action or legislation at least 17 times since the 1970s.13 It has shifted from specific, mixed specific and ad valorem, ad valorem, and now back, to 13 The excise tax law has changed more often than other tax laws.
30

specific. Its tax rates have been raised more than seventeen (17) times to raise revenues and regulate consumption while a tiered tax rate structure has favored a lower rate on lower priced “sin products” and a higher rate on medium to higher priced ones. Further, excise taxation has been associated with tax evasion and tax avoidance.
In 1995, tax leakages was estimated at Php400 million from alcohol (e.g. beer) products and at Php1.9 billion from tobacco products under the ad valorem system. The massive leakages from alcohol and tobacco taxes were due to the under declaration of manufacturers’ wholesale prices (tax base) and the use marketing arms by firms to lower their excise tax liabilities. For this reason, the excise tax on alcohol and tobacco was marked for reform under the 1997 CTRP (Abola and Vicente 1995).
Under the specific tax system, DOF estimated alcohol and tobacco tax leakages at Php 1.5 billion in 2000. Compared to the estimates in 1995, the specific tax system has partially reduced evasion from these products. Notwithstanding the decrease, alcohol and tobacco excise tax evasion was at 5.0 percent of potential collections while gasoline excise tax evasion was estimated at 3.8 percent.
Actual Potential Gap
Beer and Tobacco 28.4 29.9 1.5 5.0%Gasoline 43.8 45.5 1.7 3.8%
Total 72.2 75.4 3.2 4%
Tax Leakage on Selected Exciseable Goods
Tax Type
Php% Gap
DOF
Data is for year 2000
The incidence of evasion could be linked to some weaknesses in excise tax administration. One is the collusion between BIR Revenue Officers On Premises (ROOPs) and manufacturers in their declarations of the volume of goods shipped out of factories, and the other is the partial implementation of the “fuse on stamps” or other measuring devices to determine accurately the volume of goods produced by manufacturers.14 In 2003, the BIR initiated the development of the Automated Excise Data Management System (AEDMS) to intensify the administration of excise tax by providing excise taxpayers the facility to file their removal declaration through the internet (without the ROOPs). The AEDMS is a web-based system for the management and monitoring of Excise Taxpayers’ Removal Declaration (ETRD). Similar to the AEDMS, the use of “fuson stamps” is to tighten up the monitoring of the amount of goods that excise taxpayers produce. 14 The 1997 CTRP requires alcohol and tobacco manufacturers to affix fuse on stamps (internal revenue stamps) or use bar code on their products as a measure to determine as accurately as possible the volume of such goods that they produced.
31

Capital Gains Tax on Real Property Leakage: ONET3
Collection Performance.
Capital gains tax effort on the sale of property accounts for 0.9 percent of total BIR collections. Between 1995 and 2004, tax effort hardly improved despite resolutions on several cases on real property taxes, upward adjustment in zonal values in 1997, and simplification of administrative procedures in 2003. Tax effort dropped dramatically to 0.09 percent in 2004 from 0.34 percent in 1994.
In contrast, tax effort surged upward from 0.09 percent in 1990 to 0.34 percent 1994 as tax administration measures improved taxpayer compliance requirements for filing and payment of capital gains taxes and built-up information technology capacities.
Capital Gains Tax on Property Effort
-
0.05
0.10
0.15
0.20
0.25
0.30
0.35
0.40
1990 1991 1992 1993 1994 1995 1996 1997 1998 1999 2000 2001 2002 2003 2004
Rat
io o
f C
apita
l Gai
ns T
ax to
GD
P
Tax Evasion vis-à-vis Policy and Administration Measures. There are no estimates of capital gains tax leakages from the NTRC, PIDS, and DOF studies. Nor was it possible to derive one due to the absence of reliable data for estimation. However, the BIR roughly estimated capital gains tax leakage at Php2.1 billion in 2004. About Php1.7 billion of this amount was on capital gains tax (CGT) and Php300 million on documentary stamp tax (DST).
While no serious estimation of capital gains tax leakages has been done, a huge variance can be seen between the number of titles issued by the Land Regulatory Authority-Register of Deeds (LRA-RD) and the number tax returns filed in the BIR for capital gains taxes on the sale of property. This could mean that the LRA-RD issued a substantial number of Transfer Certificate of Titles (TCTs) without the proper tax clearances from the BIR. In 2004, the discrepancy was 60.8 percent
32

Area 2000 2001 2002 2003 2004
BIRCapital Gains Tax Returns on Sale of Property 122,823 124,207 131,882 137,044 159,487 Witholding Tax Returns on Sale of Property 71,574 67,205 55,084 62,464 68,964
Total Tax Returns Filed 207,147 204,613 197,203 207,003 238,354 LRA
Total Titles Issued 460,639 375,673 NA 458,150 608,811
Discrepancy (253,492) (171,060) (251,147) (370,457) % Discrepancy -55.0% -45.5% -54.8% -60.8%
Discrepancy in Tax Returns Filed and Titles Issued
Source: BIR and LRA Annual Reports
The incidence of evasion could be linked to some weaknesses in capital gains tax administration such as complexity in processing of capital gains tax payments, lack of internal control mechanism to prevent revenue losses, and susceptibility of the system to collusion between the taxpayer and tax official.
In 2003, the BIR (a) simplified the documentary requirements and procedures for the processing, verification/audit, and review of tax returns on ONET3, (b) reduced the time for issuance of Certificate Authorizing Registration (CAR) related to the sale/transfer of real properties to within five (5) days from several weeks or months, and (c) established an ONET3 Team in every Revenue District Office (RDO), which serves as a one-stop-shop for ONET3. The team provides for frontline services and attends to all needs of the ONET3 taxpayers, from tax assistance to issuance of tax clearance.
Tax effort hardly improved in 2003 and 2004 despite the substantial improvement in capital gains tax administration procedures. An indication that systemic weaknesses in tax administration remained. One is that it invites collusion between taxpayers and tax officials in assessing tax liabilities. Collusion arises since ONET3 taxpayers are required to have their tax liability computed by tax officials instead of themselves accurately self-assessing their tax liabilities independent of the tax officials. The situation is compounded when confusion arises in determining zonal valuation and location of the property. Another is that capital gains tax administration has no reliable validation/verification system for Tax Clearance Certificate (TCLC) and Certificate Authorizing Registration (CAR) issued by the BIR. In its absence, TCTs are sometimes issued on the basis of fake TCLCs and CARs or without the proper tax clearances from the BIR.
33

V. Conclusions The paper looked at estimates of the extent of tax evasion in the Philippines and against which it made an assessment of the impact of key tax policies and administrative measures to improve tax revenues and taxpayer compliance. However, it did not estimate penalties, social norms and interactions, the underground economy, and incentives for tax authorities in curbing evasion. Quantification of the costs of administration and costs of taxpayer compliance was also not undertaken to compare with tax leakages. Others areas may also have been omitted due to the wide range of issues on tax leakages. Notwithstanding, these areas are equally important and should be subject to an in-depth investigation. The analysis focused on evasion in individual and corporate income taxes, VAT, and excise tax. An analysis of evasion in capital gains taxes is also included in conjunction with the EMERGE/USAID’s technical assistance with the BIR to address the leakages in this tax. Individual and corporate income taxes, VAT, and excise tax account for about 70 percent of the BIR’s total collection while capital gains tax contributes 0.9 percent. Too often, policymakers focus their efforts on increasing revenue without looking at tax policies and administration measures with reducing tax evasion and tax avoidance in mind. This has to change since tax evasion robs government of revenues for fulfilling its social objectives. Although tax evasion is difficult to eliminate, reducing it is not impossible.
For instance, in 1998 tax evasion accounted for 98.4 percent of the decline in the tax effort, although this has dropped to 46.2 percent in 2001. Similarly, income tax evasion accounted for 100 percent of the decline in income tax effort in 1998. This dropped to 50 percent in 2001. However, the impact of excise tax evasion to the decline in the excise tax effort rose from 0 percent in 1998 to 10 percent in 2001 while VAT evasion maintained a 100 percent impact on the decline of VAT effort for the same period. All these declines, shows that the BIR already had the capability to collect all these taxes before. Simply maintaining the same level of diligence on the part of the tax authorities would have prevented tax evasion from reducing the tax effort.
Policies that lower the costs of taxpayer compliance is an area for consideration for curbing evasion in individual income tax. The legislation of the Simplified Net Income Tax System (SNITS) on professionals in 1992 caused a dramatic drop in leakages from 1993 to 1994. By simplifying the procedures for taxing professionals, compliance from this “hard-to-tax” sector was encouraged and evasion was reduced significantly. Another area for consideration is intensifying the BIR’s intervention in self-policing systems as in the case of VAT. The shift to the VAT system reduced the scope for tax evasion by providing buyers the incentives to declare transactions that the tax authority could use as basis for noncompliant suppliers. Compared to the old system of percentage
34

sales taxes, the VAT provides the tax authority informational leverage over noncompliant sectors, making its job easier. However, even with self-policing mechanisms, tax evasion is still possible as experienced between 1998 and 2001 when, according to a study, tax evasion alone accounted for the drop in VAT tax effort from 1.8 to 1.6 percent. Tax administration measures that increase the probability of detecting taxpayer evasion or avoidance are equally effective means of reducing tax leakages. When tax authorities are diligent in implementing tax laws and administration measures to improve taxpayer compliance, evasion tends to slowdown. For instance, individual income tax and VAT evasion declined in 1993 and 1994, and corporate income tax evasion in 1997 as BIR actively pursued reorganization, building-up information technology capacities, tax mapping, and taxpayer audits.
Similar administrative measures were implemented between 2002 and 2005. The BIR aggressively used information and communications technology to improve the quality of governance in tax administration by putting in place taxpayer compliance control systems and systems for effective and early detection of leakages. It also intensified enforcement through taxpayer audits and prosecution of tax evaders, pursued some organizational adjustments, and established partnerships with the private sector to help upgrade the capability of BIR and enhance the social responsibility of taxpayers.
Like the VAT system, simplification of the excise tax system is also desirable. Leakages persisted despite the shift to specific from ad valorem tax system. Reducing the tax rate tiers is a move in the right direction to address “substitution” effects which erodes the tax base. Tax administration measures that reduce the incentive for collusion between the taxpayer and tax authority are equally effective means for reducing tax leakages. The development of online filing and payments systems is a move in the right direction and should be pursued vigorously. For instance, the development of the Automated Excise Data Management System (AEDMS) that will allow excise taxpayers to file their removal declaration through the internet instead of through the ROOPs. Another is the ONET3 system enhancements that will minimize the involvement of the tax authority in calculating the tax liability of the taxpayer. Is the existence of tax evasion an argument for a lower marginal tax rate? Reducing the marginal tax rate on corporate income tax does not offer any clear conclusion on this point. Marginal tax rates should not be a policy tool for addressing tax evasion as it has an ambiguous effect. Lowering the tax rate has two related effects-income and substitution (Sandmo 2004). One, it makes the taxpayer richer (income effect) and the other, more willing to take risks (substitution effect) to evade taxes. This risk is determined by the probability of getting caught in evading taxes and the penalties for evasion. Corporate income tax evasion is anticipatory such that tax amnesties have not deterred tax evasion. Corporate income tax evasion, and to some extent VAT evasion,
35

rises prior to a tax amnesty. Although, during a tax amnesty, corporate-tax evasion is reduced somewhat. A common thread about these tax amnesties is that every newly appointed Commissioner, more often than not, uses it as a strategy for raising revenues than curbing tax evasion behavior itself. Throughout the years, the BIR has kept tab of collections resulting from tax amnesties. But, it has not reported on the extent of tax evasion addressed and the profile of compliance by taxpayers who availed of the tax amnesty. A “fear factor” approach could elicit better compliance from corporate taxpayers. Tax amnesties are not effective administrative measures for curbing evasion. For instance, corporate tax evasion exhibited an anticipatory behavior in response to tax amnesties. Because of this behavior, a “fear factor” approach could elicit a more positive response in curbing corporate tax evasion. As a final note, the studies have shown that tax evasion or tax avoidance is pervasive in the various taxes collected by the BIR and is too complex to be solved by simple policy adjustments; and that the set of administrative instruments required for controlling it is vast administrative measures. Tax evasion can not be addressed by implementing policies and administrative measures in a piece-meal and half-finished fashion. It should be executed in a consistent, progressive, and well targeted manner until objectives are attained. Part of this approach will require an in-depth investigation of the nature of tax evasion in the various taxes. This is because tax evasion patterns vary from one type of tax to another and each tax evaded somewhat responds differently to policy and administrative changes.
The investigations should have a structured program of action in order to provide greater focus and increased rigor in monitoring and measuring tax leakages, and evaluating and refining strategies to improve taxpayer compliance. Perhaps, there are some lessons to learn from the US-IRS and Revenue Canada experience.
36

References
Abola, Victor A. and Francis Xavier M. Vicente (1995), “Reforming the Excise Tax on Beer and Cigarettes,” No. 10 Economic Policy Papers, University of Asia and the Pacific. Allingham, Michael G. and Agnar Sandmo (1972), “Income tax evasion: A theoretical analysis,” Journal of Public Economics 1, 323-338. Alm, James (1999), “Tax Evasion,” Encyclopedia of Taxation and Tax Policy, 374-376. _____________________ and Jorge Martinez-Vazquez (2001), “Societal Institutions and Tax Evasion in Developing and Transitional Countries,” Andrew Young School of Policy Studies, Georgia State University. Andreoni, James, Brian Erard and Jonathan Feinstein (1998), “Tax compliance,” Journal of Economic Literature 36, 818-860. Andvig, Jens C. and Karl O. Moene (1990), “How corruption may corrupt,” Journal of Economic Behavior and Organization 13, 63-76. Arrow, Kenneth J. (1974), Essays in the Theory of Risk-Bearing. Amsterdam: North-Holland. Avila, Antonio Jr. A. (1984), “Notes on Tax Evasion in the Philippines,” Volume III Lyceum Research Journal, 32-41. Baldry, Jonathan C. (1979), “Tax evasion and labour supply,” Economics Letters 3, 53-56. Becker, Gary S. (1968), “Crime and punishment: An economic approach,” Journal of Political Economy 76, 169-217. Boadway, Robin and Motohiro Sato (2000), “The optimality of punishing only the innocent: The case of tax evasion,” International Tax and Public Finance 7, 641-664. Brown, Robert E. and Mark J. Mazur (2003), “IRS’s Comprehensive Approach to Compliance Measurement,” US Internal Revenue Service. Chen, Kong-Ping and C. Y. Cyrus Chu (2002), “Internal control vs. external manipulation: A model of corporate income tax evasion,” unpublished paper, Institute for Social Sciences and Philosophy, Academia Sinica, Taipei. Christiansen, Vidar (1977), “Two comments on tax evasion,” Journal of Public Economics 13, 389-401.
37

Clotfelter, Charles T. (1983), “Tax evasion and tax rates: An analysis of individual returns,” Review of Economics and Statistics 65, 363-373. Cowell, Frank A. (1990), Cheating the Government. Cambridge, Mass.: MIT Press. ______________ (2002), “Sticks and carrots,” unpublished paper, London School of Economics. Cremer, Helmuth and Firouz Gahvari (1993), “Tax evasion and optimal commodity taxation,” Journal of Public Economics 50, 261-275. ________________________________ (1994), “Tax evasion, concealment and the optimal linear income tax,” Scandinavian Journal of Economics 96, 219-239. Crocker, Keith J. and Joel Slemrod (2003), “Corporate tax evasion with agency costs,” unpublished paper, University of Michigan Business School. Das Gupta, A. and D. Mookherjee (1998), “Incentives and institutional reform in tax enforcement: an analysis of developing country experience,” Delhi: Oxford University Press. Diokno, Benjamin E. (2005), “Reforming the Philippine Tax System: Lessons from Two Tax Reform Programs,” Discussion Paper No. 0502, University of the Philippines School of Economics. Domingo, Estrella V., and Reynaldo F Fulleros (2002), “Real estate price index: a model for the Philippines,” BIS Papers No 21, National Statistical Coordination Board (NSCB). Eide, Erling (2002), “Tax evasion with rank dependent expected utility,” unpublished paper, Department of Private Law, University of Oslo. Fortin, Bernard, Guy Lacroix, and Marie-Claude Villeval (2004), “Tax Evasion and Social Interactions.” Cahier de recherche/Working Paper 04-32, CIRPÉE (Centre interuniversitaire sur le risque, les politiques économiques et l’emploi). Franzoni, Luigi Alberto (1999), “Tax Evasion and Tax Compliance,” University of Bologna, Italy. Giles, David E. A. (1999), “Modelling the Hidden Economy and the Tax-Gap in New Zealand,” Department of Economics, University of Victoria. Guevara, Milwida M. (1989), “Some Issues on Taxation in the Philippines,” Lyceum Research Journal, Lyceum of the Philippines, 31-40.
38

Gupta, Anil and Vishnu Kapur (2000), “Microsimulation in Government Policy and Forecasting: Contributions to Economic Analysis,” North-Holland. Gupta, S. and B. Mehta (1982), “Estimate of Underreported National Income," Journal of Income and Wealth 5. Harding, A. (2000), “Microsimulation and Public Policy: Contributions to Economic Analysis,” North-Holland. Herschell, F. (1978), "Tax Evasion and Its Measurements in Developing Countries," Public Finance 33. Jin Kwon Hyun (2005), “Tax Compliances in Korea and Japan: Why are they different?” Policy Research Institute Ministry of Finance, Japan. Manasan, Rosario G. (1988), “Tax Evasion in the Philippines, 1981-1985,” Volume XV, Nos. 27 Journal of Philippine Development, 167-190. ________________(2000). “Improving Tax Administration: A New View from the Theory of Tax Evasion in a Corrupt Regime”, No. 2000-11 PIDS Policy Notes. ________________(2002). “Explaining the Decline in Tax Effort”, No. 2002-14 PIDS Policy Notes. ________________ and Rosario G. Querubin (1986), “Revenue Performance of National Government Taxes, 1975-1985”, 8701 PIDS Staff Paper. Madžarević-Šujster, Sanja (2002), “An Estimate of Tax Evasion in Croatia,” Occasional Paper No. 13, Institute of Public Finance. Mookherjee, D. (998), “Incentive reforms in developing country bureaucracies: lessons from tax administration,” Annual World Bank Conference on Development Economics 1997, World Bank, Washington, D.C. __________________ and I. Png. (1994), “Marginal deterrence in enforcement of law,” Journal of Political Economy 102, 5. National Tax Research Center (1985 and 1986), “Measurement of Tax Evasion,” NTRC Journal. ________________________(1991), “Measurement of Tax Evasion: The Gap Approach,” NTRC Journal. ________________________(1987), “Confronting the Problems of Tax Avoidance and Evasion: Selected Countries in Asia and the Pacific.”
39

Peacock, A. and G.K. Shaw (1982). "Tax Evasion and Revenue Loss," Public Finance 37. Richupan, S. (1984), "Measuring Tax Evasion," Finance and Development 21. Slemrod, Joel and Shlomo Yitzhaki (2000), “Tax Avoidance, Evasion, and Administration,” Working Paper 7473, National Bureau of Economic Research. Sandmo, Agnar (2004), “The theory of tax evasion: A retrospective view.” 31/04 Discussion Paper, Norwegian School of Economics and Business Administration. Shoup, Carl S. (1969), “Tax Administration,” Public Finance, 427-440. Spicer, Michael W. and Lee A. Becker (1980), “Fiscal Inequity and Tax Evasion,” 32.2 National Tax Journal, 171-176. __________________ (1986), “Civilization at a Discount: The Problems of Tax Evasion,” 39 National Tax Journal, 13. Srinivasan, T.N. (1973), "Tax Evasion: A Model" Journal of Public Economics 2, 339-346. Stiglitz, Joseph E. (2000), “Economics of the Public Sector,” 3rd Edition. Tanzi, V. (1982) “Underground Economy and Tax Evasion in the United States: Estimates and Implications," in V. Tanzi, ed., The Underground Economy in the United States Abroad. Toronto: Lexington Books. Thomas, Wayne, Elinor Convery, Dennis Cox, and Chih-Chin Ho (1996), “Federal Tax Compliance Research, Individual Income Tax Gap Estimates for 1985, 1988, and 1992,” Department of the Treasury Internal Revenue Service. Vicente, Francis Xavier M. (2000), “Global Patterns in Excise Taxation: A Look at Selected Low, Middle, and High-Income Economies.” Lyceum Research Journal, Lyceum of the Philippines. _____________________________, and Elmond S. Trinidad (2001), “Cigarettes and Beer Excise Tax Database and Revenue Estimation Model,” Fiscal Policy Analysis Activity Final Report, 15-44. Vihanto, Martti (2000), “Tax Evasion in a Transition from Socialism to Capitalism: The Psychology of the Social Contract,” No. 6 Discussion Papers, Bank of Finland Institute for Economies in Transition. Villamor, Cecilia D. (1999), “Estimation of the Income Tax Gap for 1995-1997,” Volume XI.I NTRC Research Journal, 10-17.
40

Annex A: Matrix of Philippine Tax Leakages, point estimates
Tax Type DOF PIDS NTRC IMF Act’l Pot’l Gap Act’l Pot’l Gap Act’l Pot’l Gap Act’l Pot’l Gap Php
% Gap Php
% Gap Php
% Gap Php
% Gap
A. Direct Taxes Corporate Income Tax 85.7 145.0 59.3 41% 78.7 134.7 56.0 42% 3.7 7.4 3.7 50% 2.9 7.4 4.5 61% Personal Income Tax 78.0 177.0 99.0 56% 68.2 173.9 105.7 61%
Compensation Earners 63.3 7.1 11% 75% Self-Employed 62.0 50.1 81% 80%
Documentary Stamp Tax on Financial
Assets 3.0 9.4 6.4 68% 15.8 20.0 4.2 21% Interest Withholding Tax on Bank Deposits 16.3 17.4 1.2 7% 15.7 26.7 10.9 41% Fringe Benefits Tax 0.3 2.6 2.3 90% 1.2 2.6 1.3 52% Gross Receipts Tax 9.1 10.6 1.5 14% 9.2 10.7 1.5 14% Insurance Taxes 0.8 1.1 0.4 33%
B. Indirect Taxes Value Added Tax 79.8 149.4 69.7 47% 55.1 147.5 92.4 63% 47.5 95.0 47.5 50% Excise Tax
Beer and Tobacco 28.4 29.9 1.5 5.0% Gasoline 43.8 45.5 1.7 3.8%
Total 345.0 588.0 242.9 36% 123.3 321.4 198.1 62% 78.7 259.9 113.1 44% 96.0 162.3 73.7 49%Source: TIERG DOF, 2000
PIDS, 1999IMF, 1999NTRC, NI
41