2005: waste heat boiler (101-c) leakages & possible causes
TRANSCRIPT
Waste Heat Boiler (101-C) Leakages & Possible Causes
Paper Abstract: Waste Heat Boiler 101-C is an essential part of Ammonia Plant in Kellogg design. Almost every plant is facing the problems of no flow, reverse flow and tube leakage. These problems are more significant on the plants where production capacity has been increased. In this article flow in the risers is considered. How flow is checked and a method is proposed to establish and maintain equal flow in both the risers.
Author: Ishfaq Ahmad Gondal Dawood Hercules Chemicals Ltd. Lahore Pakistan
Introduction
A - Dawood Hercules Chemicals Ltd. (dh)
nitially it was a joint venture of Dawood group of Pakistan and Hercules of USA. This fertil-izer plant was installed and commissioned in
1970. Initially its production was 625 MTPD of Am-monia and 1100 MTPD of Urea with the brand name of Buber Sher ( The Lion). The Ammonia plant is basi-cally a Kellogg design. The Ammonia plant was re-vamped in 1991 for energy conservation and 30% ca-pacity increase. Urea production was increased to 1350 MTPD and Ammonia to 825 MTPD.
Facilities
The present plant facilities are: • 825 MTPD ammonia plant • 1350 MTPD granular urea plant • Utility plant provides 15MW Thermal Genera-
tion and also has a water treatment plant.
Raw Material
The basic raw material is natural gas supplied at battery limit by Sui Northern Gas Pipelines Ltd. (SNGPL). The gas requirement is about 45 MM SCFD
B – The Problem
At Dawood Hercules, failure of the waste heat boiler (101-C) has been the cause of production loss. Tripping details are provided in a separate table. Table # 1 elaborates the no. of trippings and the duration.
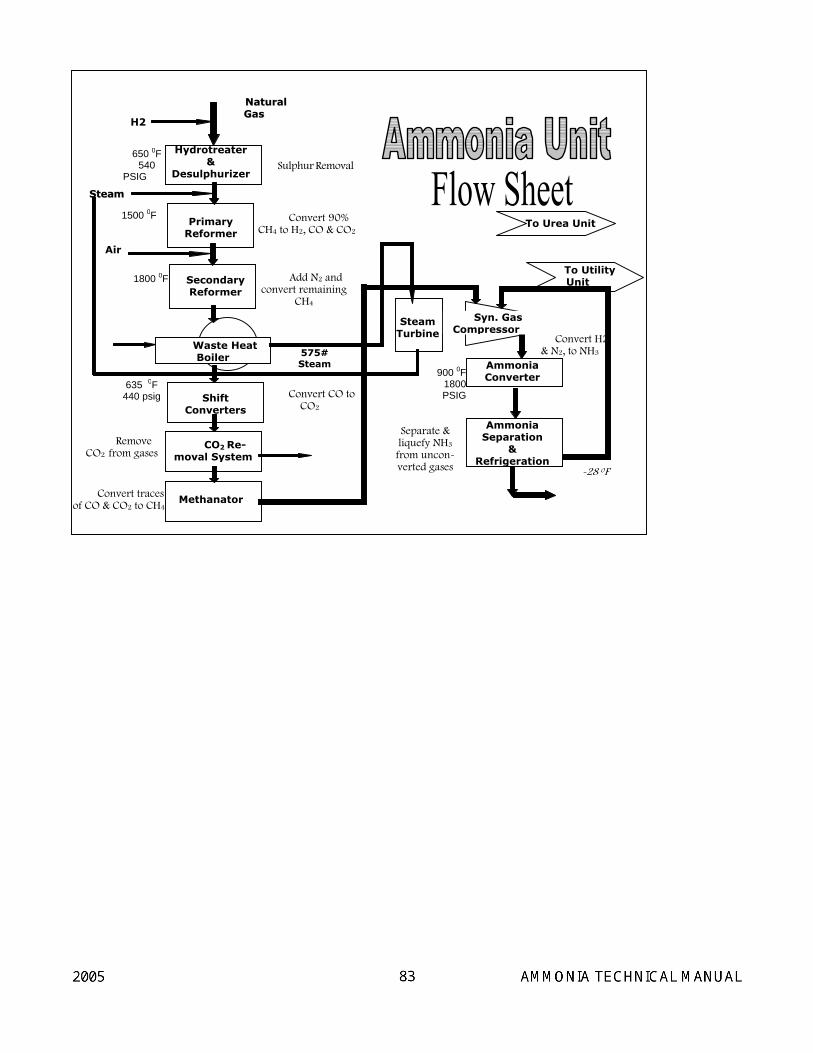
PROCESS DESCRIPTION Ammonia Flow sheet is attached at the end for
ready reference. • Natural Gas as Feed Gas is compressed in
1102-J & preheated in 101-B convection Sec-tion
• H2 is mixed into feed gas and de-sulphurized to make it sulphur free
• De-sulphurized Natural Gas after mixing with steam is reformed in Two steps:
1. Primary Reforming 2. Secondary Reforming
1 - Primary Reformer (101-B)
All Hydrocarbons except 11 % (approx.) CH4 are converted into H2, CO2 and CO in the presence of heat and Nickel catalyst – 815OC & 33.5Bar (15000F & 485 Psig)
I
2 - Secondary Reforming (103-D)
1. Air from 101-J compressor, after heating and mixing steam, is introduced into 103-D
2. Partially reformed gases from 101-B with 11 % (approx.) unconverted CH4 is mixed with air
3. All O2 of air is burned with H2, leaving behind N2 required for NH3 production generating great amount of heat.
4. Temperature in combustion zone rises to about 2000oF
5. Remaining CH4 slipped from primary reformer is further reformed leaving behind only 0.45 % CH4
6. Reformed gases having mainly H2, N2, CO and CO2 at about 1769oF and 445Psig enter waste heat exchanger (101-C)
Importance in Process
1. Process gases from 103-D exit at 1769oF which contain a huge amount of heat energy. Where as down stream process vessel, HTS requires low temperature of about 650oF
2. About 165 MMBtu/hr of heat equivalent to 5.5 MMSCFD NG, has to be removed from the process gases
Heat Recovery
1. Due to high energy cost it is strongly desirable to recover heat for useful purpose
2. In an Ammonia plant it is usually recovered to produce HP steam in two steps: • Primary Waste Heat Exchanger (101-C)
Recovers about 149 MMBtu/hr • Secondary Waste Heat Exchanger (102-C)
Recovers about 15MMBtu/hr
Primary Waste Heat Exchanger (101-C)
1. Dawood Hercules Ammonia Plant is designed by M.W. Kellogg
2. Our 101-C is M.W. Kellogg’s Bayonet Design, fabricated by Hitachi, Japan
3. Shell side has process gases and Tube side has high pressure Boiler water
4. It produces steam about 67% of the total am-monia plant steam production.
OPERATION OF 101-C WASTE HEAT BOILER
101-C is a bayonet type heat exchanger having 255
bayonet 1 inch diameter inner tubes and 2 inch diameter scabbard tubes. Water flows from boiler drum 101F through down-comer into water chamber then it enters the inner tube at the top and flows down through the bayonet inner tubes. At the bottom of the inner tube, flow is diverted upward in the scabbard-bayonet annu-lus towards the outlet (steam chamber) and then rises to boiler drum (101F) through the risers. Fig.#1
Initially boiler drum 101F, down-comer, risers and 101-C are filled with water. Heating starts at the bot-tom of tubes in 101-C by injection of hot gases from re-former into `shell side of 101-C. Water starts heating and starts rising up through the outer tubes and cold water flows down, through the inner tubes. Hot water rises into the steam chamber and goes to boiler drum 101F via risers. Hot water mixes with cold water in the risers (only during startup – during operation hot water + steam bubbles traverse the risers), heating it thus de-creasing the density it becomes light hence it starts ris-ing up and reaches 101F boiler drum. Ideally hot water should rise through both the risers in the form of steam. During start up only cold shots will be given in the down-comer to start steam generation and establish the flow in the risers. Ideally water should flow down through the down-comer into 101-C, and should rise into both the risers to the boiler drum.
Balancing Modernization and Revamp (BMR). In 1991 it was decided to increase the capacity of the plant from 1100 tons per day to 1350 tons per day. For this a thorough study was carried out. New equipments were added and some old components were replaced. Major changes were made on Urea plant.
This waste heat boiler had been operating normally till BMR in 1991, when capacity was increased so the load of 101-C was increased also. During BMR study M/s Kellogg declared that no modification was required in 101-C as it could take the additional load. Unfortu-nately the things shaped otherwise and Dawood Hercu-les had to face problems of 101-C leakage, causing pro-duction loss and had to bear heavy maintenance costs. Table # 1 indicates details of trippings.
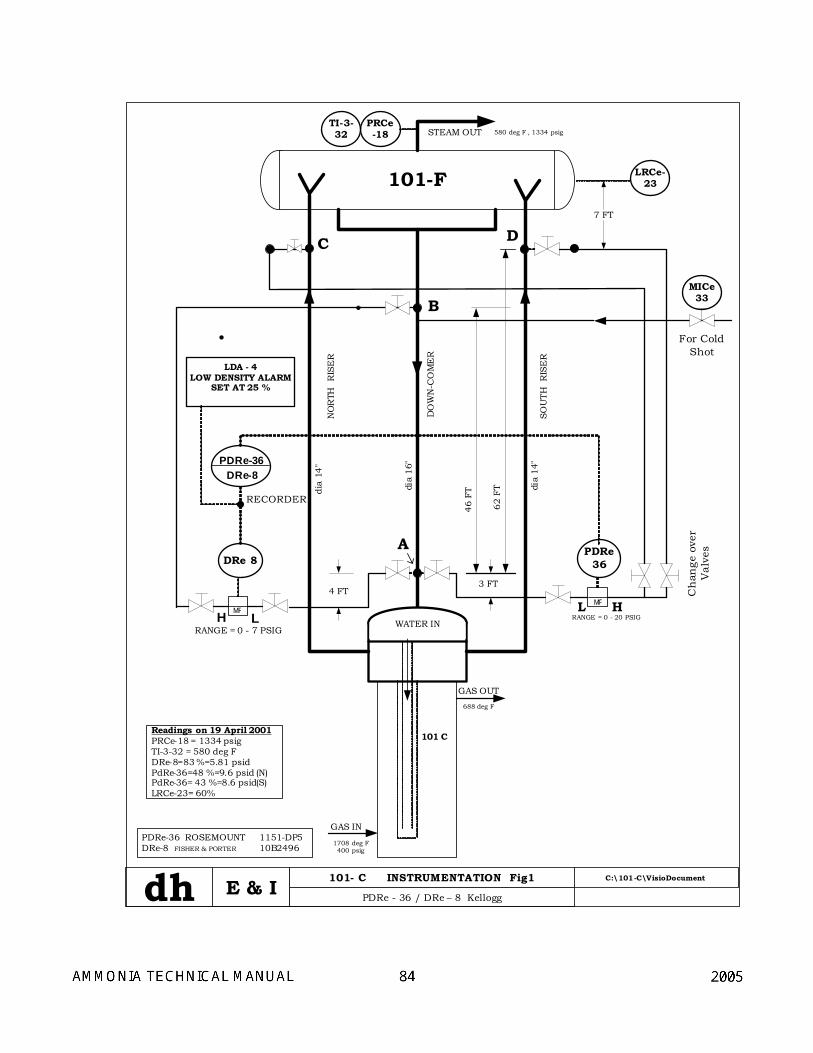
101-C Instrumentation
Refer to attached drawing fig#1showing instrumen-
tation for the measurement of density and water circula-tion between 101-F (steam drum) and101-C (heat ex-
changer). 101-C heat exchanger is not only working as simple heat exchanger but also as an energy pump, which takes water from 101-F through down-comer heats it in 101-C tubes and sends back to 101-F through two risers (north and south side risers). Originally two instruments were provided on the 101-C to measure the density of water in the down-comer and the pressure difference between the inlet (down-comer) & outlets (north side riser and south side riser), which is the indi-cation of water circulation through 101-C. Tags and range of the instruments installed on 101-C;
a) DRe-8 (For density of water in down-comer)
Range=0–7 PSI b) PDRe-36 (For pressure differential between
down-comer lower point & riser) Range=0–20 PSI
c) Change over valves fig 1 --were installed for checking the ∆P of the risers with respect to the down-comer using same PDRe36.
DRe-8
DRe-8 (density recorder) is installed on down-comer. The distance between the two process points on down-comer is 46 feet. A density measuring instrument (differential pressure transmitter) is installed in line of the bottom process connection. The low side of the transmitter is connected with bottom process point ‘A’ and the high side of the measuring instrument is con-nected with top process point ‘B’ on the down-comer as shown in Fig#1. The principal of density measurement is that density is inversely proportional to the ∆ P.
Average reading on recorder is 80% = 5.6 Psig CALCULATIONS Height between taps of down-comer = 46 feet Specific gravity of water in hot leg = 0.687 Specific gravity of water in cold leg = 1 Pressure in high chamber of Transmitter = (46 x 1 x 0.4335) = 19.94 Psi Pressure in low chamber of Transmitter = (46 x 0.687 x 0.4335) = 13.70 Psi Pressure across the Transmitter = (19.94 -13.70) = 6.24 Psi very close to average Instrument calibration range = 0 – 7 Psi PRCe-18 Steam Pressure in (101F) = 1334 Psig
TI-3-32 (in 101F) Steam Temperature = 582.6oF Calculation based on Kellogg’s formula [0.4335x H x (D1 – D2)] / D1 = R
D2=D1- {RD1/ (0.4335 x H)}
Where H = Height between taps in feet on down-comer
= 46ft R = Down-comer differential recorder reading ? in Psi D1 = Density of cold leg (upper leg of DP cell) = 62.15 lbs/ft3 D2 = Density of hot leg (down-comer) = 43.5 lbs/ft3 ( Density of water at 1334 Psig & 582.6oF =43.5lbs/ft3 )
With this the reading of Dre-8 = [0.4335 x 46 x (62.15 – 43.5)]/62.15 = 5.9 Psig
Alternate taking the Reading of Dre-8 = 5.6 (80%) =
At 900 Psi, 534 oF in 101F Drum H= 46, D1= 62.15, R=5, D2 from table = 46.9 lbs/ft3
At 1300Psi & 582oF R at DRe-8 = 5.6Psid,
D2 from table ≈ 43.5 lbs/ft3 = 0.321 (62.15 - D2) D2 = 62.15 -17.45 = 44.7 lbs/ft3
This is very close to the reading from the table this in-dicates that Dre-8 is showing correct reading
[0.4335 x 46 x (62.15 – 43.5)]/62.15 = 5.9 Psid
PdRe 36 (for ∆P)
Differential pressure transmitter was installed with
HP side connected to point “A” of the down-comer and the LP side was connected to points “C” & “D ” on the risers and the selection of the risers was through change over valves as shown in fig#1.
Changes in Instruments Initially the instrumentation was not proper because
the reference points ‘C & D’ on these risers were at an elevation of (161 + 62) = 223 ft Where as they should have been at the elevation of the lower point ‘A’ of the down-comer i.e., at 161ft elevation. Fig.#1 indicates the location. Two new points ‘ E & F’ were created on both the risers.
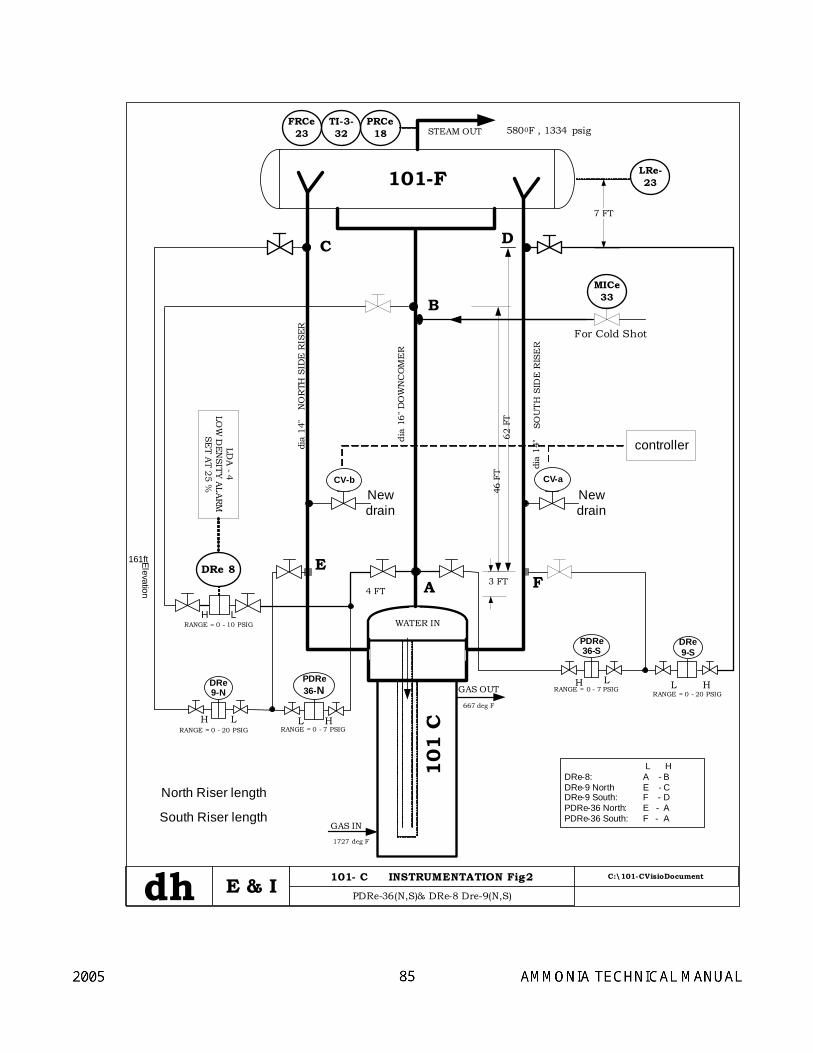
DRe (8, 9N, 9S) for Densities Initially density of the down-comer was measured
only and DRe 8 was installed for this purpose between point s’A&B’. Two more density recorders DRe 9N and DRe9S were provided to measure the density of both the risers and this provided the clear indication of the difference in the density. It helps in monitoring the flow in the risers. DRe9N was connected between E & C (62ft. apart) on the North riser and DRe9S was con-nected between F & D(62ft. apart) on the south riser. Refer fig #2
PdRe 36N, 36S (for ∆P)
Initially there was only one Transmitter ‘ PdRe 36 ‘
for the measurement of ∆P between the riser and the down-comer. PdRe 36 was installed between point ‘A’ on the down-comer and points ‘C&D’ on the risers for this purpose.Selection of the riser was through change over valves. See Fig# 1. The reference points‘C&D’ on the risers were not at a proper elevation. The points on the risers were at a height of 61ft above the sample point ‘A’ of the down-comer. This set up was also modified. Two new points (E & F) were provided on the risers at an elevation of 161ft. Now E, F & A (shown in fig #2) were at the same elevation.
To indicate ∆P between down-comer and risers PdRe36N and PdRe36S were provided to measure ∆P of both the risers with respect to the down-comer this new arrangement facilitated to indicate the factual posi-tion of the behavior of both the risers and the down-comer. PdRe36N was connected between points ‘A’ of the down-comer & ‘E’ of the North riser. PdRe36S was connected between points ‘A’ of the down-comer & ‘F’ of the South riser. All these indications were displayed on a monitor via a PLC. This was to provide compari-son of all the indications. fig # 3 shows sample print out of PLC display.
Comparison of Readings A set of readings of these instruments are given below DRe-8 = 6.03 DRe-9N= 9.8 DRe-9S= 15 PDRe 36 N = 0 PDRe 36 S = 3.7 Using Kellogg formula D2=D1- {RD1/(0.4335 x H) (1psi= 2.307ft of water or 1ft of water=1/2.307=0.4335 psi) DRe R ∆P Psi H ft D1 D2 DRe8 6.03 46 62.15 43.36 DRe 9N 9.8 62 62.15 39.49 DRe 9S 15 62 62.15 27.46 Density of down-comer (DRe 8) is 43.36 lbs/ft3 very high. Density of the north riser (DRe-9N) is close to the down-comer and it is higher than the south riser. Fur-ther PDRe 36 N indicates 0Psi ∆p between down-comer and the north riser. All this indicates that there is no flow in the north riser and all the flow is through south riser. Layout Difference Between the Risers
Flow of any fluid follows easy path, i.e., the path with least resistance. Ideally both the risers should be of exactly equal length, diameter and shape only then they can share equal flow. Physically both the risers are not of equal length hence there is a difference of 1Psi be-tween both the risers when measured at the 2 points keeping the elevation reference the same for both the risers. This gives clear indication that resistance for steam in both the risers is not exactly the same. The riser providing path for the steam has less density and higher surface temperature as compared to the other riser which is not functioning properly.
This is the major reason that mostly only one riser is functioning properly; the 2nd riser almost always works as dead column which is clearly indicated by the densities of both the risers.
Temperature Comparison Measurement of surface temperatures indicates the
same. The temperature of the riser with the steam flow will be higher than the temperature in the down-comer and the temperature of the riser without steam flow will be less than temperature of the other riser. or very close to that of the down-comer. In our case skin temperature of north riser is less than that of south riser.
Density Comparison If the densities are compared, density of the riser
with steam flow will be less than the density in the down-comer & the density of the riser without steam flow will be very close to the density of the down-comer. It is functioning as dead column which is blocked by the steam pressure in the steam chamber and in the 101F boiler drum. Density of down comer is 43.36 lbs/ft3 Density of the north riser is 39.49 lbs/ft3 and the density of the south riser is 27.46 lbs/ft3. This clearly indicates that flow is through south riser only. North riser is behaving as dead column almost.
The density of one riser remains almost very close to the density of down-comer, hence very less ∆P between the two. further the skin temperature of this riser is also much less than the other one. This clearly indicates that this riser is without proper flow and behaving as dead water column.
In original Kellogg design the density of the down-comer and one riser is measured. It has not been con-sidered important to measure the ∆P of the second riser and the down-comer. At the start of the process, to es-tablish the flow, cold shots are injected in the down-comer using MICe 32 and is continued till flow is es-tablished in one riser at least.
Physically both the risers are not of equal length furthermore the number of bends and inclinations are also not the same. This is the major cause of difference in behavior of both the risers.
In our plant lengths are : North riser 14” dia (3’8” + 12’6” + 16’6” + 64 + 12 + 9’6”)ft = 116’10” South riser 14” dia (3’8” + 12’6” + 16’6” + 9’ + 63’ + 12’ + 7’6”)ft = 113’10” Down-comer 16”dia (17’ + 11’6” + 50’ + 5’ + 20’ + 8’8” + 4’6”)ft = 117’8” The required behavior of this waste heat boiler 101-
C is such that the water should flow from boiler drum 101F via down-comer in to the water chamber where all the inner tubes are connected. This cold water goes to the hot gas chamber in 101-C via inner tubes. All the inner tubes open up in the outer tubes of the 101-C shell. Refer Fig# 1 for detail. Here the water is heated and flow is diverted upwards through outer tubes into steam chamber from where it goes to boiler drum ‘101-F’ via risers.
Failures of 101-C Under normal design 101-C is capable of delivering
the required steam without any major failure. M/s Kel-logg’s report indicates that 101-C has failed frequently only in those plants where the capacity / production has been increased i.e. it has failed on the plants where ever BMR has been carried out and all the modifications in 101-C like baffles etc have failed. The reason being that under normal design any fluctuation in the steam load could be catered for without any damage to 101-C. But after BMR, the load on 101-C also increases so it has not been able to withstand fluctuations in the steam load. Since mostly the 101-C has been working on one riser only and the second riser has been working as dead water column and at the time of fluctuations in steam load there are possibilities for the cold water of the dead column to enter tubes via the steam chamber and causing the leakage of 101-C tubes. As there is possibility of reverse flow during sudden fluctuations in steam load.
Efforts to establish flow in both Risers
Low or maldistributed circulation in 101-C causes
following problems: • Over heating of tubes • Rupture/Failure of tube • Deposition of non-corrosive Sodium Iron Phos-
phate on the tube running at high temperature for long duration
In this design of 101-C it is highly desirable to avoid reverse flow or no flow. Furthermore flow should be established in proper sequence i.e., down-comer should provide path for the water from 101F to 101-C, and both the risers should share the steam flow from 101-C to 101F.
For this reason cold shot injection via MICE 33 is an essential part of 101-C design and it is used during startup only. Cold shots are provided till the flow is es-tablished in the riser. This effort helps in establishing flow in one riser only as both the risers are not similar inshape. Flow in the second riser
To establish the flow in proper sequence, a drain of 2” dia with a valve on it was created in the north riser without flow. When some of the water was drained the steam flow established from that riser also. Since the drain was not controlled so the flow balance drifted and the steam flow in the original riser was reduced.
It was concluded that a better way to establish flow in both the risers is to create drains on both the risers and regulate the drains using controller and control valves. Controller will compare the ∆P of both the ris-ers. Readings of PDRe36N and PDRe36S are to be used. Controller will be used to drain the riser having less ∆P and will regulate the flow till ∆P for both the risers is equal. So if drain from both the risers is con-trolled by using control valves it is possible to maintain steam flow from both the risers. This will eliminate the reverse flow or no flow from any riser and will also help in reducing the losses caused by fluctuation in steam requirement. So the same size of drain (2inch dia) was also created on the second riser and a valve was installed.
Both the drains could not be tried as such opera-tions can be carried out during plant shut down only and at that time required control valves and the control-ler were not available.
It was also proposed to install a controller and two control valves, one on each drain point and the error signal to be generated by a controller by comparing the ∆P of both the risers. That is the pressure difference of both the risers compared to the down-comer should be almost equal to ensure the same behavior of both the risers. With this arrangement reverse flow can be avoided and both the risers behave normal and equally share the steam flow.
Controlled drains are to be provided on both the ris-ers. Alternately both the difference in densities can be used to drain the riser with higher density till both the densities are the same. This will confirm that both the risers are working normal and that the possibility of the reverse flow is eliminated.
This controller setup can be used only when steam generation has started and flow has established in one riser atleast and MICe 32 has been closed. After this these controller and drain control valves will be used.
Comparison of two plants
Two cases were compared 101-C at Dawood Her-cules plant and 101-C at Pak Arab Multan. Table # 2 provides detailed information. On checking it was found that in both the cases only one riser is function-ing properly i.e., the steam flow from 101-C to 101F is via one riser only, and that the second riser is behaving as dead column. Before BMR there was not appreciable leakage problem at Dawood Hercules plant but after BMR, 101-C leakage has escalated and has been cause of lot of production loss. There were many leakage
events after the BMR as detailed in the leakage history ( table #1). In case of Pak-Arab Fertilizer Multan, though only one riser is functioning and the second riser is only a dead column of water, but the size of the 101-C and its down-comer and risers is such that load fluctuations have little effect and it is working trouble free, and they have not faced any leakage problem so far. The comparison table#2 shows the major differ-ences:
BMR – Modifications & Chemical Cleaning
The following points related to 101-C were carried out during BMR of 1991;
o Modifications in risers of auxiliary heater o Kellogg advised chemical cleaning of
whole circuit o Not-failed Bundle A replaced with Bundle
B in Sep.1991 o Chemical cleaning was carried out by M/S
Keller & Bohack, Germany o Chemicals Used: Caustic soda, detergent,
lithosolvent, citric acid, hydrazine, ammo-nia
o Dislodging of old magnetite layer o System was not properly flushed by M/S
Keller & Bohack
FAILURE HISTORY Since commissioning in October 1971, the 101-C
failed twice until Ammonia Plant was revamped in 1991 for energy conservation and 30% capacity in-crease. However, M. W. Kellogg considered this (101-C) heat exchanger appropriate to handle the increased heat load on 101-C after-BMR. Risers of Auxiliary Heater were Modified In BMR. On Kellogg’s recom-mendation, the whole circuit including steam drum, down-comers, risers, 101-C, secondary waste heat boiler 102-C, 103-C and auxiliary heater was chemi-cally cleaned. Chemical cleaning was carried out by M/S Keller & Bohack, Germany. However they could not flush out properly the old magnetite layer detached from the inner walls of the circuit during chemical cleaning. Afterwards, 101-C faced frequent failures and its operation became unpredictable.
Table #1 shows the 101C failures at our plant. In 2001 There were 6 failures of 101-C
Deposit Found in One Not Failed Tube of Bundle in 2001
• A dark grey deposit was found in one not failed tube.
• The sample was provided to M/S Nalco along-with the laboratory analyses reports of boiler water for the service life of the bundle A. The deposit was found to contain sodium (as Na2O), phosphorous (as P2O5) and iron (as Fe2O3) as analyzed by Nalco.
• Nalco reviewed the boiler water analyses re-ports and revealed that the control is in accor-dance to the desired congruent phosphate treatment control.
• In consideration to the above, Na/PO4 ratio was strictly controlled around 2.6 as recommended by Kellogg.
• Revised boiler water limits in 2001: pH PO4 Na:PO4 9.3-9.6 3-6 ~2.
Similarly There were 8 trippings in 2004 Pre-Failure Events of Shut Downs in 2004 1. Failure on 23rd February 04 (Bundle A):
During Plant Annual Turnaround in Jan-Feb 2004, new retubed Bundle A was installed. Overhauling of the governor of syn gas com-pressor turbines 103-JTs was carried out by M/S Siemen’s Vendor Service Man. Plant was started and 101-C was taken into service on 17th February. .Vendor Service Man per-formed calibration of 103JTs governor which produced pressure variations in high pressure steam circuit. Plant remained at low load due to new Prill Tower commissioning activities. It was noted that the governor was not respond-ing for high speed at high front end load. On 23rd February. Vendor Service Man again checked/calibrated the governor. The same day, 101-C failed when plant front-end load was 93%.
2. Failure on 7th March 04 (Bundle B): After failure of Bundle A, standby Bundle B was in-stalled and taken into service on 25th February. 103JTs governor was not properly responding so Vendor Service Man was again invited. As instructed by Vendor Service Man, syn gas compressor was stopped on 5th March for checking turbine governor control system. Compressor was restarted on the same day and stopped again on 6th March for checking gov-
ernor control oil system. Compressor was again started and stopped as instructed by Vendor Service Man and then restarted. Bundle B failed on 7th March when plant front end load was 95%.
3. Failure on 6th July 04 (Bundle A): Bundle A was installed and was taken into service on 10th March. Plant load was gradually increased to 101%. On 6th July, high vibration with ab-normal sound in 103-BJT appeared. As one Re-former tube leakage was also suspected so the Plant was emergency shutdown. During shut-down, leakage in 101-C was detected.
4. Failure on 15th July o4 (Bundle B): Bundle B was installed and taken into service on 10th July. On 13th July, The plant faced an emer-gency at 86% front end load when MICe-32 (1500 Psig steam letdown valve) opened itself and 575 Psig PSV operated. During this emer-gency, 1350 Psig steam pressure suddenly dropped to about 900 Psig. On 15th July at 0615 hrs, above incident again occurred and 101-C failed at 0930 hrs at 97% front end load.
5. Failure on 20th July o4 (Bundle A): Bundle A was installed and 1” drain was provided on north riser piping at about 12 feet above the riser nozzle at 101-C. It was intended to estab-lish flow in north riser as well. The plant was started on 18th July. During startup, drain was partially opened that established proper flow in north riser but unfortunately this resulted in re-duced flow in south riser. On 19th July electric power failure caused total Plant shutdown. The plant was restarted. Proper flow in north riser was observed although the bleeder was not opened. However negligible flow was observed in south riser. On 20th July, the 101-C failed when plant front end load was just 77%.
6. Failure on 18th August (Bundle B): Bundle B
was installed and was taken into service on 23rd July. Plant load was gradually increased to 96.3 % load. It failed on 18th August. No pre-failure abnormality was observed.
7. Failure on 16th October (Bundle A): Bundle
A was installed and taken into service on 21st August. Plant load was increased gradually in steps to 93.7%. The plant operated smoothly and 101-C failed on 16th October. In this inci-
dent dark-grey deposit was found in two not-failed tubes. Deposit sample was sent to M/S Nalco for investigation. The deposit analysis report as received from M/S Nalco was sent to M/S KBR. Please note that in first 6 failures, no deposit was observed in the failed as well as not-failed tubes.
8. Failure on 23rd October (Bundle B): Bundle
B was installed and taken into service on 20 October. Plant load was increased gradually in steps to 80.5%. The plant operated smoothly till 101-C failed on 23rd October.
Kellogg’s 1997 Study on 101-C Kellogg was asked to study the causes of failures
and briefed below. 1. Dawood Hercules provided to Kellogg
a. 2 samples of tubes failed on 02-12-1991(Burst tube) and 16-11-1995 (Perforated tube)
b. Water samples c. boiler water analytical reports and water
chemistry limits d. Operating process conditions.
2. Kellogg provided tube samples to Lloyd’s 3. Lloyd’s report concluded
1. Burst tube: Severe overheating leading to a short term creep failure. The cause of the over-heating could not be determined, however, tube bursts are normally attributed to reduced water flow or blockage.
2. Perforated tube: a) It is possible that the failure is due to
low pH of boiler water. b) Corrosion caused metal loss which
had penetrated the tube walls c) 2 layers scale on inner surface was ob-
served. Inner layer, 0.02 mm thick, was of iron oxide whereas outer layer showed, in addition to iron oxide, ele-ments associated with water chemistry.
Kellogg’s Comments and Recommendations (report
dated 13-09-1997)
1. To avoid debris reaching the tubes, plug the drain notches in the internal stand pipe of down-comer.
2. Install mud strainer in down-comer. 3. pH/phosphate relationship used by Dawood
Hercules, Na:PO4 ratio of 2.2, is below the normally accepted Kellogg’s practice of using Na:PO4 ratio of 2.6.
4. Kellogg recommended Dawood Hercules to modify their existing water specifications inline with Kellogg’s specifications. (pH= 9.5~9.8, PO4= 5~10 ppm)
5. The highest heat flux is calculated to be 134,000 BTU/ft2Hr that is not considered ex-cessive as new boilers are now designed for a maximum flux of 140,000 BTU/ft2Hr.
6. To allow the Ammonia Plant to be further up-graded, above 130%, it is necessary to fit new boiler
7. Two options for new 101-C: a. Floating head unit very similar to the type being installed on modern plants. b. Similar to existing design with more tubes and larger shell diameter
Drain notches of 101-C down-comer were plugged.
1. As per Kellogg’s advice in 1998, Nalco was consulted for having expert opinion on water chemistry and control.
2. Comparison of Dawood Hercules water specifications with recommendations of Kel-logg and Nalco : pH PO4 Na:PO4
Dawood Hercules 8.7-9.2 2-10 2.2-2.4 Kellogg 9.5-9.8 5-10 ~2.6 Nalco 9.2-9.8 6-10 2.3-2.6
Total No. of analyses from 1998 to date = 90 No. of Analyses below Na:PO4 of 2.3 = 68 Percentage = 76%
Waste Heat Boiler Review By KBR M/S Kellogg Brown & Roots (KBR) were also asked for rectification of the fault. 1. Provided to Kellogg Brown & Roots (KBR):
a) Process data: Existing and new revamp b) Failure history & brief detail of 101-C tube
failures since 1971 c) Detail of deposits found once in 2001 & once
in 2004
d) Boiler water specifications e) Laboratory analysis reports for the following
periods i. 01 May 2004 – 23 June 2004
ii. 21 August 2004 – 16 October 2004 f) Isometrics (Down-comer and Risers) g) Mechanical drawings (101F & 101-C)
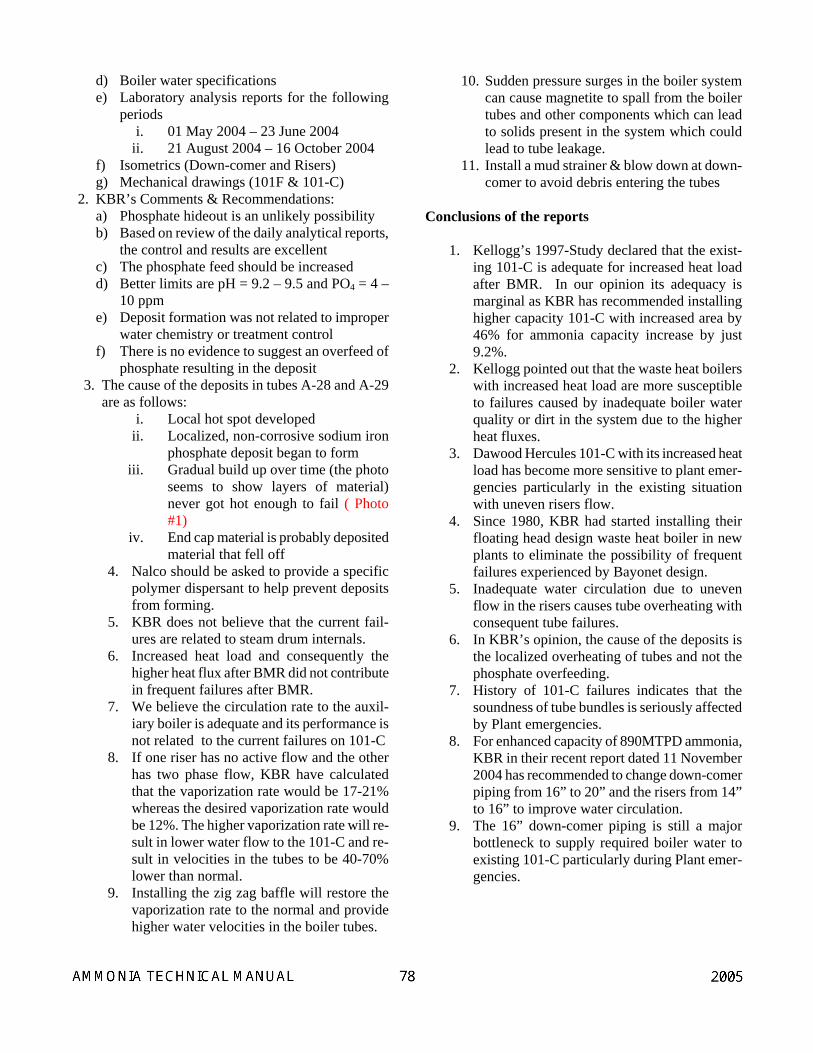
2. KBR’s Comments & Recommendations: a) Phosphate hideout is an unlikely possibility b) Based on review of the daily analytical reports,
the control and results are excellent c) The phosphate feed should be increased d) Better limits are pH = 9.2 – 9.5 and PO4 = 4 –
10 ppm e) Deposit formation was not related to improper
water chemistry or treatment control f) There is no evidence to suggest an overfeed of
phosphate resulting in the deposit 3. The cause of the deposits in tubes A-28 and A-29
are as follows: i. Local hot spot developed
ii. Localized, non-corrosive sodium iron phosphate deposit began to form
iii. Gradual build up over time (the photo seems to show layers of material) never got hot enough to fail ( Photo #1)
iv. End cap material is probably deposited material that fell off
4. Nalco should be asked to provide a specific polymer dispersant to help prevent deposits from forming.
5. KBR does not believe that the current fail-ures are related to steam drum internals.
6. Increased heat load and consequently the higher heat flux after BMR did not contribute in frequent failures after BMR.
7. We believe the circulation rate to the auxil-iary boiler is adequate and its performance is not related to the current failures on 101-C
8. If one riser has no active flow and the other has two phase flow, KBR have calculated that the vaporization rate would be 17-21% whereas the desired vaporization rate would be 12%. The higher vaporization rate will re-sult in lower water flow to the 101-C and re-sult in velocities in the tubes to be 40-70% lower than normal.
9. Installing the zig zag baffle will restore the vaporization rate to the normal and provide higher water velocities in the boiler tubes.
10. Sudden pressure surges in the boiler system can cause magnetite to spall from the boiler tubes and other components which can lead to solids present in the system which could lead to tube leakage.
11. Install a mud strainer & blow down at down-comer to avoid debris entering the tubes
Conclusions of the reports
1. Kellogg’s 1997-Study declared that the exist-
ing 101-C is adequate for increased heat load after BMR. In our opinion its adequacy is marginal as KBR has recommended installing higher capacity 101-C with increased area by 46% for ammonia capacity increase by just 9.2%.
2. Kellogg pointed out that the waste heat boilers with increased heat load are more susceptible to failures caused by inadequate boiler water quality or dirt in the system due to the higher heat fluxes.
3. Dawood Hercules 101-C with its increased heat load has become more sensitive to plant emer-gencies particularly in the existing situation with uneven risers flow.
4. Since 1980, KBR had started installing their floating head design waste heat boiler in new plants to eliminate the possibility of frequent failures experienced by Bayonet design.
5. Inadequate water circulation due to uneven flow in the risers causes tube overheating with consequent tube failures.
6. In KBR’s opinion, the cause of the deposits is the localized overheating of tubes and not the phosphate overfeeding.
7. History of 101-C failures indicates that the soundness of tube bundles is seriously affected by Plant emergencies.
8. For enhanced capacity of 890MTPD ammonia, KBR in their recent report dated 11 November 2004 has recommended to change down-comer piping from 16” to 20” and the risers from 14” to 16” to improve water circulation.
9. The 16” down-comer piping is still a major bottleneck to supply required boiler water to existing 101-C particularly during Plant emer-gencies.
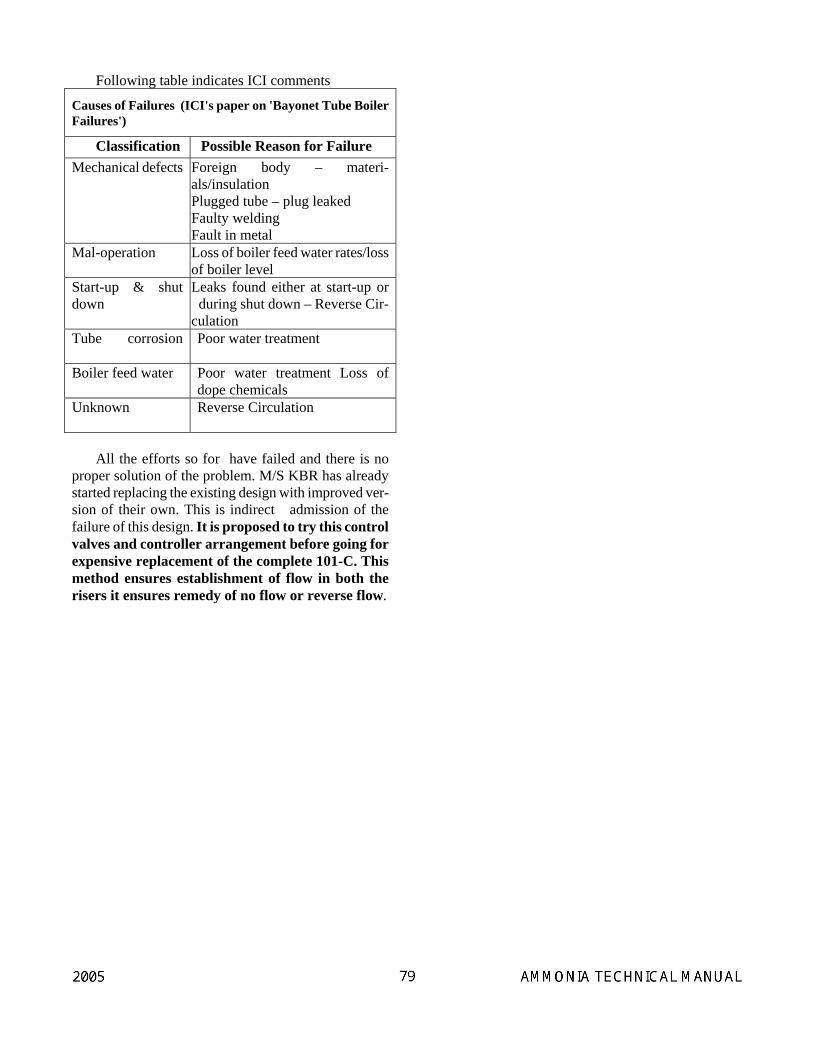
Following table indicates ICI comments
Causes of Failures (ICI's paper on 'Bayonet Tube Boiler Failures')
Classification Possible Reason for Failure Mechanical defects
Foreign body – materi-als/insulation Plugged tube – plug leaked Faulty welding Fault in metal
Mal-operation
Loss of boiler feed water rates/loss of boiler level
Start-up & shut down
Leaks found either at start-up or during shut down – Reverse Cir-culation
Tube corrosion
Poor water treatment
Boiler feed water Poor water treatment Loss of dope chemicals
Unknown
Reverse Circulation
All the efforts so for have failed and there is no
proper solution of the problem. M/S KBR has already started replacing the existing design with improved ver-sion of their own. This is indirect admission of the failure of this design. It is proposed to try this control valves and controller arrangement before going for expensive replacement of the complete 101-C. This method ensures establishment of flow in both the risers it ensures remedy of no flow or reverse flow.
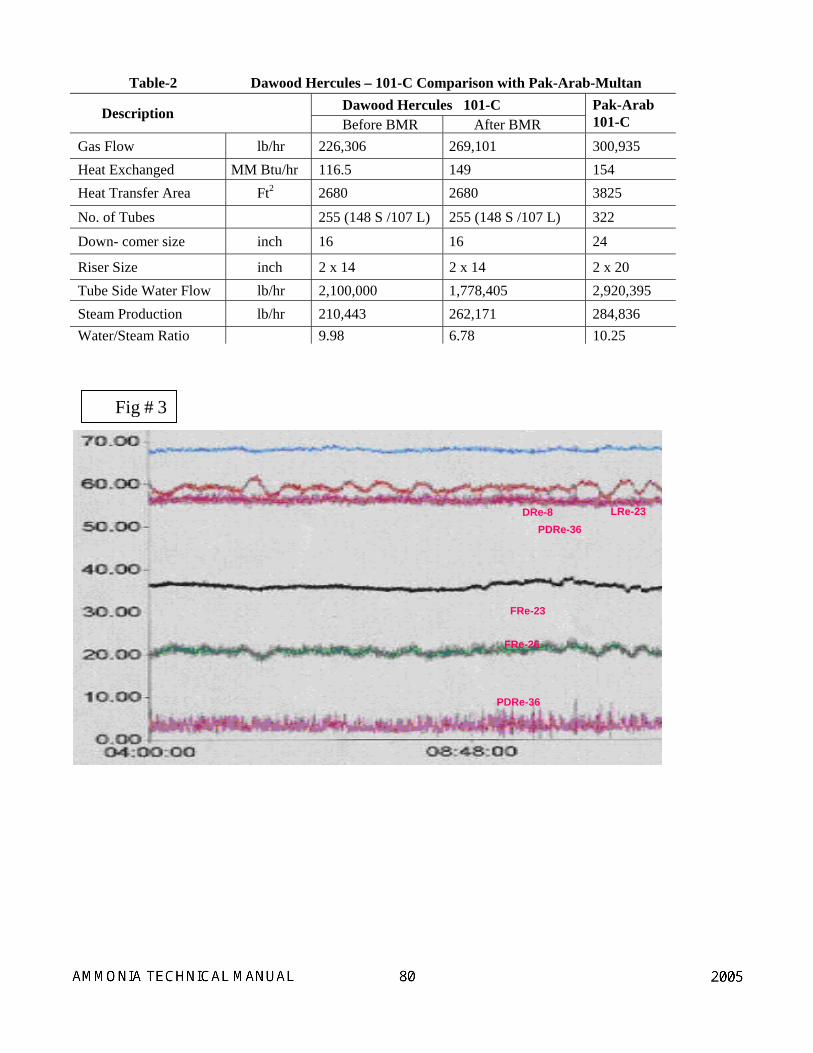
Table-2 Dawood Hercules – 101-C Comparison with Pak-Arab-Multan Dawood Hercules 101-C Description Before BMR After BMR
Pak-Arab 101-C
Gas Flow lb/hr 226,306 269,101 300,935 Heat Exchanged MM Btu/hr 116.5 149 154 Heat Transfer Area Ft2 2680 2680 3825
No. of Tubes 255 (148 S /107 L) 255 (148 S /107 L) 322
Down- comer size inch 16 16 24
Riser Size inch 2 x 14 2 x 14 2 x 20 Tube Side Water Flow lb/hr 2,100,000 1,778,405 2,920,395 Steam Production lb/hr 210,443 262,171 284,836 Water/Steam Ratio 9.98 6.78 10.25
Fig # 3
PDRe-36
PDRe-36
FRe-23
DRe-8
FRe-26
LRe-23
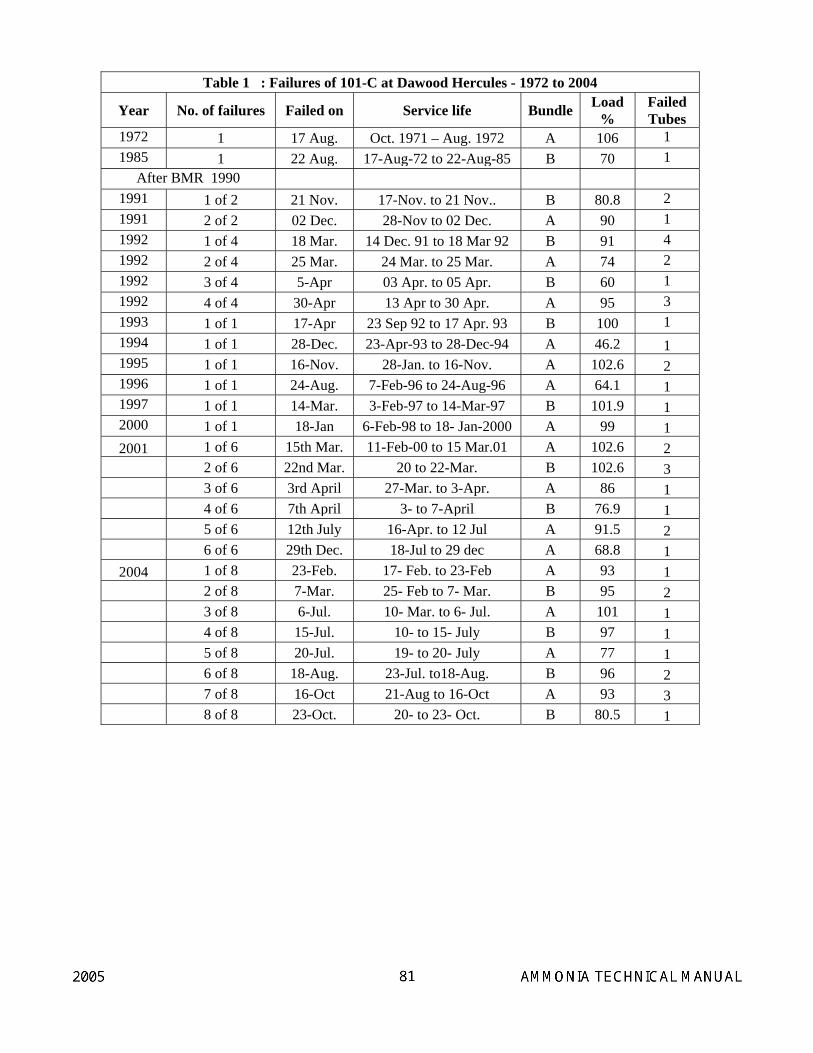
Table 1 : Failures of 101-C at Dawood Hercules - 1972 to 2004
Year No. of failures Failed on Service life Bundle Load %
Failed Tubes
1972 1 17 Aug. Oct. 1971 – Aug. 1972 A 106 1 1985 1 22 Aug. 17-Aug-72 to 22-Aug-85 B 70 1
After BMR 1990 1991 1 of 2 21 Nov. 17-Nov. to 21 Nov.. B 80.8 2 1991 2 of 2 02 Dec. 28-Nov to 02 Dec. A 90 1 1992 1 of 4 18 Mar. 14 Dec. 91 to 18 Mar 92 B 91 4 1992 2 of 4 25 Mar. 24 Mar. to 25 Mar. A 74 2 1992 3 of 4 5-Apr 03 Apr. to 05 Apr. B 60 1 1992 4 of 4 30-Apr 13 Apr to 30 Apr. A 95 3 1993 1 of 1 17-Apr 23 Sep 92 to 17 Apr. 93 B 100 1 1994 1 of 1 28-Dec. 23-Apr-93 to 28-Dec-94 A 46.2 1 1995 1 of 1 16-Nov. 28-Jan. to 16-Nov. A 102.6 2 1996 1 of 1 24-Aug. 7-Feb-96 to 24-Aug-96 A 64.1 1 1997 1 of 1 14-Mar. 3-Feb-97 to 14-Mar-97 B 101.9 1 2000 1 of 1 18-Jan 6-Feb-98 to 18- Jan-2000 A 99 1 2001 1 of 6 15th Mar. 11-Feb-00 to 15 Mar.01 A 102.6 2
2 of 6 22nd Mar. 20 to 22-Mar. B 102.6 3 3 of 6 3rd April 27-Mar. to 3-Apr. A 86 1 4 of 6 7th April 3- to 7-April B 76.9 1 5 of 6 12th July 16-Apr. to 12 Jul A 91.5 2 6 of 6 29th Dec. 18-Jul to 29 dec A 68.8 1
2004 1 of 8 23-Feb. 17- Feb. to 23-Feb A 93 1 2 of 8 7-Mar. 25- Feb to 7- Mar. B 95 2 3 of 8 6-Jul. 10- Mar. to 6- Jul. A 101 1 4 of 8 15-Jul. 10- to 15- July B 97 1 5 of 8 20-Jul. 19- to 20- July A 77 1 6 of 8 18-Aug. 23-Jul. to18-Aug. B 96 2 7 of 8 16-Oct 21-Aug to 16-Oct A 93 3 8 of 8 23-Oct. 20- to 23- Oct. B 80.5 1
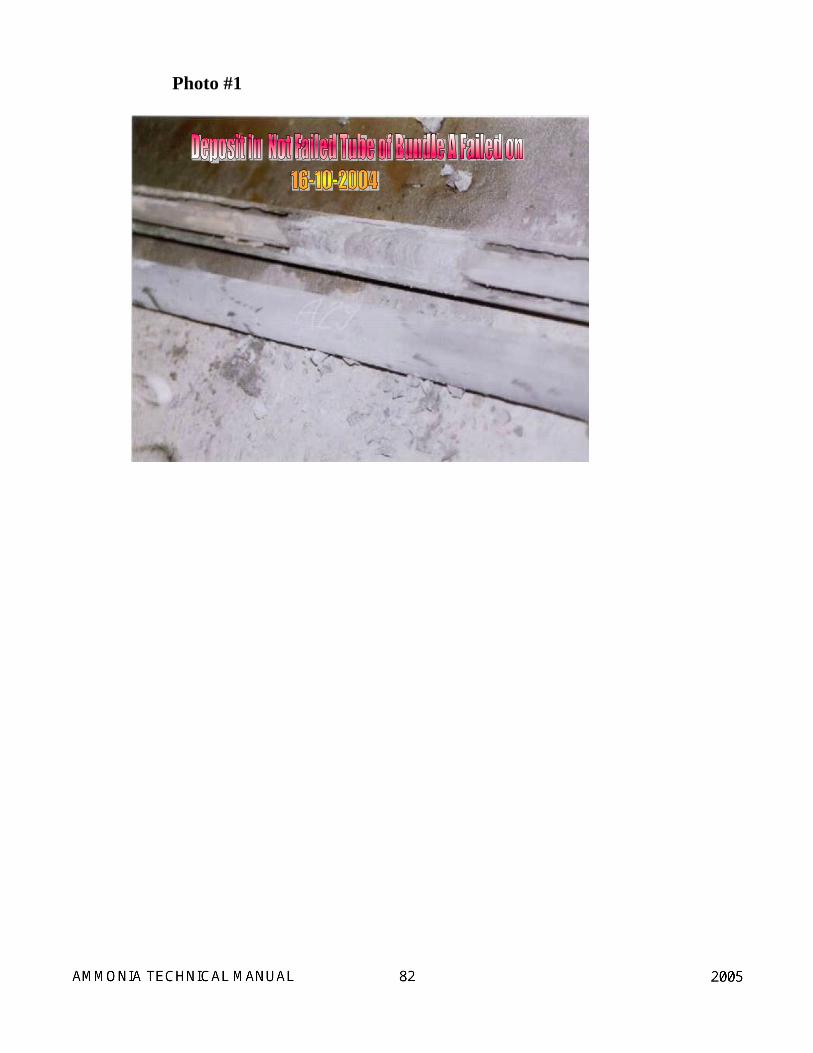
Photo #1
65
NNaattuurraall GGaass
SStteeaamm
Hydrotreater &
Desulphurizer
Primary Reformer
Secondary Reformer
Air
Waste Heat Boiler
Shift Converters
CO2 Re-moval System
Methanator
Steam Turbine
Ammonia to Urea Unit
BFW 1500# Steam
CO2 to Urea Unit
H2
Sulphur Removal
Convert 90% CH4 to H2, CO & CO2
Add N2 and convert remaining
CH4
Convert CO to CO2
Remove CO2 from gases
Convert traces of CO & CO2 to CH4
Convert H2 & N2, to NH3
Separate & liquefy NH3
from uncon-verted gases
1500 0F
1800 0F
635 0F 440 psig
To Utility Unit
650 0F 540
PSIG
900 0F1800 PSIG
-28 0F
To Urea Unit
575# Steam
Ammonia Separation
& Refrigeration
Ammonia Converter
Syn. Gas Compressor
101-F
LH
DRe 8
DRe-8PDRe-36
PDRe36
GAS IN
GAS OUT
STEAM OUT
RANGE = 0 - 7 PSIGRANGE = 0 - 20 PSIG
LDA - 4LOW DENSITY ALARM
SET AT 25 %
SOU
TH R
ISE
R
NO
RTH
RIS
ER
DO
WN
-CO
ME
R
PDRe-36 ROSEMOUNT 1151-DP5DRe-8 FISHER & PORTER 10B2496
46 F
T
101- C INSTRUMENTATION Fig-1E & IPDRe - 36 / DRe – 8 Kelloggdh C:\101-C\VisioDocument
101 C
62 F
T
3 FT
RECORDER
A
B
C D7 FT
4 FT
MICe33
For Cold Shot
WATER IN
dia
16"
dia
14"
dia
14"
MF HL MF
PRCe-18
TI-3-32
LRCe-23
Readings on 19 April 2001PRCe-18 = 1334 psigTI-3-32 = 580 deg FDRe-8=83 %=5.81 psidPdRe-36=48 %=9.6 psid (N)PdRe-36= 43 %=8.6 psid(S)LRCe-23= 60%
1708 deg F400 psig
688 deg F
580 deg F , 1334 psig
Ch
ange
ove
r V
alve
s
101-F
LH
DRe 8
GAS IN
GAS OUT
STEAM OUT
RANGE = 0 - 10 PSIG
LDA -4
LOW
DEN
SITY ALARMSE
T AT 25 %
SOU
TH S
IDE
RIS
ER
NO
RTH
SID
E R
ISER
DO
WN
CO
ME
R
46 F
T
101- C INSTRUMENTATION Fig-2E & IPDRe-36(N,S)& DRe-8 Dre-9(N,S)dh C:\101-CVisioDocument
101
C
62 F
T
3 FTA
B
C D7 FT
4 FT
MICe33
For Cold Shot
WATER IN
dia
16"
dia
14"
dia
14"
PDRe36-S
PRCe18
TI-3-32
LRe-23
RANGE = 0 - 7 PSIG
1727 deg F
667 deg F
FRCe23
161ftElevation
EF
H L
DRe9-S
RANGE = 0 - 20 PSIGHL
L HDRe-8: A - BDRe-9 North E - CDRe-9 South: F - DPDRe-36 North: E - APDRe-36 South: F - A
DRe9-N
RANGE = 0 - 7 PSIGH L
PDRe36-N
RANGE = 0 - 20 PSIGHL
North Riser length
South Riser length
Newdrain
Newdrain
CV-b CV-a
5800F , 1334 psig
controller