phenotyping intake rate in dairy goats, a repeatable...
TRANSCRIPT

.01 S. Giger-Reverdin et al.
04 / 10 / 2017 S. Giger-Reverdin
Phenotyping intake rate in dairy goats, a repeatable trait which can be measured automatically
Sylvie Giger-Reverdin, Christine Duvaux-Ponter & Nicolas C Friggens
Modélisation Systémique Appliquée aux Ruminants (Systemic modelling applied to ruminants)
Inra, AgroParisTech, Université Paris-Saclay, France
.02 S. Giger-Reverdin et al.
04 / 10 / 2017 S. Giger-Reverdin
Introduction
High producing animals are fed with a high proportion of concentrates
They can suffer from acidosis
Intake rate is a key-factor to explain the inter-individual variation in the evolution of rumen pH (occurrence of acidosis)

.03 S. Giger-Reverdin et al.
04 / 10 / 2017 S. Giger-Reverdin
Aim of the work: To develop repeatable, pertinent and easy to measure criteria to evaluate this trait in dairy goats
.04 S. Giger-Reverdin et al.
04 / 10 / 2017 S. Giger-Reverdin
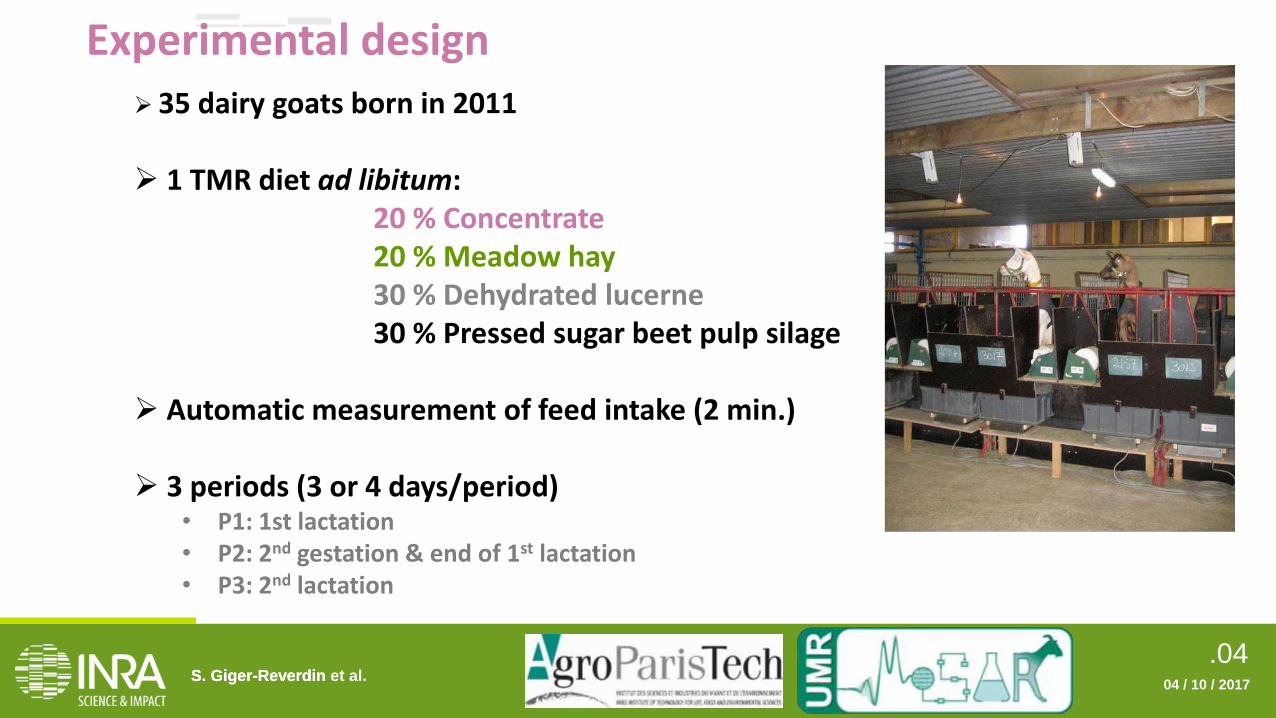
Experimental design
35 dairy goats born in 2011
1 TMR diet ad libitum: 20 % Concentrate 20 % Meadow hay 30 % Dehydrated lucerne 30 % Pressed sugar beet pulp silage
Automatic measurement of feed intake (2 min.)
3 periods (3 or 4 days/period) • P1: 1st lactation • P2: 2nd gestation & end of 1st lactation • P3: 2nd lactation
.05 S. Giger-Reverdin et al.
04 / 10 / 2017 S. Giger-Reverdin
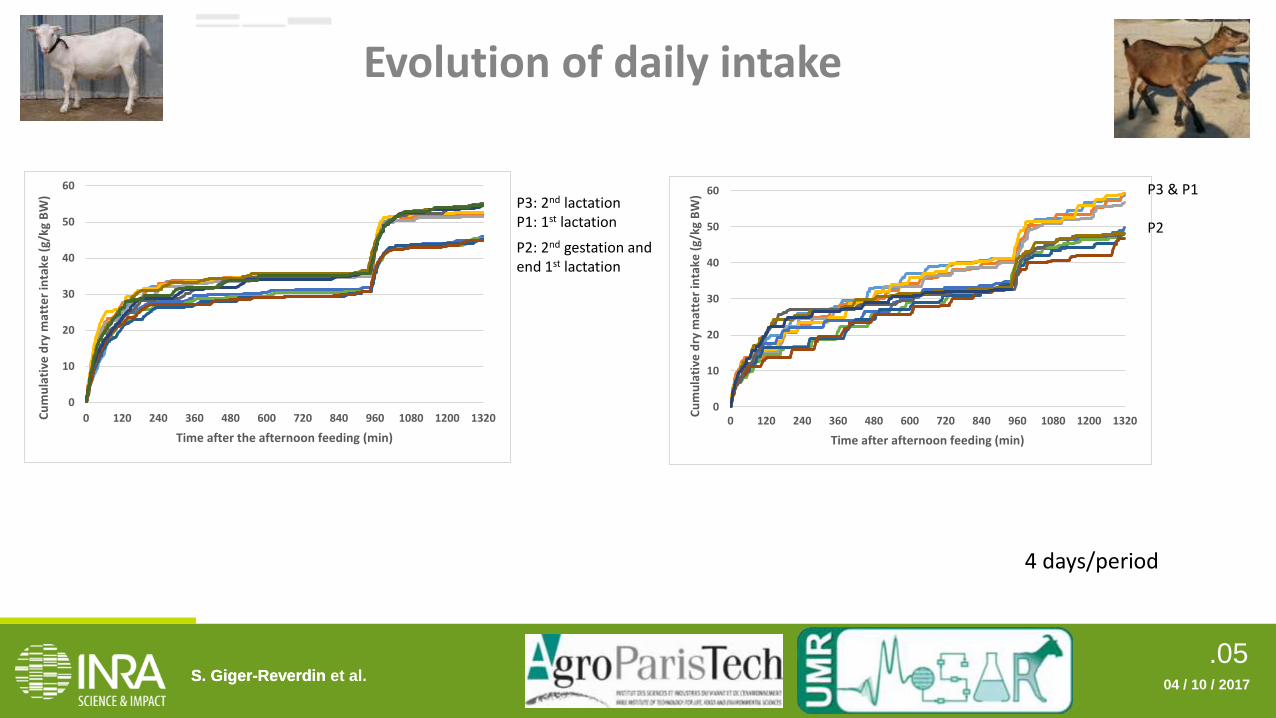
P3: 2nd lactation P1: 1st lactation
P2: 2nd gestation and end 1st lactation
4 days/period
0
10
20
30
40
50
60
0 120 240 360 480 600 720 840 960 1080 1200 1320Cu
mu
lati
ve d
ry m
atte
r in
take
(g/
kg B
W)
Time after the afternoon feeding (min)
Evolution of daily intake
0
10
20
30
40
50
60
0 120 240 360 480 600 720 840 960 1080 1200 1320
Cu
mu
lati
ve d
ry m
atte
r in
take
(g/
kg B
W)
Time after afternoon feeding (min)
P3 & P1 P2

Proportions of feed eaten post afternoon feeding
0.00
0.10
0.20
0.30
0.40
0.50
0.60
0.70
0.80
0.90
1.00
0 120 240 360 480 600 720 840
Time after the afternoon feeding (min)
0.00
0.10
0.20
0.30
0.40
0.50
0.60
0.70
0.80
0.90
1.00
0 120 240 360 480 600 720 840
Time after the afternoon feeding (min)
.07 S. Giger-Reverdin et al.
04 / 10 / 2017 S. Giger-Reverdin
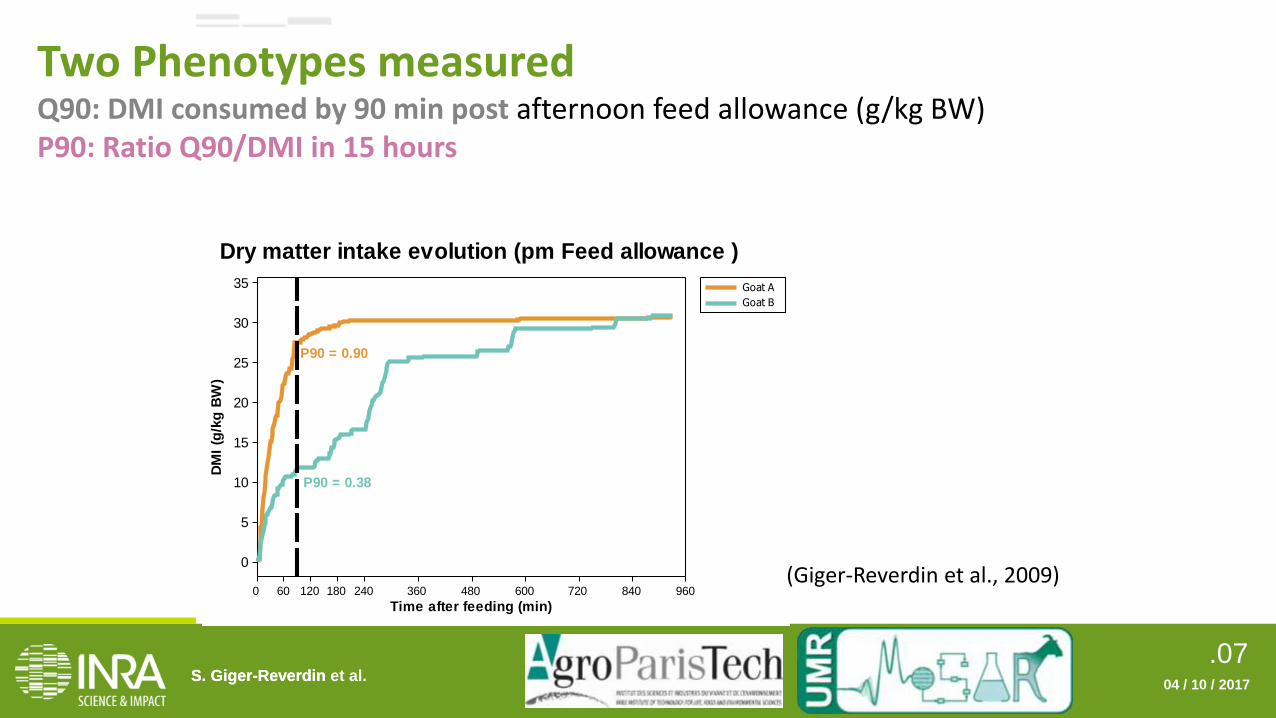
Two Phenotypes measured Q90: DMI consumed by 90 min post afternoon feed allowance (g/kg BW) P90: Ratio Q90/DMI in 15 hours
960840720600480360240180120600
35
30
25
20
15
10
5
0
Time after feeding (min)
DM
I (g
/kg
BW
)
Goat A
Goat B
Dry matter intake evolution (pm Feed allowance )
P90 = 0.90
P90 = 0.38
(Giger-Reverdin et al., 2009)

.08 S. Giger-Reverdin et al.
04 / 10 / 2017 S. Giger-Reverdin
Factors of variation of the phenotypes: Evolution between periods and between-goat variability
All Periods P1 (1st Lactation)
P2 (2nd gestation)
P3 (2nd lactation)
N observations 105 35 35 35
Q90 (g/kg BW) 16.1 ± 3.63 14.6a ± 3.36 14.8a ± 2.83 18.8b ± 3.03
P90 0.499 ± 0.1115 0.416a ± 0.1055 0.524b ± 0.0972 0.556b ± 0.0796
Increase in Q90 at P3 Increase in P90 as goats are getting older Significant between animals variability

.09 S. Giger-Reverdin et al.
04 / 10 / 2017 S. Giger-Reverdin
Factors of variation of the phenotypes: Across animals, average repeatability (standard deviation/goat/period)
All Periods P1 (1st Lactation)
P2 (2nd gestation)
P3 (2nd lactation)
N observations 105 35 35 35
Q90 (g/kg BW) 1.56 ± 0.896 2.05a 1.33b 1.29b
P90 0.0422 ± 0.02321 0.0520a 0.0406a,b 0.0343b
Q90 and P90 are more repeatable for each goat within a period as goats are getting older No goat effect

.010 S. Giger-Reverdin et al.
Across animals, average repeatability
04 / 10 / 2017 S. Giger-Reverdin
20
15
10
201510
25
20
15
201510
Q90_1
Q90_2
Q90_3
11044
11048
11055
11056
11062
11064
11066
11069
11070
11071
11009
11072
11073
11074
11079
11084
11090
11092
11093
11096
11097
11014
11100
11107
11109
11110
11111
11112
11015
11016
11024
11025
11035
11036
11040
Goat
Between-periods correlation for Q90
0.61**
0.42*0.28
0.60
0.45
0.30
0.60.40.2
0.7
0.6
0.5
0.600.450.30
P90_1
P90_2
P90_3
11044
11048
11055
11056
11062
11064
11066
11069
11070
11071
11009
11072
11073
11074
11079
11084
11090
11092
11093
11096
11097
11014
11100
11107
11109
11110
11111
11112
11015
11016
11024
11025
11035
11036
11040
Goat
Between periods correlation for P90
0.54**
0.63** 0.38*
P90 is more repeatable than Q90 P90 is a characteristic of the feeding behaviour of the goat

.011 S. Giger-Reverdin et al.
04 / 10 / 2017 SGR & CDP/ CASDAR AcID
Conclusion and practical implications
High intra-period individual repeatability High between-period repeatability
Characterisation of the feeding behaviour during the 1st lactation Adjustment of feeding in the following lactations to decrease the
occurrence of acidosis
Possibility to phenotype goats on intake rate in precision livestock farming

.012 S. Giger-Reverdin et al.
04 / 10 / 2017 S. Giger-Reverdin
Thank you for your attention