permeability of hot mix asphalt concrete as affected by
TRANSCRIPT

Graduate Theses, Dissertations, and Problem Reports
2010
Permeability of hot mix asphalt concrete as affected by binder Permeability of hot mix asphalt concrete as affected by binder
content content
Joseph A. Giompalo West Virginia University
Follow this and additional works at: https://researchrepository.wvu.edu/etd
Recommended Citation Recommended Citation Giompalo, Joseph A., "Permeability of hot mix asphalt concrete as affected by binder content" (2010). Graduate Theses, Dissertations, and Problem Reports. 2098. https://researchrepository.wvu.edu/etd/2098
This Thesis is protected by copyright and/or related rights. It has been brought to you by the The Research Repository @ WVU with permission from the rights-holder(s). You are free to use this Thesis in any way that is permitted by the copyright and related rights legislation that applies to your use. For other uses you must obtain permission from the rights-holder(s) directly, unless additional rights are indicated by a Creative Commons license in the record and/ or on the work itself. This Thesis has been accepted for inclusion in WVU Graduate Theses, Dissertations, and Problem Reports collection by an authorized administrator of The Research Repository @ WVU. For more information, please contact [email protected].
Permeability of Hot Mix Asphalt Concrete as Affected by Binder Content
Joseph A. Giompalo
Thesis submitted to the College of Engineering and Mineral Resources at West Virginia
University in partial fulfillment of the requirements for the degree of
Master of Science
In
Civil Engineering
John P. Zaniewski, Ph.D., Chair
Darrell R. Dean, Ph.D.
Indrajit Ray, Ph.D.
Department of Civil Engineering
Morgantown, West Virginia
2010
Keywords: Asphalt Pavements, Permeability, Porosity, Air Voids, Binder Content,
Density

ABSTRACT
Permeability of Hot Mix Asphalt Concrete as Affected by Binder
Content
Joseph A. Giompalo
One of the primary objectives when constructing hot mix asphalt concrete
(HMAC) is achieving the target density in order for the pavement to be impermeable. If
the density is too low, water infiltration causes pavement damage from freeze-thaw and
other effects caused by the presence of water. If the pavement density is too high,
rutting, flushing, and shoving will occur.
This research used the Florida Method of Test for Measurement of Water
Permeability of Compacted Asphalt Paving Mixtures to examine how permeability is
affected by binder content and compaction level. Asphalt samples containing 5.2, 5.7,
6.2, and 6.7 percent binder at air void levels of 4, 6, 8, and 10 percent were tested in a
Florida Department of Transportation (FDOT) style permeameter. Gyratory and indirect
tension (IDT) strength test data were also used to evaluate the effect binder has on
compaction and rutting resistance.
This research suggests several changes to West Virginia’s construction
specifications, including permeability testing as part of the mix design process. Changing
the maximum air void specifications from 8 to 7 percent is suggested to reduce the
possibility of the construction of permeable pavements to reach the threshold where
permeability drastically increases. Recommendations are also made for further research.

iii
ACKNOWLEDGMENTS
I would like to express my sincere gratitude to Dr. John Zaniewski, my advisor,
for his guidance, support, and encouragement during the pursuit of my Master of Science
in Civil Engineering degree. Dr. Zaniewski’s insight and advice was particularly helpful
during my research. I would like to thank Dr. Darrell Dean and Dr. Indrajit Ray for their
time and willingness to serve on my committee.
I would also like to thank Armando Orobio for his guidance in the asphalt
laboratory and support throughout graduate school. Most of all, I would like to thank my
parents, Joe and Peggy Giompalo, for their love, confidence, encouragement, and support
throughout graduate school. You have helped me build the foundation of my life and I
cannot thank you enough for everything you have done.
iv
TABLE OF CONTENTS
Abstract ............................................................................................................................... ii
Acknowledgments.............................................................................................................. iii
Chapter 1: Introduction .......................................................................................................1
1.1 Background ....................................................................................................................1
1.2 Problem Statement .........................................................................................................2
1.3 Objective ........................................................................................................................2
1.4 Scope and Limitations....................................................................................................2
1.5 Thesis Organization .......................................................................................................3
Chapter 2: Literature Review ..............................................................................................4
2.1 Introduction ....................................................................................................................4
2.2 Porosity ..........................................................................................................................4
2.3 Permeability ...................................................................................................................5
2.4 Factors Affecting Permeability of Pavements ...............................................................5
2.4.1 Air voids......................................................................................................... 6
2.4.2 Nominal Maximum Aggregate Size (NMAS) ............................................... 6
2.4.3 Gradation of aggregates ................................................................................. 7
2.4.4 Lift thickness .................................................................................................. 8
2.4.5 Compaction .................................................................................................... 9
2.5 Constant Head Test ........................................................................................................9
2.6 Falling Head Test .........................................................................................................11
2.7 Florida Permeability Method .......................................................................................12
2.8 Indirect Tension Test ...................................................................................................18
2.8.1 IDT Test procedure ...................................................................................... 18

v
2.9 Case Studies .................................................................................................................19
2.9.1 Pennsylvania ................................................................................................ 19
2.9.2 Louisiana ...................................................................................................... 23
2.9.3 Kansas .......................................................................................................... 26
2.10 Summary of Literature ...............................................................................................27
Chapter 3: Research Methodology....................................................................................29
3.1 Introduction ..................................................................................................................29
3.2 Sample Preparation ......................................................................................................29
3.3 Permeability Procedure ................................................................................................32
3.4 Indirect Tension Test Procedure ..................................................................................35
3.5 Method of Analysis ......................................................................................................36
Chapter 4: Results and Analysis .......................................................................................38
4.1 Introduction ..................................................................................................................38
4.2 Compaction Results .....................................................................................................38
4.3 Permeability Results ....................................................................................................42
4.4 Indirect Tension Test Results.......................................................................................47
Chapter 5: Conclusions and Recommendations ...............................................................52
5.1 Conclusions ..................................................................................................................52
5.2 Recommendations ........................................................................................................52
References ..........................................................................................................................54

vi
LIST OF FIGURES
Figure 2.1: Permeability vs. Air Voids for 9.5mm Coarse Mix .........................................6
Figure 2.2: Effects of NMAS on Permeability ...................................................................7
Figure 2.3: Coarse and Fine Graded Gradations .................................................................8
Figure 2.4: Permeability vs. Lift Thickness to NMAS .......................................................9
Figure 2.5: Constant Head Permeameter ..........................................................................10
Figure 2.6: Falling Head Permeameter .............................................................................11
Figure 2.7: Water Permeability Testing Apparatus (Not to Scale) ...................................14
Figure 2.8: Field and Laboratory Permeability Values at 7% VTM .................................27
Figure 3.1: Combined Gradation Used During Research ..................................................31
Figure 3.2: HMAC Permeameter Used During Research .................................................32
Figure 3.3: Asphalt Sample Coated with Petroleum Jelly ................................................33
Figure 3.4: Asphalt Sample Placed on Lower Pedestal Plate ...........................................33
Figure 3.5: Sealing Tube Placed Over Asphalt Sample ....................................................34
Figure 3.6: Clamp Assemblies Placed on Graduated Cylinder Plate................................34
Figure 3.7: Asphalt Sample in Oven at 61°C ....................................................................35
Figure 3.8: Asphalt Sample Placed in IDT Testing Apparatus .........................................36
Figure 3.9: Failure of Asphalt Sample ..............................................................................36
Figure 4.1: Gyrations at 5.2 Percent Binder .....................................................................39
Figure 4.2: Gyrations at 5.7 Percent Binder .....................................................................40
Figure 4.3: Gyrations at 6.2 Percent Binder .....................................................................40
Figure 4.4: Gyrations at 6.7 Percent Binder .....................................................................41
Figure 4.5: Summary of Average Gyrations .....................................................................41
Figure 4.6: Permeability at 5.2 Percent Binder .................................................................43

vii
Figure 4.7: Permeability at 5.7 Percent Binder .................................................................44
Figure 4.8: Permeability at 6.2 Percent Binder .................................................................44
Figure 4.9: Permeability at 6.7 Percent Binder .................................................................45
Figure 4.10: Summary of Average Permeability Values ..................................................45
Figure 4.11: Permeability Statistical Analysis Results .....................................................46
Figure 4.12: Estimated Maximum Allowable Traffic at 5.2 Percent Binder ....................48
Figure 4.13: Estimated Maximum Allowable Traffic at 5.7 Percent Binder ....................49
Figure 4.14: Estimated Maximum Allowable Traffic at 6.2 Percent Binder ....................49
Figure 4.15: Estimated Maximum Allowable Traffic at 6.7 Percent Binder ....................50
Figure 4.16: Summary of Average Estimated Maximum Allowable Traffic ...................50
Figure 4.17: IDT Statistical Analysis Results ...................................................................51

viii
LIST OF TABLES
Table 2.1: Temperature Correction for Viscosity of Water, Celsius ................................17
Table 2.2: Visual Observations of Holes at MP 217.65 in Westbound Slow Lane ..........21
Table 2.3: Visual Observations of Holes at MP 212.90 in Westbound Slow Lane ..........21
Table 2.4: Density, Moisture, and Saturation Data, MP 217.65 Westbound Slow Lane .22
Table 2.5: Density, Moisture, and Saturation Data, MP 212.90 Westbound Slow Lane .22
Table 2.6: Selection of Model Parameters ........................................................................26
Table 3.1: Mixture Composition (Gradation) ...................................................................30
Table 3.2: Job Mix Formula Values .................................................................................30
Table 4.1: Gyrations for All Asphalt Samples ..................................................................39
Table 4.2: Permeability Results for All Asphalt Samples ................................................43
Table 4.3: Estimated Maximum Allowable Traffic for All Asphalt Samples ..................48
1
CHAPTER 1: INTRODUCTION
1.1 BACKGROUND
One of the primary objectives when constructing hot mix asphalt concrete
(HMAC) pavements is achieving the target density in order for the pavement to be
impermeable. If the density is too low, water infiltration causes pavement damage from
freeze-thaw and other effects caused by the presence of water. If the pavement density is
too high, rutting, flushing, and shoving may occur.
There are many factors that contribute to pavement permeability. Studies have
shown that permeability is a function of percent air voids, nominal maximum aggregate
size (NMAS), aggregate gradation, lift thickness, and compaction effort.
One of the most important factors that affect permeability of asphalt is air voids;
when the percent of air voids increase, permeability also increases. When the air voids
reach approximately 8 percent, a dramatic increase in permeability is shown to occur.
When air voids remain below 7 percent, permeability does not change significantly. An
air void level of 6 percent or less was shown to be impermeable (Zube 1962, Brown et
al., 1989).
Permeability is directly related to the nominal maximum aggregate size (NMAS).
The size of the air voids increases when the size of the aggregates in a HMAC mix
increase. An increase in the size of the air voids will often cause the air voids to become
interconnected resulting in an increase in permeability (Mallick et al., 2003).
HMAC aggregate gradation also directly affects permeability. Gradations that
fall below the maximum density line (MDL) are considered to be coarse-graded and tend
to have high permeability due to interconnected voids. Gradations that are above the
maximum density line are considered fine-graded and tend to have low permeability
(Hudson et al., 1965).
The permeability of a wearing surface also depends on the lift thickness. A
thicker lift is placed to reduce the probability of interconnected voids to form, which
allows water to flow into the layers below. The heat from a thicker lift allows the

2
aggregates to orientate properly which results in an increase in pavement density and a
decrease in permeability (Russel et al., 2004, Musselman et al., 1998).
Compaction is the process in which external forces are used to reduce the volume
of air and orientate the aggregates into a denser configuration in an HMAC mixture. The
liquid asphalt aides in the compaction process by acting as a lubricant. When the amount
of air is reduced, the mixture becomes denser and permeability decreases. The chance for
rutting and other problems increases if too much compaction is used (Roberts et al.,
1996).
1.2 PROBLEM STATEMENT
Previously, there has been adequate research showing the various factors that
affect the permeability of HMAC. One factor that has not been widely addressed is how
the amount of asphalt binder in a mixture affects the permeability. When the asphalt
content in a mixture is increased, the amount of compaction required to achieve lower air
void levels is greatly reduced. If too much binder is added, then problems such as rutting
will occur. This research focused on finding the asphalt content that maintains low
permeability when compacted to a specified density while maintaining adequate rut
resistance.
1.3 OBJECTIVE
The primary objective of this research is to evaluate how binder content affects
the permeability of hot mix asphalt concrete. Also, information regarding how binder
content affects compaction and rutting resistance will be documented.
Recommendations can be formulated to change West Virginia’s specifications with this
information.
1.4 SCOPE AND LIMITATIONS
This research focused on making 9.5 mm skid surface samples that were 75mm in
height, 150 mm in diameter, and contained 4, 6, 8, and 10 percent air voids. Samples
were then made at each air void level containing 5.2, 5.7, 6.2, and 6.7 percent binder.
Gyratory data were documented and analyzed to observe how binder content affected
3
compaction effort. Two maximum bulk specific gravity (Gmb) samples were made for
each combination and were tested using the Florida Method of Test for Measurement of
Water Permeability of Compacted Asphalt Paving Mixtures. Once the coefficient of
permeability was found for each asphalt specimen, an indirect tension (IDT) test was
performed to evaluate potential rut resistance.
Aggregate for making the asphalt specimens was obtained from Greer Industries.
Only one gradation was evaluated in this research.
1.5 THESIS ORGANIZATION
Chapter 2 describes various factors that affect permeability of hot mix asphalt
concrete (HMAC). A case study performed by Auburn University of Pennsylvania
pavements in 2001 was reviewed. Two laboratory methods that test the permeability of
asphalt specimens are also reviewed. Laboratory and field permeability values are
compared from the Kansas Department of Transportation and Louisiana Transportation
Research Center (LTRC). Lastly, the Florida permeability test method that was used in
this research is reviewed.
Chapter 3 discusses the experimental plan and explains the laboratory test
procedures followed during the process of this research.
Chapter 4 presents the results and analysis of this research. Permeability values
of asphalt specimens containing 5.2, 5.7, 6.2, and 6.7 percent binder at 4, 6, 8, and 10
percent air voids are compared. The gyratory compaction characteristics of each sample
were analyzed to evaluate how binder affects compaction. The results of indirect tension
(IDT) test for each sample was analyzed to determine how binder content affects rutting.
Chapter 5 presents conclusions and recommendations for implementing this
research and for further research.
4
CHAPTER 2: LITERATURE REVIEW
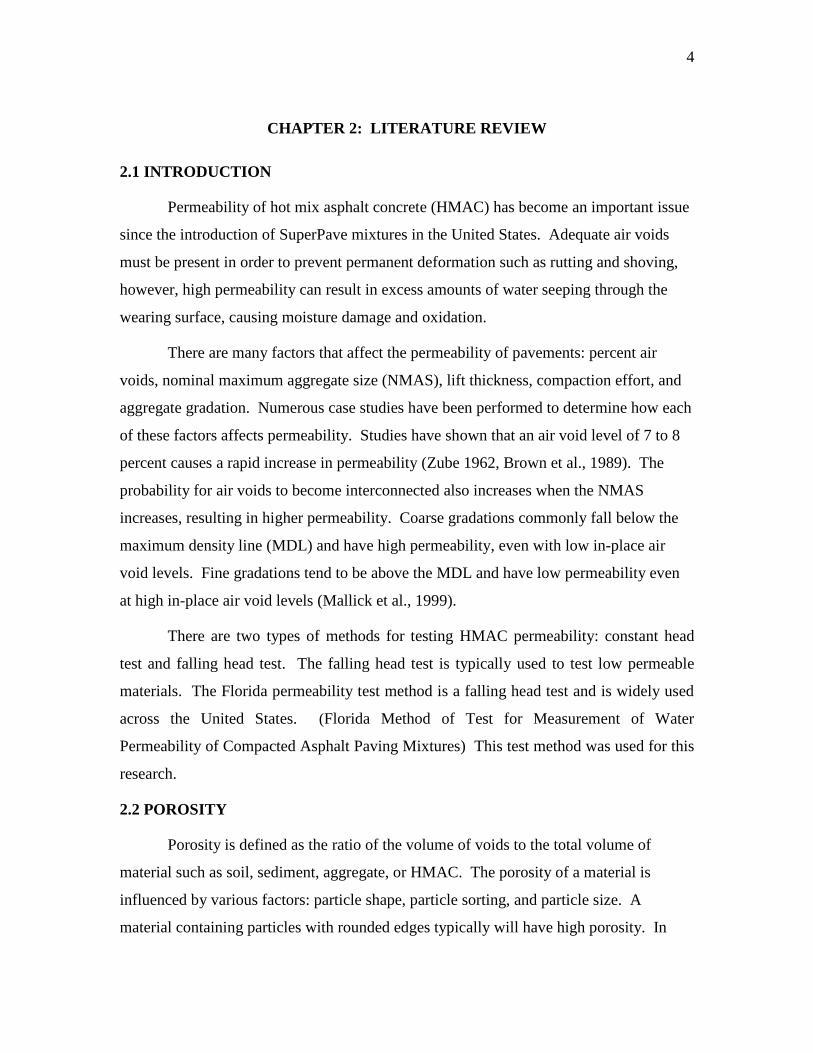
2.1 INTRODUCTION
Permeability of hot mix asphalt concrete (HMAC) has become an important issue
since the introduction of SuperPave mixtures in the United States. Adequate air voids
must be present in order to prevent permanent deformation such as rutting and shoving,
however, high permeability can result in excess amounts of water seeping through the
wearing surface, causing moisture damage and oxidation.
There are many factors that affect the permeability of pavements: percent air
voids, nominal maximum aggregate size (NMAS), lift thickness, compaction effort, and
aggregate gradation. Numerous case studies have been performed to determine how each
of these factors affects permeability. Studies have shown that an air void level of 7 to 8
percent causes a rapid increase in permeability (Zube 1962, Brown et al., 1989). The
probability for air voids to become interconnected also increases when the NMAS
increases, resulting in higher permeability. Coarse gradations commonly fall below the
maximum density line (MDL) and have high permeability, even with low in-place air
void levels. Fine gradations tend to be above the MDL and have low permeability even
at high in-place air void levels (Mallick et al., 1999).
There are two types of methods for testing HMAC permeability: constant head
test and falling head test. The falling head test is typically used to test low permeable
materials. The Florida permeability test method is a falling head test and is widely used
across the United States. (Florida Method of Test for Measurement of Water
Permeability of Compacted Asphalt Paving Mixtures) This test method was used for this
research.
2.2 POROSITY
Porosity is defined as the ratio of the volume of voids to the total volume of
material such as soil, sediment, aggregate, or HMAC. The porosity of a material is
influenced by various factors: particle shape, particle sorting, and particle size. A
material containing particles with rounded edges typically will have high porosity. In

5
contrast, a material containing particles that are angular or flat and elongated will have
lower porosity provided it can be compacted into a dense configuration. A well sorted
material with particles that are approximately the same size will have higher porosity
than a material with different sized particles. A mixture containing only large particles
will contain greater pore space than a mixture with smaller particles (Lerner et al., 2003).
2.3 PERMEABILITY
Permeability is defined as the rate of flow of a liquid or gas through a porous
material. Darcy showed that the rate of flow of water was proportional to the hydraulic
gradient of a given sample area when the fundamental theory of permeability was
established. The hydraulic gradient is defined as the head loss per unit of length. Once
water is transmitted through of porous material, the head loss will increase linearly with
the velocity of the water, as long as the flow is laminar. The relationship becomes
nonlinear and Darcy’s Law becomes invalid when the flow of water is turbulent. When
measuring permeability, two methods of testing can be used: a constant head test and a
falling head test (Cooley, 1999).
2.4 FACTORS AFFECTING PERMEABILITY OF PAVEMENTS
Ever since the adoption of the SuperPave mix design method, permeability in
HMAC pavements has been a major issue (Mallick et al., 2003). Various studies have
been conducted to identify the many factors affecting permeability within pavements.
The following is a summary of the factors affecting permeability characteristics from
research done across the United States:
Air Voids
Nominal Maximum Aggregate Size (NMAS)
Gradation of Aggregates
Lift Thickness
Compaction Effort
6
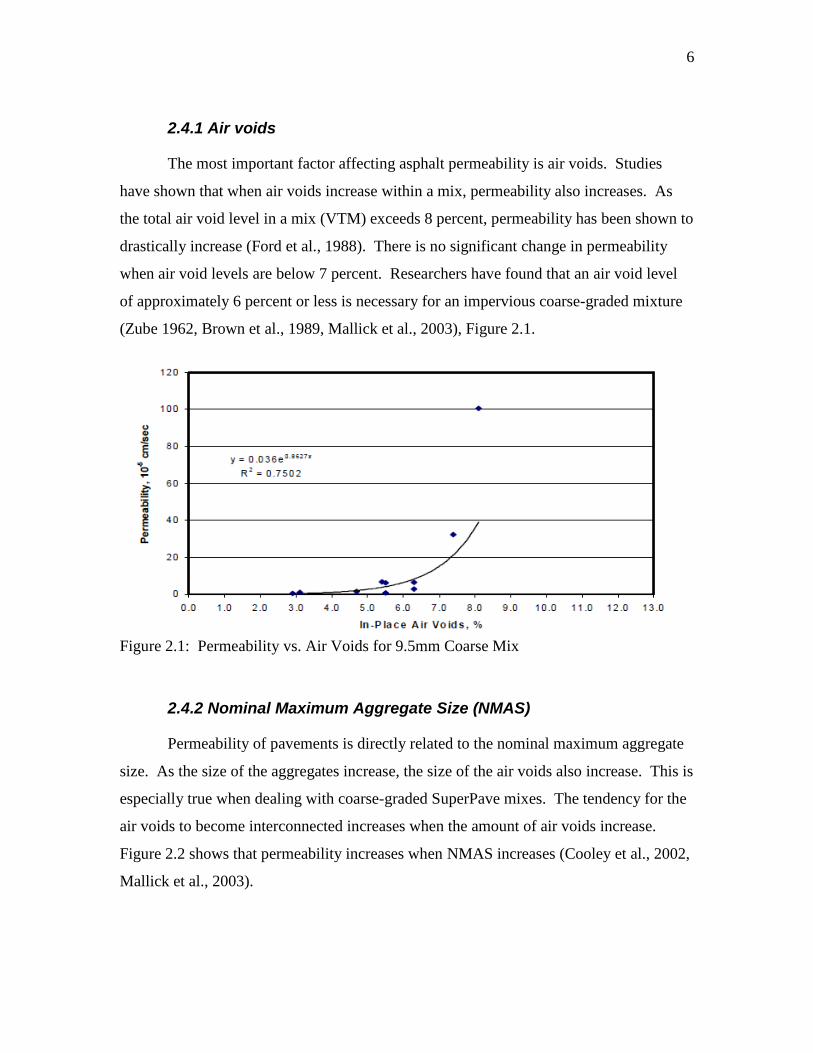
2.4.1 Air voids
The most important factor affecting asphalt permeability is air voids. Studies
have shown that when air voids increase within a mix, permeability also increases. As
the total air void level in a mix (VTM) exceeds 8 percent, permeability has been shown to
drastically increase (Ford et al., 1988). There is no significant change in permeability
when air void levels are below 7 percent. Researchers have found that an air void level
of approximately 6 percent or less is necessary for an impervious coarse-graded mixture
(Zube 1962, Brown et al., 1989, Mallick et al., 2003), Figure 2.1.
Figure 2.1: Permeability vs. Air Voids for 9.5mm Coarse Mix
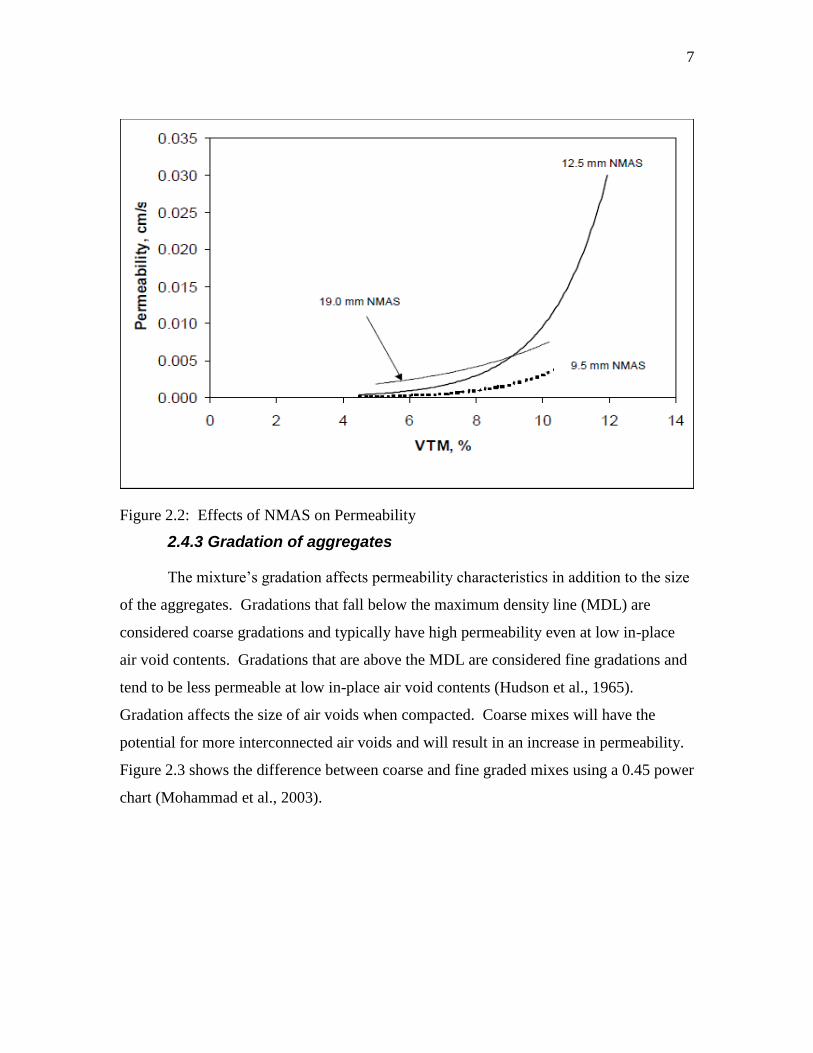
2.4.2 Nominal Maximum Aggregate Size (NMAS)
Permeability of pavements is directly related to the nominal maximum aggregate
size. As the size of the aggregates increase, the size of the air voids also increase. This is
especially true when dealing with coarse-graded SuperPave mixes. The tendency for the
air voids to become interconnected increases when the amount of air voids increase.
Figure 2.2 shows that permeability increases when NMAS increases (Cooley et al., 2002,
Mallick et al., 2003).
7
Figure 2.2: Effects of NMAS on Permeability
2.4.3 Gradation of aggregates
The mixture’s gradation affects permeability characteristics in addition to the size
of the aggregates. Gradations that fall below the maximum density line (MDL) are
considered coarse gradations and typically have high permeability even at low in-place
air void contents. Gradations that are above the MDL are considered fine gradations and
tend to be less permeable at low in-place air void contents (Hudson et al., 1965).
Gradation affects the size of air voids when compacted. Coarse mixes will have the
potential for more interconnected air voids and will result in an increase in permeability.
Figure 2.3 shows the difference between coarse and fine graded mixes using a 0.45 power
chart (Mohammad et al., 2003).

8
Figure 2.3: Coarse and Fine Graded Gradations
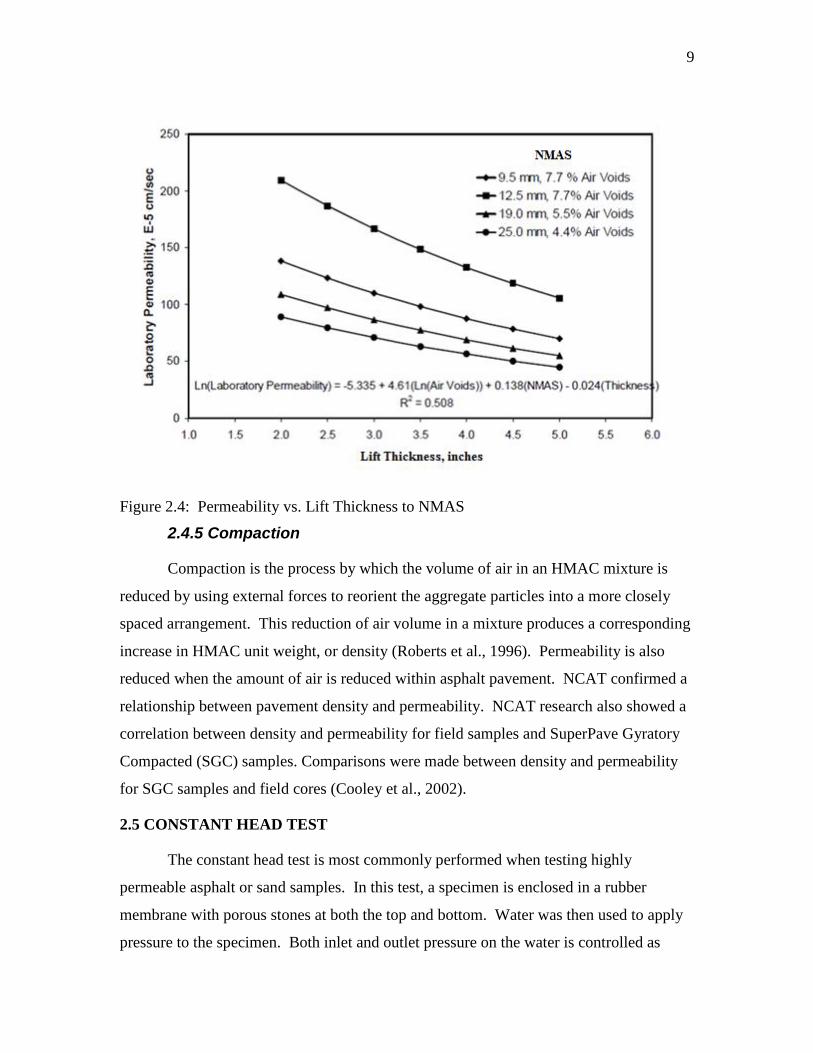
2.4.4 Lift thickness
Another factor to take into account when dealing with permeability is asphalt lift
thickness. As the lift thickness increases, the chance for interconnected voids, which
allow water to flow a sufficient depth deceases. In addition, thicker lifts are used because
they are generally easier to compact. When a thick lift is placed, the retained heat in the
asphalt keeps its viscosity low which allows the aggregates to orientate properly,
resulting in an increased pavement density (Russel et al., 2004, Musselman et al., 1998).
NCAT confirmed that the HMAC lift thickness is directly related to permeability.
They have shown that a lift thickness-to-NMAS ratio (t/NMAS) minimum of 3.0 is
recommended, but a t/NMAS ratio of 4.0 is preferred. The results of their study show
that the lowest permeability values were found with a t/MAS ratio of 4.0. Figure 2.4
shows that when lift thickness increases, permeability decreases (Cooley et al., 2002).
9
Figure 2.4: Permeability vs. Lift Thickness to NMAS
2.4.5 Compaction
Compaction is the process by which the volume of air in an HMAC mixture is
reduced by using external forces to reorient the aggregate particles into a more closely
spaced arrangement. This reduction of air volume in a mixture produces a corresponding
increase in HMAC unit weight, or density (Roberts et al., 1996). Permeability is also
reduced when the amount of air is reduced within asphalt pavement. NCAT confirmed a
relationship between pavement density and permeability. NCAT research also showed a
correlation between density and permeability for field samples and SuperPave Gyratory
Compacted (SGC) samples. Comparisons were made between density and permeability
for SGC samples and field cores (Cooley et al., 2002).
2.5 CONSTANT HEAD TEST
The constant head test is most commonly performed when testing highly
permeable asphalt or sand samples. In this test, a specimen is enclosed in a rubber
membrane with porous stones at both the top and bottom. Water was then used to apply
pressure to the specimen. Both inlet and outlet pressure on the water is controlled as
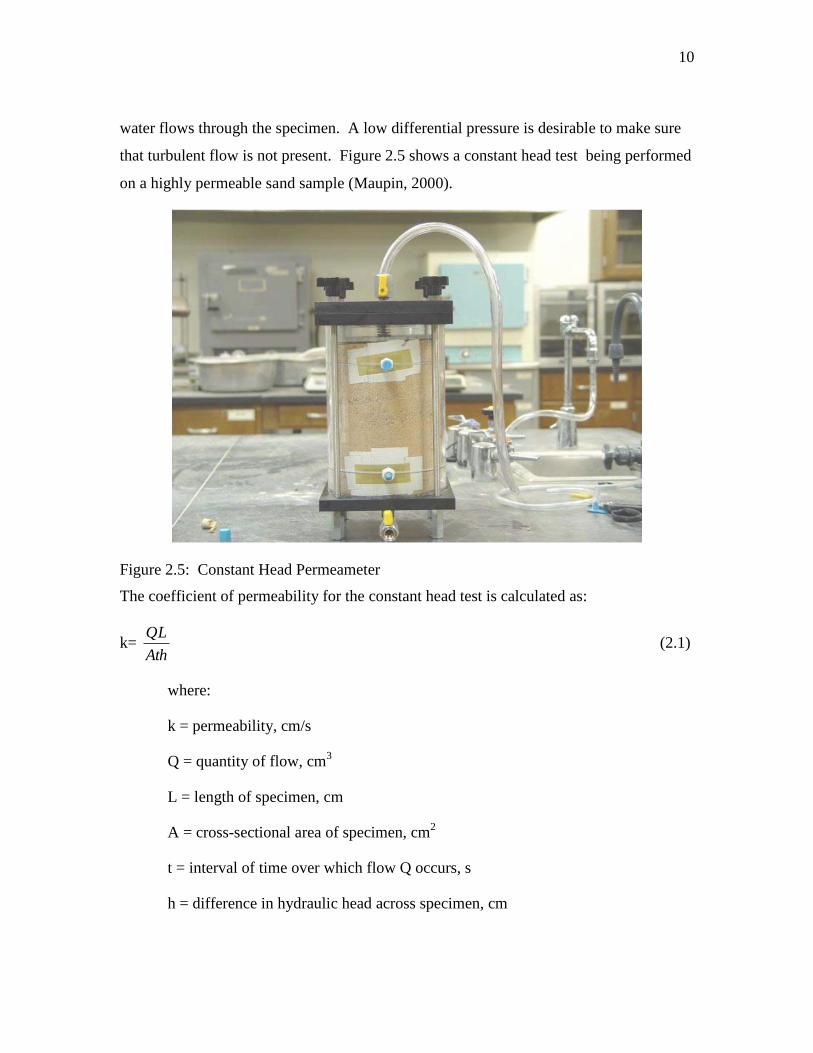
10
water flows through the specimen. A low differential pressure is desirable to make sure
that turbulent flow is not present. Figure 2.5 shows a constant head test being performed
on a highly permeable sand sample (Maupin, 2000).
Figure 2.5: Constant Head Permeameter
The coefficient of permeability for the constant head test is calculated as:
k= Ath
QL (2.1)
where:
k = permeability, cm/s
Q = quantity of flow, cm3
L = length of specimen, cm
A = cross-sectional area of specimen, cm2
t = interval of time over which flow Q occurs, s
h = difference in hydraulic head across specimen, cm
11
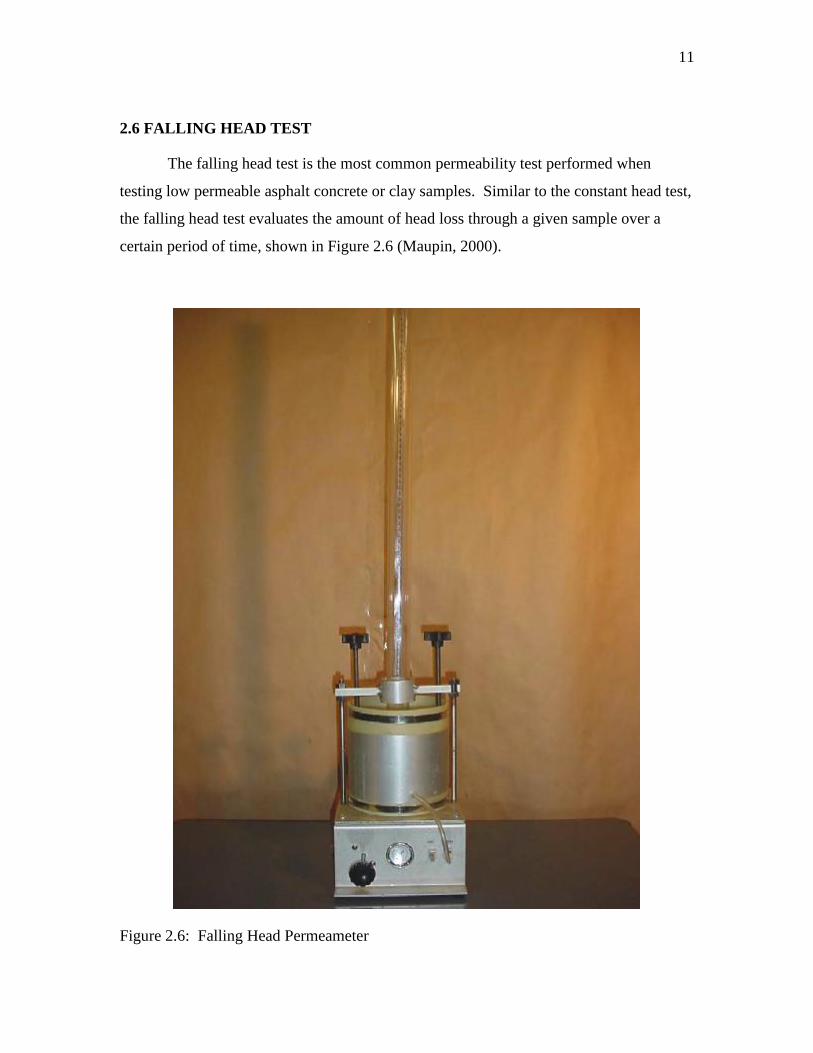
2.6 FALLING HEAD TEST
The falling head test is the most common permeability test performed when
testing low permeable asphalt concrete or clay samples. Similar to the constant head test,
the falling head test evaluates the amount of head loss through a given sample over a
certain period of time, shown in Figure 2.6 (Maupin, 2000).
Figure 2.6: Falling Head Permeameter
12
The coefficient of permeability for the falling head test is calculated as:
k = 2
1ln*h
h
At
aL (2.2)
where:
k = coefficient of permeability, cm/s
a = area of graduated cylinder, cm2
L = length of specimen, cm
A = cross-sectional area of specimen, cm2
t = time of flow between heads, s
h1 = initial head of water, cm
h2 = final head of water, cm
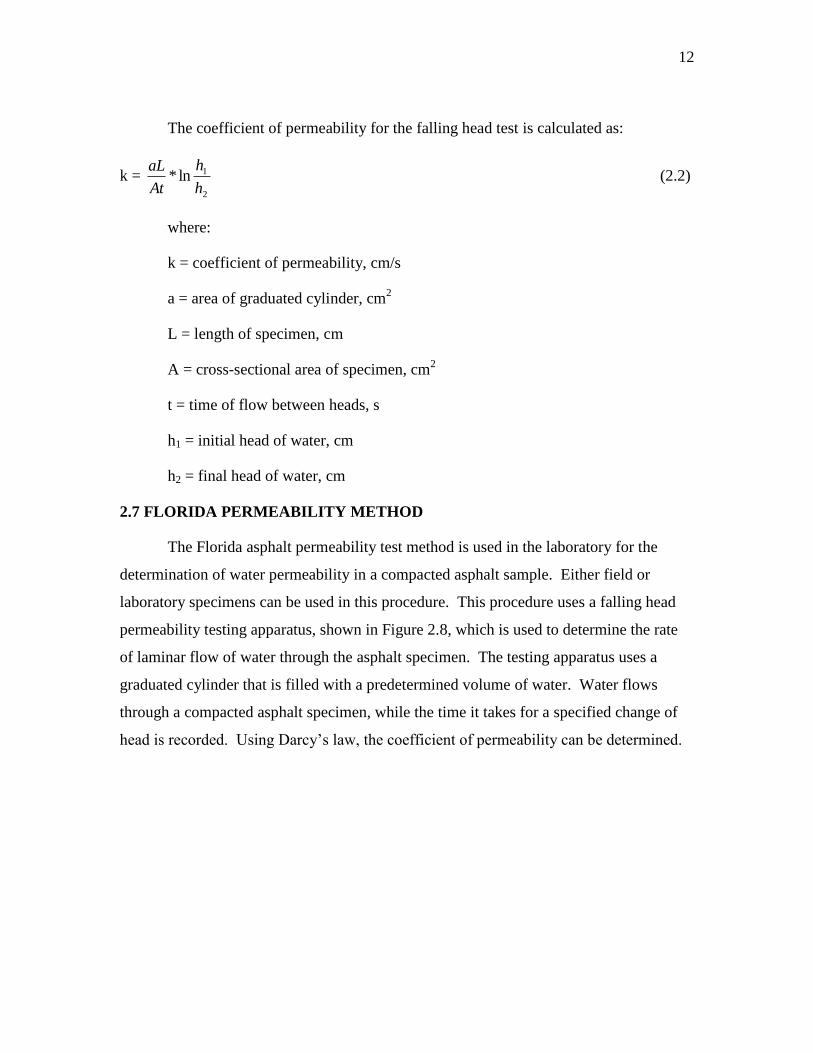
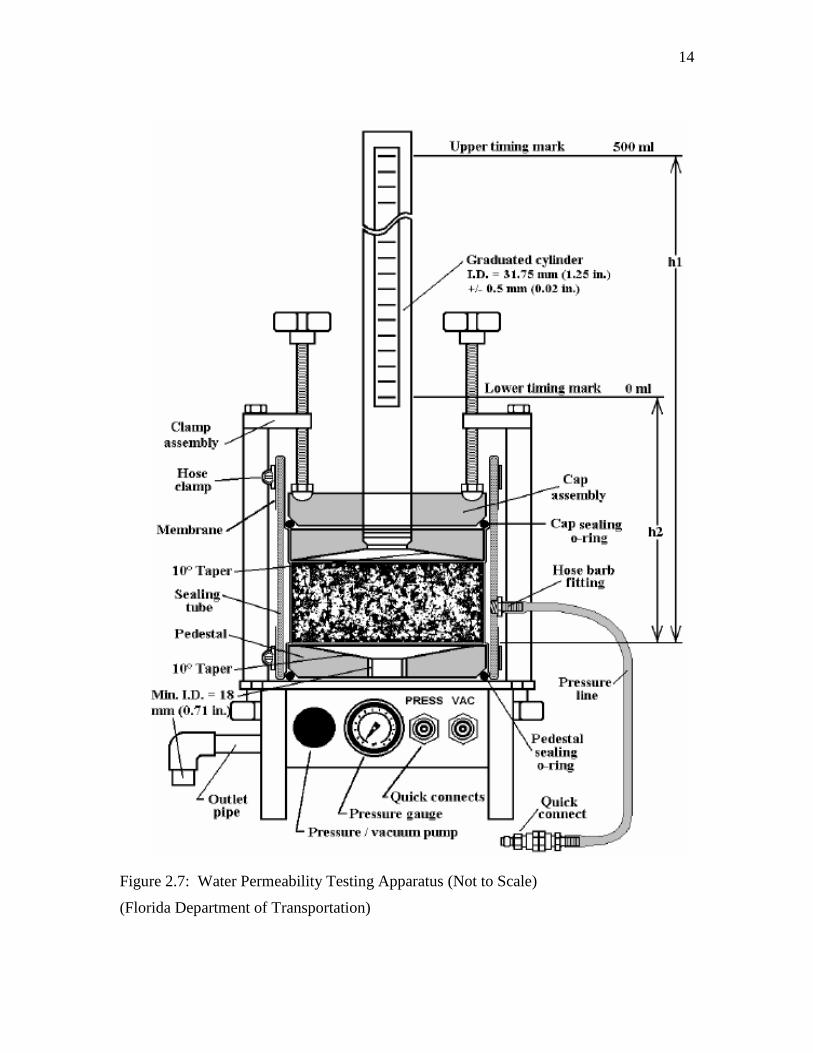
2.7 FLORIDA PERMEABILITY METHOD
The Florida asphalt permeability test method is used in the laboratory for the
determination of water permeability in a compacted asphalt sample. Either field or
laboratory specimens can be used in this procedure. This procedure uses a falling head
permeability testing apparatus, shown in Figure 2.8, which is used to determine the rate
of laminar flow of water through the asphalt specimen. The testing apparatus uses a
graduated cylinder that is filled with a predetermined volume of water. Water flows
through a compacted asphalt specimen, while the time it takes for a specified change of
head is recorded. Using Darcy’s law, the coefficient of permeability can be determined.
13
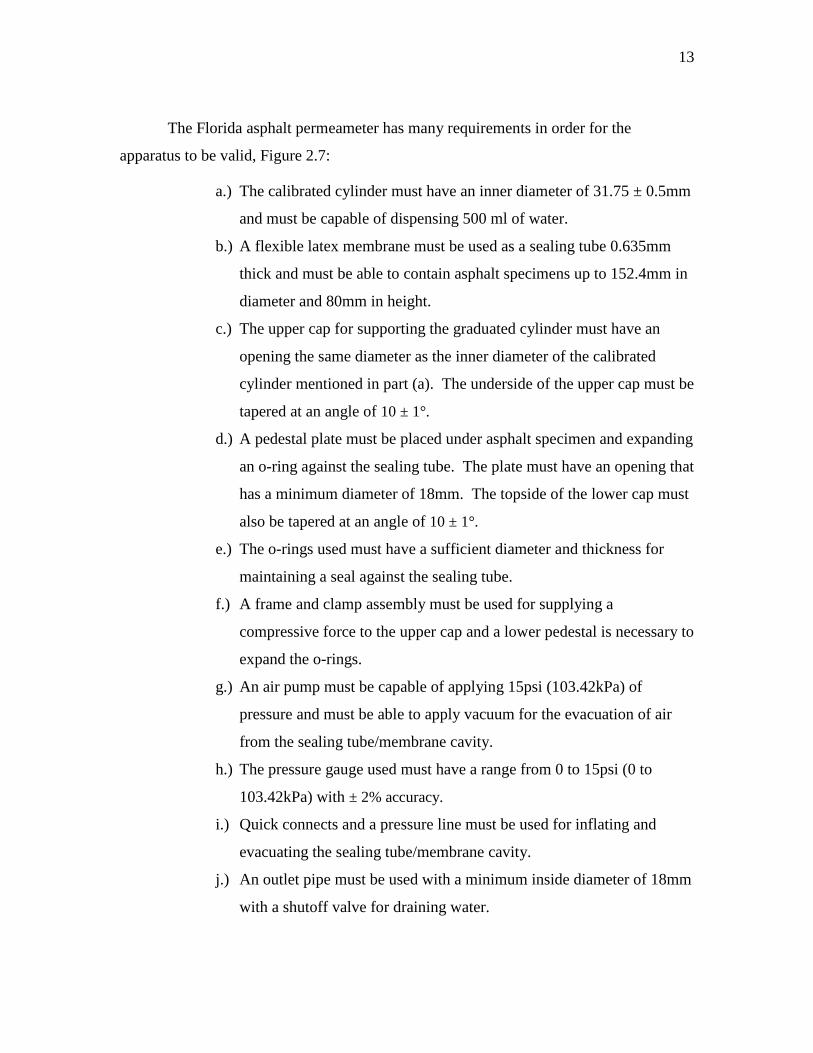
The Florida asphalt permeameter has many requirements in order for the
apparatus to be valid, Figure 2.7:
a.) The calibrated cylinder must have an inner diameter of 31.75 ± 0.5mm
and must be capable of dispensing 500 ml of water.
b.) A flexible latex membrane must be used as a sealing tube 0.635mm
thick and must be able to contain asphalt specimens up to 152.4mm in
diameter and 80mm in height.
c.) The upper cap for supporting the graduated cylinder must have an
opening the same diameter as the inner diameter of the calibrated
cylinder mentioned in part (a). The underside of the upper cap must be
tapered at an angle of 10 ± 1°.
d.) A pedestal plate must be placed under asphalt specimen and expanding
an o-ring against the sealing tube. The plate must have an opening that
has a minimum diameter of 18mm. The topside of the lower cap must
also be tapered at an angle of 10 ± 1°.
e.) The o-rings used must have a sufficient diameter and thickness for
maintaining a seal against the sealing tube.
f.) A frame and clamp assembly must be used for supplying a
compressive force to the upper cap and a lower pedestal is necessary to
expand the o-rings.
g.) An air pump must be capable of applying 15psi (103.42kPa) of
pressure and must be able to apply vacuum for the evacuation of air
from the sealing tube/membrane cavity.
h.) The pressure gauge used must have a range from 0 to 15psi (0 to
103.42kPa) with ± 2% accuracy.
i.) Quick connects and a pressure line must be used for inflating and
evacuating the sealing tube/membrane cavity.
j.) An outlet pipe must be used with a minimum inside diameter of 18mm
with a shutoff valve for draining water.
14
Figure 2.7: Water Permeability Testing Apparatus (Not to Scale)
(Florida Department of Transportation)

15
Each asphalt specimen must be prepared in a specific manner before testing. The
sample must first be compacted to a desired thickness and washed thoroughly with water
to remove all loose and fine material. The bulk specific gravity of the specimen is then
measured. The height and diameter of the specimen must be measured and recorded to
the nearest 0.5 mm in three locations. The three measurements of both the height and
diameter must not vary more than 5 mm and the diameter of the specimen must be at
least 144mm. Using a spatula or a similar device, a thin layer of petroleum jelly is to be
applied to the sides of the specimen. The jelly will fill the void areas around the sides
which are not representative of the level of compaction of the interior of the specimen.
The sample must be wiped with a towel to remove all water before the petroleum jelly is
applied.
The air from the sealing tube/membrane cavity must be removed at the beginning
of the permeability test. All air is removed by pinching the membrane while pulling it
away from the hose barb fitting. The test specimen must be placed on top of the lower
plate and centered. The sealing tube must be placed over the test specimen and the lower
pedestal plate once the test specimen is centered. The sealing tube is placed so that the
hose barb fitting is located between the o-rings on the upper cap and lower pedestal. The
upper cap assembly is placed into the sealing tube and rests on the top of the specimen.
To seal the specimen, two clamps are evenly tightened on the frame. After clamps are
securely tightened, the membrane is inflated and maintained at 10 ± 0.5 psi throughout the
entire test. Water is then filled above the upper timing mark. The timer is started once the
bottom of the meniscus of water reaches the upper timing mark. The timer is stopped when
the bottom of the meniscus reaches the bottom timing mark. This process is repeated three
times until the difference between the first and third test is less than four percent. The
temperature of the water in the graduated cylinder is measured to the closest 0.1 °C.
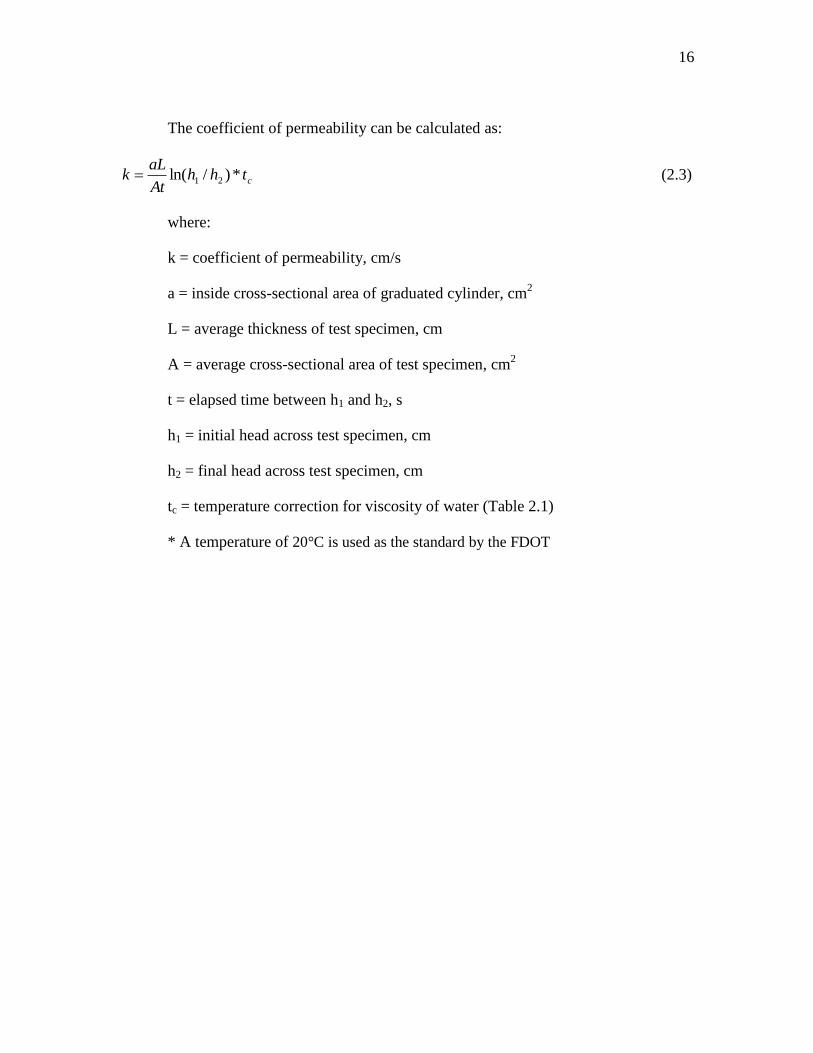
16
The coefficient of permeability can be calculated as:
cthhAt
aLk *)/ln( 21 (2.3)
where:
k = coefficient of permeability, cm/s
a = inside cross-sectional area of graduated cylinder, cm2
L = average thickness of test specimen, cm
A = average cross-sectional area of test specimen, cm2
t = elapsed time between h1 and h2, s
h1 = initial head across test specimen, cm
h2 = final head across test specimen, cm
tc = temperature correction for viscosity of water (Table 2.1)
* A temperature of 20°C is used as the standard by the FDOT
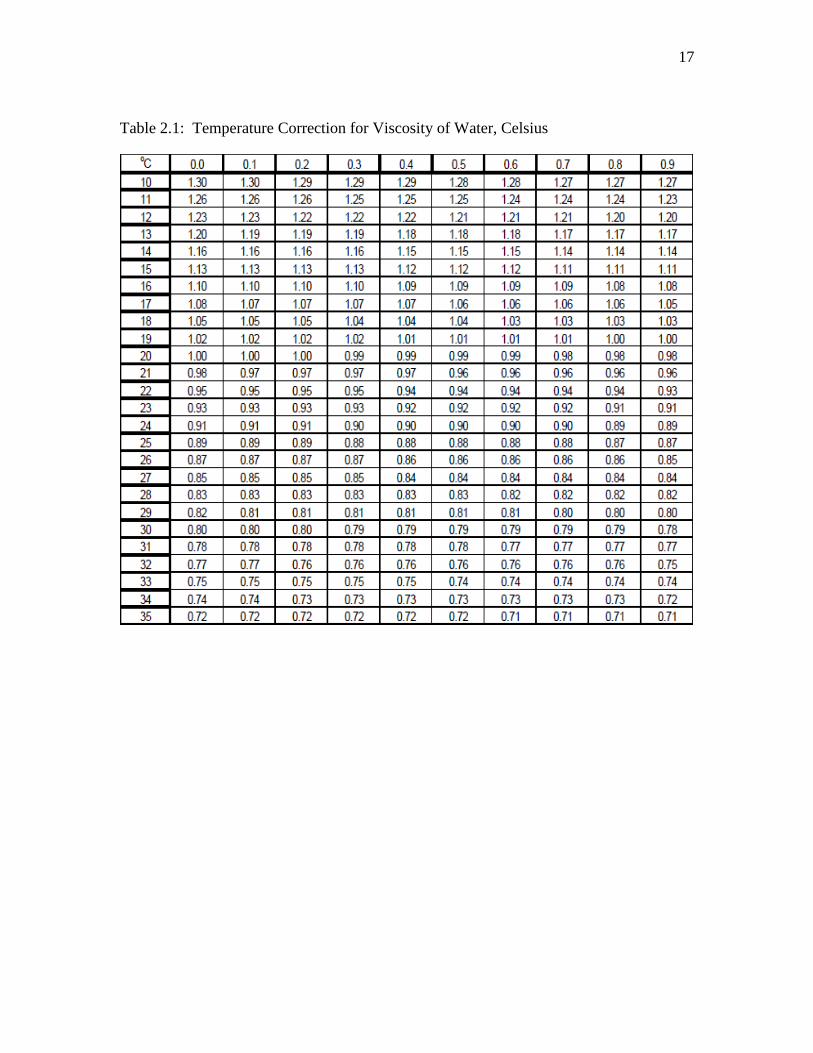
17
Table 2.1: Temperature Correction for Viscosity of Water, Celsius

18
2.8 INDIRECT TENSION TEST
The indirect tension (IDT) strength test is used to evaluate the rut resistance of hot
mix asphalt concrete (HMAC) mixtures. Since the implementation of the SuperPave mix
design process, engineers have expressed concern over the lack of a test to ensure that
mixtures have adequate stability and rut resistance. The IDT test method is simple,
quick, and can be run using a standard Marshall stabilometer equipped with an IDT
loading head. Most construction materials laboratories can run this test without any
additional expenses on equipment and training. This test also appears to correlate well to
HMAC rut resistance for a wide range of mixtures (Christensen et al., 2007).
2.8.1 IDT Test procedure
The testing machine used to load the asphalt specimens should have a minimum
capacity of 5,000 lbf and should be capable of applying a load at a rate of 0.17 ft/min.
The testing system should include a means of measuring the failure load to an accuracy
of ± 10 lbf. Asphalt specimens should be prepared using a SuperPave gyratory
compactor to a height of 115 ± 10 mm and150 mm in diameter. The test temperature
should be 9°C lower than the yearly 7-day average. Specimens should be conditioned
prior to testing for 1 to 2 hours in a controlled temperature chamber or for 30 to 60
minutes in a controlled temperature water bath. If a water bath is used for conditioning,
specimens should be tightly sealed in a plastic bag prior to immersion. After
conditioning, specimens should then be placed in the testing apparatus and immediately
loaded to failure at 50 mm/min. Specimen should be placed in testing apparatus within
60 seconds of removal from chamber or water bath.

19
IDT strength is calculated as:
tD
PIDT
2 (2.4)
where:
IDT = IDT strength, Pa
P = maximum applied load, N
π = 3.1416
t = thickness, m
D = diameter, m
Two asphalt samples should be tested, and the average of the two strengths
recorded as the IDT strength. The rut resistance of a mixture based upon the results of
the high-temperature IDT strength test is computed as (Christensen et al., 2007):
TRmax = 1.97 x 10⁻⁵
(IDT)2.549
(2.5)
where:
TRmax = maximum allowable traffic for given mixture, millions ESALs
IDT = high-temperature IDT strength, kPa
2.9 CASE STUDIES
2.9.1 Pennsylvania
A case study performed in Pennsylvania in 2001 documents the effect of
pavement saturation. The authors suggest that under completely saturated conditions, all
asphalt mixes may fail due to repeated hydraulic stress which physically separates the
aggregate from the asphalt binder.
The case history presented in this study by Auburn University give the details of
construction, visual observation of pavement distress, sampling and testing of pavement,
and conclusions/recommendations. A jackhammer was used for dry sampling to

20
determine a moisture profile within the pavement structure. The phenomenon of
stripping was investigated, looking at the relative permeability of the pavement
components, subsurface drainage system, and the interaction between different asphalt
courses including open-graded friction courses. Various hypotheses are presented
throughout the paper to explain the mechanisms that resulted in the observed pavement
saturation and recommendations were made to reduce instances of premature failures
caused by stripping.
The case study was done on the Pennsylvania turnpike in Cumberland County
between mile posts 209.5 and 218.0. In 1994 this section of the turnpike received an
asphalt overlay consisting of a 37 mm thick ID-2 wearing course (dense graded 9.5mm
NMAS mix). The percentage of material passing the 4.75mm, 2.36mm, and 0.075mm
sieves were 71%, 45%, and 4.5% respectively, with a design binder content of 6.3%. The
overlay was placed between April and November 1994 and the aggregate was 100%
crushed stone. The existing road was milled to an average depth of 40mm prior to the
overlay.
Approximately two years later, in 1996, the project started to show signs of
premature distress in the westbound slow lane between mile posts 215.5 and 218.0.
Signs included fines brought up to the surface by water, flushing of the surface, and
potholing. Potholes were visible in the wheel tracks on the west bound slow lane; more
were found on the inside tracks than the outside tracks. There were no signs of
significant distress between mile posts 209.5 and 215.5. A jackhammer was used to cut
samples at various locations of the pavement in both the distressed and good areas. Three
500mm x 500mm samples were taken on mile post 217.65 on the inside wheel track,
between the wheel tracks, and on the outside wheel track. Each sample that was taken
was examined for moisture content and maximum theoretical gravity.
In addition, three 150mm diameter cores were taken adjacent to the samples
mentioned above to determine the thickness, bulk specific gravity, and air void content of
each pavement layer. Similar samples were also taken in the good area at mile post
212.9. Table 2.2 and Table 2.3 give a brief summary of the observations for each

21
pavement layer at the three sample locations at mile posts 217.65 and 212.90 in the
westbound slow lane (Kandhal et al., 2001).
Table 2.2: Visual Observations of Holes at MP 217.65 in Westbound Slow Lane
Table 2.3: Visual Observations of Holes at MP 212.90 in Westbound Slow Lane
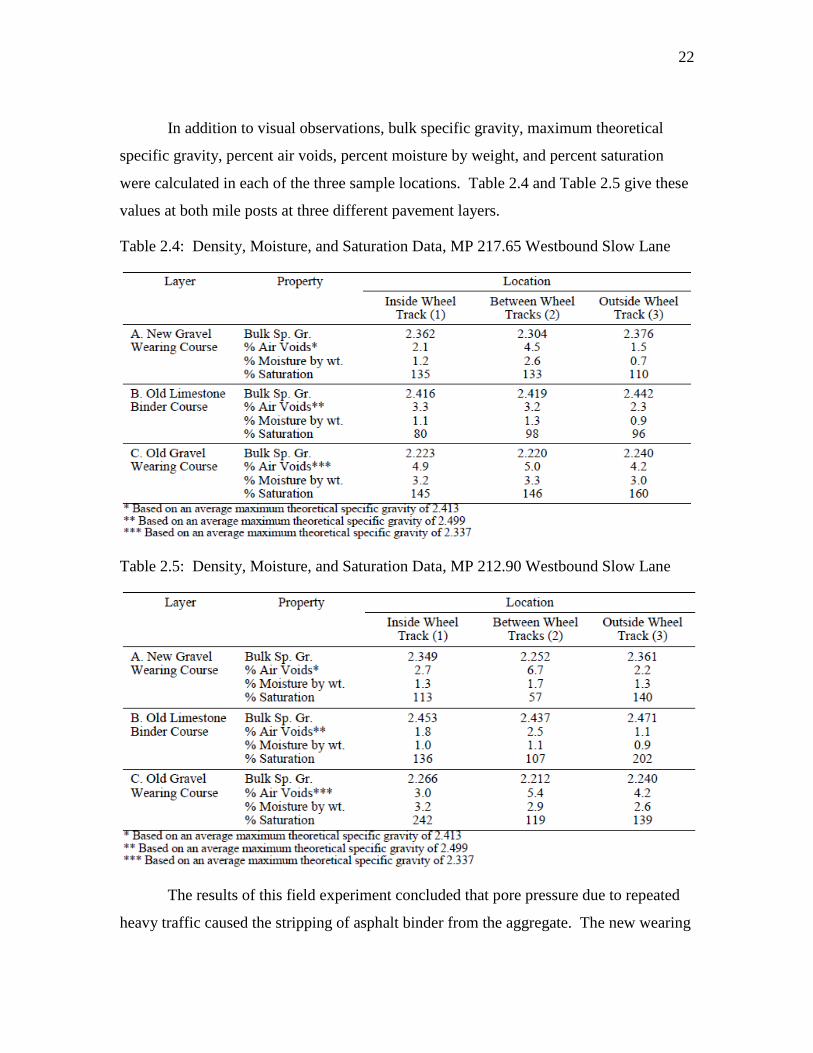
22
In addition to visual observations, bulk specific gravity, maximum theoretical
specific gravity, percent air voids, percent moisture by weight, and percent saturation
were calculated in each of the three sample locations. Table 2.4 and Table 2.5 give these
values at both mile posts at three different pavement layers.
Table 2.4: Density, Moisture, and Saturation Data, MP 217.65 Westbound Slow Lane
Table 2.5: Density, Moisture, and Saturation Data, MP 212.90 Westbound Slow Lane
The results of this field experiment concluded that pore pressure due to repeated
heavy traffic caused the stripping of asphalt binder from the aggregate. The new wearing
23
course with gravel aggregates was almost impermeable to surface water because the
in-situ air void content was generally lower than 5 percent. Due to inadequate subsurface
drainage, the new wearing course was being stripped from the bottom upwards by water
coming from underneath the pavement. Although pavement distress has not began on the
surface between mile posts 209.5 and 215.5, stripping has already started on the
underlying layers beneath the new gravel wearing course. Signs of pavement distress on
the surface are expected to begin in the near future just as seen between mile posts 215.5
and 218.0. The delay in the distress between mile posts 209.5 and 215.5 was not
explained, but it is thought to be the difference in the construction of the subsurface
draining conditions (Kandhal et al., 2001).
2.9.2 Louisiana
The Louisiana Transportation Research Center (LTRC) performed laboratory
permeability tests on field cores taken from seventeen SuperPave projects within
Louisiana. Similar to the Florida Test Method, the LTRC used a modified version of the
Karol-Warner’s falling head permeameter. In addition, volumetric properties that affect
permeability such as air void content, compaction effort, mixture gradation, and lift
thickness were related using a sensitivity analysis. A regression model was developed to
be able to predict the permeability from the volumetric properties. The primary goal of
this research was to evaluate the permeability of SuperPave mixtures used in Louisiana,
study the effects of volumetric properties of the mix on permeability, and to estimate the
coefficient of permeability using a prediction model (Mohammad et al., 2003).
A total of twenty-four 19mm and 25mm wearing and binder course mixtures were
evaluated from the Louisiana 1998 and 1999 SuperPave implementation projects. Three
levels of design traffic were used. The traffic level determines the compaction effort
used to select the design binder content. In general, a higher compaction effort is used as
the traffic level increases, which results in lower design binder content. Below is a
breakdown of the mixtures evaluated:
24
1998 SuperPave Projects
Layer NMAS Traffic Level
(7) wearing course mixtures (8) 19mm mixtures (7) Level 1 (<3 mill. ESALs)
(6) binder course mixtures (5) 25mm mixtures (3) Level 2 (3-30 mill. ESALs)
(3) Level 3 (>30 mill. ESALs)
1999 SuperPave Projects
(8) wearing course mixtures (8) 19mm mixtures (3) Level 1 (<3 mill. ESALs)
(3) binder course mixtures (3) 25mm mixtures (2) Level 2 (3-30 mill. ESALs)
(6) Level 3 (>30 mill. ESALs)
The 150 mm diameter core samples were collected in accordance with ASTM
D979 “Standard Practice for Sampling Bituminous Paving Mixtures” and were separated
by layers. The permeameter used in this study has the capability to perform both falling
head and constant head tests, although only the falling head test was used. Similar to the
Florida method, Darcy’s Law was used to calculate the coefficient of permeability from
equation 2.2 (No temperature correction).
Many variables were considered when calculating permeability of an asphalt mix:
specimen thickness, percent of air voids, gradation of the mix (coarse vs. fine), asphalt
content, and compaction. This study conducted experiments to evaluate the effect of
each of these variables when determining asphalt permeability.
Asphalt mixtures were considered permeable when the coefficient of permeability
values was greater than 125x10-4
mm/s. An air void content of approximately 5.3% and
above is where the asphalt mixtures began to become permeable. The effect of mixture
gradation was another important variable considered. The mixtures were classified as
fine or coarse graded based on the gradation being above or below the maximum density
line respectively.
The permeability values of the coarse-graded mixture were above 125x10-4
mm/s
when the air void content exceeded 5.3%, while all fine-graded mixtures in this study
25
were found to be impermeable at all air void levels. Thus, coarser blends were found to
be more permeable then finer blends. Even though the aggregate gradation and air void
levels may be similar, they may have different coefficient of permeability values due to
the various arrangement of aggregates inside the mixture.
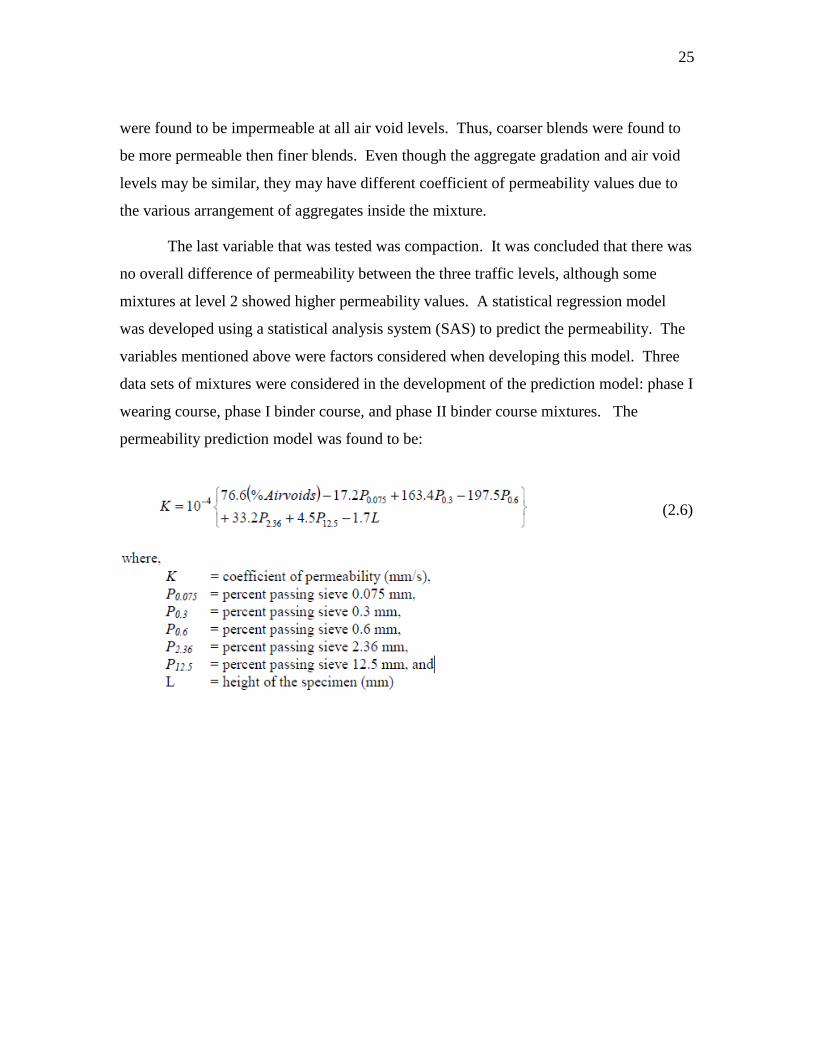
The last variable that was tested was compaction. It was concluded that there was
no overall difference of permeability between the three traffic levels, although some
mixtures at level 2 showed higher permeability values. A statistical regression model
was developed using a statistical analysis system (SAS) to predict the permeability. The
variables mentioned above were factors considered when developing this model. Three
data sets of mixtures were considered in the development of the prediction model: phase I
wearing course, phase I binder course, and phase II binder course mixtures. The
permeability prediction model was found to be:
(2.6)
26
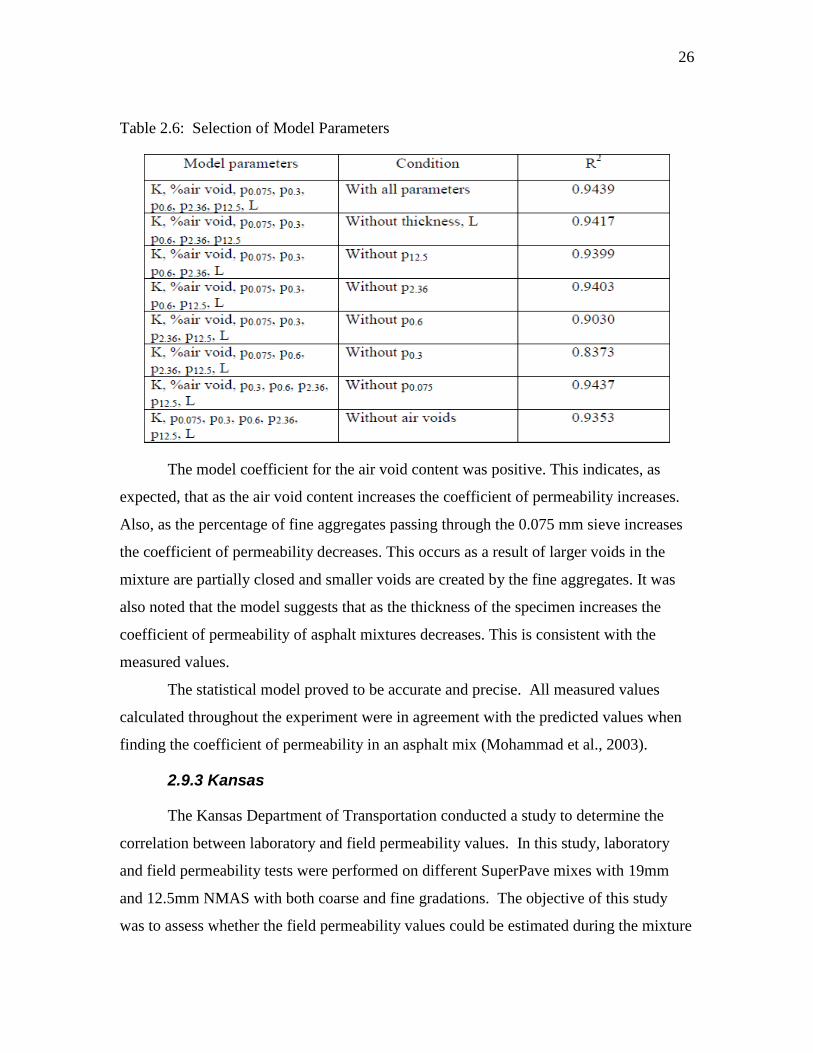
Table 2.6: Selection of Model Parameters
The model coefficient for the air void content was positive. This indicates, as
expected, that as the air void content increases the coefficient of permeability increases.
Also, as the percentage of fine aggregates passing through the 0.075 mm sieve increases
the coefficient of permeability decreases. This occurs as a result of larger voids in the
mixture are partially closed and smaller voids are created by the fine aggregates. It was
also noted that the model suggests that as the thickness of the specimen increases the
coefficient of permeability of asphalt mixtures decreases. This is consistent with the
measured values.
The statistical model proved to be accurate and precise. All measured values
calculated throughout the experiment were in agreement with the predicted values when
finding the coefficient of permeability in an asphalt mix (Mohammad et al., 2003).
2.9.3 Kansas
The Kansas Department of Transportation conducted a study to determine the
correlation between laboratory and field permeability values. In this study, laboratory
and field permeability tests were performed on different SuperPave mixes with 19mm
and 12.5mm NMAS with both coarse and fine gradations. The objective of this study
was to assess whether the field permeability values could be estimated during the mixture
27
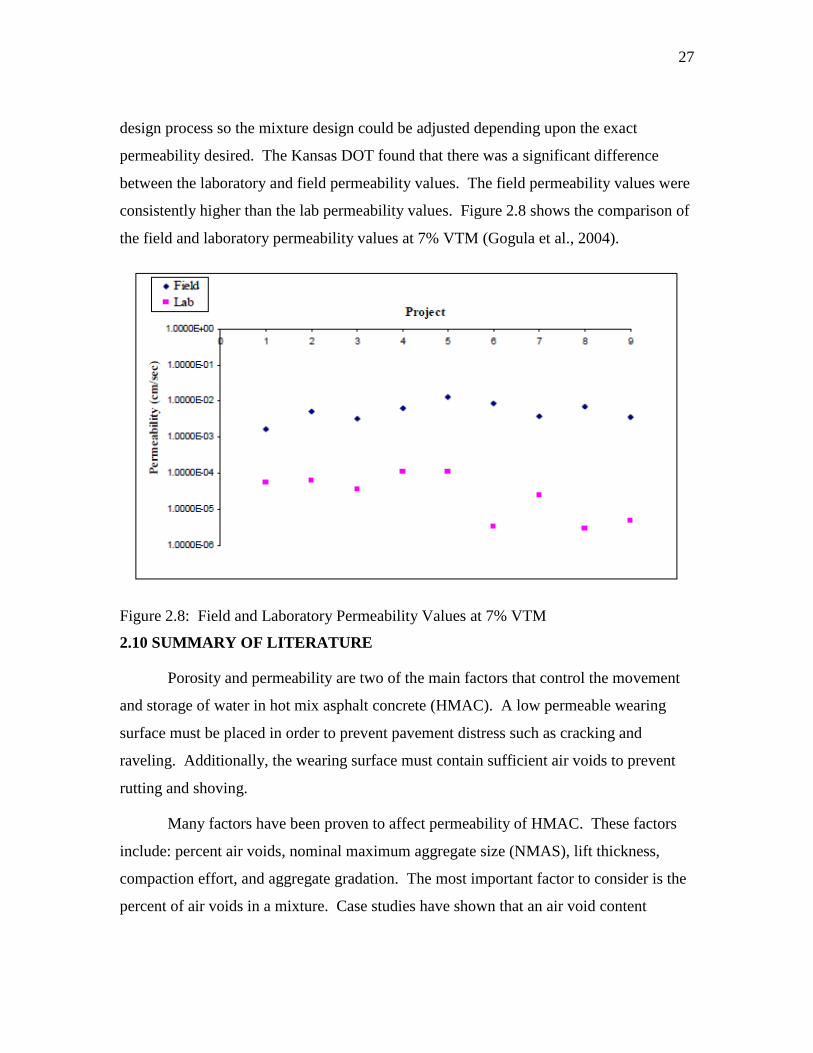
design process so the mixture design could be adjusted depending upon the exact
permeability desired. The Kansas DOT found that there was a significant difference
between the laboratory and field permeability values. The field permeability values were
consistently higher than the lab permeability values. Figure 2.8 shows the comparison of
the field and laboratory permeability values at 7% VTM (Gogula et al., 2004).
Figure 2.8: Field and Laboratory Permeability Values at 7% VTM
2.10 SUMMARY OF LITERATURE
Porosity and permeability are two of the main factors that control the movement
and storage of water in hot mix asphalt concrete (HMAC). A low permeable wearing
surface must be placed in order to prevent pavement distress such as cracking and
raveling. Additionally, the wearing surface must contain sufficient air voids to prevent
rutting and shoving.
Many factors have been proven to affect permeability of HMAC. These factors
include: percent air voids, nominal maximum aggregate size (NMAS), lift thickness,
compaction effort, and aggregate gradation. The most important factor to consider is the
percent of air voids in a mixture. Case studies have shown that an air void content

28
exceeding 7-8 percent results in a drastic increase in permeability for a 9.5mm wearing
surface.
The most common method for testing low permeable specimens is the falling
head test method. This test evaluates the amount of head loss through a given specimen
over a certain period of time. The Florida permeability test method is a common falling
head test and is used in the laboratory to test either field or laboratory samples. There are
currently no established field test methods to determine the permeability of HMAC.
Indirect tension (IDT) strength testing is used to evaluate the rut resistance of hot
mix asphalt concrete (HMAC) mixtures. The newly developed procedure can be run
using a standard Marshall press so that most construction material laboratories can run
this test without any additional expenses. The IDT strength and estimated maximum
allowable traffic can be calculated when the recommended procedure is followed.

29
CHAPTER 3: RESEARCH METHODOLOGY
3.1 INTRODUCTION
The emphasis of this research project was to observe how binder content affects
permeability of hot mix asphalt concrete (HMAC). Asphalt samples were compacted in a
gyratory compactor to 4, 6, 8, and 10 percent air voids. Binder content was varied at 5.2,
5.7, 6.2, and 6.7 percent for each air void level. Throughout the research, the amount of
gyrations needed to compact each sample was recorded. This was done to observe how
binder content affected the compaction effort. The Florida Method of Test for
Measurement of Water Permeability of Compacted Asphalt Paving Mixtures was used in
this research to analyze the permeability of each asphalt sample. The indirect tension
(IDT) test was then performed to evaluate the rutting resistance of each sample.
3.2 SAMPLE PREPARATION
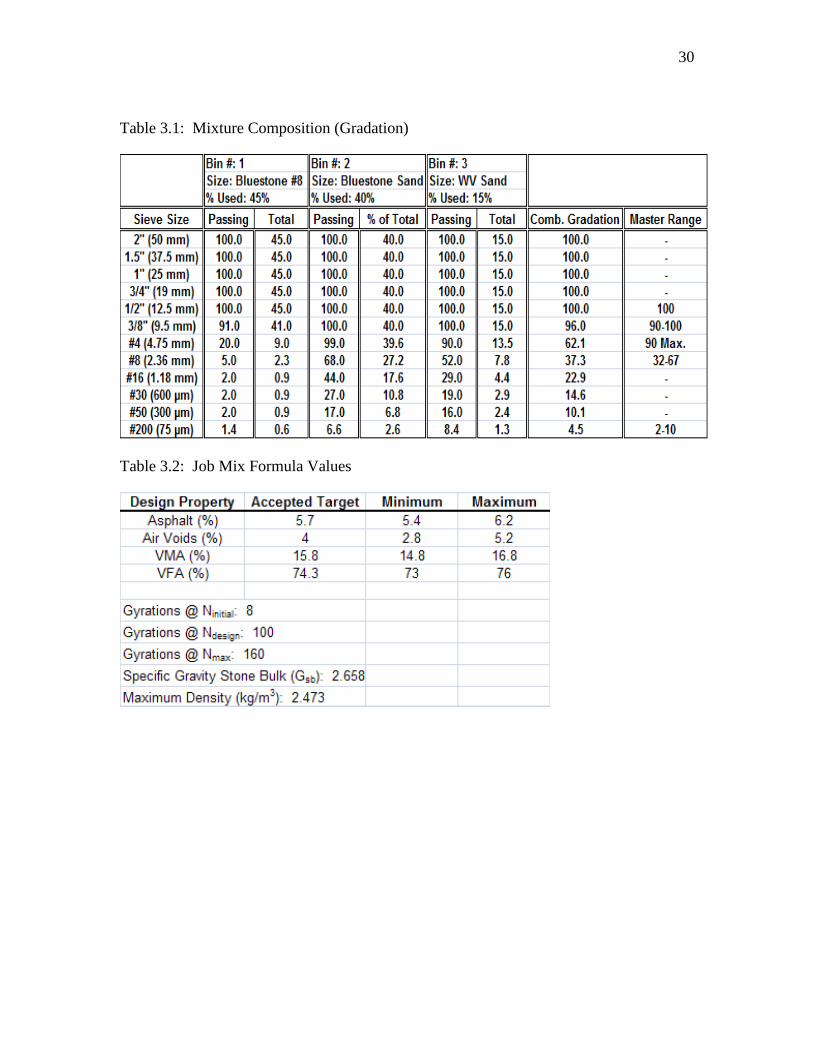
Aggregate and the gradation used in this research were obtained from Greer
Industries in Morgantown, West Virginia. The HMAC type was a 9.5 mm skid surface
and was designed for 3 to 30 million ESALs. The binder used was PG 70-22. Three
aggregate types were used in this research: Bluestone #8, Bluestone Sand, and West
Virginia Sand. The mixture composition consisted of 45% Bluestone #8, 40% Bluestone
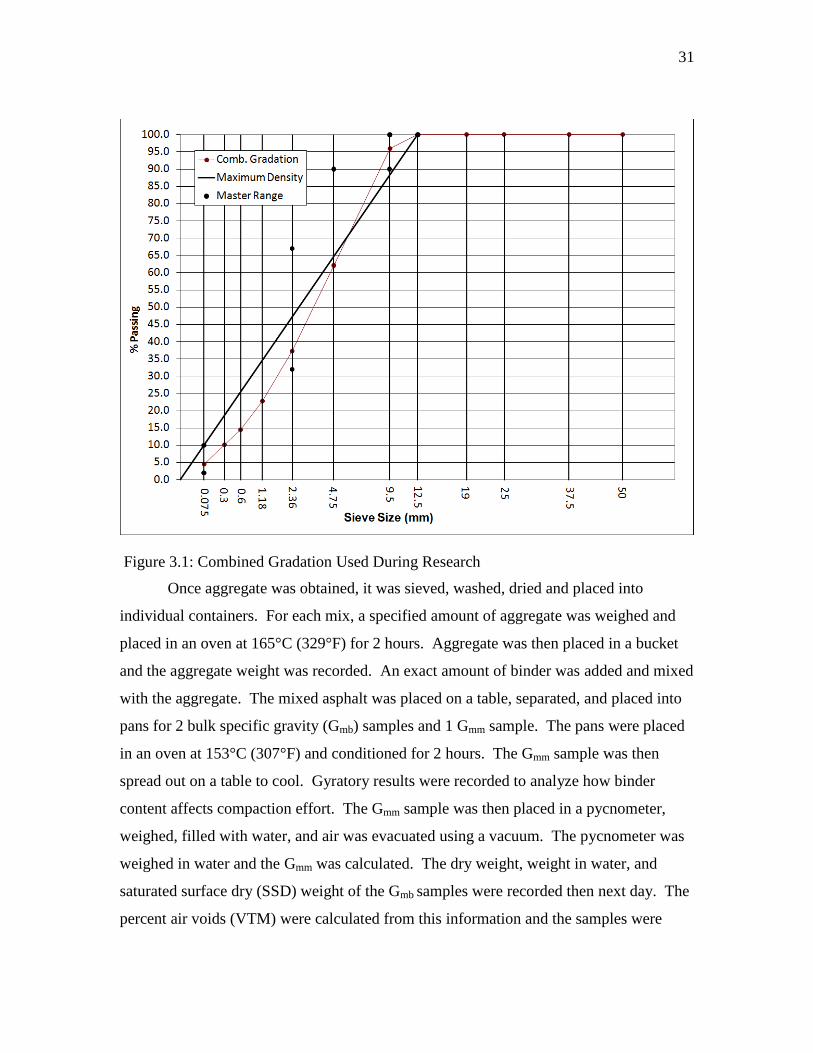
Sand, and 15% West Virginia Sand. Stockpile and mix gradations are given in Table 3.1
and Figure 3.1. The gradation is classified as a coarse blend. The job mix formula values
were verified in the laboratory and are shown in Table 3.2.
30
Table 3.1: Mixture Composition (Gradation)
Table 3.2: Job Mix Formula Values
31
Figure 3.1: Combined Gradation Used During Research
Once aggregate was obtained, it was sieved, washed, dried and placed into
individual containers. For each mix, a specified amount of aggregate was weighed and
placed in an oven at 165°C (329°F) for 2 hours. Aggregate was then placed in a bucket
and the aggregate weight was recorded. An exact amount of binder was added and mixed
with the aggregate. The mixed asphalt was placed on a table, separated, and placed into
pans for 2 bulk specific gravity (Gmb) samples and 1 Gmm sample. The pans were placed
in an oven at 153°C (307°F) and conditioned for 2 hours. The Gmm sample was then
spread out on a table to cool. Gyratory results were recorded to analyze how binder
content affects compaction effort. The Gmm sample was then placed in a pycnometer,
weighed, filled with water, and air was evacuated using a vacuum. The pycnometer was
weighed in water and the Gmm was calculated. The dry weight, weight in water, and
saturated surface dry (SSD) weight of the Gmb samples were recorded then next day. The
percent air voids (VTM) were calculated from this information and the samples were
32
accepted or rejected for further testing. Samples were rejected if air voids were more
than ±0.5% from the target.
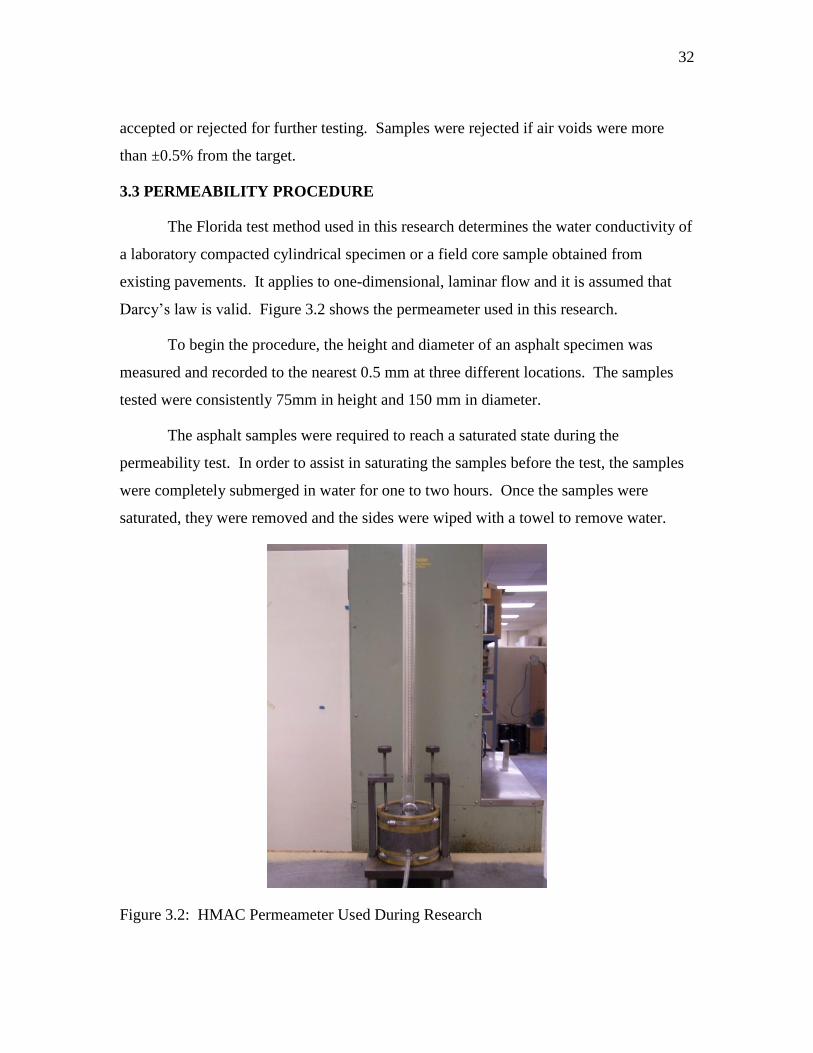
3.3 PERMEABILITY PROCEDURE
The Florida test method used in this research determines the water conductivity of
a laboratory compacted cylindrical specimen or a field core sample obtained from
existing pavements. It applies to one-dimensional, laminar flow and it is assumed that
Darcy’s law is valid. Figure 3.2 shows the permeameter used in this research.
To begin the procedure, the height and diameter of an asphalt specimen was
measured and recorded to the nearest 0.5 mm at three different locations. The samples
tested were consistently 75mm in height and 150 mm in diameter.
The asphalt samples were required to reach a saturated state during the
permeability test. In order to assist in saturating the samples before the test, the samples
were completely submerged in water for one to two hours. Once the samples were
saturated, they were removed and the sides were wiped with a towel to remove water.
Figure 3.2: HMAC Permeameter Used During Research
33
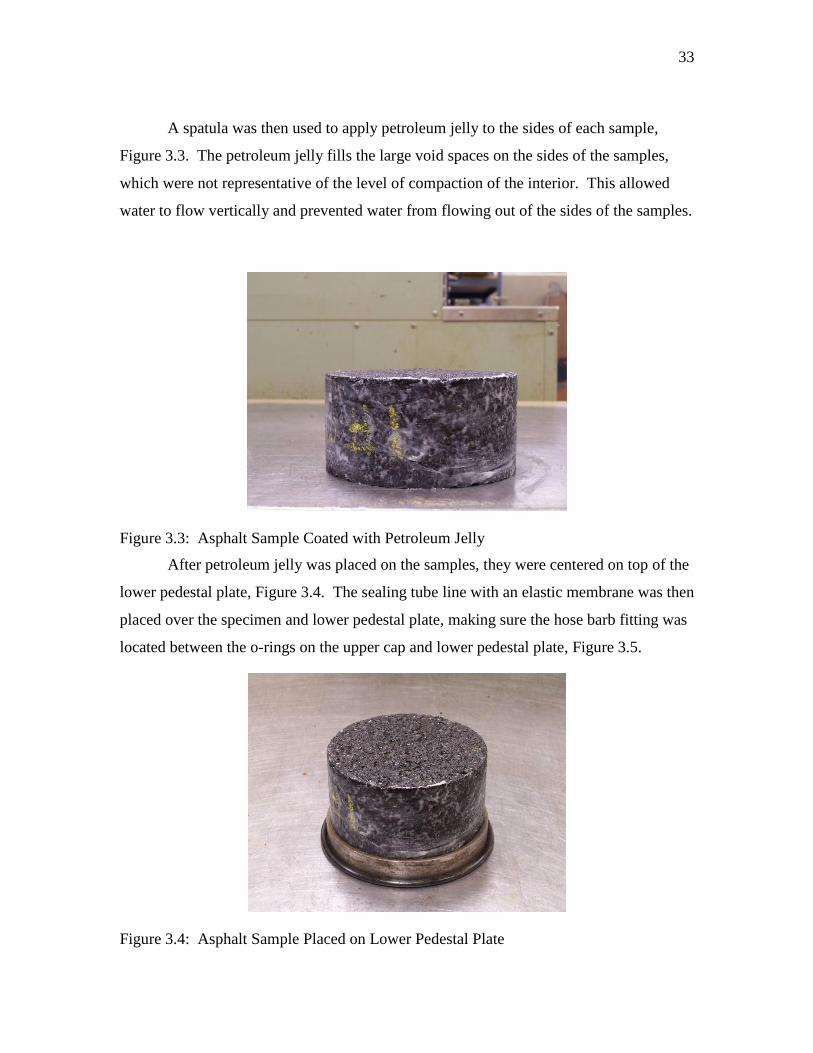
A spatula was then used to apply petroleum jelly to the sides of each sample,
Figure 3.3. The petroleum jelly fills the large void spaces on the sides of the samples,
which were not representative of the level of compaction of the interior. This allowed
water to flow vertically and prevented water from flowing out of the sides of the samples.
Figure 3.3: Asphalt Sample Coated with Petroleum Jelly
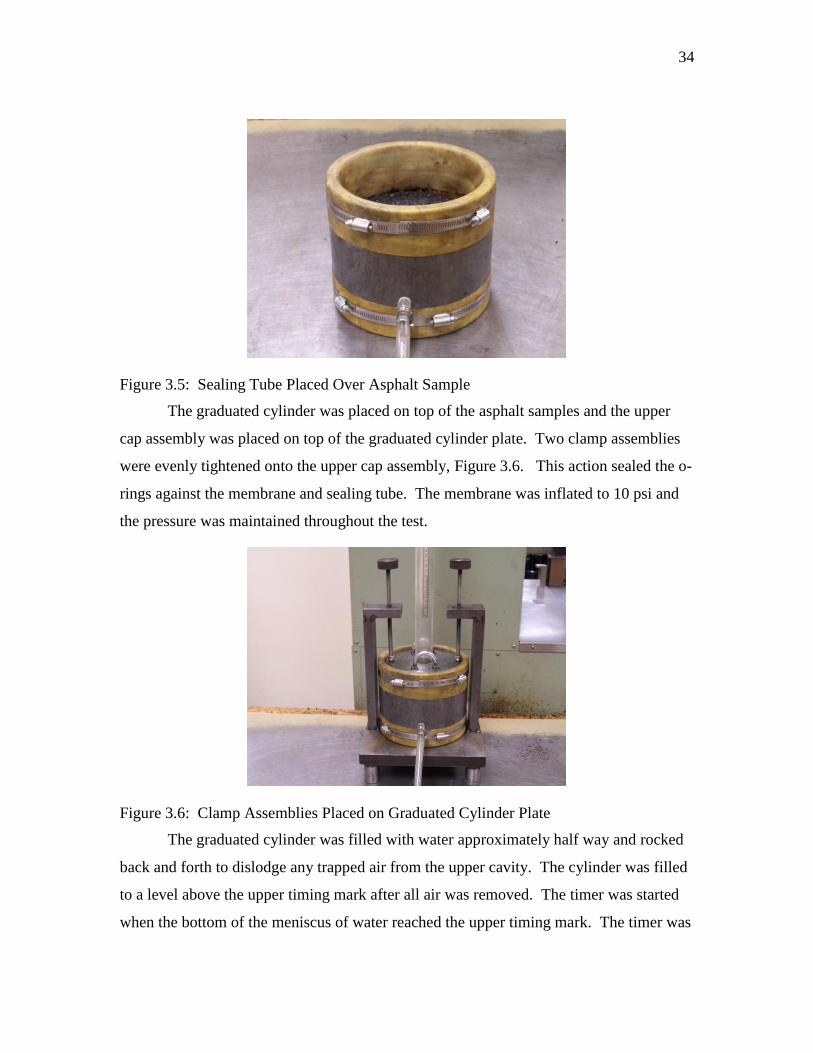
After petroleum jelly was placed on the samples, they were centered on top of the
lower pedestal plate, Figure 3.4. The sealing tube line with an elastic membrane was then
placed over the specimen and lower pedestal plate, making sure the hose barb fitting was
located between the o-rings on the upper cap and lower pedestal plate, Figure 3.5.
Figure 3.4: Asphalt Sample Placed on Lower Pedestal Plate
34
Figure 3.5: Sealing Tube Placed Over Asphalt Sample
The graduated cylinder was placed on top of the asphalt samples and the upper
cap assembly was placed on top of the graduated cylinder plate. Two clamp assemblies
were evenly tightened onto the upper cap assembly, Figure 3.6. This action sealed the o-
rings against the membrane and sealing tube. The membrane was inflated to 10 psi and
the pressure was maintained throughout the test.
Figure 3.6: Clamp Assemblies Placed on Graduated Cylinder Plate
The graduated cylinder was filled with water approximately half way and rocked
back and forth to dislodge any trapped air from the upper cavity. The cylinder was filled
to a level above the upper timing mark after all air was removed. The timer was started
when the bottom of the meniscus of water reached the upper timing mark. The timer was

35
stopped when the bottom of the meniscus reached the lower timing mark. The time was
recorded to the nearest second. This test was performed three consecutive times until the
difference between the first and third test was less than four percent. The temperature
was recorded to the nearest 0.1°C (0.2°F).
The coefficient of permeability, k, is calculated using equation 2.3
3.4 INDIRECT TENSION TEST PROCEDURE
An indirect tension (IDT) strength test was performed to evaluate the rut
resistance of the hot mix asphalt concrete (HMAC) design used in this research. The
samples were prepared by placing them in an oven for one to two hours at 61°C. This
temperature was 9°C lower than the upper temperature rating of the binder.
Figure 3.7: Asphalt Sample in Oven at 61°C
Following temperature conditioning, the samples were placed in the testing
apparatus and immediately loaded to failure at a loading rate of 50 mm/min. The IDT
strength was calculated using equation 2.4. After the IDT strength was calculated, the
estimated maximum allowable design traffic for the mixture was estimated using
equation 2.5.
36
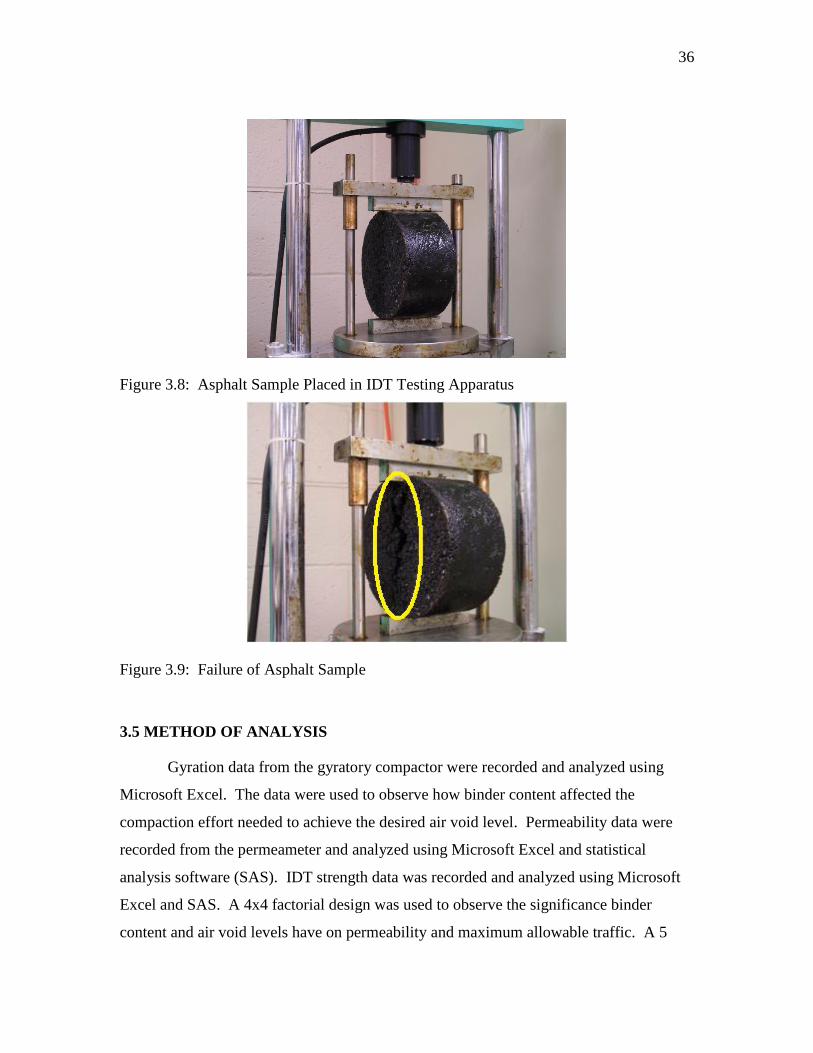
Figure 3.8: Asphalt Sample Placed in IDT Testing Apparatus
Figure 3.9: Failure of Asphalt Sample
3.5 METHOD OF ANALYSIS
Gyration data from the gyratory compactor were recorded and analyzed using
Microsoft Excel. The data were used to observe how binder content affected the
compaction effort needed to achieve the desired air void level. Permeability data were
recorded from the permeameter and analyzed using Microsoft Excel and statistical
analysis software (SAS). IDT strength data was recorded and analyzed using Microsoft
Excel and SAS. A 4x4 factorial design was used to observe the significance binder
content and air void levels have on permeability and maximum allowable traffic. A 5

37
percent confidence level was used to identify significance factors and interactions of
permeability and maximum allowable traffic. The primary factors of these tests were air
voids and binder content.
38
CHAPTER 4: RESULTS AND ANALYSIS
4.1 INTRODUCTION
Three factors affected by binder content were tested during this research:
Compaction effort
Permeability
Maximum allowable traffic estimated for rutting
The results were analyzed after all the samples were tested as described in
Chapter 3. Data from all factors were analyzed using Microsoft Excel for this research.
In addition, permeability and maximum allowable traffic data were analyzed using a 4x4
factorial design. Binder content and air void levels were examined using statistical
analysis software (SAS) to observe the significance they have on permeability and
maximum allowable traffic.
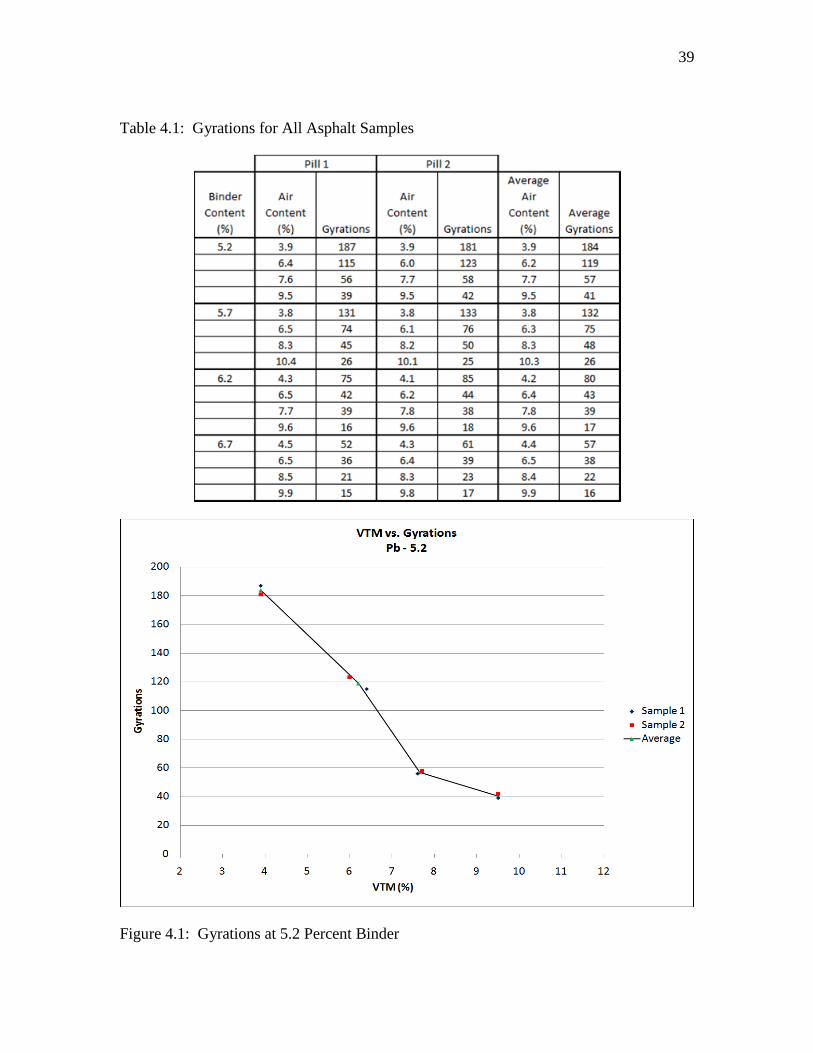
4.2 COMPACTION RESULTS
The number of gyrations that were needed to compact the asphalt samples in the
gyratory compactor to a height of 75 mm was recorded and analyzed. The results verify
that when binder content increased, the number of gyrations decreases. Table 4.1
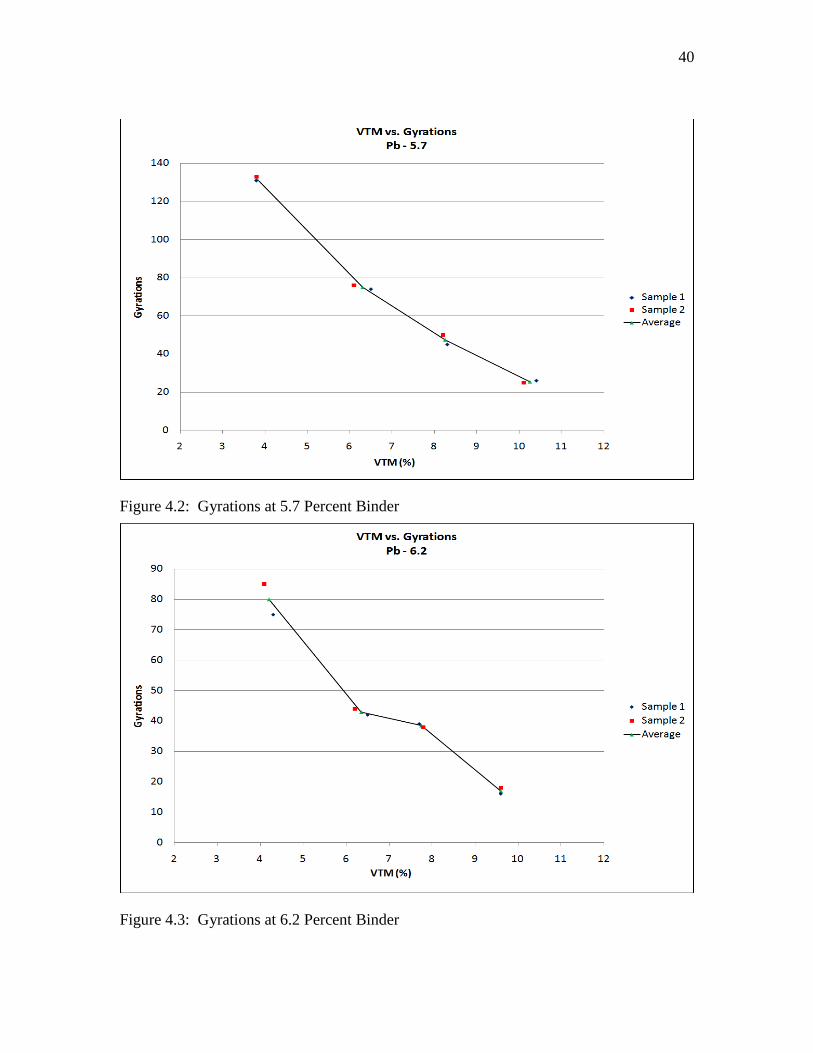
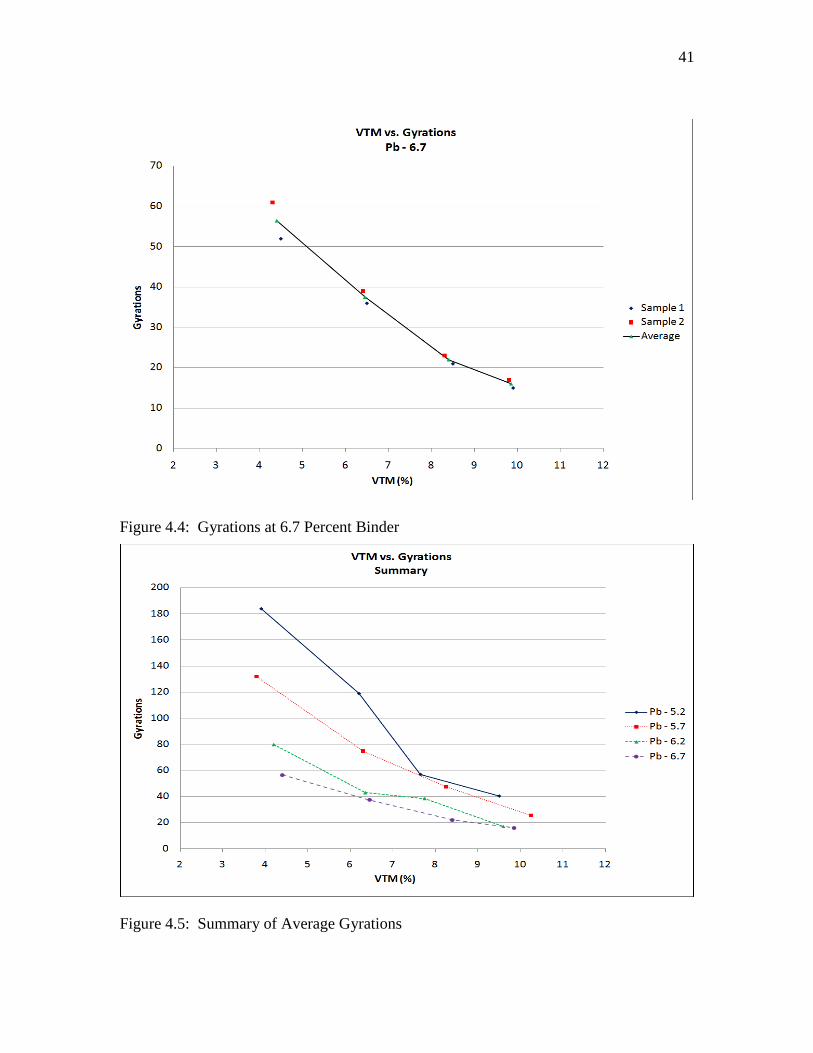
presents the gyratory results for all asphalt samples used in this research. Figures 4.1 to
4.4 present the gyrations for asphalt samples at each binder content. Figure 4.5 presents
the gyrations for all average binder contents. This figure demonstrates that compaction
effort, to achieve a specified level of density, reduces as asphalt content increases. The
West Virginia Division of Highways (WVDOH) implemented research recommendations
which should result in high design binder content. This should improve the ability of
contractors to achieve density during construction (Zaniewski et al., 2005).
39
Table 4.1: Gyrations for All Asphalt Samples
Figure 4.1: Gyrations at 5.2 Percent Binder
40
Figure 4.2: Gyrations at 5.7 Percent Binder
Figure 4.3: Gyrations at 6.2 Percent Binder
41
Figure 4.4: Gyrations at 6.7 Percent Binder
Figure 4.5: Summary of Average Gyrations

42
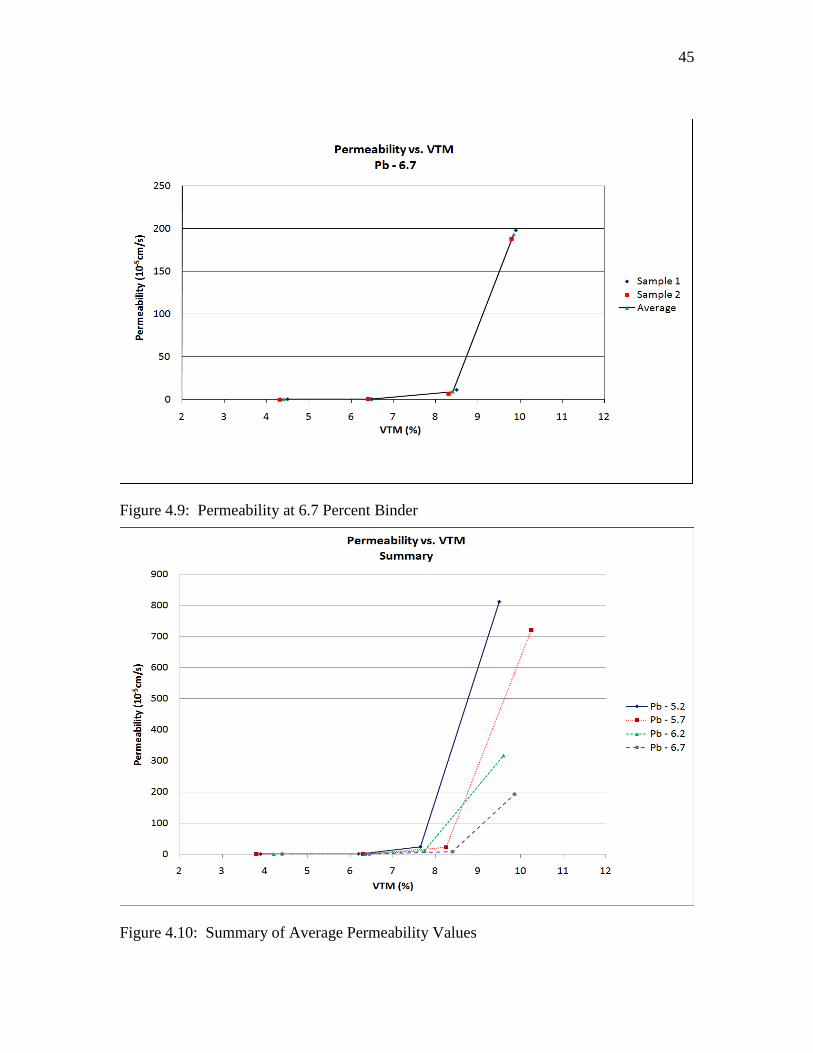
4.3 PERMEABILITY RESULTS
Asphalt samples were tested at four air void levels to observe how binder content
affects permeability. Results confirm that when air void levels increase, permeability
also increases; however, permeability is shown to decrease when binder content
increases. Permeability remains almost constant from 4 to 7 percent air content.
Permeability is shown to drastically increase at 8 percent air content and above. Table
4.2 presents the permeability results for all asphalt samples used in this research. Figures
4.6 to 4.9 present how permeability is affected by binder content at various air void
levels. Figure 4.10 presents a summary of average permeability values at each binder
content.
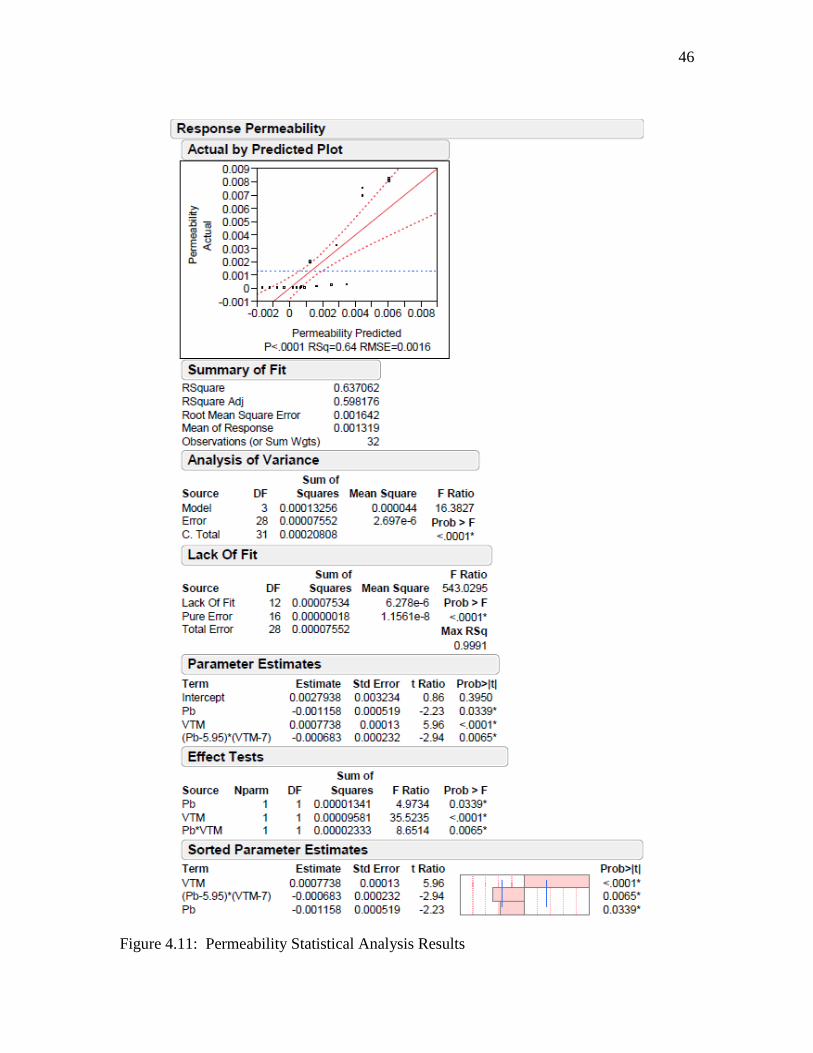
A statistical analysis was performed using a 4x4 factorial design. A 5 percent
confidence level was used to identify significant factors and interactions. The primary
factors of air voids and percent binder were significant. In addition, their interaction was
significant. The sign on the coefficient estimate given in Figure 4.11 demonstrates
increasing air voids increases permeability and increasing binder content reduces
permeability as would be expected. Figure 4.11 presents the results of the statistical
analysis.
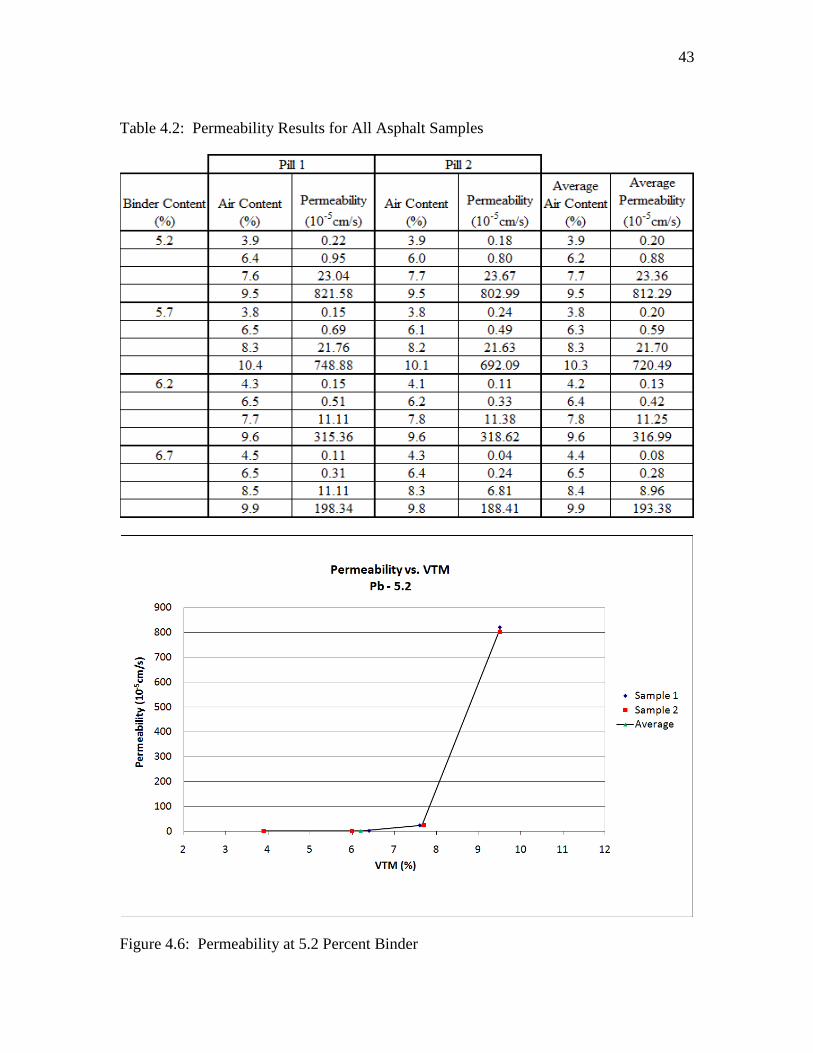
43
Table 4.2: Permeability Results for All Asphalt Samples
Figure 4.6: Permeability at 5.2 Percent Binder

44
Figure 4.7: Permeability at 5.7 Percent Binder
Figure 4.8: Permeability at 6.2 Percent Binder
45
Figure 4.9: Permeability at 6.7 Percent Binder
Figure 4.10: Summary of Average Permeability Values
46
Figure 4.11: Permeability Statistical Analysis Results

47
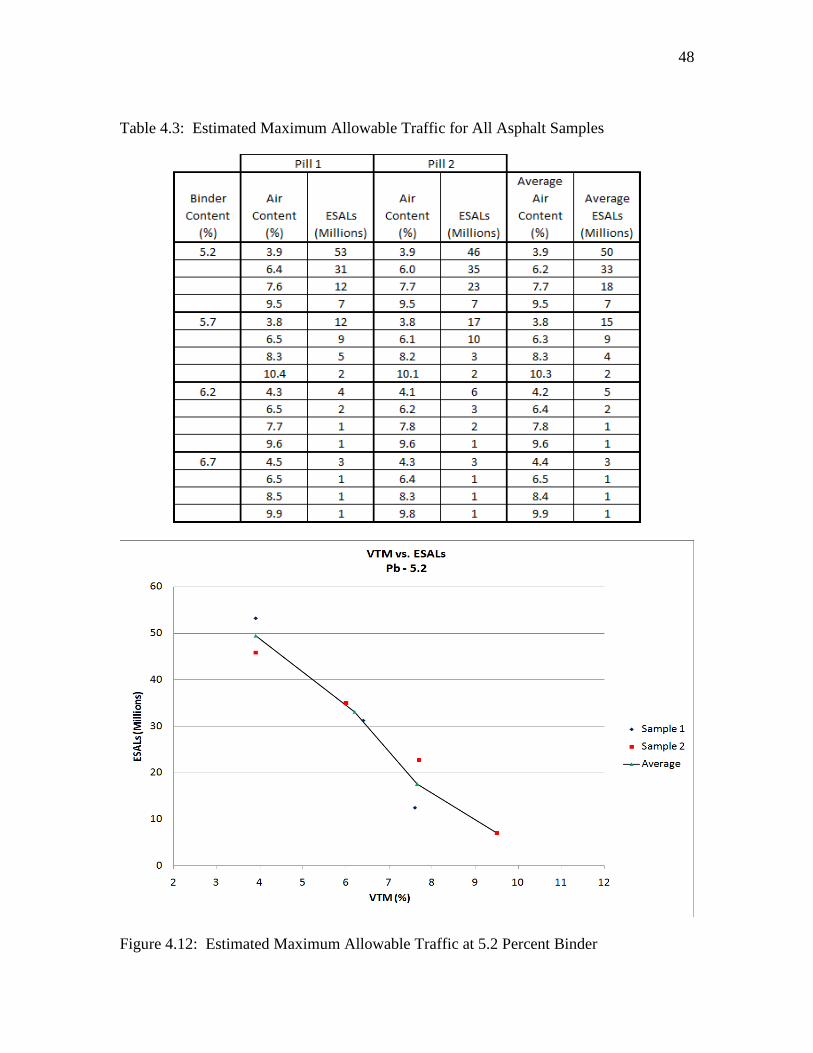
4.4 INDIRECT TENSION TEST RESULTS
An IDT strength test was performed to analyze the rutting resistance of the mix
design. The result of this test demonstrates that when binder content is increased, the
estimated maximum allowable traffic decreases. Table 4.3 presents the estimated
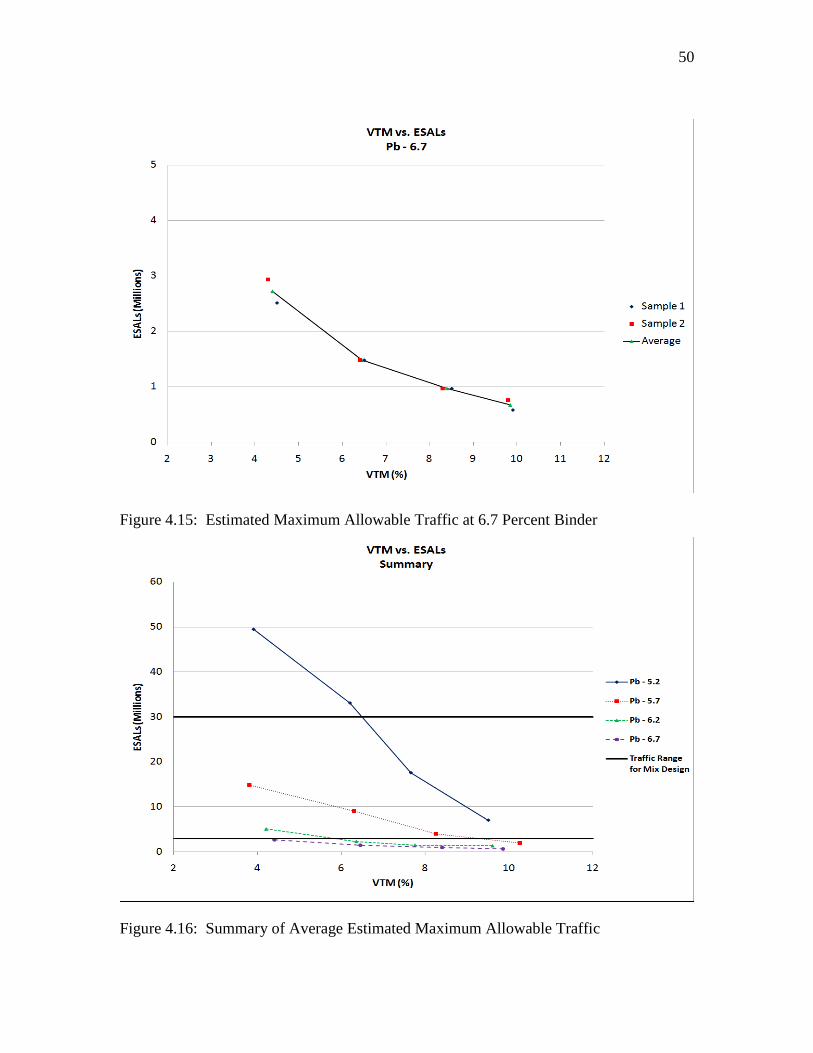
maximum allowable traffic for all asphalt samples. Figures 4.12 to 4.15 present how
binder content affects estimated maximum allowable traffic at various air void levels.
Figure 4.16 presents the average estimated maximum allowable traffic at each binder
content. Included in this graph is the specified ESAL range (3 to 30 million) of the mix
design used in this research. Samples containing 5.2 and 5.7 percent binder stayed within
this range from 4 to 8 percent air content. Samples containing 6.2 and 6.7 percent binder
fell below the minimum ESAL range from 5 to 10 percent air content.
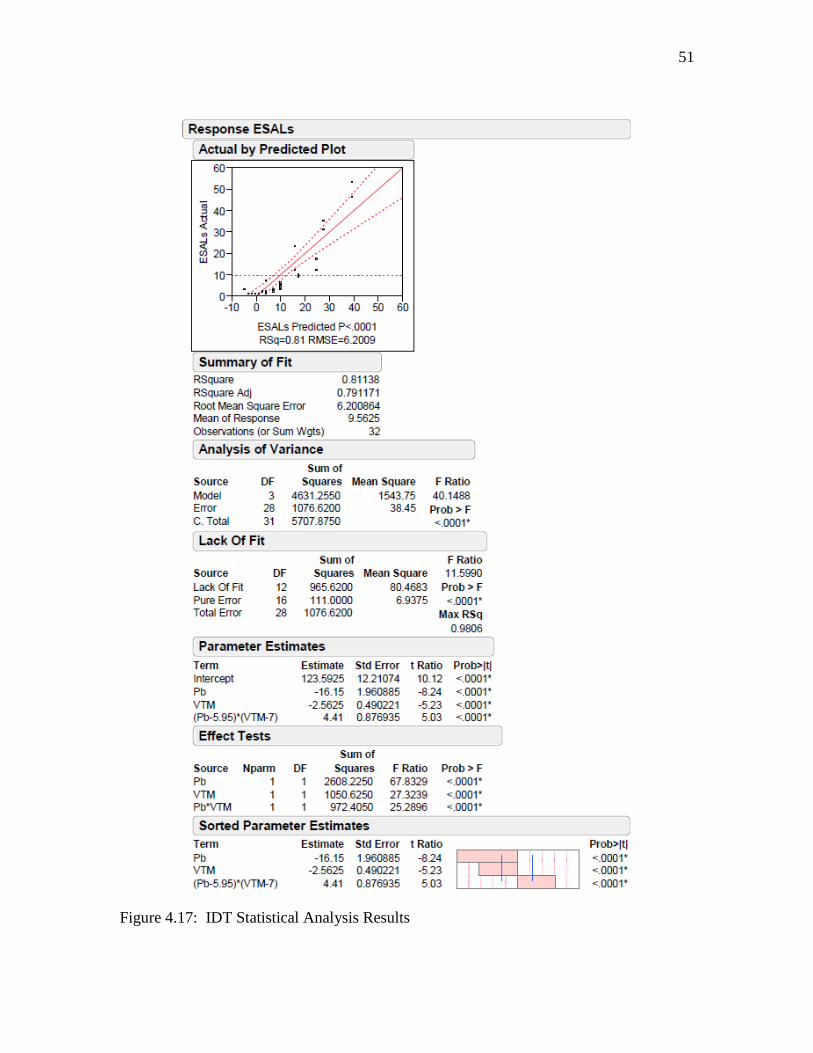
A statistical analysis was performed using a 4x4 factorial design. A 5 percent
confidence level was used to identify significant factors and interactions. The primary
factors of air voids and percent binder were significant. In addition, their interaction was
significant. The sign on the coefficient estimate given in Figure 4.17 demonstrates
increasing air voids reduces estimated maximum allowable traffic and increasing binder
content also reduces maximum allowable traffic as would be expected. Figure 4.17
presents the statistical analysis results of the IDT strength test.
Figure 4.16 demonstrates that the estimated rutting potential increases as asphalt
content and air voids increases. This is compatible with expectation from the literature.
If the Christensen (2007) model, equation 3.3, is correct, Figure 4.16 demonstrates that
care must be used when implementing specifications that will increase asphalt content.
48
Table 4.3: Estimated Maximum Allowable Traffic for All Asphalt Samples
Figure 4.12: Estimated Maximum Allowable Traffic at 5.2 Percent Binder
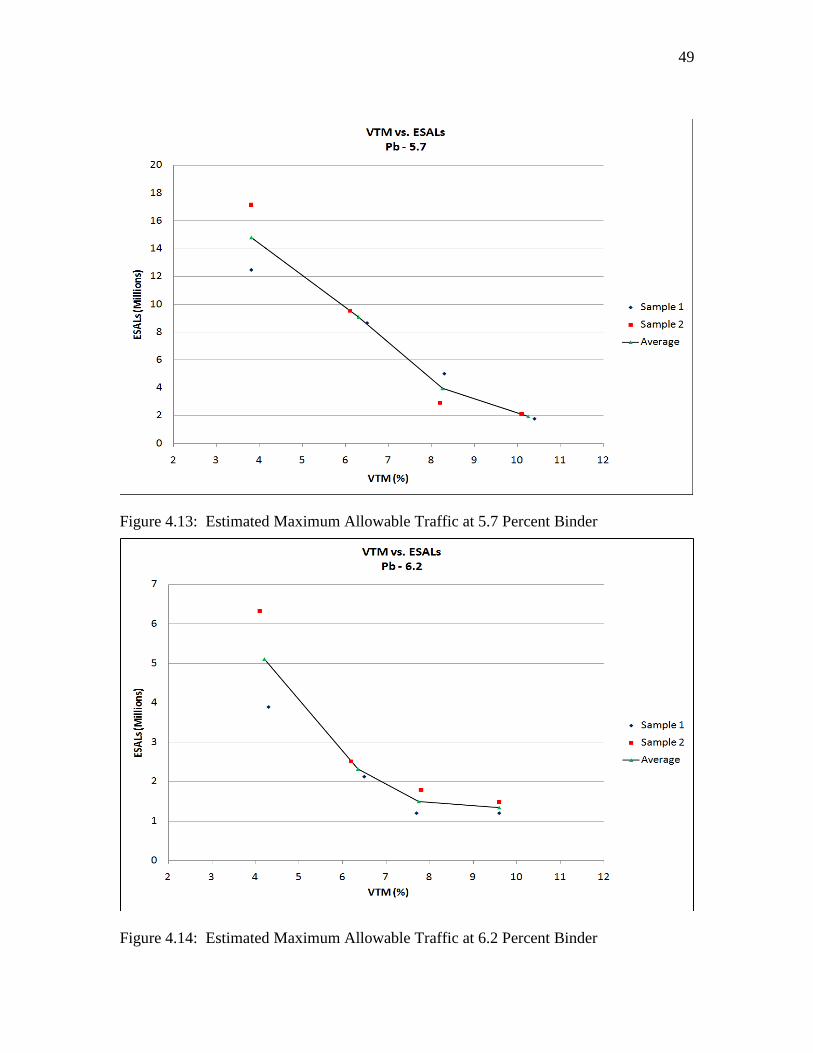
49
Figure 4.13: Estimated Maximum Allowable Traffic at 5.7 Percent Binder
Figure 4.14: Estimated Maximum Allowable Traffic at 6.2 Percent Binder
50
Figure 4.15: Estimated Maximum Allowable Traffic at 6.7 Percent Binder
Figure 4.16: Summary of Average Estimated Maximum Allowable Traffic
51
Figure 4.17: IDT Statistical Analysis Results
52
CHAPTER 5: CONCLUSIONS AND RECOMMENDATIONS
5.1 CONCLUSIONS
The gyratory data gathered from this research confirms that the number of
gyrations needed to compact a sample to a desired height is reduced when increasing the
amount of binder in a mixture. This principle also applies when compacting a pavement
to a specified density. The number of passes a roller is required to make is reduced by
increasing the amount of binder in a mixture, although, if excessive amounts of binder are
used, the likelihood of rutting is greatly enhanced.
The permeability data gathered from this research confirms that when increasing
air void levels, permeability is shown to increase as expected. Also, when the amount of
binder is increased, it fills the available air voids and decreases permeability. Results
verify that permeability remains almost constant from 4 to 7 percent air void content.
Permeability is shown to drastically increase at 8 percent air void content and above. The
statistical analysis performed verifies this result and concludes that both binder content
and air void levels significantly affect permeability.
The indirect tension (IDT) strength data gathered from this research confirms that
when increasing binder content, rutting resistance decreases. The mix design used in this
research had an ESAL range of 3 to 30 million. Samples containing 5.2 and 5.7 percent
binder stayed within this range from 4 to 8 percent air content. Samples containing 6.2
and 6.7 percent binder fell below the minimum ESAL range from 5 to 10 percent air void
content. The statistical analysis performed verifies the results of this test. Both binder
content and air void levels are shown to significantly affect rutting resistance.
5.2 RECOMMENDATIONS
Permeability testing using the Florida Method of Test proved to be an easy and
effective way to test the permeability of compacted hot mix asphalt samples. This
research consisted of only three aggregate types, one nominal maximum aggregate size
(NMAS), and one gradation. Further research is required to fully understand the effects
of binder content on permeability.

53
Multiple NMAS and gradations, both coarse and fine, should be tested. Also,
more aggregate types such as crushed aggregates, slag, and various types of sand should
be tested. Since this test proved to be both cost and time effective, permeability testing
should be included as part of the mix design process.
The results of the permeability research show that asphalt becomes permeable
when air voids reach approximately 8 percent. Current WVDOH specifications state that
asphalt air void contents must be between 4 and 8 percent. Changing maximum air void
content specification from 8 to 7 percent should decrease the possibility for pavements to
reach the threshold where permeability drastically increases.
The state has issued a supplemental specification, effective for the 2010
construction season, which should promote increased binder content of SuperPave
mixtures. This should improve the compactibility and long term durability of the
mixtures. However, the rutting resistance of the mixtures may be compromised.
Samples of mixtures used during the 2010 construction season should be sent to the West
Virginia University Asphalt Technology Laboratory for rutting evaluation.
54
REFERENCES
Brown, E. R., Collins, R., and Brownfield, J. R. “Investigation of Segregation of
Asphalt Mixtures in the State of Georgia” Transportation Research Record 1217,
TRB, National Research Council, Washington, DC, 1989.
Christensen, D., Bonaquist, R. “Using the Indirect Tension Test to Evaluate Rut
Resistance in Developing Hot-Mix Asphalt Mix Designs” Advanced Asphalt
Technologies, 2007.
Cooley, Jr., L. A. “Permeability of SuperPave Mixtures: Evaluation of Field
Parameters” NCAT Report 99-1, February 1999.
Cooley, Jr., L. A., Prowell, B., and Brown, E. R. “Issues Pertaining to the Permeability
Characteristics of Coarse-Graded SuperPave Mixes” NCAT Report 02-06, July
2002.
“Factors Affecting HMA Permeability” February 2005.
<http://www.wsdot.wa.gov/biz/mats/Pavement/TechNotes/FactorsAffectingHMA
PermeabilityTN2007.pdf> (June 5, 2009)
Florida Department of Transportation “Florida Method of Test for Measurement of Water
Permeability of Compacted Asphalt Paving Mixtures” December 27,
2004.<http://www.qcqa.com/docs/doc_238.pdf> (June 5, 2009)
Ford, M. C., and McWilliams, C. E. “Asphalt Mix Permeability” University of Arkansas,
Fayettville, AR, 1988.
Gogula, A., Hossain, M., and Romanoschi, S. “A Study of Factors Affecting the
Permeability of SuperPave Mixes in Kansas”, Final Report. Technical Report
KSU-00-2, November 2004.
Hudson, S. B., and Davis, R. L. “Relationship of Aggregate Voidage to Gradation”
Association of Asphalt Paving Technologists, Volume 34. 1965.
Kandhal, P., Rickards, I. “Premature Failure of Asphalt Overlays From Stripping: Case
Histories” NCAT Report 01-01, April 2001.
Mallick, R. B., Cooley, Jr., L. A., and Teto, M., Bradbury, R., Peabody, D. “An
Evaluation of Factors Affecting Permeability of SuperPave Designed
Pavements” NCAT Report 03-02, June 2003.
Mallick, R. B., Cooley, Jr., L. A., and Teto, M. “Evaluation of Permeability of SuperPave
Mixes in Maine”, Final Report. Technical Report ME-001, November 1999.
55
Maupin, Jr., G. W. “Investigation of Test Methods, Pavements, and Laboratory Design
Related to Asphalt Permeability”, Final Report. Technical Report VTRC 00- R24,
June 2000.
Mohammad, L., Herath, A., and Huang, B. “Evaluation of Permeability of SuperPave
Asphalt Mixtures” TRB 2003 Annual Meeting CD-ROM
Musselman, J. A., Choubane, B., Page, G. C., and Upshaw, P. B. “SuperPave Field
Implementation: Florida’s Early Experience” Transportation Research
Record 1609, 1998.
"Porosity and Permeability" World of Earth Science. Ed. K. Lee Lerner and Brenda
Wilmoth Lerner. Gale Cengage, 2003. eNotes.com. 2006.
<http://www.enotes.com/earth-science/porosity-permeability> (June 5, 2009)
Roberts, F. L., Kandhal, P. S., Brown, E. R., Lee, D. Y., and Kennedy, T. W. “Hot Mix
Asphalt Materials, Mixture Design, and Construction” NAPA Education
Foundation, Lanham, MD. Second Ed., 1996.
Russell, J. S., Bahia, H. U., Kanitpong, K., Schmitt, R. L., and Crovetti, J. C. “The Effect
of Pavement Thickness on SuperPave Mix Permeability and Density”, Final
Report. Project 0092-04-02c, Wisconsin Department of Transportation,
Wisconsin Highway Research Program, Madison, WI, 2004.
“SuperPave Construction Guidelines” National Asphalt Pavement Association. Special
Report 180. Lanham, Maryland. October 1997.
Zaniewski, J.P., Adams, T. “Evaluation of Quality Control Parameters for SuperPave
Hot Mix Asphalt”WVODH Reports. Asphalt Technology Program, 2005
Zube, E., “Compaction Studies of Asphalt Concrete Pavements as Related to the
Water Permeability Test” Highway Research Board, Bulletin 358, TRB, National
Research Council, Washington, DC, 1962.