perinatal energy substrate metabolism - diva portal
TRANSCRIPT

Digital Comprehensive Summaries of Uppsala Dissertationsfrom the Faculty of Medicine 22
Perinatal Energy Substrate Metabolism
BARBRO DIDERHOLM
Glucose Production and Lipolysis in Pregnant Women and Newborn Infants with Particular Reference to Intrauterine Growth Restriction (IUGR)
ISSN 1651-6206ISBN 91-554-6186-7urn:nbn:se:uu:diva-4842
ACTAUNIVERSITATIS
UPSALIENSISUPPSALA
2005

ISBN

To my, beautiful, beloved daughter Agnes,being born both preterm and small, now growing, arguing and understanding.


List of papers
The thesis is based on the following papers, which will be referred to in the text by their Roman numerals:
I Diderholm B, Stridsberg M, Lindeberg-Nordén S, Ewald U, Gustafsson J. Increased lipolysis in non-obese pregnant women studied in the third trimester. BJOG 2004 (online publication date 17-Dec-2004).
II Diderholm B, Stridsberg M, Nordén-Lindeberg S, Gustafsson J De-creased maternal lipolysis in intrauterine growth restriction (IUGR) in the third trimester. Submitted
III Diderholm B, Ewald U, Gustafsson J. Effect of theophylline on glucose production and lipolysis in preterm infants ( 32 weeks). Pediatr Res 1999;45:674-9.
IV Diderholm B, Ewald U, Ahlsson F, Gustafsson J Energy substrate pro-duction in infants born small for gestational age (SGA). Manuscript


Contents
Introduction...................................................................................................11
Background...................................................................................................13Fetal growth..............................................................................................13Energy metabolism in pregnancy .............................................................14
Energy balance ....................................................................................14Hormonal changes ...............................................................................14Energy substrates .................................................................................15Placental transport of energy substrates...............................................16
Factors modifying the growth of the fetus ...............................................17Intrauterine growth restriction .............................................................17
Birth..........................................................................................................18Postnatal metabolic adaptation.................................................................19Preterm infants .........................................................................................19
Drugs with metabolic effects used in the perinatal period...................20Small for gestational age infants ..............................................................21
Consequences of disturbed perinatal energy metabolism....................21
Aims of the studies........................................................................................22
Subjects .........................................................................................................23Pregnant women, studies I and II .............................................................23Newborn infants, studies III and IV .........................................................24
Methods ........................................................................................................26Stable isotope dilution technique .............................................................26
Analysis by gas chromatography-mass spectrometry..........................27Materials...................................................................................................28
Stable isotope labelled compounds......................................................28Experimental design.................................................................................28Chemical procedures ................................................................................28Gas chromatography-mass spectrometry .................................................29Calculations..............................................................................................29Statistical analyses....................................................................................29

Results...........................................................................................................30Pregnant women, studies I and II .............................................................30Newborn infants, studies III and IV .........................................................32
Discussion.....................................................................................................36Summary and conclusions........................................................................41
Acknowledgements.......................................................................................42
References.....................................................................................................45
Cover: An embyo in the womb, 1512 by Leonardo da Vinci.
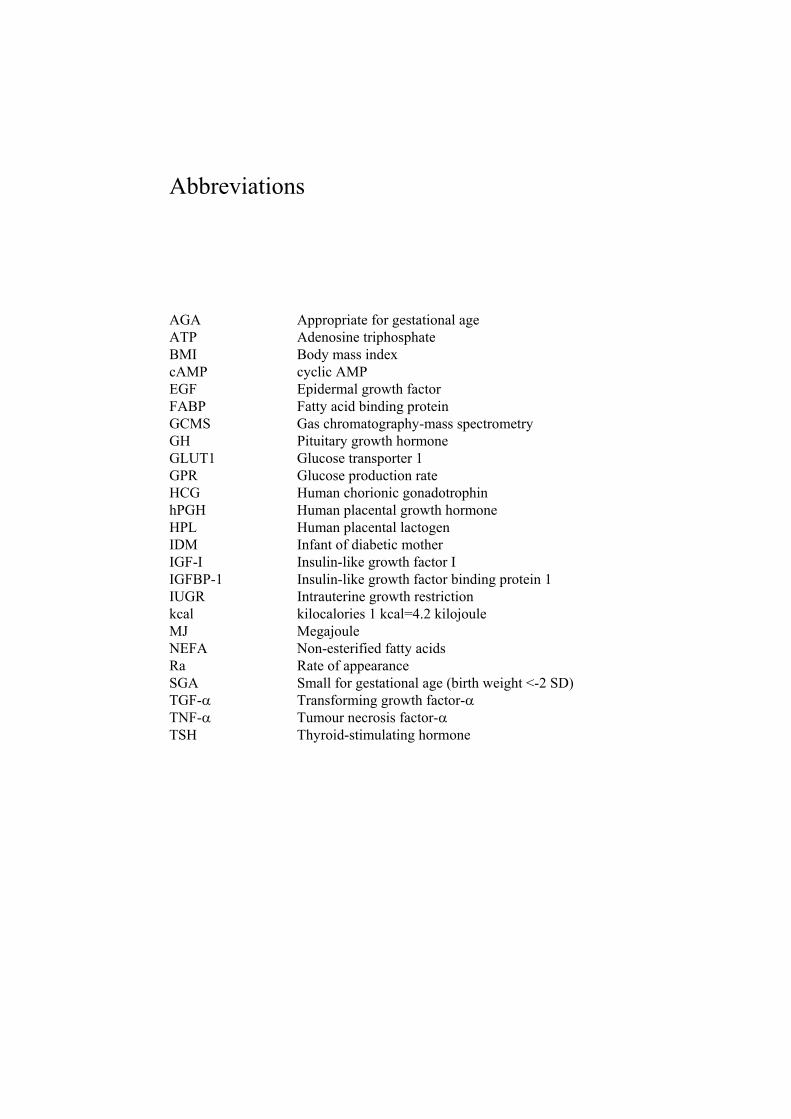
Abbreviations
AGA Appropriate for gestational age ATP Adenosine triphosphate BMI Body mass index cAMP cyclic AMP EGF Epidermal growth factor FABP Fatty acid binding protein GCMS Gas chromatography-mass spectrometry GH Pituitary growth hormone GLUT1 Glucose transporter 1 GPR Glucose production rate HCG Human chorionic gonadotrophin hPGH Human placental growth hormone HPL Human placental lactogen IDM Infant of diabetic mother IGF-I Insulin-like growth factor I IGFBP-1 Insulin-like growth factor binding protein 1 IUGR Intrauterine growth restriction kcal kilocalories 1 kcal=4.2 kilojoule MJ Megajoule NEFA Non-esterified fatty acids Ra Rate of appearance SGA Small for gestational age (birth weight <-2 SD) TGF- Transforming growth factor-TNF- Tumour necrosis factor-TSH Thyroid-stimulating hormone


11
Introduction
During pregnancy the growth of the fetus is dependent on a continuous flow of nutrients from the mother. Glucose is the most important energy substrate in the growing fetus, followed by amino acids, lactate and to a lesser extent non-esterified fatty acids (NEFA). Most of the glucose is used by the rela-tively large fetal brain.1 Glucose is transported across the placental barrier through facilitated diffusion mediated by glucose transporter 1 (GLUT1).2Pregnant women increase their glucose production during pregnancy to meet the demands of the growing fetus.3-5 The third trimester is characterised by increasing insulin resistance.4, 6, 7 This together with the insulin antagonistic and lipolytic effects of pregnancy-specific hormones8 promotes the utilisa-tion of fatty acids as energy substrates for the mother, saving glucose and amino acids for the fetus.9-12 Fetal growth is sometimes disturbed. Factors underlying intrauterine growth restriction (IUGR) can be of maternal, pla-cental or fetal origin. Often, however, there is no obvious explanation.13
Birth terminates the flow of energy substrates from the mother. Thus, mobilisation of endogenous energy sources in the infant is necessary until breastfeeding is established. Immediately after birth the infant’s glucose concentration falls, resulting in a decrease in the insulin level and an increase in counter-regulating hormones, mainly catecholamines and glucagon. These changes stimulate glycogenolysis and gluconeogenesis and also lipolysis (Fig.1). In addition, the increase in the circulating level of thyroid-stimulating hormone (TSH) directly after birth is a strong stimulus for lipolysis.14
Preterm infants have small substrate stores and may have immature hor-mone and enzyme systems.15 Together, this can result in insufficient energy substrate production. The immature glucose homeostasis can also lead to hyperglycaemia. Recurrent perinatal hypo- or hyperglycaemia increases the risk of adverse neurological development.16, 17
There are drugs used neonatally which influence the metabolism of glu-cose and lipids. One such drug is theophylline,18 which is often administered in preterm infants to prevent apnoea of prematurity.19
Small for gestational age (SGA) infants have reduced stores of glycogen and fat, with a consequently increased risk of hypoglycaemia. There is also evidence for increased glucose consumption due to the relatively large brain:body mass ratio.20 In addition, infants born SGA may, like preterm

12
infants, have delayed maturation of the gluconeogenic pathways.21, 22 There are also reports of a defective counter-regulation of hypoglycaemia23 and occurrence of hyperinsulinism.23, 24 The association between being born SGA and the development of the metabolic syndrome later in life,25 raises ques-tions about perinatal energy metabolism and its regulation.
GlycolysisGluconeogenesis
Glucose
Glycogen
Pyruvate
LactateAlanine
Acetyl-CoA
Triacyl-glycerol
Glycerol
NEFA Oxaloacetate
-Ketoglutarate
Amino acids
Phosphoenol-pyruvate
Citric acid cycle-oxidation
Glycogenolysis
Lipolysis
Figure 1. Pathways for glucose metabolism (NEFA= non-esterified fatty acids).

13
Background
Fetal growth During the first phase of pregnancy the growth of the embryo is autonomous and is controlled by oncogenes and growth factors such as, transforming growth factor- (TGF- ) and epidermal growth factor (EGF).26 Embryonic growth is achieved mainly by an increase in the number of cells. Fetal growth first takes place by cell division and also by hyperplasia and later mainly by an increase in cell size.27 The growth of the fetus relies upon the nutrient and oxygen supply as well as on insulin, insulin-like growth factor-I (IGF-I) and other growth factors.26 In the second trimester differentiation of the organs takes place. The growth in length is most pronounced during this period and has its peak in the 20th week of gestation (Fig. 2). During the third trimester there is a marked increase in weight, mainly through accretion of fat and proteins.28 The size of the fat depots, which depends on the availabil-ity of maternal energy substrates and the fetal response to their transfer, is one of the determinants of birth weight.28
Figure 2. Weight and crown-rump length during human development. (Data from Moore KL, Persaud TVN: The developing human: Clinically oriented embryology, 6th ed. Philadelphia, Saunders, 1998)
14
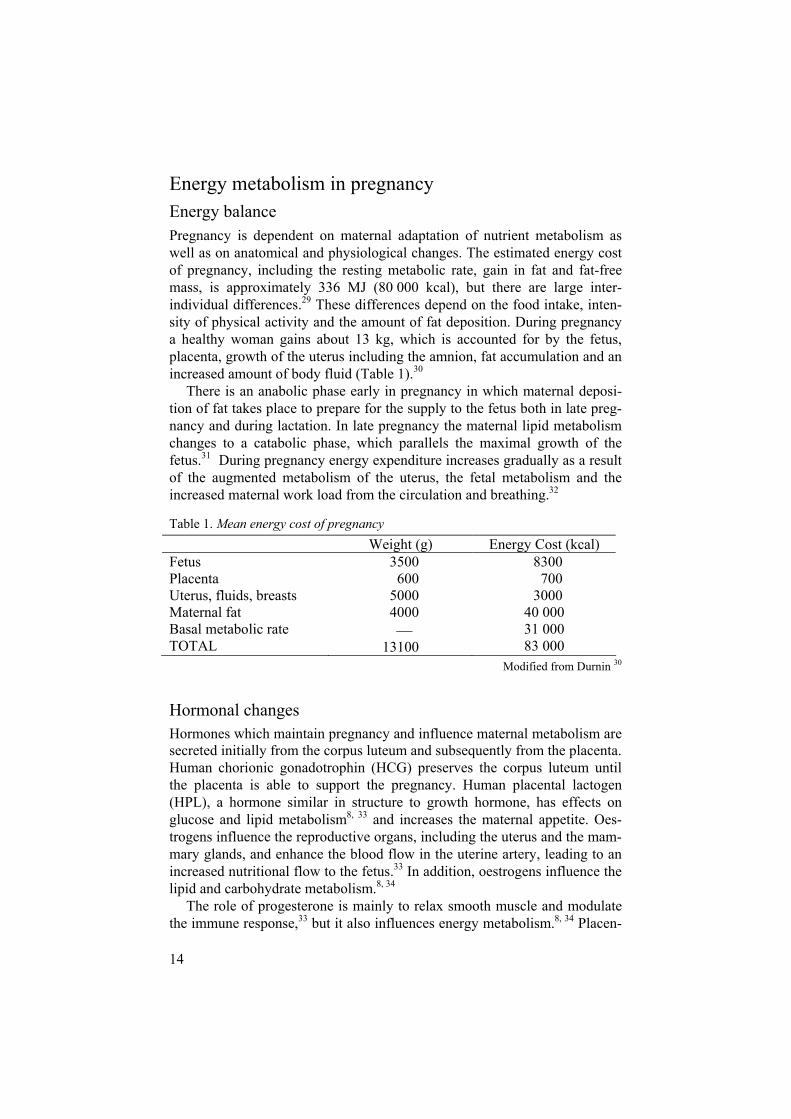
Energy metabolism in pregnancy Energy balance Pregnancy is dependent on maternal adaptation of nutrient metabolism as well as on anatomical and physiological changes. The estimated energy cost of pregnancy, including the resting metabolic rate, gain in fat and fat-free mass, is approximately 336 MJ (80 000 kcal), but there are large inter-individual differences.29 These differences depend on the food intake, inten-sity of physical activity and the amount of fat deposition. During pregnancy a healthy woman gains about 13 kg, which is accounted for by the fetus, placenta, growth of the uterus including the amnion, fat accumulation and an increased amount of body fluid (Table 1).30
There is an anabolic phase early in pregnancy in which maternal deposi-tion of fat takes place to prepare for the supply to the fetus both in late preg-nancy and during lactation. In late pregnancy the maternal lipid metabolism changes to a catabolic phase, which parallels the maximal growth of the fetus.31 During pregnancy energy expenditure increases gradually as a result of the augmented metabolism of the uterus, the fetal metabolism and the increased maternal work load from the circulation and breathing.32
Table 1. Mean energy cost of pregnancy Weight (g) Energy Cost (kcal) FetusPlacentaUterus, fluids, breasts Maternal fat Basal metabolic rate TOTAL
3500 600 5000 4000
13100
8300 700 3000 40 000 31 000 83 000
Modified from Durnin 30
Hormonal changes Hormones which maintain pregnancy and influence maternal metabolism are secreted initially from the corpus luteum and subsequently from the placenta. Human chorionic gonadotrophin (HCG) preserves the corpus luteum until the placenta is able to support the pregnancy. Human placental lactogen (HPL), a hormone similar in structure to growth hormone, has effects on glucose and lipid metabolism8, 33 and increases the maternal appetite. Oes-trogens influence the reproductive organs, including the uterus and the mam-mary glands, and enhance the blood flow in the uterine artery, leading to an increased nutritional flow to the fetus.33 In addition, oestrogens influence the lipid and carbohydrate metabolism.8, 34
The role of progesterone is mainly to relax smooth muscle and modulate the immune response,33 but it also influences energy metabolism.8, 34 Placen-

15
tal growth hormone (hPGH) replaces pituitary growth hormone (GH) in mid-gestation.35 In contrast to GH, hPGH is not secreted in a pulsatile manner.36
The effects of hPGH are only exerted in the mother, and result in stimulation both of glucose production and lipolysis. These effects are most pronounced in late gestation.35, 37
In spite of normal or improved insulin sensitivity the insulin secretion is increased following a glucose load in early pregnancy.4, 38 This increase is at least partly due to the influence of oestrogen.39 Together with an increased appetite and the influence of cortisol and progesterone, the enhanced insulin secretion results in stimulation of lipogenesis and deposition of maternal body fat.39, 40
As pregnancy proceeds, insulin resistance gradually develops both pe-ripherally and in the liver.4 Euglycaemic-hyperinsulinaemic clamp studies have shown a reduction of the peripheral insulin sensitivity in late pregnancy of up to 50%.4 Many possible factors underlying the insulin resistance have been investigated. It has been suggested, for example that increasing levels of hormones including HPL, hPGH, prolactin, cortisol, progesterone and oestrogens decrease insulin sensitivity.34, 39, 41 Other contributory factors could be elevated levels of NEFA12, 42 and tumour necrosis factor- F-
43 The decreased insulin sensitivity in late pregnancy directs glucose to the fetus.6, 7
Animal studies have shown that, the fetal production of IGF-I is stimu-lated by insulin and indirectly by the availability of glucose.44 There is a correlation between IGF-I levels in cord blood and infant size at birth.45 The effect of IGF-I is modulated by insulin-like growth factor binding protein-1 (IGFBP-1), the production of which is inhibited by insulin.46, 47 There is pla-cental production of IGF-I directed towards the maternal circulation, with increasing levels during progression of pregnancy.37, 48 Leptin levels in-crease during pregnancy, with a peak between 22 and 27 weeks of gestation. These levels are correlated to gestational weight gain, but not to birth weight.40
Energy substrates The most important energy substrate in the fetus is glucose (Fig. 3).27 Most of the fetal carbon comes from glucose49 and the fetal brain is an obligate glucose user.1 The estimated fetal glucose requirement in the third trimester will be covered by a 14% increase in maternal glucose production.39 Several studies have shown that the rate of maternal glucose production in late gesta-tion increases by 16-30% 3-5 in order to meet the needs of the fetus and pla-centa.1 Studies in sheep have shown that of the glucose consumed by the placenta, one-third is metabolised to lactate,50 part of which can be effi-ciently used by the fetus.1, 51

16
The insulin resistance of late pregnancy is responsible for the increase in glycogenolysis and gluconeogenesis. Kalhan et al.5 reported that total glu-cose production and gluconeogenesis increase with advancing gestation. The most important gluconeogenic substrates are alanine, pyruvate, lactate and, though to a smaller extent, glycerol. In non-pregnant women only ~4% of the plasma glucose pool comes from glycerol.52
Amino acids are used mainly for protein synthesis, but can also be utilised for gluconeogenesis. The hormones underlying the insulin resistance in late pregnancy also en-hance lipolysis.34 During fasting in the third trimester there is a more rapid shift from the use of carbohydrates to lipids as compared to that in non-pregnant women.10 The increased rate of lipolysis provides additional sub-strates for maternal energy metabolism, saving glucose and other substrates for the fetus.12, 53 In the fasting situation, ketone bodies are formed by -oxidation of NEFA. The ketone bodies can be used both as energy substrates and for lipid synthesis by the fetus.31
Glucose
Amino acids
NEFA
Ketones
CNSoxidation
Liverglycogen Adipose tissue
triglycerides
Muscle
Placenta
Figure 3. Energy substrates transported to and deposited in the fetus (NEFA=non-esterified fatty acids) Modified from ref.27
Placental transport of energy substrates Placental transport is dependent on the maternal-fetal gradient of energy substrates, the blood flow in the uterine artery and the density of specific

17
transport molecules, as well as on the area of the maternal-fetal interface.51
Glucose is transported from the mother to the fetus by facilitated diffusion via GLUT1.2 The rate of glucose transport via GLUT1 is insulin-independent and is determined by the gradient between the mother and the fetus. The fetal glucose level corresponds to ~75% of that in the mother.54
Amino acids are actively transported through transport proteins, resulting in a fetal-maternal gradient.55
The transport of lipids across the placenta is limited. NEFA in general cross the placenta by simple diffusion, but essential fatty acids are trans-ported actively via fatty acid binding proteins (FABPs).56 In early gestation embryonic and fetal lipids originate in maternal NEFA, which are trans-ported across the placenta, but in late pregnancy most of the fetal fat stores are synthesised from glucose.28 The transport of glycerol (a product of lipolysis) is also limited, but this can be used as a substrate for gluconeo-genesis in the mother.31 In the fasting situation maternal ketone bodies are readily transported to the fetus.57
Factors modifying the growth of the fetus Constitutional factors such as parental size and intergenerational effects of maternal birth weight have been found to be related to fetal growth.58 Fur-ther, studies have shown that socio-economic factors, for example poor sur-roundings, are associated with low birth weight.27, 59 Demographic factors are also known to influence the growth of the fetus.60 Maternal factors with an impact on fetal growth may include nutritional status, parity and chronic disease.27 Fetal factors are often related to chromosomal anomalies or ge-netic syndromes leading to growth restriction. However, some rare syn-dromes lead to increased fetal growth (e.g. Beckwith-Wiedemann and So-tos’s syndrome). In pregnancies complicated by diabetes mellitus, increased placental transport of glucose may lead to fetal macrosomia.61
Intrauterine growth restrictionThe concepts intrauterine growth restriction and small for gestational age are related but not synonymous. In IUGR there is a reduction in the expected fetal growth rate as judged by repeated ultrasound examinations. However, restricted fetal growth may not always result in an infant born SGA. Small for gestational age is a description of an infant whose birth weight is lower than normal in relation to the length of gestation. Different definitions have been used in the literature (<-2SD, <5th or <10th percentile). In this thesis the definition used is <-2 SD of the Swedish fetal growth chart,62 corresponding to approximately <3rd percentile. This definition is used clinically for the diagnosis of SGA in Sweden.

18
The incidence of IUGR is dependent on the population examined. Ap-proximately 4-8% of newborn infants in industrialised countries and 6-30% in developing countries are judged as growth-restricted.63 Of all infants weighing less than 2500 g approximately one third are considered to have IUGR.63
Among factors proven to cause IUGR, maternal malnutrition is the most common worldwide, but there are many other factors that can explain the condition (Table 2). In 40% of the cases no apparent underlying factor is found.13
Table 2. Factors underlying fetal growth restriction
MaternalDemographic Socio-economic Intergenerational (low maternal birth weight) Malnutrition Chronic disease Hypoxaemia (high altitude) Drugs Uterine constraint
PlacentalDefective placentation Placental dysfunction (pre-eclampsia, infarctions, bleeding, reduced area) Placental infection
FetalChromosomal disorders Congenital anomalies Fetal infections
BirthBirth terminates the continuous supply of nutrients from the mother and for the infant there is a change to intermittent feeding. Before breastfeeding is established, the newborn infant has to mobilise its energy depots. A term infant with a birth weight appropriate for gestational age (AGA) has glyco-gen sufficient for 10-12 hours of fasting and the fat stores can theoretically last for several weeks,64 but in preterm infants and infants born SGA the energy depots are diminished. Reduced energy depots may also be a conse-quence of anaerobic metabolism following asphyxia.

19
Postnatal metabolic adaptation The fall in blood glucose in the newborn infant immediately after birth alters the insulin/glucagon ratio and this, together with the catecholamine surge at birth, mobilises stored energy substrates (Fig. 4). A healthy newborn infant produces ~ 4 - 6 mg . kg-1 . min-1 of glucose (adult ~2 mg . kg-1 . min-1), of which the major part is used by the brain. At first, glucose is provided from liver glycogen,64 but later, additional glucose is produced by gluconeogene-sis mainly from lactate, pyruvate and alanine.65 Lipolysis is stimulated by catecholamines and the postnatal rise of TSH,14 together with an increasing level of cortisol and a decrease in the insulin level. The products of lipolysis support gluconeogenesis; glycerol as a precursor of glucose and NEFA by providing energy through -oxidation. In addition, NEFA is a precursor of ketone bodies, which are important alternative energy substrates for the brain of the newborn infant (Fig. 4).66
Human milk has a high fat and low carbohydrate content, thus contribut-ing to the higher levels of ketone bodies seen in breast-fed infants.67-69
Hence, there is a shift in the use of energy substrates from predominantly glucose in the fetus to lipids in the newborn infant.31
Preterm infants Most of the energy depots of the newborn infant are accumulated in late gestation.28 This period of intrauterine life is shortened or even absent in infants born preterm. In these infants the regulation of energy substrate pro-duction may be immature.15 Further, the energy utilisation is attenuated in response to increased thermoregulatory demands and possibly also to en-hanced breathing efforts due to respiratory distress.61 An adequate energy supply is therefore critical in the immediate postnatal period. Even though these infants are at risk of hypoglycaemia, parenteral nutrition often results in hyperglycaemia. Factors that may promote hyperglycaemia include an immature response to a glucose load, with reduced insulin levels or failure to inhibit hepatic glucose production.70, 71 Stress induced by respiratory failure and sepsis increases the circulating levels of catecholamines, which further stimulate glucose release.61 Previous studies by our group have shown that extremely preterm infants are capable both of glucose production and lipoly-sis.72-74 In addition they have a capacity for gluconeogenesis.74

20
MuscleLiver
CNS
Muscle
Heart Kidney
Adiposetissue
Lactate
Glucose
Ketones
NEFA
Aminoacids
Lactate
Glycerol
Figure 4. Intermediary metabolism during fasting (NEFA=non-esterified fatty acids)
Drugs with metabolic effects used in the perinatal period Several drugs used in the perinatal period may have potential effects on en-ergy metabolism. Maternal antihypertensive treatment such as - and -blockers, as well as antenatal steroids given to increase lung maturation, have such effects.75, 76 Theophylline is a drug commonly used in preterm infants as prophylaxis and treatment of apnoea.19 Besides having effects on bronchial smooth muscle77 and the ventilatory drive,78 theophylline also in-fluences lipolysis79 and metabolism of glucose.18 Toxic doses given to dogs resulted in hyperglycaemia, an effect which was probably mediated through stimulation of -adrenergic receptors, since it could be blocked by admini-stration of propranolol.78 In addition, theophylline has a stimulatory effect on glycogenolysis, gluconeogenesis and lipolysis by inhibition of cAMP-phosphodiesterase, thus increasing the levels of cAMP.80 However, to achieve this stimulatory effect the concentration has to be 3 to 10 times higher than that normally found in preterm infants treated with theophyl-line.81, 82 Administration of theophylline in adults has been reported to in-crease lipolysis without affecting the level of plasma glucose, insulin, cate-cholamines or growth hormone.79 In a study of preterm infants receiving chronic theophylline treatment, no effect on energy substrate production was observed.83

21
Small for gestational age infants Infants born SGA are at increased risk of developing hypoglycaemia neona-tally. Several reasons for this have been suggested, including small energy stores, a high brain:body weight ratio, delayed maturation of the gluconeo-genic pathways and/or neonatal hyperinsulinaemia. 20-24, 84 Studies on the rate of glucose production (GPR) in infants born SGA have shown that they have rates in the lower normal range,20, 85 as compared to AGA infants, 20, 86-88 but data on the inhibitory effect of glucose infusion on GPR differ between the studies.20, 85 Further, low levels of glucose and lack of a relation between glucose and insulin have been found in newborn SGA infants.21 However, Bazaes et al.47 observed a correlation between glucose and insulin in a large cohort of infants born SGA, studied at 48 hours of age.
Data related to lipolysis in newborn SGA infants are somewhat contradic-tory21, 23, 47, 89-91 and there is only limited information available on the rate of glycerol production in these particular infants.91
Several studies have shown that IGF-I levels are reduced and IGFBP-1 levels are increased in these infants,45, 47, 92 probably as a result of the re-duced levels of insulin and glucose.
Consequences of disturbed perinatal energy metabolism Intrauterine growth restriction is associated with an increased risk of fetal and neonatal mortality and morbidity,93, 94 including prenatal still-birth and intrapartum asphyxia, with later neurological sequelae.63 Neonatal morbidity also includes hypo- and hyperglycaemia,61 thermoregulatory problems95 and an increased risk of infections.96
In addition to neonatal morbidity,59, infants born SGA are at risk of de-veloping disease later in life. During childhood 10% of children born SGA will fail to have a catch-up growth, resulting in short adult stature.97 There is also an increased risk of developing mild cognitive and behavioural prob-lems,98 as well as learning difficulties.99
Much interest has been focused on long-term effects of fetal growth re-striction during the last decade. The “fetal programming” hypothesis states that the fetus adapts to limited nutritional support. These adjustments, how-ever, may have metabolic consequences later in life.25 First an association was found between being born SGA and having cardiovascular disease in adulthood.100 Later, relations between SGA and insulin resistance, glucose intolerance, dyslipidaemia and hypertension, all parts of the metabolic syn-drome, were described.25 Recent data have shown that some of these meta-bolic alterations already occur at early school age.101-103 However, little is known about the metabolic situation of the newborn SGA infant.47
22
Aims of the studies
The overall aim of these studies was to investigate the energy substrate pro-duction in the perinatal period.
The specific aims were:
to study lipolysis and glucose production during the third trimester in women with normal pregnancies (study I).
to determine whether the maternal energy substrate production is impaired in pregnancies complicated by IUGR (study II).
to study glucose production and lipolysis in preterm infants ( 32 weeks of gestation) and the effect of initiation of theophylline therapy (study III).
to assess the capacity for glucose production and lipolysis in newborn SGA infants in relation to regulating hormones (study IV).

23
Subjects
The studies in this thesis were approved by the Human Ethics Committee of the Medical Faculty of the University of Uppsala, Sweden. Consent to par-ticipation was obtained from the pregnant women and from the parents of the infants after they had received oral and written information. Gestational ages were estimated by ultrasound examination (week 16 – 18). Study I was performed at Uppsala University Children’s Hospital, between the years 2001 and 2002. Study II was carried out at the Department of Obstetrics and Gynaecology at Uppsala University Hospital, from 2001 to 2004. All infants in studies III and IV were admitted to the neonatal unit at Uppsala University Children’s Hospital. The infants in study III were recruited from 1995 to 1998 and those in study IV from 2000 to 2004.
Pregnant women, studies I and II Study I Eight healthy, non-smoking women, mean age 33 4.8 years, with normal pregnancies were investigated following an overnight fast. The women were recruited among pregnant women in the staff working at the Uppsala Uni-versity Hospital (Table 3). The length of gestation at the time of the study was 34.6 0.9 weeks.
Study II Ten healthy, non-smoking pregnant women with diagnosed IUGR were studied following an overnight fast. The women had a mean age of 31 4.9 years. They were recruited from consecutive patients attending the antenatal care centre at the Uppsala University Hospital because of diagnosed IUGR. The diagnosis was made by repeated ultrasound measurements; these were considered normal at the first routine examination at 16 weeks, but later showed reduced fetal weight gain. The length of gestation at the time of the study was 35.4 1.6 weeks (Table 3).

24
Table 3. Maternal, fetal and infant characteristics in studies I and II
Pregnancies Study I
normal n=8 mean SD
Study II IUGR n=10
mean SD
Age (y) 33.3 4.8 31.4 4.9
Height (cm) 167.9 4.2 165.8 5.8
Pre-pregnancy weight (kg) 62.9 7.8 57.4 4.7
Pre-pregnancy BMI 22.3 2.3 20.9 2.2
Weight gain at study (kg) 12 3.2 9 4.7
BMI at study 26.5 2.9 24.5 3.2
Length of gestation at study (w) 34.6 0.9 35.4 1.6
Fetal weight deviation (%) 3 10 -32*** 7.3
Birth weight (g) 3708 535 2250*** 340
Birth length (cm) 51.3 1.8 45.9*** 2.1
Head circumference (cm) 34.9 1.9 32.2** 1.5
Gestational age at birth (w) 40.4 1.2 38.1 2.3
Placental weight (g) 614 150 387** 73 ** p<0.01, *** p<0.001
Newborn infants, studies III and IV Study III In this study ten preterm infants were investigated. Their gestational ages at birth were 32 weeks and their birth weights >900g. The postnatal age at the time of the study was 39 23 hours (Table 4). The mothers were healthy be-fore pregnancy, but two of them developed pre-eclampsia, one ablatio pla-centae, one placenta praevia and one endometritis. Eight of the infants were delivered by caesarean section and two vaginally. Enteral feeds with breast milk, 2 mL . kg-1, were given every second to third hour, in some cases com-bined with parenteral nutrition.

25
Table 4. Infant characteristics in study III
Study III Preterm infants
(n=10) mean SD
Birth weight (g) 1276 306
Birth length (cm) 39 4
Head circumference (cm) 29 2
Gestational age at birth (w) 29 2
Postnatal age at study (h) 39 23
Duration of fast (h) 3 1
Study IV Eleven healthy newborn SGA infants with a gestational age at birth of 35±3 weeks and a birth weight of 1800±500 g were studied at a mean age of 24 h. Nine of the eleven infants were also short for gestational age (Table 5).62
The mothers were healthy prior to pregnancy and none of them smoked. Five mothers developed pre-eclampsia with hypertension in late pregnancy. Ten of the infants were born by caesarean section and one by vaginal delivery. The infants were fed 3.6 mL . kg-1 . h-1 of breast milk every second to third hour.
Table 5. Infant characteristics in study IV
Study IV Preterm and term infants born SGA
(n=11) mean SD
Birth weight (g) 1804 472
Birth length (cm) 43 4
Head circumference (cm) 30.6 1.8
Gestational age at birth (w) 35.4 2.8
Postnatal age at study (h) 24.4 5.3
Duration of fast (h) 4.0 0.6
SGA=small for gestational age
26
Methods
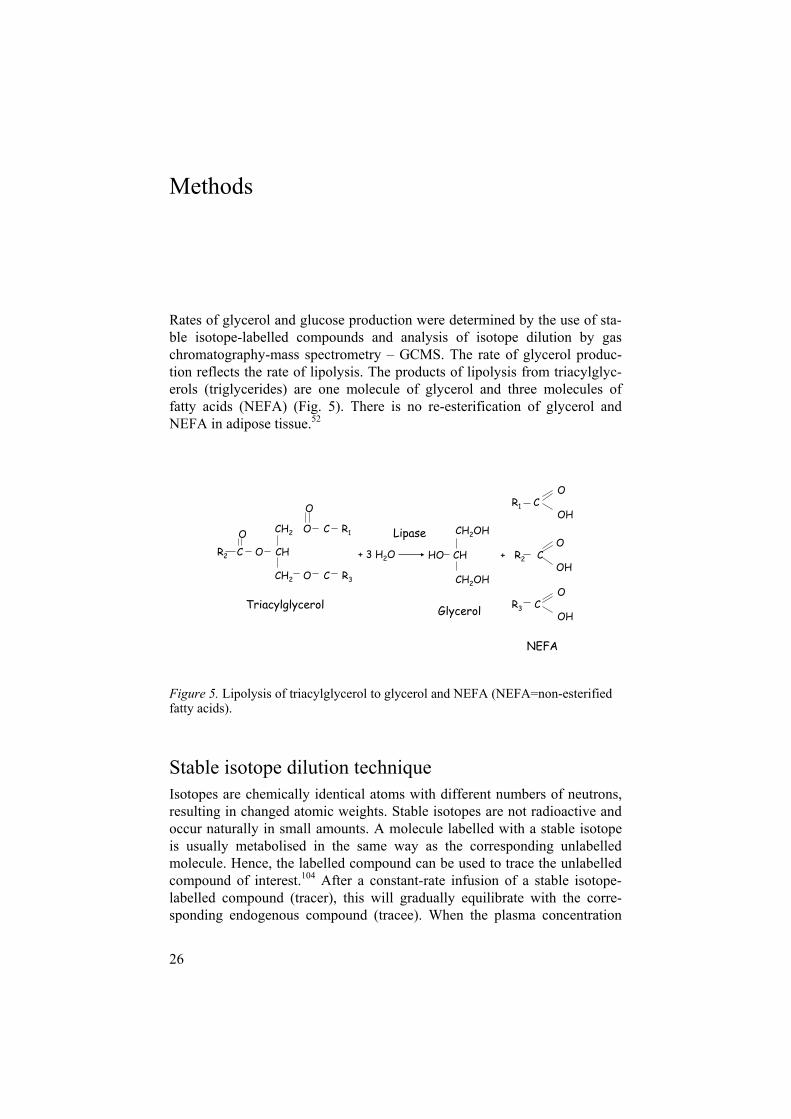
Rates of glycerol and glucose production were determined by the use of sta-ble isotope-labelled compounds and analysis of isotope dilution by gas chromatography-mass spectrometry – GCMS. The rate of glycerol produc-tion reflects the rate of lipolysis. The products of lipolysis from triacylglyc-erols (triglycerides) are one molecule of glycerol and three molecules of fatty acids (NEFA) (Fig. 5). There is no re-esterification of glycerol and NEFA in adipose tissue.52
O
CH2 O C R1
CH2 O C R3
CH2OHO
HO CH + R2 COH
CH2OH
+ 3 H2O
OR2 C O CH
OR3 C
OH
OR1 C
OH
Triacylglycerol Glycerol
NEFA
Lipase
Figure 5. Lipolysis of triacylglycerol to glycerol and NEFA (NEFA=non-esterified fatty acids).
Stable isotope dilution technique Isotopes are chemically identical atoms with different numbers of neutrons, resulting in changed atomic weights. Stable isotopes are not radioactive and occur naturally in small amounts. A molecule labelled with a stable isotope is usually metabolised in the same way as the corresponding unlabelled molecule. Hence, the labelled compound can be used to trace the unlabelled compound of interest.104 After a constant-rate infusion of a stable isotope-labelled compound (tracer), this will gradually equilibrate with the corre-sponding endogenous compound (tracee). When the plasma concentration

27
and the isotopic enrichment of the compound are close to constant, an ap-proximate steady state situation prevails.
GCMS can be used to identify labelled and unlabelled forms of a com-pound in biological samples.104 The GCMS technique is a sensitive, specific and precise method that is applicable for metabolic research. Small amounts of a substrate can be measured, making small sample sizes possible. Since stable isotope tracers are non-radioactive, studies of this kind are ethically acceptable in humans irrespective of age.
Analysis by gas chromatography-mass spectrometry The isotopic enrichment of compounds labelled with stable isotopes can be analysed by GCMS. After precipitation of plasma proteins in the sample, “derivatisation” results in the formation of a volatile complex of the mole-cule of interest.105 The derivatised molecule is injected into the gas chro-matograph (GC) and vaporised at a high temperature and is then transported by a carrier gas through the GC column to the mass spectrometer. In the capillary column, the derivatised molecule is separated from other molecules in the sample by temperature-regulated interaction between the stationary phase and the molecule of interest.105 After the separation in the GC column the molecules are transferred to the ion source of the mass spectrometer. The neutral molecule is then ionised by bombardment either with electrons (EI – electron impact) or by protonation in a gas phase (CI – chemical ionisa-tion).105 Depending on the properties of the molecule and the ionisation method, the ionised molecule either remains intact or disintegrates into fragments. This is followed by separation, by a magnetic field based on mass over charge ratio (m/z). A detector then records the amount of ions corre-sponding to labelled and unlabelled compounds (Fig. 6). From this ratio the isotopic enrichment of the compound is calculated.
Gas Chro-matograph
Ion source
Mass Spectrometer
Ions Mass analyser
Selected
ions
Detector
Datasystem
SignalCapillaryColumn
Quadrupole
Figure 6. Diagram of a GCMS computer system (modified after Smith R M, Busch K L: Understanding mass spectra : A basic approach, New York, Wiley, 1999.)

28
Materials Stable isotope labelled compounds The tracers used in studies I and II were [6,6-2H2]-glucose (isotopic purity 98 atom %) and [1,1,2,3,3-2H5]-glycerol (isotopic purity 98 atom %). In studies III and IV the tracers used were [6,6-2H2]-glucose (isotopic purity 98 atom %) and [2-13C]-glycerol (isotopic purity 98 atom %). In addition, an internal standard of [1,1,2,3,3-2H5]-glycerol (isotopic purity atom 98%) was used to quantify the plasma glycerol concentration in studies III and IV. All tracers were purchased from Cambridge Isotope Laboratories, Woburn, MA, USA. The solutions were sterile in microbiological cultures and pyrogen-free when tested by the Limulus lysate method.106
Experimental design The tracers were administered intravenously as primed constant rate infu-sions by a volumetric pump (IMED 965 micro, IMED, Oxford, England). The blood samples were obtained from a second peripheral vein catheter or in some of the infants in study III from an umbilical artery catheter. All pa-tients in study III and 6/11 patients in study IV received a glucose infusion in order to avoid hypoglycaemia. First, a blood sample for analysis of natural isotopic abundance was taken. After 60 min of tracer infusion blood samples were obtained every 10 or 15 min. In studies I, II and IV 7 samples were collected, and in study III 9 samples were taken. Plasma was immediately separated by centrifugation and frozen at -70 C. In study III theophylline, 6 mg . kg-1, was administered in the middle of the sampling period.
Chemical procedures In studies I and II plasma glucose and in study IV blood glucose concentra-tions were determined by the glucose oxidase method (ABL 735, Radiome-ter, Denmark). In study III plasma glucose concentrations were measured directly in each sample by the glucose oxidase/peroxidase method in an Ames Minilab 1 glucose analyser (Bayer AG, Leverkusen, Germany). Hor-monal analyses in studies I and II were performed with commercial kits (Autodelfia, Wallac Oy, Turku, Finland and Modular, Roche Diagnostics, Bromma, Sweden), and Chromogranin A was measured by a competitive radioimmunoassay107 at the Department of Clinical Chemistry, University Hospital, Uppsala. A radioimmunoassay technique was used to measure insulin108 and glucagon (kit RB 310, Euro-diagnostica AB, Medeon, Malmö, Sweden) in study IV. The analyses were performed at the Department of

29
Endocrinology, Karolinska University Hospital, Stockholm, Sweden. Plasma glycerol was quantitated by a UV method (Enzytec Glycerol no. 1 002 809, Diffchamb AB, Gothenburg, Sweden) in studies I and II, and by GCMS using an internal standard of [1,1,2,3,3-2H5]-glycerol in studies III and IV.
Gas chromatography-mass spectrometry The pentaacetate derivative of glucose and the triacetate derivative of glyc-erol were prepared after precipitation of plasma proteins with acetone. The analyses were made on a Finnigan SSQ 70 mass spectrometer (Finnigan MAT, San José, CA, USA) equipped with a Varian 3400 gas chromatograph (Varian Associates Inc, Sunnyvale, CA, USA) with a non-polar (DB 1) cap-illary column (15,000 x 0.25 mm, film thickness 0.25 µm), later changed to an HP 5890 gas chromatograph (Hewlett-Packard, Palo Alto, CA, USA) with the same kind of capillary column. Chemical ionisation was performed with methane. The ions monitored had an m/z of 331 (M), 332 (M+1) and 333 (M+2) for glucose and m/z 159 (M), 160 (M+1) and 164 (M+5) for glycerol.
CalculationsThe isotopic enrichments of glucose and glycerol obtained during periods of approximate steady state can be used to calculate the turnover rate of these substrates. Glucose production rate and rate of glycerol production are calcu-lated as follows: GPR = (i x 100/IR) - glucose infusion rate; rate of glycerol production = (i x 100/IR), where i is the infusion rate of the tracer, and IR is the isotopic ratio of the tracer in plasma [given as labelled (tracer)/unlabelled substrate in %].109 Glucose Rate of appearance (glucose Ra) = GPR + rate of administration of unlabelled and labelled glucose. The fraction of glycerol converted to glucose and the fraction of glucose derived from glycerol were calculated from 13C-enrichment of glucose as described by Bougnères et al. 110 and Patel and Kalhan.91
Statistical analyses The data are presented as mean standard deviation (SD) or, if not normally distributed, as median and range. Independent samples t-test and correlation analyses with Pearson’s correlation two-tailed test were performed with the SPSS program (LEAD Technologies, Inc, Chicago, IL). Correlations and differences were considered significant at p <0.05.

30
Results
Pregnant women, studies I and II There were no differences in anthropometric characteristics between the women with normal pregnancies and those with IUGR. However, there were differences in placental, fetal and infant size (Table 3). Plasma concentra-tions of glycerol and glucose averaged 110 2 µmol . L-1 and 4.2 0.16 mmol .L-1 in the women with normal pregnancies and 170 49 µmol . L-1 and4.0 0.3 mmol . L-1 in the women with IUGR. The plasma level of glycerol was significantly higher in the IUGR group (p=0.008).
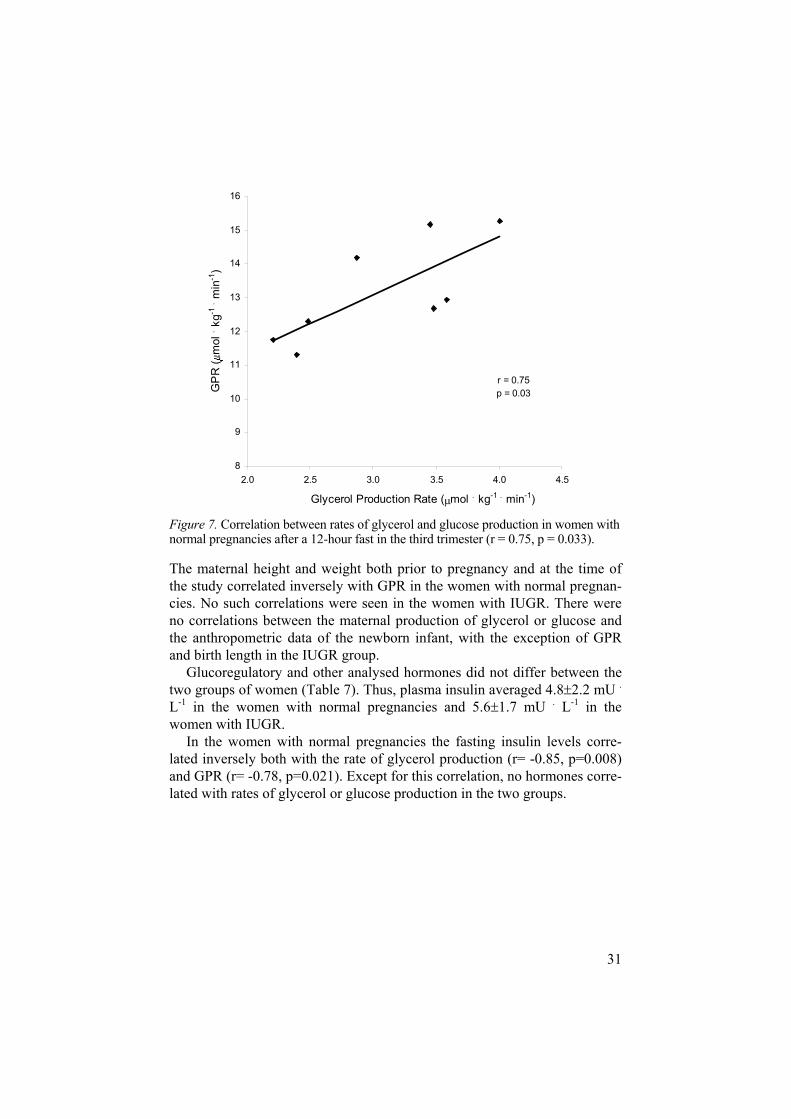
In the women with normal pregnancies the mean rate of glycerol produc-tion, reflecting lipolysis, was 3.06 0.66 mol . kg-1 . min-1 and in those with IUGR 2.36 0.58 mol . kg-1 . min-1 (p=0.030). GPR did not differ between the groups (Table 6). In the women with normal pregnancies there was a correlation between the rates of glycerol and glucose production (r=0.75, p=0.033) (Fig.7). This relationship was not found in the women with IUGR.
Table 6. Concentrations and production rates of glucose and glycerol in the women of studies I and II
Study I Study II Pregnancy normal n=8 IUGR n=10 mean SD mean SD p
P-glucose (mmol . L-1) 4.20 0.16 4.40 0.30 0.120
Glucose production rate (µmol . kg-1 . min-1) 13.2 1.5 12.1 1.5 0.23
P-glycerol (µmol . L-1) 110 2 170 5 0.008
Glycerol production rate (µmol . kg-1 . min-1) 3.06 0.66 2.36 0.58 0.030
31
r = 0.75p = 0.03
8
9
10
11
12
13
14
15
16
2.0 2.5 3.0 3.5 4.0 4.5
Glycerol Production Rate ( mol . kg-1 . min-1)
GP
R (
mol
. kg-1
. min
-1)
Figure 7. Correlation between rates of glycerol and glucose production in women with normal pregnancies after a 12-hour fast in the third trimester (r = 0.75, p = 0.033).
The maternal height and weight both prior to pregnancy and at the time of the study correlated inversely with GPR in the women with normal pregnan-cies. No such correlations were seen in the women with IUGR. There were no correlations between the maternal production of glycerol or glucose and the anthropometric data of the newborn infant, with the exception of GPR and birth length in the IUGR group.
Glucoregulatory and other analysed hormones did not differ between the two groups of women (Table 7). Thus, plasma insulin averaged 4.8 2.2 mU .L-1 in the women with normal pregnancies and 5.6 1.7 mU . L-1 in the women with IUGR.
In the women with normal pregnancies the fasting insulin levels corre-lated inversely both with the rate of glycerol production (r= -0.85, p=0.008) and GPR (r= -0.78, p=0.021). Except for this correlation, no hormones corre-lated with rates of glycerol or glucose production in the two groups.

32
Table 7. Hormone levels in the women in studies I and II
Study I Study II
Pregnancy normal n=8 IUGR n=10
mean SD mean SD
Insulin (mU . L-1) 4.8 2.2 5.6 1.7
Glucagon (ng . L-1) 53 11 62 21
hPGH (ng . mL-1) 22 13 30 16
GH (mU . L-1) 0.45 0.31 0.92 1.59
IGF-I ( g . L-1) 183 32 209 77
IGFBP-1 (ng . mL-1) 156 50 183 91
Oestradiol (nmol . L-1) 73 33 75 39
Progesterone (nmol . L-1) 478 100 575 318
Cortisol (nmol . L-1) 584 102 592 139
Chromogranin A (nmol . mL-1) 3.2 0.7 3.4 0.7
Newborn infants, studies III and IV Study III In the preterm infants, plasma concentrations of glycerol and glucose, the rate of appearance of glycerol, and GPR, were calculated during two periods of steady state, before and after administration of theophylline (Table 8). Compared to the values before theophylline administration, both plasma glucose (p=0.0006) and GPR (p=0.002) differed after this treatment.
Table 8. Glucose and glycerol kinetics before and after administration of theophylline
P-glucose Ra (glucose) GPR P-glycerol* Glycerolproduction
mmol . L-1 mol. kg-1 . min-1 mol. kg-1 . min-1 mol . L-1 mol . kg-1 . min-1
before 4.0 1.9 51.7 13.9 33.3 13.9 67 (7.5-785) 5.9 2.6
after 4.7 2.1 42.2 10.6 23.9 10.6 122 (44-803) 6.7 3.0
n=8, *= presented as median and range, Ra=rate of appearance, GPR=glucose production rate
33
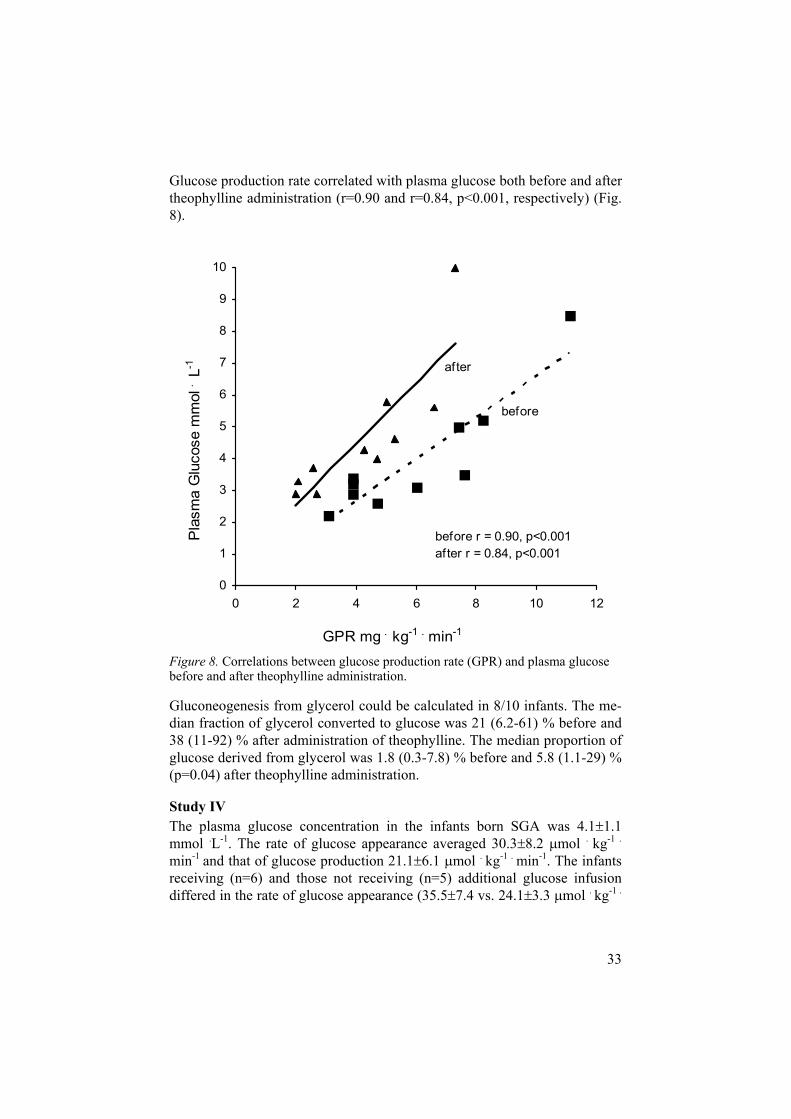
Glucose production rate correlated with plasma glucose both before and after theophylline administration (r=0.90 and r=0.84, p<0.001, respectively) (Fig. 8).
0
1
2
3
4
5
6
7
8
9
10
0 2 4 6 8 10 12
GPR mg . kg-1 . min-1
Pla
sma
Glu
cose
mm
ol .
L-1
before
after
before r = 0.90, p<0.001after r = 0.84, p<0.001
Figure 8. Correlations between glucose production rate (GPR) and plasma glucose before and after theophylline administration.
Gluconeogenesis from glycerol could be calculated in 8/10 infants. The me-dian fraction of glycerol converted to glucose was 21 (6.2-61) % before and 38 (11-92) % after administration of theophylline. The median proportion of glucose derived from glycerol was 1.8 (0.3-7.8) % before and 5.8 (1.1-29) % (p=0.04) after theophylline administration.
Study IV The plasma glucose concentration in the infants born SGA was 4.1 1.1 mmol .L-1. The rate of glucose appearance averaged 30.3 8.2 mol . kg-1 .
min-1 and that of glucose production 21.1 6.1 mol . kg-1 . min-1. The infants receiving (n=6) and those not receiving (n=5) additional glucose infusion differed in the rate of glucose appearance (35.5 7.4 vs. 24.1 3.3 mol . kg-1 .

34
min-1, p=0.012), but not with regard to GPR or to the plasma glucose con-centration.
The mean plasma concentration of glycerol in the SGA infants of study IV was 224 79 mol. L-1. The rate of appearance of glycerol averaged 6.1 1.6 mol . kg-1 . min-1 and that of glycerol production 5.6 1.6 mol . kg-1 .
min-1. Neither the concentration nor the rate of production of glycerol dif-fered between the infants receiving and those not receiving additional glu-cose. In all infants, the fraction of glycerol converted to glucose was 55 22 %. This represented 8 3 % of the glucose produced. The infants receiving glucose infusion showed reduced conversion of glycerol to glucose in com-parison with those who were not given extra glucose (43 23 vs. 70 7 %, p=0.036), resulting in a lower relative contribution to the glucose production (6 4 vs. 10 1 %, p=0.03). The concentrations of insulin, glucagon, IGF-I and IGFBP-1 (n=9), measured during approximate steady state, are shown in Table 9. There were no differences between the infants with and without glucose infusion except in the case of IGFBP-1, the infants given glucose showing higher levels (404 66 vs. 209 52 g . L-1, p=0.004) of this binding protein.
Table 9. Glucose and glycerol kinetics and hormone levels in newborn small for gestational age infants
(n=11) mean SD
P-glucose (mmol . L-1) 4.1 1.1
GPR (µmol . kg-1 . min-1) 21.1 6.1
Ra (glucose) (µmol . kg-1 . min-1) 30.3 8.2
P-glycerol (mmol . L-1) 224 79
Glycerol production (µmol . kg-1 . min-1) 5.6 1.6
Glycerol to glucose (%) 55 22
Glucose from glycerol (%) 8 3
Insulin (mU . L-1) † 6.7 1.7
Glucagon (pmol . L-1) † (median, range) 71(48-169)
IGF-I ( g . L-1) † 17 6
IGFBP-1 ( g . L-1) † 306 117
GPR=rate of glucose production, Ra=rate of appearance, † n=9

35
r= 0.904p<0.001
2
3
4
5
6
7
8
9
1000 1500 2000 2500 3000
Birth Weight (g)
Gly
cero
l Pro
duct
ion
Rat
e (µ
mol
. kg-1
. m
in-1
)
Figure 9. Correlation between birth weight and rate of glycerol production in small for gestational age infants at a mean postnatal age of 24 h (r=0.87, p<0.001).
There was a strong correlation between birth weight and rate of glycerol production (r=0.904, p<0.001) (Fig. 9). The rate of glycerol production also correlated strongly with the fraction of glucose formed from glycerol (r=0.88, p<0.001).

36
Discussion
An efficient maternal energy metabolism is a prerequisite for adequate fetal weight gain and for the metabolic adaptation of the newborn infant. This thesis addresses questions concerning perinatal energy substrate production in normal pregnancy and in pregnancies complicated by IUGR, as well as in SGA and preterm infants.
The use of stable isotope dilution technique makes it possible to perform studies on energy substrate kinetics in humans. The technique provides in-formation on substrate production from small sample volumes, which makes it particularly suitable for studies in newborn infants.
In the pregnant woman and in the newborn infant several adaptive mecha-nisms provide substrates for energy production. In late gestation there is an accelerating fetal weight gain. To meet the demand for energy substrates, the pregnant woman has to adjust her metabolism. There is a net energy re-quirement of approximately 80 000 kcal during a normal pregnancy.29 We could show that in addition to an augmented glucose production there was also a marked increase in lipolysis in women with normal pregnancies as compared to reported data for non-pregnant women.52 We also found that the rate of lipolysis was lower in women with pregnancies complicated by IUGR. Even though infants born preterm and/or SGA have limited energy stores, we demonstrated that they are capable of lipolysis as well as glucose production.
Kinetic data on lipolysis in pregnancy are limited.111 Sivan et al.12 reported on rates of lipolysis in women with overweight or obesity studied in late pregnancy and post partum. In the third trimester they found a lower basal glycerol production12 than that observed in our study on non-obese healthy pregnant women. This discrepancy may be due to the large difference in BMI between the groups, since earlier data on non-pregnant subjects have shown that excess fat mass may be associated with a decreased rate of lipolysis.112
In the study on women with pregnancies complicated by IUGR we found that the rate of lipolysis was decreased in comparison with that in normal pregnancies. Although the number of women was limited, the group was uniform in that all were healthy and non-smokers. Intrauterine growth re-striction was diagnosed by repeated ultrasound measurements and the

37
women delivered infants with birth weights <-2SD. The reduced lipolysis might influence the total energy substrate production and lead to an in-creased maternal glucose consumption, in turn reducing the amount of glu-cose available for the fetus.
In keeping with others,3-5 we demonstrated that late normal pregnancy is associated with an increased GPR compared to reported data for non-pregnant women.52 Since the rates of glucose production did not differ be-tween the two groups of pregnant women, impaired maternal glucose pro-duction does not seem to be a factor underlying intrauterine growth restric-tion.
The finding of an inverse correlation between maternal anthropometric data and the rate of glucose production indicates that it is mainly the re-quirements of the brain and the feto-placental unit,113 and not primarily ma-ternal size, that determine glucose turnover at rest.
The plasma levels of glycerol were higher in the women with IUGR than in those with normal pregnancies. In view of the fact that NEFA and glycerol, products of lipolysis, only cross the placental barrier to a limited extent,31 it would seem that the increased lipolysis in normal pregnancy mainly pro-vides substrates for maternal energy metabolism.12, 53 This saves glucose and amino acids for the fetus. 10-12 Most of the energy derived from lipolysis comes from the subsequent -oxidation of NEFA. The energy from this pro-motes gluconeogenesis114 and the fetus can benefit from this de novo synthe-sis of glucose. The elevated levels of glycerol in the women with IUGR could reflect a low conversion of this compound into glucose. Gluconeo-genesis from glycerol is increased during fasting in animals.57 Accordingly, the increased levels of glycerol in the women with IUGR could reflect a low conversion of this compound into glucose. However, gluconeogenesis from glycerol only seems to contribute to a minor extent to endogenous glucose production in adults.52 It may be questioned whether a decrease in glu-coneogenesis from glycerol is of any importance, since alanine, lactate and pyruvate are the important precursors of glucose.5
Fasting during normal pregnancy leads to a more rapid use of fat instead of carbohydrates as compared to the non-pregnant state.115 This adaptation saves glucose for the fetal needs.116, 117 During maternal fasting, ketone bod-ies formed by -oxidation of NEFA easily cross the placenta and act as en-ergy substrates for the fetus.57
We found an inverse correlation between levels of insulin and rates of ap-pearance of glycerol and glucose in the women with normal pregnancies. This indicates a regulatory role for insulin, in spite of the reduced insulin sensitivity reported in late pregnancy. Maternal glycerol production and GPR correlated, indicating that lipolysis and the ensuing -oxidation of fatty

38
acids support gluconeogenesis by formation of NADH, ATP and acetyl-CoA.114
In contrast to the situation in normal pregnancy, in women with IUGR we did not find any correlation between insulin and rates of energy substrate production, nor between lipolysis and glucose production. This indicates an altered regulation of energy substrate production in this group of pregnant women.
Several of the studied hormones act during pregnancy by decreasing insu-lin sensitivity.8 We found no difference between the two groups of women with regard to levels of glucagon, cortisol, GH, hPGH, oestradiol, progester-one, thyroxine, triiodothyronine, thyrotropin or chromogranin A. None of these hormones correlated with production of glycerol or glucose, nor ex-plained the decreased rate of lipolysis in the women with IUGR.
Concerning the question whether IUGR is associated with low or normal levels of maternal IGF-I, reports in the literature are contradictory.37 , 48, 118, 119
In our studies there was no difference in IGF-I levels between the two groups of women. Plasma IGFBP-1, modulating IGF-I activity,120 was in-creased in both groups. This could reflect decreased hepatic insulin sensitiv-ity during pregnancy.121 The fact that the levels of insulin and IGFBP-1 were comparable between the two groups indicates that IUGR is not associated with altered hepatic insulin sensitivity.
The postnatal adaptation in the infant involves activation of several meta-bolic pathways. Energy from lipolysis is a major contributor to the require-ments during the immediate postnatal period. Earlier studies on preterm and term AGA and SGA infants have shown a considerable variation with regard to the rate of lipolysis.74, 87, 91, 110 We found that lipolysis in the preterm in-fants and in the infants born SGA was lower than in most term infants stud-ied.87, 91, 110 This is not surprising considering the limited amount of stored fat in these groups. In the SGA infants birth weight correlated with the rate of glycerol production, indicating that lipolysis depends on the amount of stored fat.
Our group has previously reported data on lipolysis in extremely preterm infants.74 The median rate of glycerol production in these infants was in fact similar to the mean rates of lipolysis in the two groups of infants in the pre-sent studies. However, there was a very large variation between the individ-ual rates in the extremely preterm infants. This was not seen in the more mature infants of studies III and IV.
Because of the relatively large size of the brain, the glucose requirement of a newborn infant is more than twice as high as that of an adult. Our data on the preterm infants showed that they were capable of an efficient glucose pro-duction on the second day of life. During the study periods they were nor-moglycaemic when given a low-rate infusion of glucose. Although newborn

39
infants, particularly those born preterm or SGA, are at risk for hypoglycae-mia, parenteral nutrition can induce hyperglycaemia. The data showing a high glucose Ra in the preterm infants are in line with earlier results from our group, indicating that the suppression of glucose production during glu-cose infusion is incomplete. This suggests a disturbance of hormonal glucose regulation.73 In addition, preterm infants have less tissue that can handle surplus glucose by an insulin-dependent uptake.122
In the infants born SGA the glucose production was in the lower normal range as compared to data reported earlier for term AGA infants.20, 86-88 When the SGA infants were divided into two groups, one preterm group given additional glucose and one more mature group without glucose infu-sion, the groups only differed in rate of appearance of glucose. Kalhan et al.20 compared rates of glucose production before and after a glucose infu-sion in infants born SGA. The basal GPR in these infants was somewhat higher than that in the infants without glucose infusion in our study. The reason for this may be that the infants studied by Kalhan et al.20 were more mature and had higher birth weights (SGA was defined as <10th percentile in that study). In addition, these authors found that GPR was inhibited after glucose infusion. No such inhibition was seen in our study. Although the number of infants was small, the results indicate that our infants in fact needed extra energy support. The interpretation of the data related to addi-tional glucose infusion is made difficult by the small sample size both in our study and in that of Kalhan et al.20
In the preterm group gluconeogenesis from glycerol varied markedly be-tween the individual infants and contributed only to a small extent to glucose production. In the infants born SGA approximately half of the glycerol was converted to glucose and this contributed to 8% of the total GPR. This input is in the same range as that in most studied AGA infants.87 The infants born SGA, studied without glucose infusion, showed a higher conversion of glyc-erol to glucose, indicating a supportive role of gluconeogenesis from glyc-erol under these conditions.
Acute administration of theophylline in the preterm infants did not result in metabolic alterations of clinical importance. The plasma glucose concentra-tion rose following a bolus dose. Srinivasan et al.80 also observed an increase in plasma glucose in preterm infants after a bolus dose of theophylline. The rate of glucose production decreased somewhat, whereas the rate of lipolysis was not influenced by the medication. Even though plasma glucose in-creased, no episodes of hyperglycaemia occurred during the study periods. A proposed relation between glucose utilisation and plasma glucose123-125 was supported by the correlations between GPR and plasma glucose before and after theophylline. After treatment, there was a new higher regulatory set-
40
point between GPR and the glucose level, as indicated by the change in re-gression line (Fig. 8).
The only previous study on energy substrate production in connection with theophylline therapy in infants is that by Fjeld et al.,83 who concluded that chronic administration of theophylline did not influence energy substrate production in preterm infants 2-5 weeks old.
The risk of later development of the metabolic syndrome in infants born SGA has put focus on the regulation of energy metabolism in such infants and children.47, 102, 126 The concept of “fetal programming” refers to an adap-tation to reduced nutritional support during fetal life with life-long conse-quences.25 The nutritional situation of the preterm infant in the intensive care unit partly mimics the intrauterine circumstances of IUGR. Recently, Hof-man et al.103 reported that children who were born preterm had reduced insu-lin sensitivity, a risk factor for later development of type 2 diabetes mellitus.
Little is known about the hormonal regulation of energy substrate produc-tion in the newborn infant born SGA. The levels of insulin in our infants were comparable with those of a large cohort of SGA infants investigated 48 hours postnatally, but lower than levels reported for AGA infants.47 The results contradict the possibility that hyperinsulinaemia may occur already at birth, as suggested before.24, 127 Our data on the glucose/insulin ratio are compatible with the occurrence of increased neonatal peripheral insulin sen-sitivity in infants born SGA47. This increase indicates that insulin resistance does not occur until later in life.126
There were no correlations between the level of insulin or the insu-lin/glucagon ratio and GPR in the SGA infants. The lack of such a correla-tion is in line with a relative insensitivity of the neonatal hepatocyte to insu-lin, as suggested by Hawdon et al.128 The occurrence of hepatic insensitivity is also supported by the finding of an increased IGFBP-1 level as well as an increased IGFBP-1/insulin ratio in SGA infants in this and other studies. 47, 92
The reduced insulin levels in the SGA infants may serve to protect from hypoglycaemia when energy stores are scarce. Fasting insulin levels may increase during the first year since data reported by Soto et al.126 showed that at 1 year of age the fasting insulin levels in children born SGA were similar to those in children born AGA. Studies of SGA children between 4 and 10 years of age101-103 indicate that a development towards insulin resistance may occur, particularly in those who have a rapid weight gain.

41
Summary and conclusions This thesis concerns energy substrate production, particularly lipolysis, in pregnant women in late gestation and in newborn infants during the first days of life, and the principal findings and conclusions are as follows:
Lipolysis in the third trimester was markedly increased in women with normal pregnancies studied after an overnight fast. The energy produced can be used for maternal energy requirements, thus saving glucose and amino acids for the fetus.
Lipolysis supports maternal gluconeogenesis.
Late normal pregnancy is associated with increased glucose produc-tion.
In spite of the insulin resistance in late pregnancy, insulin still ex-erted a regulatory effect on glucose production and lipolysis in nor-mal pregnancy.
Healthy, non-smoking women, with pregnancies complicated by IUGR of unknown aetiology, had a decreased rate of lipolysis. This decrease could reduce the amount of glucose available for the fetus.
The glucose production rate did not differ between the women with normal and those with IUGR pregnancies. Thus, a difference in glu-cose production does not seem to explain the fetal growth restriction.
Newborn preterm infants are capable of lipolysis and glucose pro-duction, as well as of gluconeogenesis from glycerol.
Acute administration of theophylline in the newborn preterm infant had no adverse metabolic effects.
Newborn preterm and term SGA infants have a capacity for lipolysis and glucose production, but at somewhat lower rates than those re-ported for AGA infants.
Newborn infants born SGA appear to have increased peripheral, but decreased hepatic insulin sensitivity.
New questions related to perinatal energy metabolism are raised from the results presented in this thesis. Studies of energy substrate production in pregnancies resulting in infants born large for gestational age, could give further insight into mechanisms regulating fetal growth. In addition, studies on placental glucose transport could add important knowledge concerning other possible mechanisms underlying altered growth of the fetus.

42
Acknowledgements
The work presented in this thesis could not have been accomplished without the help and support of many people. I would like to thank and express my deepest gratitude to all of you.
First and foremost most I want to thank all pregnant women for being curi-ous, interested and willing to participate in the studies, all parents for hav-ing confidence in me and giving me the opportunity to enrol their most pre-cious newborn infants to my studies, and the infants, who participated with-out knowing and being able to express their own consent.
Jan Gustafsson, my supervisor, for always sharing your enthusiasm, curios-ity, thoroughness and your immense knowledge in the field of research, while at the same time appreciating other important things in life. You have always been supportive and understanding when time is scarce, have been a good friend and colleague, you have all the qualities of an ideal supervisor.
Uwe Ewald, my co-supervisor and clinical mentor, for pushing me, believ-ing in me and making me do things, for sharing your great knowledge in the scientific and clinical field and your wisdom about life itself. Thank you for supporting me in difficult times in becoming and being a mother.
Torsten Tuvemo, for giving me the opportunity to do research in this inter-esting field and for the “scientific discussions” at the coffee table in the re-search lab. I also want to express my gratitude for your special support in administrative matters.
Gunnar Sedin, for giving me the opportunity to come to Uppsala to the neo-natal unit, for clinical training and for always being interested and supportive in my field of research.
Sten Swanström, Eskilstuna hospital, for arousing my interest in neonatol-ogy and supporting my move to Uppsala.
My co-authors, Mats Stridsberg for laboratory analyses and valuable com-ments. Solveig Nordén-Lindeberg for helping me to recruit the women expecting small babies and for valuable discussions.

43
Ulf Hansson for valuable discussions, including reading this thesis.
Fredrik Ahlsson, for being my friend, colleague and co-author, you are following close behind, and are soon ahead of me!
Hong Yin, for your friendship and your constant enthusiasm for finding new ways of solving the problems in the “hopeless” GLUT project. Soon I will be back running some more PCRs.
Elisabet Söderberg, for your friendship as well as your excellent laboratory and technical assistance with the stable isotope studies, riding on your bicy-cle back and forth between the hospital and SVA, whatever the weather.
Cecilia Ewald, for your friendship and helping me with the investigations in the women and particularly the infants. I could call you in the middle of the night and ask for help and you never said no. Thank you for your hospitality, for opening your and Uwe´s home to me and my family.
Roger Olsson and Anders Forslund, for all the measurements, they will be useful.
All staff at 95F; some of you have helped me with the investigations, but all of you are my friends; making it a joy to go work in the morning. A special thank you for letting me be just another mother, when my daughter needed your assistance.
The staff at ANTEC for helping me to recruit the women with IUGR.
Margareta Lindström, for excellent laboratory work, and for always being so kind and helpful, and Yvonne Strömberg, for laboratory assistance, with analyses from small volumes. It was great fun, finding an old school mate from Spånga. Eva Sejby, Ulla-Britta Jansson, Inger Olsson, Inga-Lena Wivall Helleryd and Elvi Sandberg, for laboratory assistance.
Barbro Westerberg, for your help and support with computers, pro-grammes and courses, and for making the computer a friend instead of an enemy. Thank you for being “in charge” of and all the laughs at the coffee table. Karin Wennquist, for always being so kind and full of jokes, IngaAndersson, for your kindness and all arrangements and both of you for re-minding me of all applications and meetings. Anna-Karin Berg, Orvar Eeg-Olofsson, Asma El-Shebani, Gunn Engvall, Gun Frisk, Eva-Lotta Funquist, Maria Hindersson, Maria Lundgren and Kerstin Hedberg-Nyqvist for all good discussions and fun around the coffee table in the lab.
Ulf Bondesson and Anders Ingvast, for keeping the GCMS in good shape.

44
Maud Marsden, for your excellent linguistic skills, making the articles con-vincing and, Steven Lucas, my colleague, for your expert language revision and help at short notice.
Katarina Strand Brodd, for being my first paediatrician “role-model” in Eskilstuna. Guess how happy I am to share my room with you, and to have you as my fellow neonatologist in “the men´s club”. Hopefully I can pay you back with support in some small practical things with writing a thesis.
Britt-Marie Frost, for being my second and highly appreciated paediatri-cian “role-model”, and for taking me under your wings to try to show me how to avoid the worst obstacles of being a doctor, mother, wife, friend, researcher… You were my clinical supervisor but you are still my mentor and dear friend, always full of ideas and at the same time always listening.
Josefine Palle, friend and colleague, for sharing our common struggle to cope with work, family and research. There will never be enough time – do the best with what you’ve got!
Torgny, Gunnar, Richard, Johan, Erik, Bo and Anders, my fellow neo-natologists, for friendship and support and for sharing skills and knowledge as well as humour. Thank you for letting me take time to concentrate on my research – I shall soon be back in business. Special thanks to our late col-league Hans, I know that you are somewhere listening and making lots of comments.
All colleagues and friends at the University Children’s Hospital, for making this a generous place for working, learning, teaching and doing research, especially Mina Shebani, my colleague, for friendship and support.
All my friends and family, for being there when I need you.
Torbjörn, my bonus son, for your patience with your stepmother and your love for your little siblings.
My parents Margareta and Pelle Levén, for being my first supporters, al-ways being there, encouraging, helping, believing in and loving me.
Erik, for being my best friend and the love of my life. Agnes and Martin,our wonderful children, for being who you are.
This thesis was supported by grants from the Swedish Medical Research Council, the Jerring Foundation, Stiftelsen Samariten, the Wera Ekström Foundation, the Gillberg Foundation, the Swedish Society of Medicine, Nordisk Insulinfond and Novo Nordisk Pharma AB.

45
References
1. Hay WW, Jr., Sparks JW. Placental, fetal, and neonatal carbohydrate metabo-lism. Clin Obstet Gynecol 1985;28(3):473-85.
2. Illsley NP. Glucose transporters in the human placenta. Placenta 2000;21(1):14-22.
3. Kalhan SC, D'Angelo LJ, Savin SM, Adam PA. Glucose production in preg-nant women at term gestation. Sources of glucose for human fetus. Journal of Clinical Investigation 1979;63(3):388-94.
4. Catalano PM, Tyzbir ED, Wolfe RR, Calles J, Roman NM, Amini SB, et al. Carbohydrate metabolism during pregnancy in control subjects and women with gestational diabetes. American Journal of Physiology 1993;264(1 Pt 1):E60-7.
5. Kalhan S, Rossi K, Gruca L, Burkett E, O'Brien A. Glucose turnover and glu-coneogenesis in human pregnancy. Journal of Clinical Investigation 1997;100(7):1775-81.
6. Ciaraldi TP, Kettel M, el-Roeiy A, Madar Z, Reichart D, Yen SS, et al. Mecha-nisms of cellular insulin resistance in human pregnancy. American Journal of Obstetrics & Gynecology 1994;170(2):635-41.
7. Stanley K, Fraser R, Bruce C. Physiological changes in insulin resistance in human pregnancy: longitudinal study with the hyperinsulinaemic euglycaemic clamp technique. British Journal of Obstetrics & Gynaecology 1998;105(7):756-9.
8. Ryan EA, Enns L. Role of gestational hormones in the induction of insulin resistance. Journal of Clinical Endocrinology & Metabolism 1988;67(2):341-7.
9. Metzger BE, Unger RH, Freinkel N. Carbohydrate metabolism in pregnancy. XIV. Relationships between circulating glucagon, insulin, glucose and amino acids in response to a "mixed meal" in late pregnancy. Metabolism: Clinical & Experimental 1977;26(2):151-6.
10. Metzger BE, Phelps RL, Freinkel N, Navickas IA. Effects of gestational diabe-tes on diurnal profiles of plasma glucose, lipids, and individual amino acids. Diabetes Care 1980;3(3):402-9.
11. Cetin I, Ronzoni S, Marconi AM, Perugino G, Corbetta C, Battaglia FC, et al. Maternal concentrations and fetal-maternal concentration differences of plasma amino acids in normal and intrauterine growth-restricted pregnancies. American Journal of Obstetrics & Gynecology 1996;174(5):1575-83.
12. Sivan E, Homko CJ, Chen X, Reece EA, Boden G. Effect of insulin on fat metabolism during and after normal pregnancy. Diabetes 1999;48(4):834-8.
13. Wollmann HA. Intrauterine growth restriction: definition and etiology. Horm Res 1998;49(Suppl 2):1-6.
14. Marcus C, Ehren H, Bolme P, Arner P. Regulation of lipolysis during the neo-natal period. Importance of thyrotropin. J Clin Invest 1988;82(5):1793-7.
15. Hume R, Burchell A. Abnormal expression of glucose-6-phosphatase in pre-term infants. Arch Dis Child 1993;68(2):202-4.

46
16. Lucas A, Morley R, Cole TJ. Adverse neurodevelopmental outcome of moder-ate neonatal hypoglycaemia. BMJ 1988;297(6659):1304-8.
17. Vannuci R. Neurologic aspects of perinatal asphyxia. In: Pediatr Ann; 1978. p. 15-30.
18. Cathcart-Rake WF, Kyner JL, Azarnoff DL. Metabolic responses to plasma concentrations of theophylline. Clin Pharmacol Ther 1979;26(1):89-95.
19. Milner AD. Apnoea and bradycardia. In: Rennie JM, Roberton NRC, editors. Textbook of Neonatology. 3. ed. Edinburgh: Churcill Livingstone; 1999. p. 630-637.
20. Kalhan SC, Oliven A, King KC, Lucero C. Role of glucose in the regulation of endogenous glucose production in the human newborn. Pediatr Res 1986;20(1):49-52.
21. Hawdon JM, Ward Platt MP. Metabolic adaptation in small for gestational age infants. Arch Dis Child 1993;68(3 Spec No):262-8.
22. Haymond MW, Karl IE, Pagliara AS. Increased gluconeogenic substrates in the small-for-gestational-age infant. N Engl J Med 1974;291(7):322-8.
23. Hawdon JM, Weddell A, Aynsley-Green A, Ward Platt MP. Hormonal and metabolic response to hypoglycaemia in small for gestational age infants. Arch Dis Child 1993;68(3 Spec No):269-73.
24. Collins JE, Leonard JV, Teale D, Marks V, Williams DM, Kennedy CR, et al. Hyperinsulinaemic hypoglycaemia in small for dates babies. Arch Dis Child 1990;65(10):1118-20.
25. Barker DJ. In utero programming of chronic disease. Clin Sci (Lond) 1998;95(2):115-28.
26. Styne DM. Fetal growth. Clin Perinatol 1998;25(4):917-38, vii. 27. Kliegman RM. Intrauterine Growth Retardation. In: Fanaroff AA, Martin RJ,
editors. Neonatal-perinatal medicine : diseases of the fetus and neonate. 6. ed. St. Louis, Mo.; 1997. p. 203-240.
28. van Aerde JE, Wilke MS, Feldman M, Clandinin MT. Accretion of Lipid in the Fetus and Newborn. In: Fox WW, Polin RA, Abman SH, editors. Fetal and Neonatal Physiology. 3. ed. Philadelphia: Saunders; 2003. p. 388-404.
29. King JC. Physiology of pregnancy and nutrient metabolism. Am J Clin Nutr 2000;71(5 Suppl):1218S-25S.
30. Durnin JV. Energy requirements of pregnancy. Diabetes 1991;40 Suppl 2:152-6. 31. Herrera E, Amusquivar E. Lipid metabolism in the fetus and the newborn.
Diabetes Metab Res Rev 2000;16(3):202-10. 32. Butte NF, Hopkinson JM, Mehta N, Moon JK, Smith EO. Adjustments in
energy expenditure and substrate utilization during late pregnancy and lacta-tion. Am J Clin Nutr 1999;69(2):299-307.
33. Speroff L, Fritz MA. The Endocrinology of Pregnancy. In: Speroff L, Fritz MA, editors. Clinical Gynecologic Endocrinology and Infertility. 7. ed. Phila-delphia: Lippincott Williams&Wilkins; 2005. p. 259-315.
34. Kalkhoff RK, Kissebah AH, Kim HJ. Carbohydrate and lipid metabolism during normal pregnancy: relationship to gestational hormone action. Semin Perinatol 1978;2(4):291-307.
35. Frankenne F, Closset J, Gomez F, Scippo ML, Smal J, Hennen G. The physi-ology of growth hormones (GHs) in pregnant women and partial characteriza-tion of the placental GH variant. Journal of Clinical Endocrinology & Metabo-lism 1988;66(6):1171-80.
36. Eriksson L, Frankenne F, Eden S, Hennen G, Von Schoultz B. Growth hor-mone 24-h serum profiles during pregnancy--lack of pulsatility for the secre-

47
tion of the placental variant. British Journal of Obstetrics & Gynaecology 1989;96(8):949-53.
37. Chellakooty M, Vangsgaard K, Larsen T, Scheike T, Falck-Larsen J, Legarth J, et al. A longitudinal study of intrauterine growth and the placental growth hormone (GH)-insulin-like growth factor I axis in maternal circulation: asso-ciation between placental GH and fetal growth. J Clin Endocrinol Metab 2004;89(1):384-91.
38. Catalano PM, Tyzbir ED, Roman NM, Amini SB, Sims EA. Longitudinal changes in insulin release and insulin resistance in nonobese pregnant women. American Journal of Obstetrics & Gynecology 1991;165(6 Pt 1):1667-72.
39. Boden G. Fuel metabolism in pregnancy and in gestational diabetes mellitus. Obstet Gynecol Clin North Am 1996;23(1):1-10.
40. Butte NF. Carbohydrate and lipid metabolism in pregnancy: normal compared with gestational diabetes mellitus. Am J Clin Nutr 2000;71(5 Suppl):1256S-61S.
41. Barbour LA, Shao J, Qiao L, Pulawa LK, Jensen DR, Bartke A, et al. Human placental growth hormone causes severe insulin resistance in transgenic mice. Am J Obstet Gynecol 2002;186(3):512-7.
42. Sivan E, Homko CJ, Whittaker PG, Reece EA, Chen X, Boden G. Free fatty acids and insulin resistance during pregnancy. Journal of Clinical Endocrinol-ogy & Metabolism 1998;83(7):2338-42.
43. Kirwan JP, Hauguel-De Mouzon S, Lepercq J, Challier JC, Huston-Presley L, Friedman JE, et al. TNF-alpha is a predictor of insulin resistance in human pregnancy. Diabetes 2002;51(7):2207-13.
44. Oliver MH, Harding JE, Breier BH, Gluckman PD. Fetal insulin-like growth factor (IGF)-I and IGF-II are regulated differently by glucose or insulin in the sheep fetus. Reprod Fertil Dev 1996;8(1):167-72.
45. Vatten LJ, Nilsen ST, Odegard RA, Romundstad PR, Austgulen R. Insulin-like growth factor I and leptin in umbilical cord plasma and infant birth size at term. Pediatrics 2002;109(6):1131-5.
46. Brismar K, Fernqvist-Forbes E, Wahren J, Hall K. Effect of insulin on the hepatic production of insulin-like growth factor-binding protein-1 (IGFBP-1), IGFBP-3, and IGF-I in insulin-dependent diabetes. J Clin Endocrinol Metab 1994;79(3):872-8.
47. Bazaes RA, Salazar TE, Pittaluga E, Pena V, Alegria A, Iniguez G, et al. Glu-cose and lipid metabolism in small for gestational age infants at 48 hours of age. Pediatrics 2003;111(4 Pt 1):804-9.
48. Verhaeghe J, Pintiaux A, Van Herck E, Hennen G, Foidart JM, Igout A. Pla-cental GH, IGF-I, IGF-binding protein-1, and leptin during a glucose challenge test in pregnant women: relation with maternal body weight, glucose tolerance, and birth weight. J Clin Endocrinol Metab 2002;87(6):2875-82.
49. Morriss FH, Jr., Makowski EL, Meschia G, Battaglia FC. The glucose/oxygen quotient of the term human fetus. Biol Neonate 1974;25(1-2):44-52.
50. Sparks JW, Hay WW, Jr., Bonds D, Meschia G, Battaglia FC. Simultaneous measurements of lactate turnover rate and umbilical lactate uptake in the fetal lamb. J Clin Invest 1982;70(1):179-92.
51. Baschat AA. Fetal responses to placental insufficiency: an update. BJOG 2004;111(10):1031-41.
52. Kalhan SC, Mahajan S, Burkett E, Reshef L, Hanson RW. Glyceroneogenesis and the source of glycerol for hepatic triacylglycerol synthesis in humans. Journal of Biological Chemistry 2001;276(16):12928-31.

48
53. Freinkel N. Banting Lecture 1980. Of pregnancy and progeny. Diabetes 1980;29(12):1023-35.
54. Economides DL, Nicolaides KH. Blood glucose and oxygen tension levels in small-for-gestational-age fetuses.[comment]. American Journal of Obstetrics & Gynecology 1989;160(2):385-9.
55. Jansson T, Ylven K, Wennergren M, Powell TL. Glucose transport and system A activity in syncytiotrophoblast microvillous and basal plasma membranes in intrauterine growth restriction. Placenta 2002;23(5):392-9.
56. Haggarty P, Allstaff S, Hoad G, Ashton J, Abramovich DR. Placental nutrient transfer capacity and fetal growth. Placenta 2002;23(1):86-92.
57. Herrera E. Lipid metabolism in pregnancy and its consequences in the fetus and newborn. Endocrine 2002;19(1):43-55.
58. Emanuel I, Filakti H, Alberman E, Evans SJ. Intergenerational studies of hu-man birthweight from the 1958 birth cohort. 1. Evidence for a multigenera-tional effect. Br J Obstet Gynaecol 1992;99(1):67-74.
59. McIntire DD, Bloom SL, Casey BM, Leveno KJ. Birth weight in relation to morbidity and mortality among newborn infants. N Engl J Med 1999;340(16):1234-8.
60. Meredith HV. Body weight at birth of viable human infants: a worldwide com-parative treatise. Hum Biol 1970;42(2):217-64.
61. Kliegman RM. Problems in Metabolic Adaptation: Glucose, Calcium and Magnesium. In: Klaus MH, Fanaroff AA, editors. Care of the High-Risk Neo-nate. 5. ed. Philadelphia: Saunders; 2001. p. 301-323.
62. Niklasson A, Ericson A, Fryer JG, Karlberg J, Lawrence C, Karlberg P. An update of the Swedish reference standards for weight, length and head circum-ference at birth for given gestational age (1977-1981). Acta Paediatr Scand 1991;80(8-9):756-62.
63. Creasy RK, Resnik R. Intrauterine Growth Restriction. In: Creasy RK, Resnik R, editors. Maternal-Fetal Medicine. 4. ed. Philadelphia: Saunders; 1999. p. 569-584.
64. Bougneres PF. Stable isotope tracers and the determination of fuel fluxes in newborn infants. Biol Neonate 1987;52(Suppl 1):87-96.
65. Kalhan SC. Metabolism of Glucose and Methods of Investigation in the Fetus and Newborn. In: Fox WW, Polin RA, Abman SH, editors. Fetal and Neonatal Physiology. 3. ed. Philadelphia: Saunders; 2003. p. 449-464.
66. Settergren G, Lindblad BS, Persson B. Cerebral blood flow and exchange of oxygen, glucose ketone bodies, lactate, pyruvate and amino acids in anesthe-tized children. Acta Paediatr Scand 1980;69(4):457-65.
67. Lucas A, Boyes S, Bloom SR, Aynsley-Green A. Metabolic and endocrine responses to a milk feed in six-day-old term infants: differences between breast and cow's milk formula feeding. Acta Paediatr Scand 1981;70(2):195-200.
68. Hawdon JM, Ward Platt MP, Aynsley-Green A. Patterns of metabolic adapta-tion for preterm and term infants in the first neonatal week. Arch Dis Child 1992;67(4 Spec No):357-65.
69. Williamsson DH, Thornton PS. Ketone Body Production and Metabolism in the Fetus and Neonate. In: Fox WW, Polin RA, Abman SH, editors. Fetal and Neonatal Physiology. 3. ed. Philadelphia: Saunders; 2003. p. 419-428.
70. Cowett RM, Oh W, Schwartz R. Persistent glucose production during glucose infusion in the neonate. J Clin Invest 1983;71(3):467-75.
71. Ogata ES. Carbohydrate metabolism in the fetus and neonate and altered neo-natal glucoregulation. Pediatr Clin North Am 1986;33(1):25-45.

49
72. Sunehag A, Ewald U, Larsson A, Gustafsson J. Glucose production rate in extremely immature neonates (< 28 weeks) studied by use of deuterated glu-cose. Pediatric Research 1993;33(2):97-100.
73. Sunehag A, Gustafsson J, Ewald U. Very immature infants (< or = 30 Wk) respond to glucose infusion with incomplete suppression of glucose produc-tion. Pediatric Research 1994;36(4):550-5.
74. Sunehag A, Ewald U, Gustafsson J. Extremely preterm infants (< 28 weeks) are capable of gluconeogenesis from glycerol on their first day of life. Pediat-ric Research 1996;40(4):553-7.
75. Munshi UK, Deorari AK, Paul VK, Singh M. Effects of maternal labetalol on the newborn infant. Indian Pediatr 1992;29(12):1507-12.
76. Papageorgiou AN, Desgranges MF, Masson M, Colle E, Shatz R, Gelfand MM. The antenatal use of betamethasone in the prevention of respiratory dis-tress syndrome: a controlled double-blind study. Pediatrics 1979;63(1):73-9.
77. Grassi V, Boschetti E, Tantucci C. Round table on antiasthmatic drugs; beta-agonists and theophylline. Workshop on pathogenesis and therapy of bronchial asthma Cortina d'Ampezzo/1-4 April, 1987. Eur Respir J Suppl 1989;6:551s-555s.
78. Kearney TE, Manoguerra AS, Curtis GP, Ziegler MG. Theophylline toxicity and the beta-adrenergic system. Ann Intern Med 1985;102(6):766-9.
79. Peters EJ, Klein S, Wolfe RR. Effect of short-term fasting on the lipolytic response to theophylline. Am J Physiol 1991;261(4 Pt 1):E500-4.
80. Srinivasan G, Pildes RS, Jaspan JB, Singh J, Shankar H, Yeh TF, et al. Meta-bolic effects of theophylline in preterm infants. J Pediatr 1981;98(5):815-7.
81. Bergstrand H. Phosphodiesterase inhibition and theophylline. Eur J Respir Dis Suppl 1980;109:37-44.
82. Fredholm BB. On the mechanism of action of theophylline and caffeine. Acta Med Scand 1985;217(2):149-53.
83. Fjeld CR, Cole FS, Bier DM. Energy expenditure, lipolysis, and glucose pro-duction in preterm infants treated with theophylline. Pediatr Res 1992;32(6):693-8.
84. Hawdon JM, Aynsley-Green A. Metabolic disease: Disorders of blood glucose homeostasis in the neonate. In: Rennie JM, Roberton NRC, editors. Textbook of Neonatology. Edinburgh: Churchill Livingstone; 1999. p. 939-956.
85. Cowett RM, Susa JB, Oh W, Schwartz R. Glucose kinetics in glucose-infused small for gestational age infants. Pediatr Res 1984;18(1):74-9.
86. Kalhan SC, Parimi P, Van Beek R, Gilfillan C, Saker F, Gruca L, et al. Estima-tion of gluconeogenesis in newborn infants. American Journal of Physiology - Endocrinology & Metabolism 2001;281(5):E991-7.
87. Sunehag A, Gustafsson J, Ewald U. Glycerol carbon contributes to hepatic glucose production during the first eight hours in healthy term infants. Acta Paediatrica 1996;85(11):1339-43.
88. Bier DM, Leake RD, Haymond MW, Arnold KJ, Gruenke LD, Sperling MA, et al. Measurement of "true" glucose production rates in infancy and childhood with 6,6-dideuteroglucose. Diabetes 1977;26(11):1016-23.
89. Christensen NC. Free fatty acids, glycerol and triglycerides during the first 24 hours in infants with a birth weight less than or equal to 2700 grams. Acta Pae-diatr Scand 1981;70(4):485-90.
90. Sabel KG, Olegard R, Mellander M, Hildingsson K. Interrelation between fatty acid oxidation and control of gluconeogenic substrates in small-for-gestational-age (SGA) infants with hypoglycemia and with normoglycemia. Acta Paediatr Scand 1982;71(1):53-61.
50
91. Patel D, Kalhan S. Glycerol metabolism and triglyceride-fatty acid cycling in the human newborn: effect of maternal diabetes and intrauterine growth retar-dation. Pediatric Research 1992;31(1):52-8.
92. Ogilvy-Stuart AL, Hands SJ, Adcock CJ, Holly JM, Matthews DR, Mohamed-Ali V, et al. Insulin, insulin-like growth factor I (IGF-I), IGF-binding protein-1, growth hormone, and feeding in the newborn. J Clin Endocrinol Metab 1998;83(10):3550-7.
93. Gilbert WM, Danielsen B. Pregnancy outcomes associated with intrauterine growth restriction. Am J Obstet Gynecol 2003;188(6):1596-9; discussion 1599-601.
94. Garite TJ, Clark R, Thorp JA. Intrauterine growth restriction increases morbid-ity and mortality among premature neonates. Am J Obstet Gynecol 2004;191(2):481-7.
95. Klaus MH, Fanaroff AA. The Physical Environment. In: Klaus MH, Fanaroff AA, editors. Care of the High-Risk Neonate. 5. ed. Philadelphia: Saunders; 2001. p. 130-146.
96. Baley JE, Goldfarb J. Neonatal Infections. In: Klaus MH, Fanaroff AA, edi-tors. Care of the High-Risk Neonate. 5. ed. Philadelphia: Saunders; 2001. p. 363-392.
97. Albertsson-Wikland K, Karlberg J. Postnatal growth of children born small for gestational age. Acta Paediatr Suppl 1997;423:193-5.
98. Pryor J, Silva PA, Brooke M. Growth, development and behaviour in adoles-cents born small-for-gestational-age. J Paediatr Child Health 1995;31(5):403-7.
99. O'Keeffe MJ, O'Callaghan M, Williams GM, Najman JM, Bor W. Learning, cognitive, and attentional problems in adolescents born small for gestational age. Pediatrics 2003;112(2):301-7.
100. Barker DJ, Winter PD, Osmond C, Margetts B, Simmonds SJ. Weight in in-fancy and death from ischaemic heart disease. Lancet 1989;2(8663):577-80.
101. Bavdekar A, Yajnik CS, Fall CH, Bapat S, Pandit AN, Deshpande V, et al. Insulin resistance syndrome in 8-year-old Indian children: small at birth, big at 8 years, or both? Diabetes 1999;48(12):2422-9.
102. Bazaes RA, Alegria A, Pittaluga E, Avila A, Iniguez G, Mericq V. Determi-nants of insulin sensitivity and secretion in very-low-birth-weight children. J Clin Endocrinol Metab 2004;89(3):1267-72.
103. Hofman PL, Regan F, Jackson WE, Jefferies C, Knight DB, Robinson EM, et al. Premature birth and later insulin resistance. N Engl J Med 2004;351(21):2179-86.
104. Wolfe RR. Basic characteristics of isotope tracers. In: Wolfe RR, editor. Ra-dioactive and stable isotope tracers in biomedicine. Principles and practice of kinetic analysis. New York: Wiley-Liss Inc; 1992. p. 1-17.
105. Bier DM. The use of stable isotopes in metabolic investigation. Baillieres Clin Endocrinol Metab 1987;1(4):817-36.
106. Guideline on Validation of Limulus Amebocyte Lysate Test as End-Product Endotoxin Test for Human and Animal Parenteral Drugs, Biological Products and Medical Devices. Washington, DC: Food and Drug Administration; 1987.
107. Stridsberg M, Oberg K, Li Q, Engstrom U, Lundqvist G. Measurements of chromogranin A, chromogranin B (secretogranin I), chromogranin C (secreto-granin II) and pancreastatin in plasma and urine from patients with carcinoid tumours and endocrine pancreatic tumours. J Endocrinol 1995;144(1):49-59.
108. Swenne I, Ewald U, Gustafsson J, Sandberg E, Ostenson CG. Inter-relationship between serum concentrations of glucose, glucagon and insulin

51
during the first two days of life in healthy newborns. Acta Paediatr 1994;83(9):915-9.
109. Tserng KY, Kalhan SC. Calculation of substrate turnover rate in stable isotope tracer studies. Am J Physiol 1983;245(3):E308-11.
110. Bougneres PF, Karl IE, Hillman LS, Bier DM. Lipid transport in the human newborn. Palmitate and glycerol turnover and the contribution of glycerol to neonatal hepatic glucose output. J Clin Invest 1982;70(2):262-70.
111. Rohl J, Huston-Presley L, Amini S, Stepanchak B, Catalano P. Factors associ-ated with fetal growth and body composition as measured by ultrasound. American Journal of Obstetrics & Gynecology 2001;185(6):1416-20.
112. Klein S, Young VR, Blackburn GL, Bistrian BR, Wolfe RR. The impact of body composition on the regulation of lipolysis during short-term fasting. J Am Coll Nutr 1988;7(1):77-84.
113. Marconi AM, Davoli E, Cetin I, Lanfranchi A, Zerbe G, Fanelli R, et al. Im-pact of conceptus mass on glucose disposal rate in pregnant women. Am J Physiol 1993;264(4 Pt 1):E514-8.
114. Mayes PA. Gluconeogenesis and control of the blood glucose. In: Murray RK, Granner DK, Mayes PA, Rodwell VW, editors. Harper´s Biochemistry. East Norwalk, Connecticut: Appleton and Lange; 1993. p. 192-200.
115. Homko CJ, Sivan E, Reece EA, Boden G. Fuel metabolism during pregnancy. Seminars in Reproductive Endocrinology 1999;17(2):119-25.
116. Lasuncion MA, Lorenzo J, Palacin M, Herrera E. Maternal factors modulating nutrient transfer to fetus. Biology of the Neonate 1987;51(2):86-93.
117. Hay WW, Jr. Placental transport of nutrients to the fetus. Hormone Research 1994;42(4-5):215-22.
118. Holmes R, Montemagno R, Jones J, Preece M, Rodeck C, Soothill P. Fetal and maternal plasma insulin-like growth factors and binding proteins in pregnancies with appropriate or retarded fetal growth. Early Hum Dev 1997;49(1):7-17.
119. McIntyre HD, Serek R, Crane DI, Veveris-Lowe T, Parry A, Johnson S, et al. Placental growth hormone (GH), GH-binding protein, and insulin-like growth factor axis in normal, growth-retarded, and diabetic pregnancies: correlations with fetal growth. J Clin Endocrinol Metab 2000;85(3):1143-50.
120. Westwood M. Role of insulin-like growth factor binding protein 1 in human pregnancy. Reviews of Reproduction 1999;4(3):160-7.
121. Halldin M.U., Hagenäs L., Tuvemo T., J. G. Profound changes in GH-IGF I-system in adolescent girls with IDDM: can IGFBP1 be used to reflect overall glucose regulation? Pediatric Diabetes 2000;1:121.
122. Ogata ES. Carbohydrate Homeostasis. In: Avery GB, Fletcher MA, Mac-Donald MG, editors. Neonatology Pathophysiology and Management of the Newborn. 5. ed. Philadelphia: Lippincott Williams&Wilkins; 1999. p. 699-714.
123. Zarlengo KM, Battaglia FC, Fennessey P, Hay WW, Jr. Relationship between glucose utilization rate and glucose concentration in preterm infants. Biol Neonate 1986;49(4):181-9.
124. Bougneres PF, Castano L, Rocchiccioli F, Gia HP, Leluyer B, Ferre P. Me-dium-chain fatty acids increase glucose production in normal and low birth weight newborns. Am J Physiol 1989;256(5 Pt 1):E692-7.
125. Farrag HM, Nawrath LM, Healey JE, Dorcus EJ, Rapoza RE, Oh W, et al. Persistent glucose production and greater peripheral sensitivity to insulin in the neonate vs. the adult. Am J Physiol 1997;272(1 Pt 1):E86-93.
126. Soto N, Bazaes RA, Pena V, Salazar T, Avila A, Iniguez G, et al. Insulin sensi-tivity and secretion are related to catch-up growth in small-for-gestational-age

52
infants at age 1 year: results from a prospective cohort. J Clin Endocrinol Me-tab 2003;88(8):3645-50.
127. Collins JE, Leonard JV. Hyperinsulinism in asphyxiated and small-for-dates infants with hypoglycaemia. Lancet 1984;2(8398):311-3.
128. Hawdon JM, Aynsley-Green A, Bartlett K, Ward Platt MP. The role of pan-creatic insulin secretion in neonatal glucoregulation. II. Infants with disordered blood glucose homoeostasis. Arch Dis Child 1993;68(3 Spec No):280-5.


Acta Universitatis UpsaliensisDigital Comprehensive Summaries of Uppsala Dissertationsfrom the Faculty of Medicine 22
Editor: The Dean of the Faculty of Medicine
A doctoral dissertation from the Faculty of Medicine, Uppsala University, is usually a summary of a number of papers. A few copies of the complete dissertation are kept at major Swedish research libraries, while the summary alone is distributed internationally through the series Digital Comprehensive Summaries of Uppsala Dissertations from the Faculty of Medicine. (Prior to January, 2005, the series was published under the title "Comprehensive Summaries of Uppsala Dissertations from the Faculty of Medicine".)
Distribution: publications.uu.seurn:nbn:se:uu:diva-4842
ACTAUNIVERSITATIS
UPSALIENSISUPPSALA
2005