effect of mirtazapine on metabolism and energy substrate
TRANSCRIPT

Effect of mirtazapine on metabolism and energy substratepartitioning in healthy men
Johannes M. Hennings, … , Stephany Fulda, Stefan Kloiber
JCI Insight. 2019;4(1):e123786. https://doi.org/10.1172/jci.insight.123786.
BACKGROUND. Weight gain and metabolic changes during treatment with antidepressant drugs have emerged as animportant concern, particularly in long-term treatment. It is still a matter of ongoing debate whether weight gain andmetabolic perturbations with antidepressant use are the consequence of increased appetite and weight gain, respectively,or represents direct pharmacological effects of the drug on metabolism.
METHODS. We therefore conducted a proof-of-concept, open-label clinical trial, hypothesizing that in exceptionallyhealthy men no change of metabolic parameters would occur under mirtazapine, when environmental factors such asnutrition, sleep, and physical exercise were controlled and kept constant. Over a 3-week preparation phase, 10 healthy,young men were attuned to a standardized diet adjusted to their individual caloric need, to a regular sleep/wake cycle andmoderate exercise. Continuing this protocol, we administered 30 mg mirtazapine daily for 7 days.
RESULTS. While no significant weight gain or changes in resting energy expenditure were observed under theseconditions, hunger and appetite for sweets increased with mirtazapine, accompanied by a shift in energy substratepartitioning towards carbohydrate substrate preference as assessed by indirect calorimetry. Furthermore, withmirtazapine, insulin and C-peptide release increased in response […]
Clinical Medicine Metabolism Neuroscience
Find the latest version:
https://jci.me/123786/pdf

1insight.jci.org https://doi.org/10.1172/jci.insight.123786
C L I N I C A L M E D I C I N E
Authorship note: SF and SK contributed equally to this work.
Conflict of interest: FH is cofounder of the biotech company HolsboerMaschmeyerNeuroChemie GmbH (HMNC GmbH) in Germany. FH and MU are co-inventors on the following patent applications: “FKBP5: a novel target for antidepressant therapy” (international application number WO 2005/054500) and “Polymorphisms in ABCB1 associated with a lack of clinical response to medicaments” (international application number PCT/EP2005/005194).
License: Copyright 2019, American Society for Clinical Investigation.
Submitted: July 24, 2018 Accepted: November 29, 2018 Published: January 10, 2019
Reference information: JCI Insight. 2019;4(1):e123786. https://doi.org/10.1172/jci.insight.123786.
Effect of mirtazapine on metabolism and energy substrate partitioning in healthy menJohannes M. Hennings,1 Sarah Heel,1 Katharina Lechner,1 Manfred Uhr,1 Tatjana Dose,1 Ludwig Schaaf,2 Florian Holsboer,1 Susanne Lucae,1 Stephany Fulda,1 and Stefan Kloiber1
1Max Planck Institute of Psychiatry, Munich, Germany. 2Clinic for Neuroendocrinology and Andrology, Max Planck Institute
of Psychiatry, Munich, Germany.
IntroductionAntidepressant drugs play an important role in the treatment of mood and anxiety disorders (1), with increased prescription rates worldwide over recent decades (2). Newer antidepressants, such as mirtazapine, have a more favorable side-effect profile and are thus increasingly used as first-line treatment. Nevertheless, weight gain and metabolic disturbances are reported even with these newer antidepressant agents, often leading to discontinuation of treatment despite sufficient antidepressant effectiveness (3, 4). Weight gain has been observed for various substances both during the acute and maintenance phase of treatment (5) including selective serotonin reuptake inhibitors (SSRIs), serotonin and norepinephrine reuptake inhibitors (SNRIs), and atypical antidepressants such as mirtazapine. Metabolic alterations associated with antidepres-sant treatment mainly affect glycemic control (4) and blood lipids (6). However, the literature is inconclusive about general metabolic effects of antidepressants and opposite effects have been reported as well (7, 8).
Although weight gain and metabolic alterations are frequently attributed to antidepressant-induced adverse effects, depression itself harbors risk for obesity and metabolic disorders (9). Specifically, depression and type 2 diabetes have a bidirectional relationship, i.e., major depression increases the risk for developing diabetes and vice versa (10). The presence of each condition, furthermore, has a negative impact on both
BACKGROUND. Weight gain and metabolic changes during treatment with antidepressant drugs have emerged as an important concern, particularly in long-term treatment. It is still a matter of ongoing debate whether weight gain and metabolic perturbations with antidepressant use are the consequence of increased appetite and weight gain, respectively, or represents direct pharmacological effects of the drug on metabolism.
METHODS. We therefore conducted a proof-of-concept, open-label clinical trial, hypothesizing that in exceptionally healthy men no change of metabolic parameters would occur under mirtazapine, when environmental factors such as nutrition, sleep, and physical exercise were controlled and kept constant. Over a 3-week preparation phase, 10 healthy, young men were attuned to a standardized diet adjusted to their individual caloric need, to a regular sleep/wake cycle and moderate exercise. Continuing this protocol, we administered 30 mg mirtazapine daily for 7 days.
RESULTS. While no significant weight gain or changes in resting energy expenditure were observed under these conditions, hunger and appetite for sweets increased with mirtazapine, accompanied by a shift in energy substrate partitioning towards carbohydrate substrate preference as assessed by indirect calorimetry. Furthermore, with mirtazapine, insulin and C-peptide release increased in response to a standardized meal.
CONCLUSION. Our findings provide important insights into weight-independent metabolic changes associated with mirtazapine and allow a better understanding of the long-term metabolic effects observed in patients treated with antidepressant drugs.
TRIAL REGISTRATION. ClinicalTrials.gov NCT00878540.
FUNDING. Nothing to declare.

2insight.jci.org https://doi.org/10.1172/jci.insight.123786
C L I N I C A L M E D I C I N E
normalization of glycemic control and on recovery of depressive symptoms (11). Furthermore, some indi-viduals increase consumption of sweets and energy-dense food while depressed (12), reduce or pause phys-ical exercise (13), or experience an increase in peripheral cortisol leading to metabolic abnormalities (14). Another group of depressed patients eat substantially less during a depressive episode and regain weight when recovering with antidepressant treatment (15), an effect that may be falsely attributed to antidepres-sant-associated adverse effects. Finally, effects on metabolism and weight may not be a general class effect of antidepressants, but specific to certain drugs associated with their unique pharmacological profile (16).
Thus, the unsolved and complex question remains whether weight gain and metabolic changes during antidepressant treatment are the consequence of drug-induced appetite and altered eating behavior (e.g., binge eating, starvation) or potentially mirror specific pharmacological influence on energy metabolism. We therefore conducted a proof-of-concept study in 10 young, exceptionally healthy men of European descent receiving mirtazapine under highly standardized conditions, excluding as far as possible factors that may confound with unspecific effects of antidepressant medication, i.e., changes in physical activity, sleep/wake cycles, or changes in food intake. We hypothesized that under these stable and highly standard-ized conditions including restricted and consistent caloric intake, no untoward metabolic changes would occur during exposure to the antidepressant mirtazapine. We assessed glucose metabolism by repeated measures of HbA1c, fasting glucose, and two glucose tolerance tests as well as indirect calorimetry.
ResultsThe study flow and protocol are depicted in Figure 1. Participants were between 21 and 24 years of age (mean 22.2 ± 1.2 SD). At inclusion, mean BMI was 22.9 kg/m2 ± 1.4 SD and waist-to-hip ratio was 0.88 ± 0.05 SD. During the 10-day study phase (baseline days and medication days) the mean caloric intake was 2,797 kcal/d ± 236 SD with a maximum day-to-day caloric difference of 5.94% ± 1.3% SD. The mean fat content per study day was 37.22% ± 1.8% SD (minimum 34.08%, maximum 39.53%); the mean carbohy-drate content 49.29% ± 2.1% SD (minimum 46.59%, maximum 52.89%); and the mean protein content was 13.32% ± 0.36% SD (minimum 12.81%, maximum 13.76%). Caloric intake on the day before each calorimetry was 2,756 kcal/d ± 237 SD and 2,730 kcal/d ± 245 SD, respectively. During administration of mirtazapine, we observed periodic leg movements during sleep in 8 subjects. Three subjects reported transient restless symptoms (discussed in ref. 17).
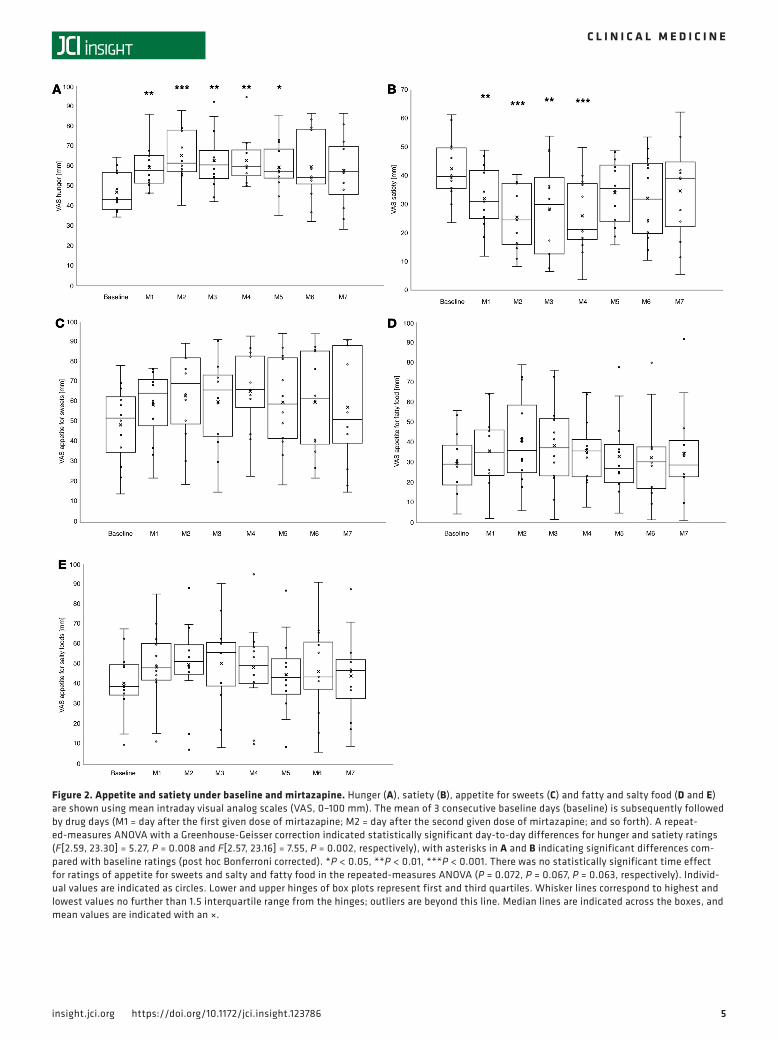
Changes in appetite, satiety, and weight. Compared with baseline, hunger and appetite for sweets increased during mirtazapine exposure (48.4 to 59.4 mm, t = –3.779, P = 0.004; 46.7 to 56.8 mm, t = –2.705, P = 0.024, respectively), while satiety decreased (40.8 to 30.8 mm, t = 3.886, P = 0.004) and appetite for salty and fatty food did not change significantly (41.0 to 47.1 mm, t = –1.624, P = 0.139; 31.5 to 37.4 mm, t = –2.23, P = 0.053). Using a repeated-measures ANOVA and Bonferroni’s post hoc test, the most significant changes in hunger and satiety occurred within the first 4 days after the first given mirtazapine dose, with the most prominent peak (or trough, respectively) after 2 days (Figure 2, A and B). Contrasting the increase in hunger and appetite, waist-to-hip ratio did not change, and body weight and BMI slightly decreased during mirtazapine exposure (Table 1). While the decrease in weight and BMI were numerically small (0.58 kg and 0.2 kg/m2, respectively), they were highly systematic, i.e., observed in all participants in the same direction (Supplemental Table 1; supplemental material available online with this article; https://doi.org/10.1172/jci.insight.123786DS1).
Metabolic measures: lipids, glucose metabolism, and energy expenditure. Results and statistics of basic meta-bolic measures are depicted in Table 1. Analyses of plasma lipids revealed a decrease in total cholesterol and HDL and LDL cholesterol, while the triglyceride/HDL ratio increased with mirtazapine. Triglycerides and the HDL/LDL ratio remained unchanged. Glycosylated hemoglobin increased slightly, but other mea-sures of glucose metabolism, i.e., fasting plasma glucose, fasting insulin, fasting C-peptide, and the homeo-stasis model assessment of insulin resistance (HOMA-IR) did not change with exposure to mirtazapine. Neither resting energy expenditure (REE) nor respiratory quotient (RQ) changed during administration of mirtazapine (Figure 3).
Glucose tolerance testing. After ingestion of a standardized test meal, insulin and C-peptide (AUC) signifi-cantly increased after exposure to mirtazapine (777.6 μU/ml ± 357.0 SD vs. 1,086.8 μU/ml ± 404.0 SD; t = –2.423; P = 0.038, and 168.8 nmol/l ± 36.7 vs. 196.9 nmol/l ± 34.6 SD; t = –2.769; P = 0.022, respective-ly), while glucose levels remained unchanged (15,366.9 mg/dl ± 2,390.4 SD vs. 16,515.6 mg/dl ± 1,726.7 SD; t = –1.593; P = 0.146) (Figure 4). A medium-to-high effect (change score; see ref. 18) was found for
3insight.jci.org https://doi.org/10.1172/jci.insight.123786
C L I N I C A L M E D I C I N E
the change in the AUC for insulin and C-peptide (0.77 [0.65–0.89] and 0.88 [0.74–1.01], respectively). The effect sizes for the change in the glucose AUC was 0.5 (0.41–0.6). Compared with medication-free baseline, no significant changes in peak glucose (107.5 mg/dl ± 15.3 SD vs. 96.0 mg/dl ± 21.4 SD, t = –1.383; P = 0.2), insulin (15.5 μU/ml ± 7.5 SD vs. 9.3 μU/ml ± 5.6 SD, t = –2.168; P = 0.058), and C-peptide (1.9 nmo-l/l ± 0.5 SD vs. 1.5 nmol/l ± 0.5 SD, t = –2.065; P = 0.069) concentrations were observed after 60 minutes.
Correlations of changes in appetite with REE and RQ. As hunger and appetite for sweets in particular increased with mirtazapine — while food intake remained constant due to the dietary clamping protocol — we tested the hypothesis that the increase in appetite for sweets with mirtazapine correlated with measures of energy metabolism, i.e., calorimetry measures REE and RQ. We observed a significant correlation of the change in RQ (ΔRQ) with mean appetite for sweets with mirtazapine (rs = 0.809, P = 0.005; Figure 5D). A positive correlation with ΔRQ was also found with ratings of hunger (rs = 0.723, P = 0.018; Figure 5A), appetite for sweets (rs = 0.705, P = 0.023; Figure 5B) and fatty food (rs = 0.736, P = 0.015) as a predictive measure at baseline, but not for basal satiety (rs = –0.359, P = 0.309) or appetite for salty food (rs = 0.590, P = 0.073). ΔRQ did not correlate with overall hunger (rs = 0.602, P = 0.066; Figure 5C), satiety (rs = 0.000, P = 0.99), or appetite for salty (rs = 0.608, P = 0.062) or fatty food (rs = 0.535, P = 0.111). In addition, baseline hunger was predictive for hunger and appetite for sweets under mirtazapine (Supplemental Table 2). No significant correlation was found for these parameters with changes in REE (ΔREE: P = 0.174, P = 0.533, P = 0.676, P = 0.446, P = 0.881, P = 0.511, P = 0.533, P = 0.855, P = 0.556, P = 0.987, respectively).
As the increase of RQ may be an indicator of a shift towards carbohydrate substrate preference, we extended the correlation analysis post hoc to the glucose tolerance measures. Nevertheless, we found no correlation of glucose tolerance measured by the modified oral glucose tolerance test (mOGTT) with RQ (Supplemental Table 2). We observed a negative correlation of baseline REE with ΔAUCIns and ΔAUCC-pep (rs = –0.636, P = 0.048; rs = –0.745, P = 0.013, respectively).
Taken together, our results show that hunger, and especially craving for sweets after mirtazapine expo-sure, correlates with an increase in RQ, while REE remains unchanged. Changes in appetite under mir-tazapine did not correlate with changes in the mOGTT parameters.
Analysis of possible confounding factors. As the nutrient composition (content of carbohydrates, lipids, and protein) may impact on calorimetric measures (19), we correlated the RQ, REE, ΔRQ, and ΔREE with the amount of carbohydrates, lipids, and protein as well as the total caloric intake on the day before the calo-rimetry but did not find a significant effect (data not shown). Although we tried to harmonize the fasting period before calorimetry by setting the time of last caloric intake to 7:00 pm the day before measurement for all subjects, interindividual differences occurred due to procedural reasons (one measurement at a time, up to 2 measurements on one day). Nevertheless, fasting times before caloric measurement (assessed by the time when measurement was completed, as the last 30 minutes were used for the calculation of REE and RQ) did not differ between baseline and mirtazapine (mean time of the day [hours/minutes/seconds] 9:33:42 ± 0:26:44 SD vs. 9:50:18 ± 0:20:17 SD, P = 0.56; paired t test), and there were no correlations of the fasting time with the REE and RQ values, neither at baseline (rs = 0.529, P = 0.116; rs = –0.297, P = 0.405, respectively), nor after mirtazapine (rs = 0.152, P = 0.676; rs = –0.584, P = 0.077, respectively). Addressing the within-subject perspective of this important factor, we further did not find significant correlations of individual difference of fasting time between measurements (0:17:35 ± 1:02:50 SD) and the ΔREE and ΔRQ, respectively (rs = 0.505, P = 0.137; rs = –0.28, P = 0.432, respectively).
A significant correlation of total plasma mirtazapine concentration (AUC of mirtazapine and desmethyl-mirtazapine, the active metabolite of mirtazapine) was found with the peak insulin in the mOGTT after 60 minutes and the AUC of insulin (rs = 0.709, P = 0.022; rs = 0.648, P = 0.043, respective-ly). No further correlation of plasma mirtazapine concentration with other parameters was found, includ-ing changes in weight, hunger, appetite for sweet foods, and calorimetry. No correlations of weight and BMI were found with visual analog scales (VAS), mOGTT, or calorimetric parameters (data not shown).
DiscussionThis is the first study to our knowledge investigating the short-term effects of the antidepressant mirtazap-ine on glucose and lipid metabolism in healthy men in a highly controlled in-ward experimental setting with standardized caloric intake, physical activity, and sleep/wake cycles. The rationale of this study was that mirtazapine is suspected to induce weight gain in a substantial number of individuals, which is, in the light of their increased risk of converting to type 2 diabetes or hyperlipidemia, an important clinical issue.

4insight.jci.org https://doi.org/10.1172/jci.insight.123786
C L I N I C A L M E D I C I N E
We report 4 major findings. First, in healthy male subjects under standardized conditions, no sig-nificant change in REE was observed with mirtazapine. Notwithstanding, weight slightly decreased, while hunger and particularly appetite for sweets increased. Second, even in the context of slightly reduced weight and stable nutrition, mOGTT-assessed insulin and C-peptide release were increased after exposure to mirtazapine, as well as the plasma triglyceride/HDL quotient and HbA1c. Further-more, a shift in energy substrate partitioning towards carbohydrate substrate preference (as measured by RQ) with mirtazapine highly correlated with increases in hunger and appetite for sweets, nota bene under standardized nutrition. Finally, baseline hunger was predictive for increased hunger and appetite for sweets with mirtazapine.
With respect to mirtazapine’s metabolic effects, the data are generally inconclusive, with mixed results. While several studies have raised concerns about adverse metabolic side effects like hyperlipidemia and weight gain (20–22), other studies suspected a “beneficial” effect on glucose metabolism (7, 8). In particu-lar, decreased fasting glucose levels (7, 23) and increased fasting insulin (8) have been observed in depressed patients treated with mirtazapine. As these changes in glucose metabolism were observed predominantly in patients recovering from depression, a normalization of hypercortisolemia, as frequently observed in acute-ly depressed patients (further linked to glycogenolysis and hyperglycemic metabolic states) (14, 24), might be one mechanism explaining these findings. Further, a suppressive effect on the hypothalamic/pituitary/adrenocortical (HPA) axis has been observed in depressed patients under mirtazapine independent from the psychopathological state (25).
Figure 1. Overview of the study. (A) Study flow diagram. (B) Study protocol. Note that the narrowing bars in the upper part of B are intended to symbolize the extent of standardization means, i.e., instructions for regular sleep, exercise, and nutrition at the screening visit, control of hunger/satiety, adaptation of caloric need, sleep diaries, and activity protocols at control visits during the preparatory phase, and, finally, the continuation of standardized diet, sleep/wake cycle, and physical activity during the laboratory phase under continuous 24 hours/day visual control.
5insight.jci.org https://doi.org/10.1172/jci.insight.123786
C L I N I C A L M E D I C I N E
Figure 2. Appetite and satiety under baseline and mirtazapine. Hunger (A), satiety (B), appetite for sweets (C) and fatty and salty food (D and E) are shown using mean intraday visual analog scales (VAS, 0–100 mm). The mean of 3 consecutive baseline days (baseline) is subsequently followed by drug days (M1 = day after the first given dose of mirtazapine; M2 = day after the second given dose of mirtazapine; and so forth). A repeat-ed-measures ANOVA with a Greenhouse-Geisser correction indicated statistically significant day-to-day differences for hunger and satiety ratings (F[2.59, 23.30] = 5.27, P = 0.008 and F[2.57, 23.16] = 7.55, P = 0.002, respectively), with asterisks in A and B indicating significant differences com-pared with baseline ratings (post hoc Bonferroni corrected). *P < 0.05, **P < 0.01, ***P < 0.001. There was no statistically significant time effect for ratings of appetite for sweets and salty and fatty food in the repeated-measures ANOVA (P = 0.072, P = 0.067, P = 0.063, respectively). Individ-ual values are indicated as circles. Lower and upper hinges of box plots represent first and third quartiles. Whisker lines correspond to highest and lowest values no further than 1.5 interquartile range from the hinges; outliers are beyond this line. Median lines are indicated across the boxes, and mean values are indicated with an ×.

6insight.jci.org https://doi.org/10.1172/jci.insight.123786
C L I N I C A L M E D I C I N E
Mirtazapine blocks noradrenergic α2-autoreceptors and -heteroreceptors as well as serotonergic 5-HT2 and 5-HT3 receptors (26). Although peripheral mirtazapine α2 action has not been extensively investigated, it has been shown that blockage of pancreatic β cell α2-adrenoceptors with various substances disinhibits insulin secretion and reduces glucagon secretion, both decreasing blood glucose (27). In line with this, α2-adrenoceptor antagonists like midaglizole promotes insulin secretion in diabetic and nondiabetic sub-jects (28). Similarly, decreased fasting glucose and increased fasting insulin blood levels have been reported under mirtazapine in depressed patients (7, 8). Contrasting the observation of increased insulin release with mirtazapine in our study, other noradrenergic antidepressants without α2 action can reduce glucose toler-ance (29), as enhanced noradrenergic signaling inhibits insulin secretion, increases glucagon secretion from the endocrine pancreas, and stimulates gluconeogenesis and glycogenolysis in the liver (30). In the present study, mOGTT insulin and C-peptide increased with mirtazapine in mentally and physically healthy males under clamped dietary conditions, i.e., neither hormonal states (e.g., depression-related elevated stress hor-mones, hormonal alterations related to the ovarian cycle), preexisting metabolic disturbances, nor alimen-tary habits can be made responsible for our observations. The correlation of insulin and C-peptide with plasma mirtazapine levels further supports the assumption of direct pharmacodynamic effects, i.e., a desen-sitization of insulin secretion. Nevertheless, the interpretation of altered insulin response to the test meal is limited and we can neither prove the hypothesis of direct increase of insulin by mirtazapine nor can we rule out that impaired insulin action in terms of insulin resistance plays a role. Indeed, increased insulin in the mOGTT and unchanged glucose would argue for an impaired insulin action. Considering that our subjects were nondiabetic without any metabolic risk factor, the HOMA index was unchanged, and the observation period was short, impaired insulin action is less likely. On the other hand, from the long-term perspective, the disinhibited insulin secretion via α2 action, as hypothesized here, may similarly result in impaired insu-lin action in long-term treatment with mirtazapine in patients. Potentially, these two suggested pathophys-iological mechanisms — i.e., disinhibited insulin secretion in the short term and impaired insulin action in the long term — may explain controversial findings of improved glucose tolerance in some studies (usually short term) (7, 8) and increased risk for diabetes in long-term clinical observations in others (4).
It must, however, be mentioned that besides the hypothesis of a direct effect of mirtazapine on met-abolic parameters, there is a possible alternative hypothesis supposing that mirtazapine’s effects are influ-enced by the strong effect of mirtazapine on sleep. It is well established that there is a tight association
Table 1. Basic metabolic measuresA
Baseline (before mirtazapine) After mirtazapine t P Effect sizeB
M SD M SDWeight, kg 72.76 4.30 72.18 4.27 4.87 0.001 –1.54 (–1.78 to –1.3)Body mass index (kg/m2) 22.43 1.40 22.25 1.40 5.09 0.001 –1.61 (–1.87 to –1.35)Waist/hip ratio 0.91 0.04 0.90 0.03 0.67 0.523 –0.21 (–0.29 to –0.13)Cholesterol (mg/dl) 147.80 27.55 136.20 22.10 3.69 0.005 –1.17 (–1.34 to –0.99)HDL (mg/dl) 47.55 6.16 43.60 5.74 4.25 0.002 –1.34 (–1.55 to –1.14)LDL (mg/dl) 86.10 22.99 77.60 18.50 3.74 0.005 –1.18 (–1.36 to –1.01)Triglycerides (mg/dl) 65.00 21.01 67.70 18.99 –0.75 0.470 0.24 (0.15 to 0.32)Triglycerides/HDL ratio 1.39 0.46 1.58 0.51 –2.45 0.037 0.78 (0.65 to 0.9)HDL/LDL ratio 1.82 0.46 1.80 0.45 0.44 0.673 –0.14 (–0.22 to –0.06)Basal cortisol (mg/dl)C 187.50 21.13 207.83 11.82 –1.07 0.332 0.1 (–0.06 to 0.26)HbA1c (%, [mmol/mol]) 5.04 [32] 0.18 5.12 [32] 0.23 –2.45 0.037 –0.77 (–0.9 to –0.65)HOMA-IR 0.22 0.03 0.24 0.09 –0.85 0.417 0.27 (0.18 to 0.35)Glucose, basal (mg/dl) 87.80 10.10 87.38 7.78 0.22 0.833 –0.07 (–0.15 to 0.01)Insulin, basal (μU/ml) 1.00 0.01 1.05 0.16 –1.00 0.343 0.32 (0.23 to 0.4)C-peptide, basal (nmol/l) 0.44 0.05 0.44 0.05 –1.39 0.199 0.44 (0.35 to 0.53)Resting energy expenditure (kcal/24 h)
1,558.00 188.08 1,615.00 180.69 –1.24 0.246 0.39 (0.3 to 0.48)
Respiratory quotient 0.83 0.10 0.87 0.08 –1.40 0.195 0.44 (0.35 to 0.54)AData (n = 10) are mean values (M) and standard deviations (SD); nominal significant P < 0.05 are in bold. BEffect sizes (change score) and 95% confidence interval were calculated according to Morris and DeShon (18). An effect was regarded as medium at absolute values of 0.5, and high at absolute values of 0.8. Cn = 7.

7insight.jci.org https://doi.org/10.1172/jci.insight.123786
C L I N I C A L M E D I C I N E

8insight.jci.org https://doi.org/10.1172/jci.insight.123786
C L I N I C A L M E D I C I N E
between sleep and insulin resistance and obesity (31). And indeed, we had observed in this study (17) that mirtazapine elicited significant periodic leg movements during sleep (PLMS) in 8 of the 12 participants (7 of the 10 included here). PLMS are associated with arousals during sleep and can significantly affect sleep continuity (32). Theoretically, these differences in sleep continuity affected by mirtazapine could be instru-mental in determining changes in insulin metabolism. We have not included sleep parameters in the present manuscript because (a) the effect of mirtazapine on PLMS was counterbalanced by the effect on slow wave sleep, with a significant increase already in the first nights (i.e., corresponding to an increased deep sleep); and (b) both effects — on PLMS and slow wave sleep — were mostly acute effects that decreased over the course of the study. With respect to sleep, disentangling the direct and indirect effects of mirtazapine on metabolism remains therefore a challenging, although promising, task.
Consistent with common complaints of patients (33), we observed an increase in hunger, and in par-ticular a craving for sweets. This effect was observable even after the first dose of mirtazapine (Figure 2). Nevertheless, weight gain — normally accompanied with increased hunger in patients even with short-term treatment (7, 20–22) — was missing when caloric intake was restricted in our subjects, and individuals even slightly lost weight. Repeated assessments (and adjustments) of caloric need, hunger, and postprandial satiety during the preparatory phase did not suggest nutrition shortness as an origin of the loss of weight. Thus, increased insulin and C-peptide in the mOGTT occurred despite a small decrease in weight, further indicating a direct drug-induced effect on energy metabolism. Although fasting and stimulated glucose as an initiator of food intake were not reduced, increased insulin could further have an influence on increased hunger and appetite for sweets under mirtazapine. In addition, beside its effect on 5-HT receptors, H1-anti-histaminergic action has been related to increased appetite under mirtazapine (34). The correlation analysis in our study further showed that those individuals that have more hunger or appetite for sweets exhibit a metabolic shift towards carbohydrate substrate preference in energy metabolism. In a combined microdial-ysis and indirect calorimetry study, Boschmann et al. (35) attributed an increase of carbohydrate oxidation rate to sensitization of adipose tissue to β-adrenergic stimulation by NET inhibition with the noradrenergic antidepressant reboxetine under costimulation with isoproterenol. In their study, energy expenditure did not differ between reboxetine and placebo treatment, while isoproterenol significantly increased energy expenditure with both reboxetine and placebo treatment. Extrapolated to our study, α2 stimulation by mir-tazapine might not sufficiently address energy expenditure (compared with isoproterenol) but may modu-late adrenergic signaling in target cells shifting towards carbohydrate oxidation. Thus, we hypothesize that a shift in energy metabolism induced by mirtazapine is the cause rather than the consequence of elevated appetite for sweet, and — extrapolated to unrestricted condition — of increased caloric intake.
Total cholesterol and LDL slightly decreased with mirtazapine in our study, which is in contrast to previous studies (21, 36) reporting hyperlipidemia under mirtazapine. We only found a rise in the so-called atherogenic index, i.e., the triglyceride/HDL quotient, which might be related to the desensitized insulin release mentioned above (37). In the present study, the observation period might have been too short to detect a further increase of triglycerides and the standardized diet might have prevented changes in lipids. However, even an only slight elevation of insulin could have significant effects on lipid metabolism in the long term (i.e., stimulation of triglyceride synthesis, inhibition of lipolysis) that have not been detected here.
Our study enrolled a relatively small sample of healthy volunteers that were investigated within a short observation period, raising the risk of spurious findings on the one hand and missed metabolic effects under long-term medication with mirtazapine on the other hand. Various comparisons did not pass the threshold of conservative Bonferroni correction for multiple comparisons (e.g., data presented in Table 1 and Supplemental Table 2). This is most likely due to the small sample size, as the change-score effect sizes indicated moderate to strong effects for those variables (such as body weight and lipid parameters) with a P below 0.05 but above the respective Bonferroni-corrected value. However, due to the highly standardized setting, our study has some important strengths. We applied a proof-of-concept design testing the hypothesis that metabolic parameters under mirtazapine would not change in very healthy men under standardized conditions including restricted food intake. Of note, even in the context of dietary restriction and weight loss, we observed metabolic changes
Figure 3. Indirect calorimetry. Individual values of the resting energy expenditure (REE) (A) and the respiratory quotient (RQ) (B) are depicted before and after mirtazapine. P values refer to a paired t statistic comparing the mean REE (1,558 kcal/24 h ± 188.08 vs. 1,615 kcal/24 h ± 180.69; t = –1.24; P = 0.246) and the mean RQ (0.83 ± 0.10 vs. 0.87 ± 0.08; t = –1.40; P = 0.195) before and after mirtazapine, respectively.

9insight.jci.org https://doi.org/10.1172/jci.insight.123786
C L I N I C A L M E D I C I N E
under mirtazapine that cannot be attributed to increased food intake, changes in nutrient composition, physical activity, or sleeping behavior. The correlation of plasma mirtazapine levels with metabolic effects in our study further supports the assumption of direct pharmacological effects of mirtazapine on metabolism. Our findings therefore imply direct and weight-gain-independent effects of mirtazapine on energy, and lipid and glucose metabolism, a finding which may have important implications for long-term treatment with mirtazapine.
Figure 4. Oral glucose tolerance testing. Mean plasma glucose (A), insulin (B), and C-peptide (C) are depicted before (–15 and 0 minutes) and after (15, 30, 60, 90, 120, 150, and 180 minutes) ingestion of a standardized test meal. P values refer to group comparison of areas under the concentration curve (AUC) before (black line) and after (gray line) mirtazapine treatment (AUC glucose: 15,366.9 mg/dl ± 2,390.4 SD vs. 16,515.6 mg/dl ± 1,726.7 SD; t = –1.593; P = 0.146; AUC insulin: 777.6 μU/ml ± 357.0 SD vs. 1,086.8 μU/ml ± 404.0 SD; t = –2.423; P = 0.038; AUC C-peptide: 168.8 nmol/l ± 36.7 vs. 196.9 nmol/l ± 34.6 SD; t = –2.769; P = 0.022 (paired t test; n = 10). Error bars are standard errors of the mean. A medium to high effect (change score; see ref. 18) was found for the change of the AUC for insulin and C-peptide (0.77 [0.65–0.89] and 0.88 [0.74–1.01], respectively). The effect sizes for the change of the glucose AUC was 0.5 (0.41–0.6). In a 2-way repeated-mea-sures ANOVA with a Greenhouse-Geisser correction, we found significant effects of mirtazapine for insulin and C-peptide (F[1, 9] = 6.69, P = 0.029 and F[1, 9] = 8.56, P = 0.017, respectively), but not for glucose (F[1, 9] = 2.27, P = 0.166). The time effect was significant in glucose, insulin, and C-peptide (F[7, 63] = 22.56, P = 1.14 × 10⁻⁸, P = 0.029, (F[7, 63] = 16.94, P = 2.95 × 10⁻⁵ and (F[7, 63] = 41.09, P = 1.86 × 10⁻⁸, respectively) while the mirtazapine × time interaction effects were not signifi-cant (F[7, 63] = 1.78, P = 0.188, (F[7, 63] = 2.41, P = 0.092 and (F[7, 63] = 2.01, P = 0.138, respectively). Bonferroni-corrected post hoc tests of mirtazapine × time effects were not significant for any laboratory value.

1 0insight.jci.org https://doi.org/10.1172/jci.insight.123786
C L I N I C A L M E D I C I N E
Figure 5. Correlation analyses. Correlations for the change in the respiratory quotient (ΔRQ) and the change in the resting energy expenditure (ΔREE) under mirtazapine with baseline hunger (A and E), baseline appetite for sweets (B and F), hunger under mirtazapine (C and G), and appetite for sweets under mirtazapine (D and H). Note the significant correlations (r, Spearman’s rank coefficient; n = 10) with ΔRQ (A–D), but not with ΔREE (E–H).
1 1insight.jci.org https://doi.org/10.1172/jci.insight.123786
C L I N I C A L M E D I C I N E
We observed weight-gain-independent metabolic effects of mirtazapine on glucose and lipid metabo-lism in exceptionally healthy men of European descent under highly standardized conditions. Following treatment with mirtazapine, insulin and C-peptide increased in response to a standardized test meal, likely to be mediated by mirtazapine’s α2-adrenergic–induced desensitization of insulin secretion or increased insulin resistance. Increased hunger and appetite for sweets correlated with a shift in energy substrate par-titioning, with increased carbohydrate oxidation rates despite stable nutrient composition and energy bal-ance. These changes in glucose and energy metabolism were independent of body weight and occurred even during short-term exposure to mirtazapine.
These findings provide insights into the specific effects of mirtazapine on energy metabolism, and add to our understanding of effects on clinically relevant metabolic changes by this widely prescribed antide-pressant medicine.
MethodsParticipants. Ten healthy men of European descent, aged 21 to 24 years, were recruited at the Max Planck Institute of Psychiatry, Munich, Germany between 2008 and 2010 (Figure 1). Individuals with previous or current medical disorders were excluded. Current health and past medical history were assessed by a physical examination, detailed medical history, routine blood draw (including lipid profile, complete blood count, liver, renal, and thyroid function) and urinalysis, electrocardiogram, electroencephalogram, and cranial magnetic resonance imaging. Participants were of normal weight with a BMI between 18.5 and 25 kg/m2. Further exclusion criteria included smoking within the last 6 months, any medication during the past 6 months (with the exception of incidental, infrequent use of pain medication [excluding opioids] until 2 weeks prior to start of the study), shift work or time-zone travel in the previous 12 months, current or former alcohol or drug abuse or dependence as well as positive family history (first-grade relatives) for metabolic disorders (including type 2 diabetes and familial hyperlipidemia). Individuals with current or history of Diagnostic and Statistical Manual of Mental Disorders (DSM) IV axis I disorder assessed with the modified version of the Munich-Composite International Diagnostic Interview (DIA-X/M-CIDI) (38) were excluded. The full and detailed list of exclusion criteria can be obtained at http://clinicaltrials.gov/ct2/show/NCT00878540. All subjects were good and regular sleepers without daytime sleepiness or extreme circadian orientation as assessed with interviews, questionnaires, and sleep diaries (for further information see ref. 17).
Protocol. After screening, all subjects entered a 3-week, ambulatory, preparatory phase with a stan-dardized diet provided entirely by the experimenters (Figure 1). The diet comprised 6 different menus (Diäko) and included cereal, yogurt, and fruit juice. Individual caloric need was initially determined using age, weight, and height, and subsequently adjusted within the first 2 weeks of the preparatory phase according to pre- and postprandial feeling of hunger and satiation. Adjustments were made by modulating carbohydrates (bananas, cereals) and fat (vegetable oil) according to the recommendations of the German Nutrition Society (www.dge.de). Besides water, any additional drinks were prohibited during the entire study, as was any additional food.
After the preparatory phase, participants spent 10 days in an experimental unit at the hospital, where they were under observation 24 hours/day. During this period, standardized diet, sleep-wake cycles, and physical activity (2 hours walking per day, no exercise training) were maintained and individual caloric intake was kept constant. After 3 days of adaptation to the hospital environment (baseline), 30 mg mirtazap-ine (Remergil SolTab, Organon) was given orally to the participants at 10 pm daily for 7 days. Time in bed was standardized from 23:00 to 07:00 hours during the entire study period (preparatory phase and experi-mental phase). Data for 2 of initially 12 participants were excluded from the analyses presented below due to protocol violation, i.e., increased caloric intake on the day before the first calorimetry assessment (Figure 1).
Assessments. Hunger, appetite for sweet, salty, or fatty food, and feeling of satiation were assessed every 2 hours (8:00, 10:00, 12:00, 14:00, 16:00, 20:00, and 22:00 hours) on 3 consecutive days (baseline) and on the subsequent 7 days while participants received mirtazapine using VAS ranging from one extreme at 0 mm (not hungry at all) to the other extreme at 100 mm (extremely hungry). Ratings were averaged across all time points within each day to generate an average rating per day.
mOGTT and laboratory analysis. mOGTT was performed after overnight fasting at baseline and after 5 days of mirtazapine using a standard test meal (39). The meal consisted of bread, butter, and marma-lade (267 kcal; 42 g carbohydrate, 9 g fat, and 3.9 g protein). The test meal had to be consumed within

1 2insight.jci.org https://doi.org/10.1172/jci.insight.123786
C L I N I C A L M E D I C I N E
10 minutes. Blood samples were drawn at –15, 0, 15, 30, 60, 90, 120, 150, and 180 minutes from an antecubital vein. Plasma insulin and C-peptide were determined in radioimmunoassays according to the manufacturers’ protocols (DPC and Cisbio International). Lipid analyses were performed using an enzymatic assay (Roche Hitachi 912). Plasma glucose was determined by the hexokinase method (Roche). The trapezoidal model was used to calculate AUC.
Indirect calorimetry. REE was measured by ventilated-hood indirect calorimetry (Deltatrac) at baseline (end of last preparatory week) and after 6 days of mirtazapine administration at the end of the study peri-od. REE measurements were performed between 8:00 and 11:30 am after overnight fasting (≥13 hours; a maximum of 250 ml water was allowed). After a 30-minute adaptation period resting, REE was measured over 30 minutes and data from the final 15 minutes were used for analyses. REE (kcal/24 hours) was calcu-lated from oxygen consumption and carbon dioxide production (ml/min) according to the Weir equation (40). The RQ, the ratio of carbon dioxide production and oxygen uptake (VCO2 [ml/min]/VO2 [ml/min]), is an indicator of energy substrate partitioning. Beyond being indicative of which macronutrients are being metabolized, the RQ is further influenced by insulin sensitivity, circulating insulin levels, and energy bal-ance. The RQ is 1.0 if predominantly carbohydrates are being metabolized, 0.8 for protein, and 0.7 for fat. With a mixed diet, the RQ typically ranges between 0.8 and 0.85 (40).
Statistics. The Kolmogorov-Smirnov statistic was applied to test for normal distribution. The paired t test was used for quantitative variables. A repeated-measures ANOVA using the Greenhouse-Geisser cor-rection was used for repeated measures with Bonferroni-corrected post hoc analyses. Effect sizes (change score) were calculated according to Morris and DeShon (18). An effect was regarded as medium at absolute values of 0.5, and high at absolute values of 0.8. Spearman’s rank coefficients were calculated for correla-tion analyses. P values < 0.05 for all tests were considered significant. All statistical procedures were per-formed using PASW statistics (version 18).
Study approval. The study was approved by the competent authorities and the Ethics Committee of the Medical Faculty at the Ludwig Maximilians University, Munich, Germany. Written informed consent was obtained from all subjects, and the study was carried out in accordance with the latest revision of the Declaration of Helsinki.
Author contributionsJMH, SK, and SF designed the study. FH, LS, and SL supervised the study and contributed to the discus-sion. TD, SF, SH, JMH, SK, and KL collected data. JMH analyzed data and wrote the manuscript. MU provided laboratory analysis. All authors reviewed, edited, and approved the final version of the manuscript.
AcknowledgmentsThe authors thank Gabi Kohl, Katharina Mahler, Birte Balzer, Luise Vogl, Christine Zitzmann, Johannes Erdmann, Sylvia Tholl, and Margit Hausmann and the sleep lab team of the Max Planck Institute of Psy-chiatry for their valuable help in conducting the study. Work for this study was performed at the Max Planck Institute of Psychiatry and the Else Kröner Institute of Nutrition Medicine, both in Munich, Germany. Special thanks go to Volker Schusdziarra at the Else Kröner Institute of Nutrition Medicine, University Clinic Rechts der Isar, Munich, Germany, who intensively discussed the study design with us and provided essential support in conducting the calorimetry and mOGTT. Unfortunately, he passed away in June 2014.
Address correspondence to: Johannes Hennings, kbo-Isar-Amper-Klinikum München-Ost, Vockestrasse 72, 85540 Haar/Munich, Germany. Phone: 49.89.4562.3902; Email: [email protected].
JMH’s present address is: kbo-Isar-Amper-Klinikum Munich-East, Munich, Germany.
KL’s present address is: Department of Prevention, Rehabilitation and Sports Medicine, Technical Univer-sity of Munich, Klinikum Rechts der Isar, Munich, Germany.
SF’s present address is: Neurocenter of Southern Switzerland, EOC, Lugano, Switzerland.
SK’s present address is: Centre for Addiction and Mental Health, Toronto, Canada.

1 3insight.jci.org https://doi.org/10.1172/jci.insight.123786
C L I N I C A L M E D I C I N E
1. Cipriani A, et al. Comparative efficacy and acceptability of 21 antidepressant drugs for the acute treatment of adults with major depressive disorder: a systematic review and network meta-analysis. Lancet. 2018;391(10128):1357–1366.
2. Pratt LA, Brody DJ, Gu Q. Antidepressant use among persons aged 12 and over: United States, 2011-2014. NCHS Data Brief. 2017;(283):1–8.
3. Lee SH, Paz-Filho G, Mastronardi C, Licinio J, Wong ML. Is increased antidepressant exposure a contributory factor to the obesity pandemic? Transl Psychiatry. 2016;6:e759.
4. Andersohn F, Schade R, Suissa S, Garbe E. Long-term use of antidepressants for depressive disorders and the risk of diabetes mellitus. Am J Psychiatry. 2009;166(5):591–598.
5. Uguz F, Sahingoz M, Gungor B, Aksoy F, Askin R. Weight gain and associated factors in patients using newer antidepressant drugs. Gen Hosp Psychiatry. 2015;37(1):46–48.
6. McIntyre RS, Soczynska JK, Konarski JZ, Kennedy SH. The effect of antidepressants on lipid homeostasis: a cardiac safety concern? Expert Opin Drug Saf. 2006;5(4):523–537.
7. Himmerich H, Fulda S, Schaaf L, Beitinger PA, Schuld A, Pollmächer T. Changes in weight and glucose tolerance during treat-ment with mirtazapine. Diabetes Care. 2006;29(1):170.
8. Weber-Hamann B, et al. Improved insulin sensitivity in 51 nondiabetic depressed inpatients remitting during antidepressive treatment with mirtazapine and venlafaxine. J Clin Psychopharmacol. 2008;28(5):581–584.
9. Luppino FS, et al. Overweight, obesity, and depression: a systematic review and meta-analysis of longitudinal studies. Arch Gen Psychiatry. 2010;67(3):220–229.
10. Knol MJ, Twisk JW, Beekman AT, Heine RJ, Snoek FJ, Pouwer F. Depression as a risk factor for the onset of type 2 diabetes mellitus. A meta-analysis. Diabetologia. 2006;49(5):837–845.
11. Marcus MD, Wing RR, Guare J, Blair EH, Jawad A. Lifetime prevalence of major depression and its effect on treatment out-come in obese type II diabetic patients. Diabetes Care. 1992;15(2):253–255.
12. Appelhans BM, et al. Depression severity, diet quality, and physical activity in women with obesity and depression. J Acad Nutr Diet. 2012;112(5):693–698.
13. Farmer ME, Locke BZ, Mościcki EK, Dannenberg AL, Larson DB, Radloff LS. Physical activity and depressive symptoms: the NHANES I Epidemiologic Follow-up Study. Am J Epidemiol. 1988;128(6):1340–1351.
14. Holsboer F. The corticosteroid receptor hypothesis of depression. Neuropsychopharmacology. 2000;23(5):477–501. 15. Fava M. Weight gain and antidepressants. J Clin Psychiatry. 2000;61 Suppl 11:37–41. 16. Hennings JM, Schaaf L, Fulda S. Glucose metabolism and antidepressant medication. Curr Pharm Des. 2012;18(36):5900–5919. 17. Fulda S, et al. Mirtazapine provokes periodic leg movements during sleep in young healthy men. Sleep. 2013;36(5):661–669. 18. Morris SB, DeShon RP. Combining effect size estimates in meta-analysis with repeated measures and independent-groups
designs. Psychol Methods. 2002;7(1):105–125. 19. Lam YY, Ravussin E. Indirect calorimetry: an indispensable tool to understand and predict obesity. Eur J Clin Nutr.
2017;71(3):318–322. 20. Kraus T, Haack M, Schuld A, Hinze-Selch D, Koethe D, Pollmächer T. Body weight, the tumor necrosis factor system, and
leptin production during treatment with mirtazapine or venlafaxine. Pharmacopsychiatry. 2002;35(6):220–225. 21. Nicholas LM, Ford AL, Esposito SM, Ekstrom RD, Golden RN. The effects of mirtazapine on plasma lipid profiles in healthy
subjects. J Clin Psychiatry. 2003;64(8):883–889. 22. Laimer M, et al. Effect of mirtazapine treatment on body composition and metabolism. J Clin Psychiatry. 2006;67(3):421–424. 23. Hennings JM, Ising M, Grautoff S, Himmerich H, Pollmächer T, Schaaf L. Glucose tolerance in depressed inpatients, under
treatment with mirtazapine and in healthy controls. Exp Clin Endocrinol Diabetes. 2010;118(2):98–100. 24. Hennings JM, et al. Clinical characteristics and treatment outcome in a representative sample of depressed inpatients - findings
from the Munich Antidepressant Response Signature (MARS) project. J Psychiatr Res. 2009;43(3):215–229. 25. Horstmann S, et al. Suppressive effect of mirtazapine on the HPA system in acutely depressed women seems to be transient and
not related to antidepressant action. Psychoneuroendocrinology. 2009;34(2):238–248. 26. Szegedi A, Schwertfeger N. Mirtazapine: a review of its clinical efficacy and tolerability. Expert Opin Pharmacother.
2005;6(4):631–641. 27. Fagerholm V, Haaparanta M, Scheinin M. α2-Adrenoceptor regulation of blood glucose homeostasis. Basic Clin Pharmacol Toxi-
col. 2011;108(6):365–370. 28. Kawazu S, et al. Initial phase II clinical studies on midaglizole (DG-5128). A new hypoglycemic agent. Diabetes.
1987;36(2):221–226. 29. Lustman PJ, Griffith LS, Freedland KE, Clouse RE. The course of major depression in diabetes. Gen Hosp Psychiatry.
1997;19(2):138–143. 30. Erenmemisoglu A, Ozdogan UK, Saraymen R, Tutus A. Effect of some antidepressants on glycaemia and insulin levels of nor-
moglycaemic and alloxan-induced hyperglycaemic mice. J Pharm Pharmacol. 1999;51(6):741–743. 31. Reutrakul S, Van Cauter E. Sleep influences on obesity, insulin resistance, and risk of type 2 diabetes. Metab Clin Exp.
2018;84:56–66. 32. Ferri R, Koo BB, Picchietti DL, Fulda S. Periodic leg movements during sleep: phenotype, neurophysiology, and clinical signifi-
cance. Sleep Med. 2017;31:29–38. 33. Watanabe N et al. Mirtazapine versus other antidepressive agents for depression. Cochrane Database Syst Rev.
2011;(12):CD006528. 34. Radhakishun FS, van den Bos J, van der Heijden BC, Roes KC, O’Hanlon JF. Mirtazapine effects on alertness and sleep in
patients as recorded by interactive telecommunication during treatment with different dosing regimens. J Clin Psychopharmacol. 2000;20(5):531–537.
35. Boschmann M, et al. Norepinephrine transporter function and autonomic control of metabolism. J Clin Endocrinol Metab. 2002;87(11):5130–5137.
36. Terevnikov V, et al. Relationships between pharmacotherapy-induced metabolic changes and improved psychopathology in schizophrenia: data from a mirtazapine and first-generation antipsychotics combination trial. Int J Neuropsychopharmacol.
1 4insight.jci.org https://doi.org/10.1172/jci.insight.123786
C L I N I C A L M E D I C I N E
2013;16(7):1661–1666. 37. von Bibra H, Saha S, Hapfelmeier A, Müller G, Schwarz PEH. Impact of the triglyceride/high-density lipoprotein cholesterol
ratio and the hypertriglyceremic-waist phenotype to predict the metabolic syndrome and insulin resistance. Horm Metab Res. 2017;49(7):542–549.
38. Wittchen HU, Lachner G, Wunderlich U, Pfister H. Test-retest reliability of the computerized DSM-IV version of the Munich-Composite International Diagnostic Interview (M-CIDI). Soc Psychiatry Psychiatr Epidemiol. 1998;33(11):568–578.
39. Erdmann J, Kallabis B, Oppel U, Sypchenko O, Wagenpfeil S, Schusdziarra V. Development of hyperinsulinemia and insulin resistance during the early stage of weight gain. Am J Physiol Endocrinol Metab. 2008;294(3):E568–E575.
40. Weir JB. New methods for calculating metabolic rate with special reference to protein metabolism. J Physiol (Lond). 1949;109(1–2):1–9.