performance measurement of supply chain management: a
TRANSCRIPT

IJAMT _______________________________________________________________ 1
Performance measurement of supply chain
management: A decision framework for evaluating and selecting supplier performance in a
supply chain
Sarode A.D. Lokmanya Tilak College of Engineering Koperkhairane, Navi Mumbai 400709 (India)
Khodke P.M. Government College of Engineering, Amravati 444604 (India)
Abstract Supply Chain Management (SCM) has gained significance as one of the 21st century manufacturing paradigms for improving organizational competitiveness. Supply chain ensures improved efficiency and effectiveness of not only product transfer, but also information sharing between the complex hierarchies of all the tiers. The literature on SCM that deals with strategies and technologies for effectively managing a supply chain is quite vast. In recent years, organizational performance measurement (PM) and metrics have received much attention from researchers and practitioners. Performance measurement and metrics have an important role to play in setting objectives, evaluating performance, and determining future courses of actions. Apart from the common criteria such as cost and quality, ten other performance measurements are defined, visibility, trust, innovativeness, delivery reliability, flexibility and responsiveness, resource utilization, cost, assets, technological capability, service and time to market, so total twelve criteria and fifty eight subcriteria are used to evaluate the performance in supply chain. So, for evaluating and selecting supplier a multi-attribute decision-making technique, an analytic hierarchy process (AHP), is used to make decision based on the priority of performance measures. This paper describes a decision framework for evaluating and selecting supplier performance in a supply chain. A case study from the automotive industry is used to demonstrate the AHP technique.
Keywords
Supply chain, Analytical hierarchy process (AHP), supplier selection, SCM
_______________________________________________________________________ The International Journal of Applied Management and Technology, Vol 1, Num 1
2 _______________________________________________________________ iJAMT
Introduction
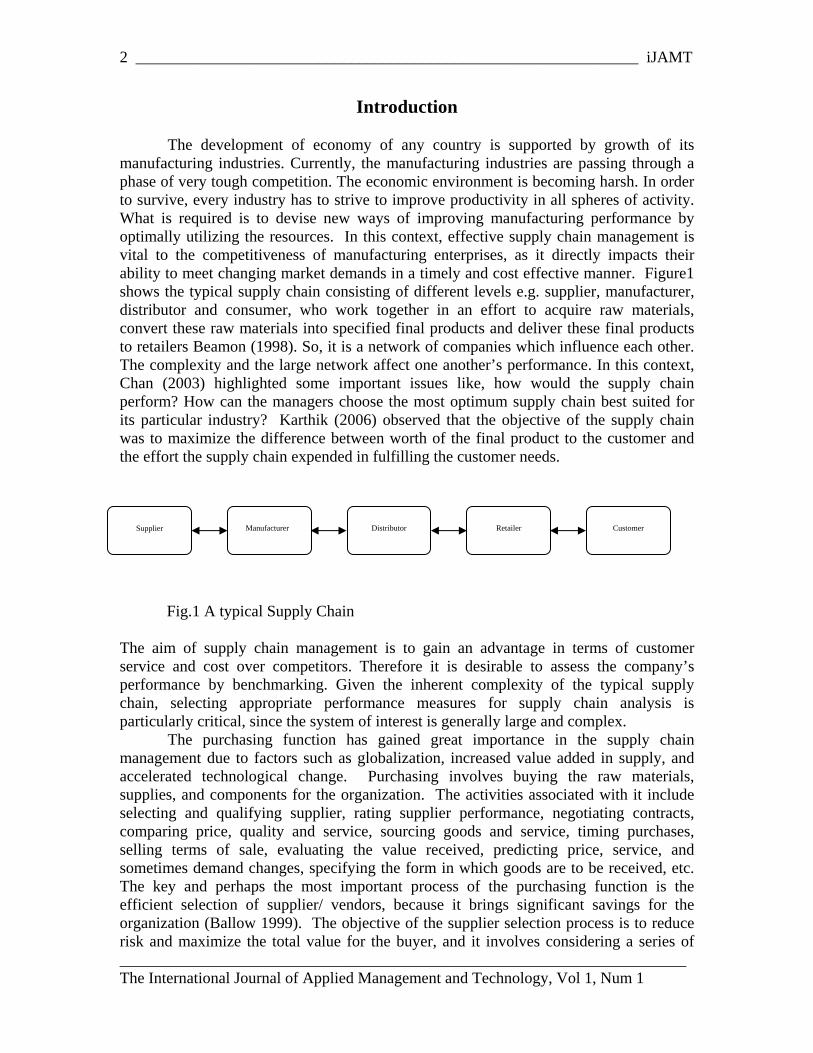
The development of economy of any country is supported by growth of its manufacturing industries. Currently, the manufacturing industries are passing through a phase of very tough competition. The economic environment is becoming harsh. In order to survive, every industry has to strive to improve productivity in all spheres of activity. What is required is to devise new ways of improving manufacturing performance by optimally utilizing the resources. In this context, effective supply chain management is vital to the competitiveness of manufacturing enterprises, as it directly impacts their ability to meet changing market demands in a timely and cost effective manner. Figure1 shows the typical supply chain consisting of different levels e.g. supplier, manufacturer, distributor and consumer, who work together in an effort to acquire raw materials, convert these raw materials into specified final products and deliver these final products to retailers Beamon (1998). So, it is a network of companies which influence each other. The complexity and the large network affect one another’s performance. In this context, Chan (2003) highlighted some important issues like, how would the supply chain perform? How can the managers choose the most optimum supply chain best suited for its particular industry? Karthik (2006) observed that the objective of the supply chain was to maximize the difference between worth of the final product to the customer and the effort the supply chain expended in fulfilling the customer needs.
Manufacturer Distributor Retailer Customer Supplier
Fig.1 A typical Supply Chain
The aim of supply chain management is to gain an advantage in terms of customer service and cost over competitors. Therefore it is desirable to assess the company’s performance by benchmarking. Given the inherent complexity of the typical supply chain, selecting appropriate performance measures for supply chain analysis is particularly critical, since the system of interest is generally large and complex.
_______________________________________________________________________
The purchasing function has gained great importance in the supply chain management due to factors such as globalization, increased value added in supply, and accelerated technological change. Purchasing involves buying the raw materials, supplies, and components for the organization. The activities associated with it include selecting and qualifying supplier, rating supplier performance, negotiating contracts, comparing price, quality and service, sourcing goods and service, timing purchases, selling terms of sale, evaluating the value received, predicting price, service, and sometimes demand changes, specifying the form in which goods are to be received, etc. The key and perhaps the most important process of the purchasing function is the efficient selection of supplier/ vendors, because it brings significant savings for the organization (Ballow 1999). The objective of the supplier selection process is to reduce risk and maximize the total value for the buyer, and it involves considering a series of
The International Journal of Applied Management and Technology, Vol 1, Num 1

IJAMT _______________________________________________________________ 3
strategic variables. Some authors have identified several criteria for supplier/vendor selection, such as the net price, quality, delivery, historical supplier performance, capacity, flexibility, service, communication systems and geographic location (Dickson 1966, Dempsey 1978, Weber et al 1991, Noorul Haq and Kannan 2006, Sarode et al 2008). These criteria are key issues in the supplier assessment process since it measures the performance of the suppliers. This paper present a total twelve criteria and fifty eight subcriteria for evaluating the supplier/vendor selection for the automobile manufacturing industries located at the western part of India using the analytical hierarchy process (AHP) even this paper describes a decision framework for pairwise comparison which helps to identify easily the importance of different performance measures. A case study from the automotive industry is used to demonstrate the AHP technique.
Literature Review
At present, there is a boom in supply chain management research. A large amount of publications appeared on this issue, particularly in the supplier/vendor selection problem. This problem has been extensively studied in the literature, the following paragraphs summarizes some of the contribution that are important to this paper.
In early 1986, Timmerman (1986) propose linear weighting models in which suppliers are rated on several criteria and in which these ratings are combined into a single score. These models include the categorical, the weighted point and the analytical hierarchical process (Nydick and Hill 1992). The major limitation of this approach is that it is difficult to effectively take qualitative evaluation criteria into consideration. Total cost approaches attempt to quantify all costs related to the selection of a vendor in monetary units. This approach includes cost ratio by Timmerman (1986) and total cost of ownership (Ellram 1995). Petroni and Braglia (2000), discuss the principle component analysis (PCA) method which is multiobjective approach to vendor selection that attempts to provide a useful decision support system for purchasing manager faced with multiple vendors and trade-offs such as price, delivery, reliability, and product quality. The major limitations of this approach are it requires the knowledge of advanced statistical technique. Wei et al. (1997), discuss in their paper about the neural network for the supplier selection. Comparing to conventional models for decision support system, neutral networks save a lot of time and money for system development. The supplier-selecting system includes two functions: one is the function measuring and evaluating performance of purchasing (quality, quantity, timing, price, and costs) and storing the evaluation in a database to provide data sources to neural network. The other is the function using the neural network method saves money and time of system development. The weakness of this method is that it demands software and requires a qualified personnel expert on this subject. Dickson (1966), reports 23 different criteria for vendor’s evaluation. Of these criteria, he states that cost, quality and delivery times are among the most important performance measures in the selection of vendor’s. Since that time, numerous papers
_______________________________________________________________________ The International Journal of Applied Management and Technology, Vol 1, Num 1

4 _______________________________________________________________ iJAMT
have cited his work approaching the vendor selection problem mainly from three perspective; conceptual, empirical, and mathematical (Talluri and Narasimhan 2003). Chan (2003) reported seven performance measures as the key elements of vendor selection-cost, resource utilization, quality, flexibility, visibility, trust and innovativeness. For each measure, he identified factor commonly used for vendor selection. Sarode et al. (2008) reported total twelve measures which includes qualitative and quantitative type-quality, visibility, flexibility and responsiveness, resource utilization, cost, asset, technological capability, service and time to market apart from these twelve measure total fifty eight items/ variables identified.
Noorul and Kannan (2006) identified seven performance measures- quality, delivery, production capability, service, engineering/ technical capabilities, business structure and price and their thirty two sub factors for the vendor selection. Weber et al. (1991), present a comprehensive review of the literature providing the most important criteria in the choice of suppliers. According to their investigation, they rank price as the most important factor in the selection process followed by lead time and quality factors. Patton (1996) sampled 1500 buyers to identify the effects of human judgment models on vendor selection. His findings suggest that it is not as much the difference in attributes between vendors that affect the outcome, but it is the type of human model used that lead to the variance in the selection of vendors. Stanley and Wisner (2001), collect data from 118 executives to study the outcome of previous research concepts regarding this problem. One of the important results of their study suggests that greater emphasis should be given to strategic activities in the process of supplier’s selection. Verma and Pullman (1998), propose the supplier selection process using the two methods namely Likert scale set of questions and a discrete choice analysis (DCA) experiment. According to them quality is an important factor to select the supplier. Lambert et al. (1998), in their book, describe a method for evaluating and comparing several suppliers. A rating factor is assigned to each supplier followed by a weight to determine the importance of each factor. To make the comparison feasible, a weighted composite measure is developed by multiplying the rating factor by the weight. However, how to assign the weights has not been clearly described in their approach. Weber et al. (1997), utilized data envelopment analysis (DEA) in the quest for vendor selection. Their approach is based on defining several attributes of vendor such as defects, price, and lateness in delivery. Based on this, a negotiation position is developed for those vendors that would like to be on the list of future supplier for the considered firm. Sheu (2004), proposed a methodology in his research that would stimulate research in the related fields of global logistics, and may help address issues regarding the uncertainty and complexity of global logistics operations. Chan and Chung (2004), develop a multi-criterion genetic optimization for solving distribution network problems in supply chain management. In this work they combine analytic hierarchy processes with genetic algorithms to capture the capability of multi-criterion decision-making which will reduce the computation time. Vaidya and Kumar (2004), presents a literature review of the applications of the analytic hierarchy process (AHP) and also provided the various application area where the AHP is used as a multiple criteria decision-making tool. Handeld et al. (2002), integrate environment issues in their supplier assessment decisions with the help of AHP.
_______________________________________________________________________ The International Journal of Applied Management and Technology, Vol 1, Num 1
IJAMT _______________________________________________________________ 5
Tam and Tummala (2001) discussed the vendor selection for the telecommunication systems and based on the proposed model the time taken to select the vendor has been reduced. Based on the above literature, most of the previous researchers have considered only four to five main factors (quality, service, price and delivery) and about 8 to 32 sub factors for selection of vendors. This paper describes twelve main factors and 58 sub factors for the supplier/vendor selection.
Development of Decision framework for evaluating and selecting supplier Performance in supply chain:
The company chosen for this work plan to build a supply chain for its automobile
production. Raw materials or components can be outsourced to vendors. The question arise which vendor are to be selected. The attributes and sub-attributes have to be most prevalent and important in the vendor selection process. Choosing the possible criteria for the vendor selection involves a decision making team which includes experts from the industry side (purchasing manager, purchasing director, sales manager, product manager, quality manager and production manager). The attributes and sub attributes involved in the vendor selection have been chosen by conducting a survey. A questionnaire consisting of these factors was designed for the survey. The respondents for the survey are selected randomly from different functional areas that are directly involved with the materials supplied by the vendors. Based on the survey conducted the major attributes and sub-attributes involved in the vendor selection are given in Table 1. Development of analytical process for qualitative analysis
Analytical hierarchy process (AHP) was developed in 1972 as a practical approach in solving relatively complex problems (Saaty 1980). It is used for multicriteria problems in a number of application domains (Roger 1987, Saaty 2000 and Kodali and Chandra 2001, Kodali and Routroy 2006). The general approach of the AHP is to decompose the problem and make pair-wise comparison of all elements on a given level with related elements in the level just above it belong. A highly user friendly computer model is developed which assists the user in evaluating his/her choices. The schematic of AHP for selection of supplier in supply chain is shown in Fig 1.
_______________________________________________________________________ The International Journal of Applied Management and Technology, Vol 1, Num 1

6 _______________________________________________________________ iJAMT
_______________________________________________________________________
Selection of best Supplier Level 1
Attributes Level 2
QULT VSBL TRST INVN DLRL FLRS RSUZ COST ASST TECB SERV TTMK
TLMC PCPL DFCT DBCT MFGC INVC WHEC ICSS ITGC OHDC SLTC
Supplier 1 Supplier 2 Supplier 3
Sub-attributes Level 3
Level 4
Fig.1. Schematic of AHP for selection of best supplier
The International Journal of Applied Management and Technology, Vol 1, Num 1
IJAMT _______________________________________________________________ 7
Description of the model
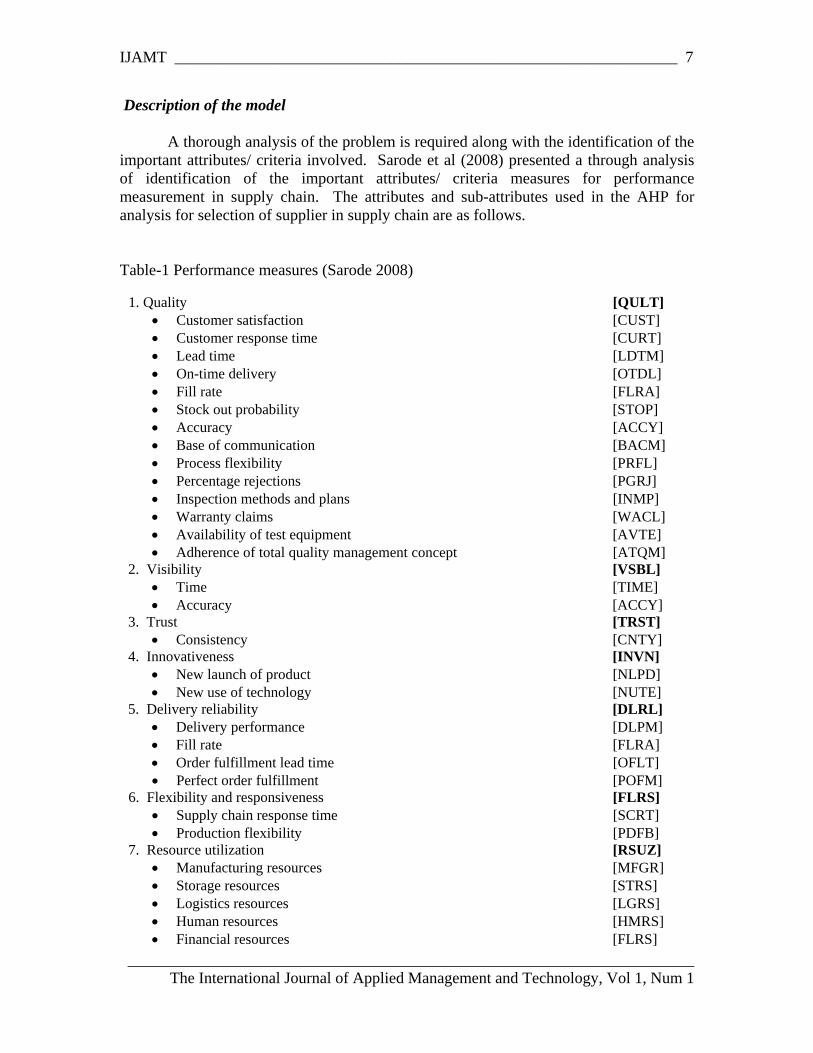
A thorough analysis of the problem is required along with the identification of the important attributes/ criteria involved. Sarode et al (2008) presented a through analysis of identification of the important attributes/ criteria measures for performance measurement in supply chain. The attributes and sub-attributes used in the AHP for analysis for selection of supplier in supply chain are as follows. Table-1 Performance measures (Sarode 2008)
1. Quality [QULT] • Customer satisfaction [CUST] • Customer response time [CURT] • Lead time [LDTM] • On-time delivery [OTDL] • Fill rate [FLRA] • Stock out probability [STOP] • Accuracy [ACCY] • Base of communication [BACM] • Process flexibility [PRFL] • Percentage rejections [PGRJ] • Inspection methods and plans [INMP] • Warranty claims [WACL] • Availability of test equipment [AVTE] • Adherence of total quality management concept [ATQM]
2. Visibility [VSBL] • Time [TIME] • Accuracy [ACCY]
3. Trust [TRST] • Consistency [CNTY]
4. Innovativeness [INVN] • New launch of product [NLPD] • New use of technology [NUTE]
5. Delivery reliability [DLRL] • Delivery performance [DLPM] • Fill rate [FLRA] • Order fulfillment lead time [OFLT] • Perfect order fulfillment [POFM]
6. Flexibility and responsiveness [FLRS] • Supply chain response time [SCRT] • Production flexibility [PDFB]
7. Resource utilization [RSUZ] • Manufacturing resources [MFGR] • Storage resources [STRS] • Logistics resources [LGRS] • Human resources [HMRS] • Financial resources [FLRS]
_______________________________________________________________________ The International Journal of Applied Management and Technology, Vol 1, Num 1
8 _______________________________________________________________ iJAMT
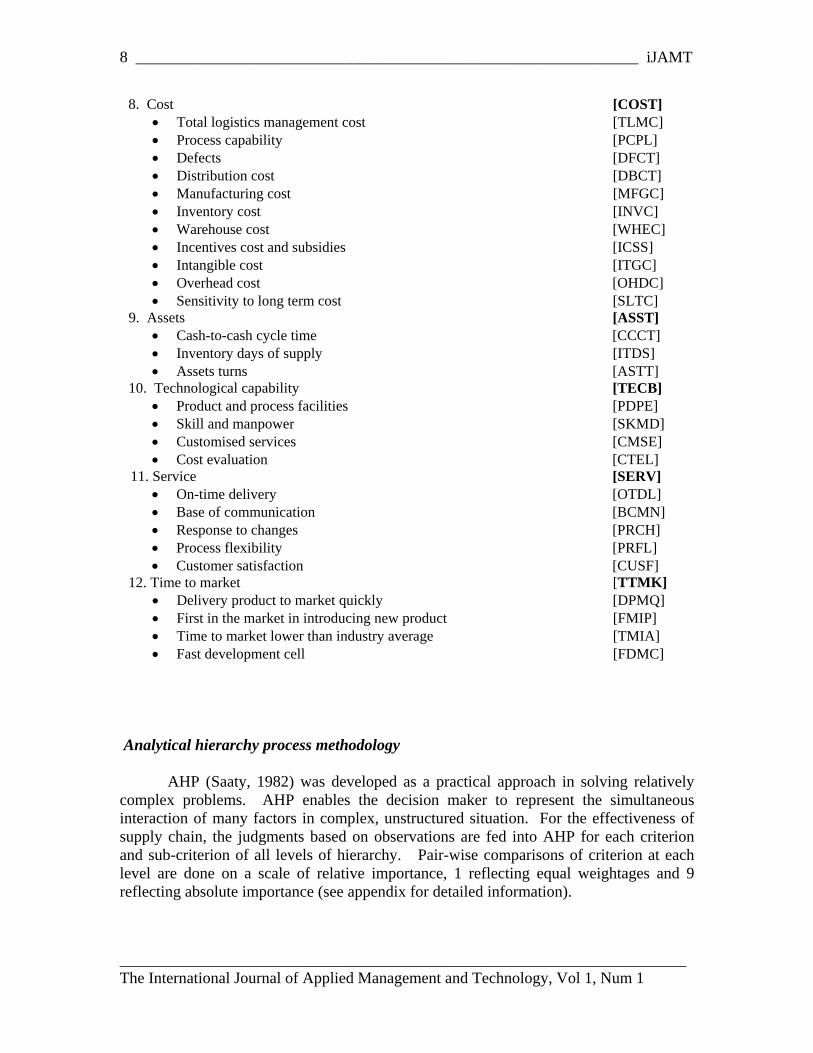
8. Cost [COST] • Total logistics management cost [TLMC] • Process capability [PCPL] • Defects [DFCT] • Distribution cost [DBCT] • Manufacturing cost [MFGC] • Inventory cost [INVC] • Warehouse cost [WHEC] • Incentives cost and subsidies [ICSS] • Intangible cost [ITGC] • Overhead cost [OHDC] • Sensitivity to long term cost [SLTC]
9. Assets [ASST] • Cash-to-cash cycle time [CCCT] • Inventory days of supply [ITDS] • Assets turns [ASTT]
10. Technological capability [TECB] • Product and process facilities [PDPE] • Skill and manpower [SKMD] • Customised services [CMSE] • Cost evaluation [CTEL]
11. Service [SERV] • On-time delivery [OTDL] • Base of communication [BCMN] • Response to changes [PRCH] • Process flexibility [PRFL] • Customer satisfaction [CUSF]
12. Time to market [TTMK] • Delivery product to market quickly [DPMQ] • First in the market in introducing new product [FMIP] • Time to market lower than industry average [TMIA] • Fast development cell [FDMC]
Analytical hierarchy process methodology
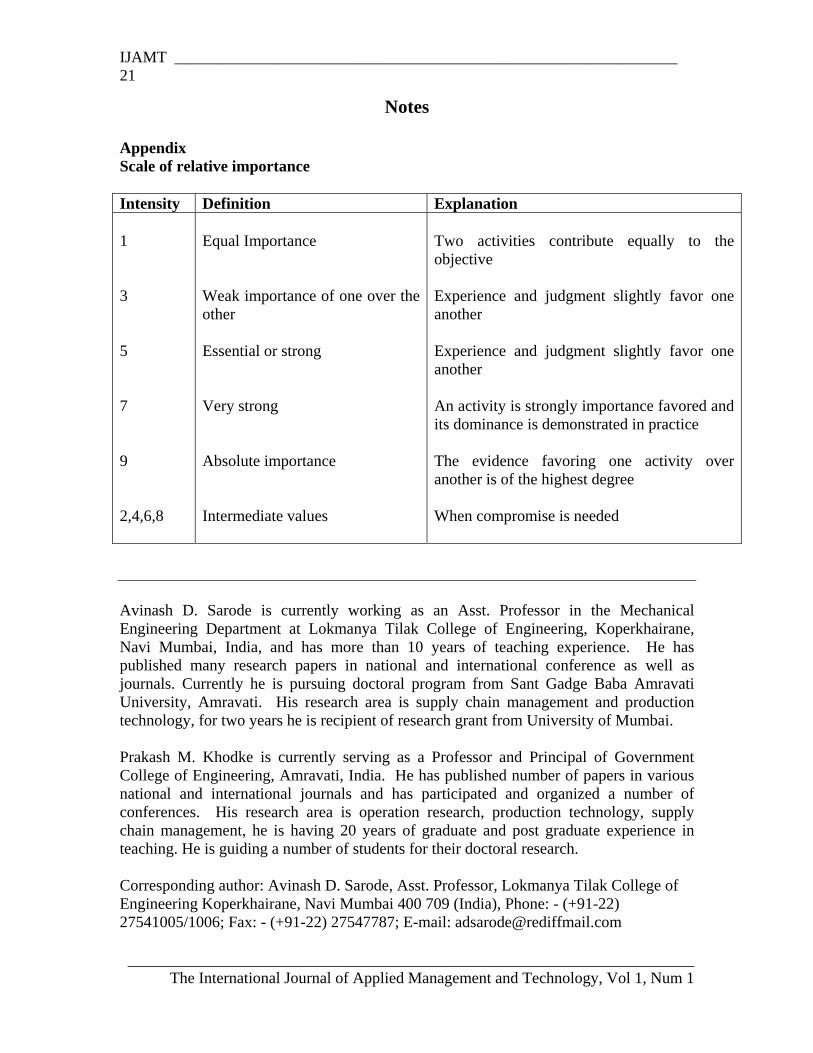
AHP (Saaty, 1982) was developed as a practical approach in solving relatively complex problems. AHP enables the decision maker to represent the simultaneous interaction of many factors in complex, unstructured situation. For the effectiveness of supply chain, the judgments based on observations are fed into AHP for each criterion and sub-criterion of all levels of hierarchy. Pair-wise comparisons of criterion at each level are done on a scale of relative importance, 1 reflecting equal weightages and 9 reflecting absolute importance (see appendix for detailed information).
_______________________________________________________________________ The International Journal of Applied Management and Technology, Vol 1, Num 1

IJAMT _______________________________________________________________ 9
The steps to be followed in the AHP are given below (Roger, 1987):
1) Define the problem and determine the objective. 2) Structure the hierarchy from the top through the intermediate levels to the
lowest level. Refer to figure (Schematic of AHP). 3) Construct a set of pair-wise comparison matrices for each of the lower levels.
An element in the higher level is said to be a governing element for those in the lower level, since it contributes to it or affects it. The elements in the lower level are then compared to each other based on their effect on the governing element above. This yields a square matrix of judgments. The pair-wise comparisons are done in terms of which an element dominates another. These judgments are then expressed as integers. If element A dominates over element B, then the whole number integer is entered in row A, column B and reciprocal is entered in row B, column A. If the elements being compared are equal, a one is assigned to both positions. Table 2 shows the pair-wise comparison matrix for level 2 criteria.
Table 2. Criteria pair-wise comparison matrix (level 2) QULT VSBL TRST INVN DLRL FLRS RSUZ COST ASST TECB SERV TTMK QULT 1 1/2 1 1/5 3 3 3 1 1 2 2 2
VSBL 2 1 1 2 3 2 4 1 2 1 2 2
TRST 1 1 1 1/2 1 3 2 2 1 1 1 2
INVN 5 1/2 2 1 5 3 6 3 2 2 3 3
DLRL 1/3 1/3 1 0.2 1 1 1 2 1/5 1/2 1/3 1
FLRS 1/3 1/2 1/3 1/3 1 1 2 1 1/3 1/2 1/4 3
RSUZ 1/3 1/4 1/2 1/6 1 1/2 1 1/2 1/5 1/9 1/2 1
COST 1 1 1/2 1/3 1/2 1 2 1 1/2 1/3 1/2 1
ASST 1 1/2 1 1/2 3 3 3 2 1 1/2 1 2
TECB 1/2 1 1 1/2 2 2 9 3 2 1 2 1
SERV 1/2 1/2 1 1/3 3 4 2 2 1 1/2 1 2
TTMK 1/2 1/2 1/2 1/3 1 1/3 1 1 1/2 1 1/2 1
4) There are n (n-1)/2 judgments required to develop the set of matrices in step 3
(reciprocals are automatically assigned in each pair-wise comparisons). 5) Having done all the pair-wise comparisons and entered the data, the consistency
is determined using the eigenvalue. To do so, normalize the column of numbers by dividing each entry by the sum of all entries. The sum each row of the normalized values and take the average. This provides Principal Vector [PV]. Table 3 illustrates the normalized comparison matrix.
_______________________________________________________________________
The International Journal of Applied Management and Technology, Vol 1, Num 1
10 _______________________________________________________________ iJAMT
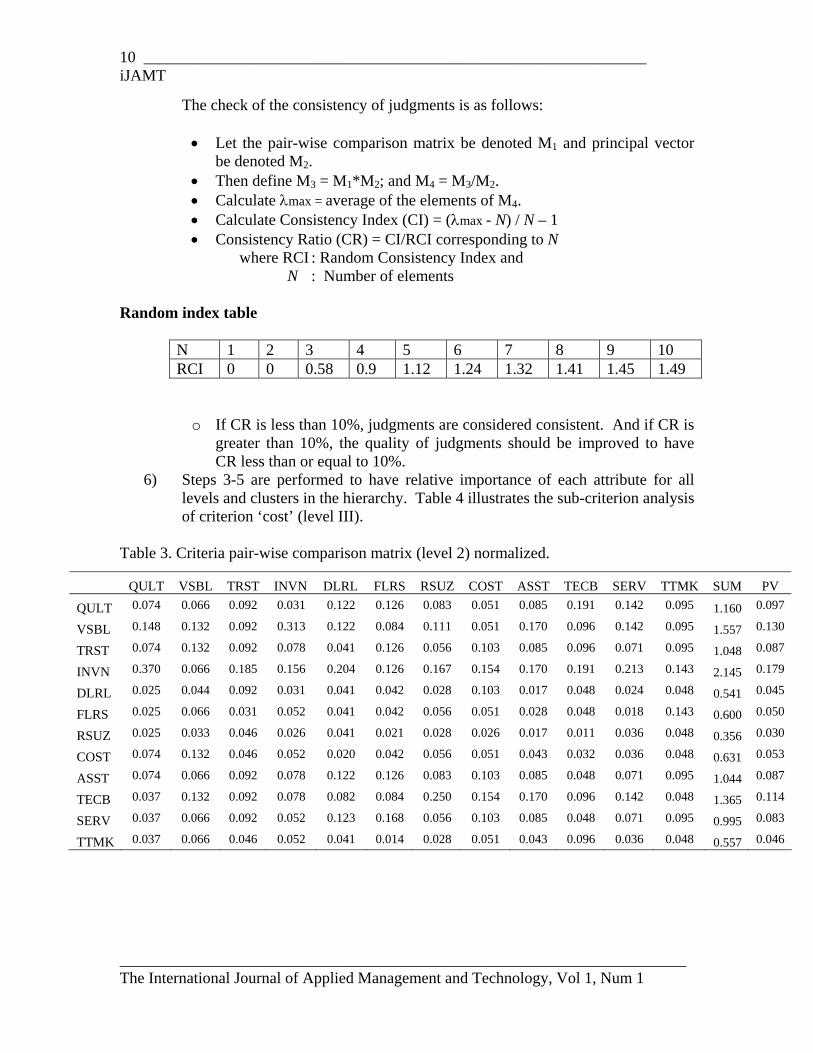
The check of the consistency of judgments is as follows: • Let the pair-wise comparison matrix be denoted M1 and principal vector
be denoted M2. • Then define M3 = M1*M2; and M4 = M3/M2. • Calculate λmax = average of the elements of M4. • Calculate Consistency Index (CI) = (λmax - N) / N – 1 • Consistency Ratio (CR) = CI/RCI corresponding to N
where RCI : Random Consistency Index and N : Number of elements
Random index table
N 1 2 3 4 5 6 7 8 9 10 RCI 0 0 0.58 0.9 1.12 1.24 1.32 1.41 1.45 1.49
o If CR is less than 10%, judgments are considered consistent. And if CR is
greater than 10%, the quality of judgments should be improved to have CR less than or equal to 10%.
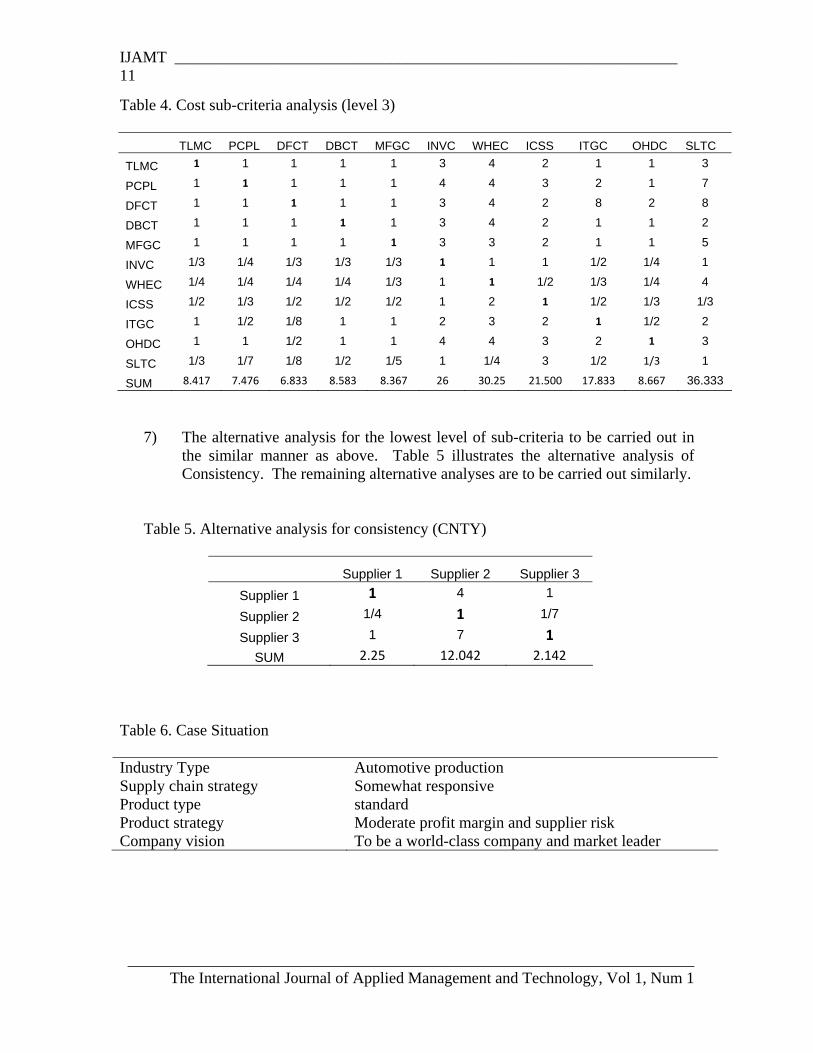
6) Steps 3-5 are performed to have relative importance of each attribute for all levels and clusters in the hierarchy. Table 4 illustrates the sub-criterion analysis of criterion ‘cost’ (level III).
Table 3. Criteria pair-wise comparison matrix (level 2) normalized.
QULT VSBL TRST INVN DLRL FLRS RSUZ COST ASST TECB SERV TTMK SUM PV
QULT 0.074 0.066 0.092 0.031 0.122 0.126 0.083 0.051 0.085 0.191 0.142 0.095 1.160 0.097
VSBL 0.148 0.132 0.092 0.313 0.122 0.084 0.111 0.051 0.170 0.096 0.142 0.095 1.557 0.130
TRST 0.074 0.132 0.092 0.078 0.041 0.126 0.056 0.103 0.085 0.096 0.071 0.095 1.048 0.087
INVN 0.370 0.066 0.185 0.156 0.204 0.126 0.167 0.154 0.170 0.191 0.213 0.143 2.145 0.179
DLRL 0.025 0.044 0.092 0.031 0.041 0.042 0.028 0.103 0.017 0.048 0.024 0.048 0.541 0.045
FLRS 0.025 0.066 0.031 0.052 0.041 0.042 0.056 0.051 0.028 0.048 0.018 0.143 0.600 0.050
RSUZ 0.025 0.033 0.046 0.026 0.041 0.021 0.028 0.026 0.017 0.011 0.036 0.048 0.356 0.030
COST 0.074 0.132 0.046 0.052 0.020 0.042 0.056 0.051 0.043 0.032 0.036 0.048 0.631 0.053
ASST 0.074 0.066 0.092 0.078 0.122 0.126 0.083 0.103 0.085 0.048 0.071 0.095 1.044 0.087
TECB 0.037 0.132 0.092 0.078 0.082 0.084 0.250 0.154 0.170 0.096 0.142 0.048 1.365 0.114
SERV 0.037 0.066 0.092 0.052 0.123 0.168 0.056 0.103 0.085 0.048 0.071 0.095 0.995 0.083
TTMK 0.037 0.066 0.046 0.052 0.041 0.014 0.028 0.051 0.043 0.096 0.036 0.048 0.557 0.046
_______________________________________________________________________ The International Journal of Applied Management and Technology, Vol 1, Num 1
IJAMT _______________________________________________________________ 11
Table 4. Cost sub-criteria analysis (level 3) TLMC PCPL DFCT DBCT MFGC INVC WHEC ICSS ITGC OHDC SLTC
TLMC 1 1 1 1 1 3 4 2 1 1 3
PCPL 1 1 1 1 1 4 4 3 2 1 7
DFCT 1 1 1 1 1 3 4 2 8 2 8
DBCT 1 1 1 1 1 3 4 2 1 1 2
MFGC 1 1 1 1 1 3 3 2 1 1 5
INVC 1/3 1/4 1/3 1/3 1/3 1 1 1 1/2 1/4 1
WHEC 1/4 1/4 1/4 1/4 1/3 1 1 1/2 1/3 1/4 4
ICSS 1/2 1/3 1/2 1/2 1/2 1 2 1 1/2 1/3 1/3
ITGC 1 1/2 1/8 1 1 2 3 2 1 1/2 2
OHDC 1 1 1/2 1 1 4 4 3 2 1 3
SLTC 1/3 1/7 1/8 1/2 1/5 1 1/4 3 1/2 1/3 1
SUM 8.417 7.476 6.833 8.583 8.367 26 30.25 21.500 17.833 8.667 36.333
7) The alternative analysis for the lowest level of sub-criteria to be carried out in the similar manner as above. Table 5 illustrates the alternative analysis of Consistency. The remaining alternative analyses are to be carried out similarly.
Table 5. Alternative analysis for consistency (CNTY)
Supplier 1 Supplier 2 Supplier 3 Supplier 1 1 4 1
Supplier 2 1/4 1 1/7
Supplier 3 1 7 1 SUM 2.25 12.042 2.142
Table 6. Case Situation Industry Type Automotive production Supply chain strategy Somewhat responsive Product type standard Product strategy Moderate profit margin and supplier risk Company vision To be a world-class company and market leader
_______________________________________________________________________ The International Journal of Applied Management and Technology, Vol 1, Num 1

12 _______________________________________________________________ iJAMT
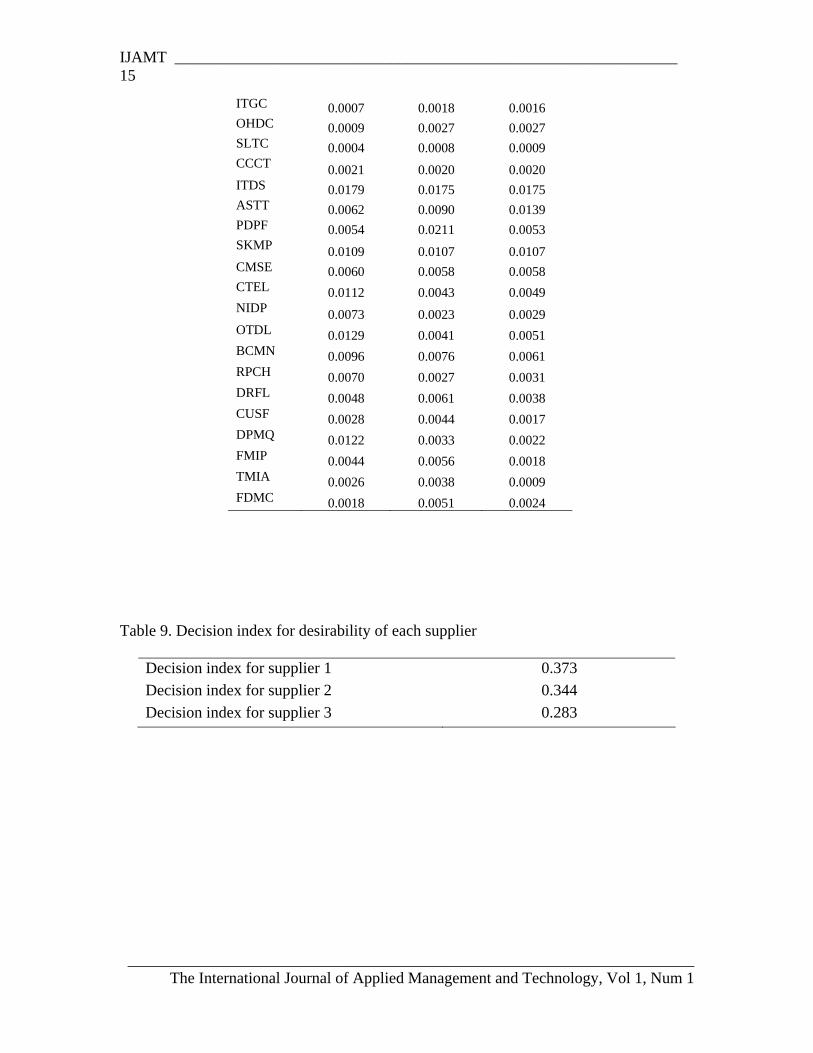
8) The desirability index for each alternative is calculated by multiplying each value in ‘weight of sub-criteria’ column by the respective value of ‘criteria weight’ column, then multiplying the obtained value, by the value for each respective alternative and summing the results.
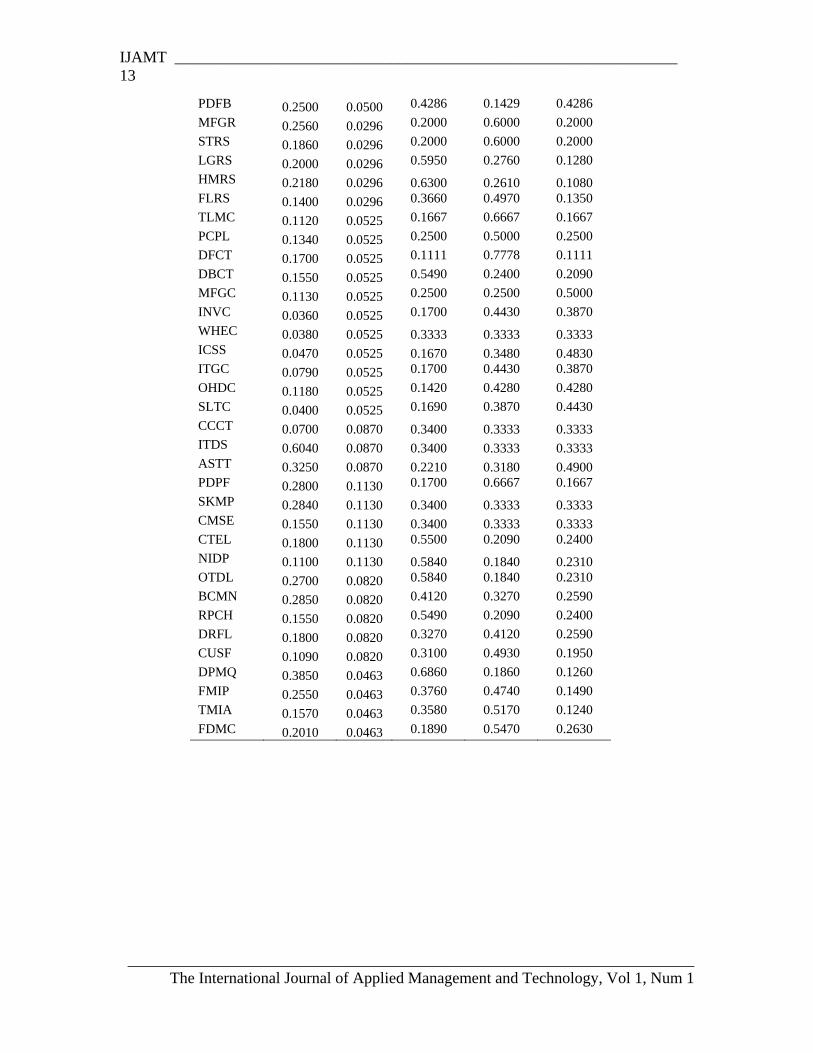
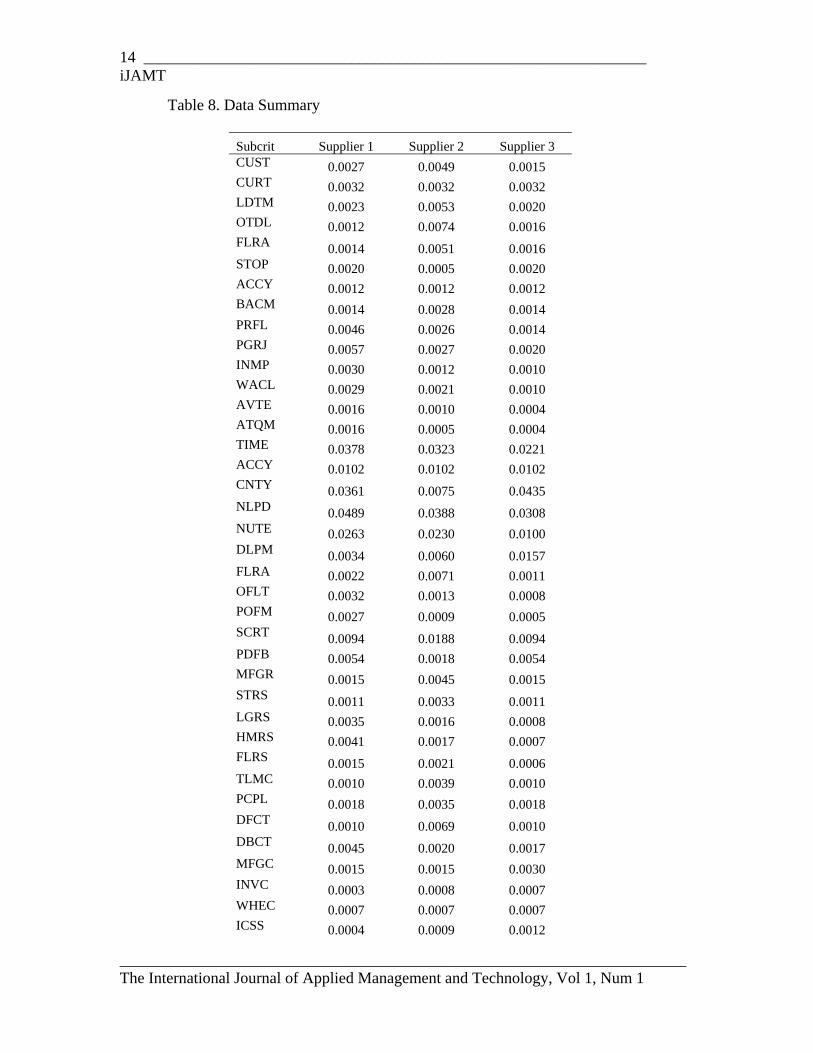
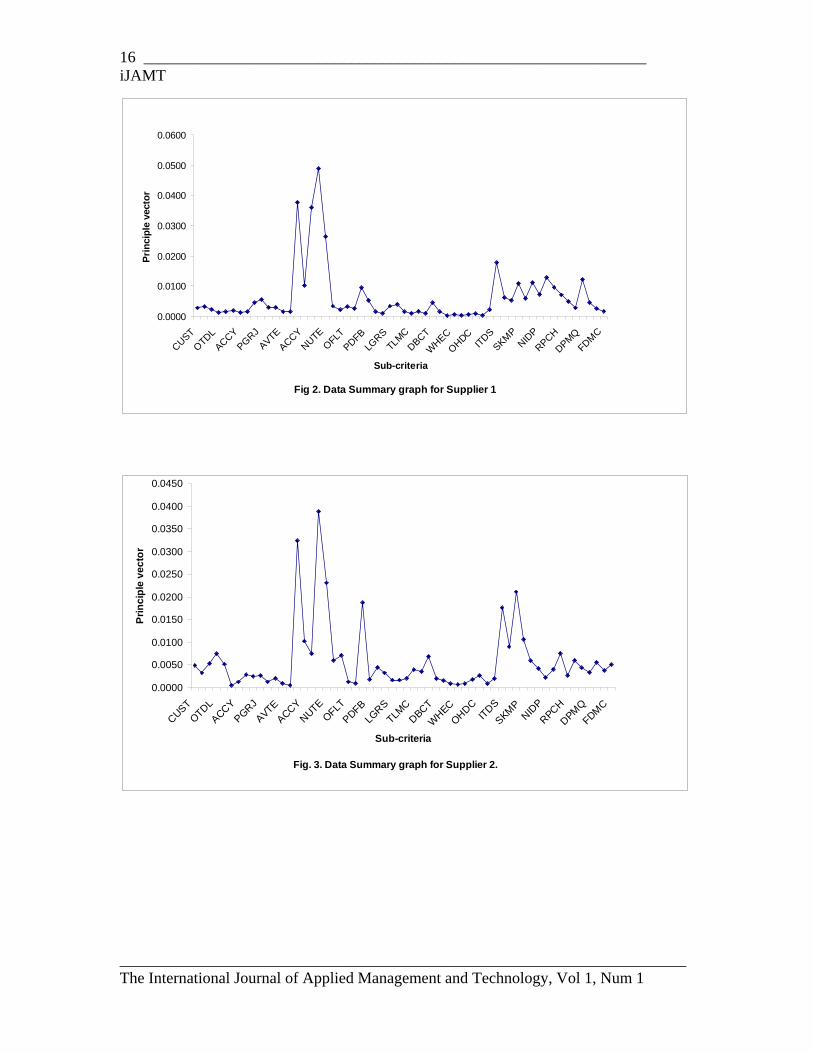
Highly user-friendly software, the multiattribute decision model, i.e. AHP is developed in VC++ to aid the user for pair-wise comparison of the attributes as well as for the alternatives and for analysing the user inputs. The attributes are compared with other in a pair-wise comparison with respect to the case situation discussed in Table 6. From the analysis, it is clear that Supplier 1 is the best under the circumstances of the developed case situation (see Tables 7-9). The reliability of the judgments supplied by the user can be estimated from graphs (Figs.2-4) that are generated for each alternative and its corresponding deciding criteria. Fig 5 would depict the composite overall scores for the alternative suppliers. Table 7. Weightages of attributes for suppliers
Subcrit L3-wt L2-wt Supplier 1 Supplier 2 Supplier 3 CUST 0.0940 0.0967 0.2970 0.5396 0.1634 CURT 0.0990 0.0967 0.3333 0.3333 0.3333 LDTM 0.1000 0.0967 0.2402 0.5499 0.2098 OTDL 0.1060 0.0967 0.1192 0.7238 0.1570 FLRA 0.0840 0.0967 0.1744 0.6337 0.1919 STOP 0.0470 0.0967 0.4444 0.1111 0.4444 ACCY 0.0380 0.0967 0.3333 0.3333 0.3333 BACM 0.0580 0.0967 0.2500 0.5000 0.2500 PRFL 0.0880 0.0967 0.5400 0.3000 0.1600 PGRJ 0.1070 0.0967 0.5470 0.2630 0.1890 INMP 0.0540 0.0967 0.5840 0.2310 0.1840 WACL 0.0630 0.0967 0.4830 0.3480 0.1670 AVTE 0.0307 0.0967 0.5270 0.3320 0.1390 ATQM 0.0260 0.0967 0.6300 0.2180 0.1510 TIME 0.7500 0.1230 0.4099 0.3504 0.2397 ACCY 0.2500 0.1230 0.3333 0.3333 0.3333 CNTY 1.0000 0.0870 0.4145 0.0860 0.4995 NLPD 0.6660 0.1780 0.4126 0.3275 0.2599 NUTE 0.3340 0.1780 0.4430 0.3870 0.1690 DLPM 0.5579 0.0450 0.1365 0.2385 0.6250 FLRA 0.2316 0.0450 0.2158 0.6817 0.1025 OFLT 0.1187 0.0450 0.5930 0.2490 0.1570 POFM 0.0915 0.0450 0.6480 0.2270 0.1220 SCRT 0.7500 0.0500 0.2500 0.5000 0.2500
_______________________________________________________________________ The International Journal of Applied Management and Technology, Vol 1, Num 1
IJAMT _______________________________________________________________ 13
PDFB 0.2500 0.0500 0.4286 0.1429 0.4286 MFGR 0.2560 0.0296 0.2000 0.6000 0.2000 STRS 0.1860 0.0296 0.2000 0.6000 0.2000 LGRS 0.2000 0.0296 0.5950 0.2760 0.1280 HMRS 0.2180 0.0296 0.6300 0.2610 0.1080 FLRS 0.1400 0.0296 0.3660 0.4970 0.1350 TLMC 0.1120 0.0525 0.1667 0.6667 0.1667 PCPL 0.1340 0.0525 0.2500 0.5000 0.2500 DFCT 0.1700 0.0525 0.1111 0.7778 0.1111 DBCT 0.1550 0.0525 0.5490 0.2400 0.2090 MFGC 0.1130 0.0525 0.2500 0.2500 0.5000 INVC 0.0360 0.0525 0.1700 0.4430 0.3870 WHEC 0.0380 0.0525 0.3333 0.3333 0.3333 ICSS 0.0470 0.0525 0.1670 0.3480 0.4830 ITGC 0.0790 0.0525 0.1700 0.4430 0.3870 OHDC 0.1180 0.0525 0.1420 0.4280 0.4280 SLTC 0.0400 0.0525 0.1690 0.3870 0.4430 CCCT 0.0700 0.0870 0.3400 0.3333 0.3333 ITDS 0.6040 0.0870 0.3400 0.3333 0.3333 ASTT 0.3250 0.0870 0.2210 0.3180 0.4900 PDPF 0.2800 0.1130 0.1700 0.6667 0.1667 SKMP 0.2840 0.1130 0.3400 0.3333 0.3333 CMSE 0.1550 0.1130 0.3400 0.3333 0.3333 CTEL 0.1800 0.1130 0.5500 0.2090 0.2400 NIDP 0.1100 0.1130 0.5840 0.1840 0.2310 OTDL 0.2700 0.0820 0.5840 0.1840 0.2310 BCMN 0.2850 0.0820 0.4120 0.3270 0.2590 RPCH 0.1550 0.0820 0.5490 0.2090 0.2400 DRFL 0.1800 0.0820 0.3270 0.4120 0.2590 CUSF 0.1090 0.0820 0.3100 0.4930 0.1950 DPMQ 0.3850 0.0463 0.6860 0.1860 0.1260 FMIP 0.2550 0.0463 0.3760 0.4740 0.1490 TMIA 0.1570 0.0463 0.3580 0.5170 0.1240 FDMC 0.2010 0.0463 0.1890 0.5470 0.2630
_______________________________________________________________________ The International Journal of Applied Management and Technology, Vol 1, Num 1
14 _______________________________________________________________ iJAMT
Table 8. Data Summary
Subcrit Supplier 1 Supplier 2 Supplier 3 CUST 0.0027 0.0049 0.0015 CURT 0.0032 0.0032 0.0032 LDTM 0.0023 0.0053 0.0020 OTDL 0.0012 0.0074 0.0016 FLRA 0.0014 0.0051 0.0016 STOP 0.0020 0.0005 0.0020 ACCY 0.0012 0.0012 0.0012 BACM 0.0014 0.0028 0.0014 PRFL 0.0046 0.0026 0.0014 PGRJ 0.0057 0.0027 0.0020 INMP 0.0030 0.0012 0.0010 WACL 0.0029 0.0021 0.0010 AVTE 0.0016 0.0010 0.0004 ATQM 0.0016 0.0005 0.0004 TIME 0.0378 0.0323 0.0221 ACCY 0.0102 0.0102 0.0102 CNTY 0.0361 0.0075 0.0435 NLPD 0.0489 0.0388 0.0308 NUTE 0.0263 0.0230 0.0100 DLPM 0.0034 0.0060 0.0157 FLRA 0.0022 0.0071 0.0011 OFLT 0.0032 0.0013 0.0008 POFM 0.0027 0.0009 0.0005 SCRT 0.0094 0.0188 0.0094 PDFB 0.0054 0.0018 0.0054 MFGR 0.0015 0.0045 0.0015 STRS 0.0011 0.0033 0.0011 LGRS 0.0035 0.0016 0.0008 HMRS 0.0041 0.0017 0.0007 FLRS 0.0015 0.0021 0.0006 TLMC 0.0010 0.0039 0.0010 PCPL 0.0018 0.0035 0.0018 DFCT 0.0010 0.0069 0.0010 DBCT 0.0045 0.0020 0.0017 MFGC 0.0015 0.0015 0.0030 INVC 0.0003 0.0008 0.0007 WHEC 0.0007 0.0007 0.0007 ICSS 0.0004 0.0009 0.0012
_______________________________________________________________________ The International Journal of Applied Management and Technology, Vol 1, Num 1
IJAMT _______________________________________________________________ 15
ITGC 0.0007 0.0018 0.0016 OHDC 0.0009 0.0027 0.0027 SLTC 0.0004 0.0008 0.0009 CCCT 0.0021 0.0020 0.0020 ITDS 0.0179 0.0175 0.0175 ASTT 0.0062 0.0090 0.0139 PDPF 0.0054 0.0211 0.0053 SKMP 0.0109 0.0107 0.0107 CMSE 0.0060 0.0058 0.0058 CTEL 0.0112 0.0043 0.0049 NIDP 0.0073 0.0023 0.0029 OTDL 0.0129 0.0041 0.0051 BCMN 0.0096 0.0076 0.0061 RPCH 0.0070 0.0027 0.0031 DRFL 0.0048 0.0061 0.0038 CUSF 0.0028 0.0044 0.0017 DPMQ 0.0122 0.0033 0.0022 FMIP 0.0044 0.0056 0.0018 TMIA 0.0026 0.0038 0.0009 FDMC 0.0018 0.0051 0.0024
Table 9. Decision index for desirability of each supplier
Decision index for supplier 1 0.373 Decision index for supplier 2 0.344 Decision index for supplier 3 0.283
_______________________________________________________________________ The International Journal of Applied Management and Technology, Vol 1, Num 1
16 _______________________________________________________________ iJAMT
Fig 2. Data Summary graph for Supplier 1
0.0000
0.0100
0.0200
0.0300
0.0400
0.0500
0.0600
CUSTOTDL
ACCYPGRJ
AVTEACCY
NUTEOFLT
PDFBLG
RSTLMC
DBCT
WHECOHDC
ITDSSKMP
NIDP
RPCHDPMQ
FDMC
Sub-criteria
Prin
cipl
e ve
ctor
Fig. 3. Data Summary graph for Supplier 2.
0.0000
0.0050
0.0100
0.0150
0.0200
0.0250
0.0300
0.0350
0.0400
0.0450
CUSTOTDL
ACCYPGRJ
AVTEACCY
NUTEOFLT
PDFBLG
RSTLM
CDBCT
WHECOHDC
ITDSSKMP
NIDP
RPCHDPMQ
FDMC
Sub-criteria
Prin
cipl
e ve
ctor
_______________________________________________________________________ The International Journal of Applied Management and Technology, Vol 1, Num 1

IJAMT _______________________________________________________________ 17
Fig.4. Data summary graph for Supplier 3.
0.0000
0.0050
0.0100
0.0150
0.0200
0.0250
0.0300
0.0350
0.0400
0.0450
0.0500
CU
ST
LDTM
FLR
A
AC
CY
PR
FLIN
MP
AV
TETI
ME
CN
TYN
UTE
FLR
A
PO
FMP
DFB
STR
SH
MR
STL
MC
DFC
TM
FGC
WH
EC
ITG
CS
LTC
ITD
SP
DP
FC
MS
E
NID
PB
CM
ND
RFL
DP
MQ
TMIA
Sub-criteria
Prin
cipl
e ve
ctor
Fig.5. Composite overall scores for alternative Suppliers
0
0.05
0.1
0.15
0.2
0.25
0.3
0.35
0.4
Supplier 1. Supplier 2. Supplier 3.
_______________________________________________________________________ The International Journal of Applied Management and Technology, Vol 1, Num 1
18 _______________________________________________________________ iJAMT
Conclusion
The proposed approach forms a flexible and systematic decision framework for selection of supplier in competitive supply chain. The proposed decision framework for evaluating and selection of supplier enables decision makers to provide the base for the final choice from the overall potential suppliers. In this paper, the framework is evaluated by a case situation but the framework is applicable to different types of industries by allowing managers to structure their problems into priority weights, which can reflect their own priority considerations.
References
Ballow, R. H. (1999). Business logistics management. Prentice-Hall, New York Beamon, M. (1998).Supply chain design and analysis: Models and methods. International Journal of Production Economics, 55, 281-294. Chan, F. T. S. (2003).Performance measurement in a supply chain. International Journal of Advance Manufacturing Technology, 21, 534-548. Chan, F .T. S. and Chung S. H. (2004).Multi-criteria genetic optimization for distribution network problems. International Journal of Advance Manufacturing Technology, 24(7), 517-532 Dempsey, W.A. (1978).Vendor selection and the buying process. Industrial marketing Management, 7(3), 257-267 Dickson, G.W. (1966).An analysis of vendor selection system and decisions. Journal of purchasing, 2(1), 5-17 Dickson, G. (1966).An analysis of vendor selection systems and decisions. Journal of purchasing, 2(1), 28-41 Ellram, L. M. (1995).Total cost of ownership: an analysis approach for purchasing. International Journal of Physical distribution Logistics, 25(8), 163-184. Handeld, R. Walton, S. V. Sroufe, R. & Melnyk, S. A. (2002).Applying environmental criteria to supplier assessment: A study in the application of the analytical hierarchy process. European Journal of Operation Research, 141, 70-87 Karthik, V. (2006).An integrated supplier selection methodology for designing robust supply chains. IEEE International Conference on Management of Innovation
_______________________________________________________________________ and Technology, 906-910
The International Journal of Applied Management and Technology, Vol 1, Num 1
IJAMT _______________________________________________________________ 19
Kodali, R. and Chandra, S. (2001). Analytical hierarchy process for justification of total productive maintenance. Production Planning and control, 12(7), 695-705 Kodali Rambabu & Routroy Srikanta (2006).Decision framework for Selection of facilities location in competitive supply chain. International Journal of Advanced manufacturing Systems, 5(1), 89-110 Lambert, D. Stock, J. Ellram, L. (1998).Fundamentals of logistics management. McGraw-Hill, New York Noorul, A. Haq and Hannan G. (2006).Fuzzy analytical hierarchy process for evaluating and selecting a vendor in a supply chain model. International Journal of Advance Manufacturing technology, 29, 826-835 Nydick, R. L. and Hill R P (1992).Using the analytic hierarchy process to structure the supplier selection procedure. International Journal of purchasing material Management, 28(2), 31-36 Patton, W. W. (1996).Use of human judgment models in industrial buyer’s vendor selection decisions. Industrial Marketing Management, 25(2), 135-149 Petroni, A. & Braglia, M. (2000).Vendor selection using principal component analysis. Journal of Supply Chain management: A Global Rev Purchasing Supply, 36(2), 63-69 Roger, N. (1987).Justification of FMS with the analytical hierarchy process. Journal of Manufacturing, 7(3), 175-182. Saaty, T.L. (1980).The Analytic Hierarchy process. McGraw-Hill New York. Saaty, T L. (2000).Fundamentals of Decision Making and Priority Theory. 2ed edn. RWS Publication, Pittsburgh. Sarode, A. D., Sunnapwar, V. K. and Khodke, P. M. (2008).A Literature review for
identification of performance measures for establishing a frame work for performance measurement in supply chains. International Journal of Applied
Management and Technology, 6 (3), 241-287 Stanley, L. L. and Wisner, D. J. (2001).The determinants of service quality: issues for Purchasing. European Journal of purchasing Supply Chain management, 8(2), 97-109 Sheu, J-B. (2004).A Hybrid fuzzy-based approach for identifying global logistics Strategies. Transport Research Part E, 40, 39-61 Tam, M.C.Y. &Tummala V.M.R. (2001).An application of the AHP in vendor selection
_______________________________________________________________________ The International Journal of Applied Management and Technology, Vol 1, Num 1

20 _______________________________________________________________ iJAMT
of a telecommunications system. Omega, International journal of management Science, 29(2), 171-182 Talluri, S. Narasimhan, R. (2003).Vendor evaluation with performance variability: a max-min approach. European Journal of Operation Research, 146(3), 543-552 Timmerman, E. (1986).An approach to vendor performance evaluation. Journal of Supply Chain management, 22(4), 2-8. Vaidya, O. S. and Kumar, S. (2004).Analytic hierarchy process: An overview of Applications. European Journal of Operation Research (published online, 12 April 2004) Verma, R. and Pullman, M.E. (1998).An analysis of the supplier selection process. Omega, International Journal of Management Science, 26(6), 739-750 Weber, C. A., Current, R.J., Benton, W C. (1991).Vendor selection criteria and Methods. European Journal of Operation Research, 50, 2-18 Weber, C., Current, J., Desai, A. (1997).Non-cooperative negotiation strategies for Vendor selection. European Journal of operation research, 108(2), 208-223 Weber, C.A., Current, J.R., Desai, A. (2000).An optimization approach to determining the number of vendors to employ. International journal of Supply chain Management, 2(5), 90-98 Weele, A.J. (2000).Purchasing and supply chain management: analysis, planning, Pratice. Second edition, International Thomson Business, Albany Wei, S. Y., Jinlong, Z., Zhicheng, L .I. (1997). A supplier-selecting system using a Neural network. IEEE International Conference on Intelligent Processing Systems, 1, 468-471
_______________________________________________________________________ The International Journal of Applied Management and Technology, Vol 1, Num 1
IJAMT _______________________________________________________________ 21
_______________________________________________________________________ The International Journal of Applied Management and Technology, Vol 1, Num 1
Notes
Appendix Scale of relative importance Intensity Definition Explanation 1 3 5 7 9 2,4,6,8
Equal Importance Weak importance of one over the other Essential or strong Very strong Absolute importance Intermediate values
Two activities contribute equally to the objective Experience and judgment slightly favor one another Experience and judgment slightly favor one another An activity is strongly importance favored and its dominance is demonstrated in practice The evidence favoring one activity over another is of the highest degree When compromise is needed
Avinash D. Sarode is currently working as an Asst. Professor in the Mechanical Engineering Department at Lokmanya Tilak College of Engineering, Koperkhairane, Navi Mumbai, India, and has more than 10 years of teaching experience. He has published many research papers in national and international conference as well as journals. Currently he is pursuing doctoral program from Sant Gadge Baba Amravati University, Amravati. His research area is supply chain management and production technology, for two years he is recipient of research grant from University of Mumbai. Prakash M. Khodke is currently serving as a Professor and Principal of Government College of Engineering, Amravati, India. He has published number of papers in various national and international journals and has participated and organized a number of conferences. His research area is operation research, production technology, supply chain management, he is having 20 years of graduate and post graduate experience in teaching. He is guiding a number of students for their doctoral research. Corresponding author: Avinash D. Sarode, Asst. Professor, Lokmanya Tilak College of Engineering Koperkhairane, Navi Mumbai 400 709 (India), Phone: - (+91-22) 27541005/1006; Fax: - (+91-22) 27547787; E-mail: [email protected]