logistics management institute supply chain management · pdf filelogistics management...
TRANSCRIPT

Logistics Management Institute
Supply Chain Management:A Recommended Performance
Measurement Scorecard
LG803R1
®
Larry S. KlapperNeil Hamblin
Linda HutchisonLinda Novak
Jonathan Vivar
June 1999
Prepared pursuant to Department of Defense Contract DASW01-95-C-0019. The viewsexpressed here are those of the Logistics Management Institute at the time of issue but notnecessarily those of the Department of Defense. Permission to quote or reproduce any part
except for government purposes must be obtained from the Logistics Management Institute.
Logistics Management Institute2000 Corporate Ridge
McLean, VA 22102-7805
Logistics Management Institute
Supply Chain Management:A Recommended Performance
Measurement Scorecard
LG803R1
iii
LOGISTICS MANAGEMENT INSTITUTE
Supply Chain Management:A Recommended Performance
Measurement Scorecard
LG803R1/JUNE 1999
Executive Summary
Supply chain management is the management of all processes or functions to sat-isfy a customer’s order. The Department of Defense (DoD) operates the world’slargest supply chain, spends more than $80 billion annually on logistics, and em-ploys more than one million logistics personnel.
DoD supply chain managers manage approximately 5 million consumable and repa-rable items that are procured from more than 100,000 suppliers and distributed tomore than 30,000 customers. Similar to most enterprises, DoD is being challengedto reduce supply chain costs and improve customer satisfaction. As the departmenttransitions from traditional methods of support to industry-proven best practices,senior DoD logisticians need to monitor the supply chain’s overall performancecontinuously to ensure that policy and process changes achieve the desired results.
However, the supply chain performance measures available to senior DoD manag-ers are not adequate to measure the overall effectiveness of the DoD supply chain.They are not balanced across customer service, cost and readiness, andsustainability performance objectives. Because of the lack of enterprise-level, bal-anced performance measures, the Deputy Under Secretary of Defense (Logistics),DUSD(L), tasked the Logistics Management Institute to propose a set of bal-anced measures that senior decision-makers can use to monitor supply chaineffectiveness.
Based on our review of public-sector and existing DoD supply chain performancemeasures, we recommend that DUSD(L) adopt the following enterprise metrics:
u Perfect order fulfillment. A perfect order is an order that meets the fol-lowing standards:
ä Delivered complete; all items delivered in the quantities requested
ä Delivered on time, using the customer’s definition of on-time delivery

iv
ä Complete and accurate documentation (including packing slips, bills oflading, and invoices) to support the order
ä Delivered in perfect condition and in the correct configuration to beused by the customer, faultlessly installed (as applicable).
u Supply chain response time. The total average length (measured in days) ofthe supply chain. This metric is derived from the average plan, source,maintain (repair), and deliver cycle times. Generally, the shortest supplychains are the most responsive chains.
u Percent change in customer price compared to inflation. This customer-focused cost metric measures how well procurement initiatives are keepingprices low with overall supply chain management efficiency. The metricwould be computed based on a “market basket” approach similar to thatused to compute the Consumer Price Index.
u Supply chain management costs as a percent of sales (at standard price).This metric measures all costs for operating a supply chain as a percent ofthe value of materiel moving through it. Supply chain management costsare the management information system, finance and planning, inventorycarrying, materiel acquisition, and order management costs.
u Weapon system logistics costs as a percent of the acquisition price (ad-justed for inflation). This metric represents the logistics costs of a weaponsystem as a function of its acquisition price.
u Inventory turns. This metric (the total sales at acquisition price divided bythe value of inventory at acquisition price) measures how effectively assetsare managed. This metric excludes assets held in war reserve accounts (be-cause they are not for peacetime consumption).
u Weapon system not mission-capable (NMC) rates. This metric representsthe percent of time a weapon system fleet is not mission-capable because ofsupply (lack of parts), maintenance (lack of maintenance resources), orboth. NMC rates should be prepared for key weapon systems and usedwith other metrics (e.g., perfect order fulfillment and supply chain responsetime) that can be filtered by weapon system.
u Upside production flexibility. This metric is the number of days required toachieve an unplanned sustainable increase in production to support a two-major theater war (MTW) scenario.
u War reserve ratio. This metric is the ratio of on-hand war reserve assets tothe war reserve requirement. This measure is an indicator of the readinessto sustain a two-MTW conflict until the industrial base is mobilized (asmeasured by upside production flexibility).
Executive Summary
v
With this balanced performance measurement scorecard, senior DoD logisticsmanagers can monitor the effectiveness and efficiency of the supply chain as theyimplement logistics process improvements. In addition, the Assistant Deputy Un-der Secretary for Materiel and Distribution Management should use the recom-mended functional metrics to monitor their contribution to the enterprise.

vi
vii
Contents
Chapter 1 Introduction ................................................................................... 1-1
STUDY APPROACH ........................................................................................................1-1
RECOMMENDED ENTERPRISE PERFORMANCE MEASURES ...............................................1-2
RECOMMENDED FUNCTIONAL PERFORMANCE MEASURES ..............................................1-5
REPORT FORMAT...........................................................................................................1-5
Chapter 2 Current DoD Supply Chain Performance Measures ....................... 2-1
BACKGROUND...............................................................................................................2-1
MEASURES....................................................................................................................2-1
Government Performance and Results Act..............................................................2-1
Other Sources .........................................................................................................2-2
CONCLUSIONS...............................................................................................................2-3
Chapter 3 Performance Measures Framework................................................ 3-1
DEFINITION OF PERFORMANCE MEASURE ......................................................................3-1
SUPPLY CHAIN MANAGEMENT PERFORMANCE...............................................................3-2
PERFORMANCE MEASURES PYRAMID.............................................................................3-2
SUPPLY CHAIN OPERATIONS REFERENCE MODEL...........................................................3-3
BALANCED SCORECARD METHODOLOGY .......................................................................3-5
SUMMARY ....................................................................................................................3-5
Chapter 4 Enterprise Performance Measures.................................................. 4-1
BACKGROUND...............................................................................................................4-1
SCOR PERFORMANCE MEASURES .................................................................................4-2
Customer Service Perspective.................................................................................4-3
Cost Perspective .....................................................................................................4-6
Readiness and Sustainability Perspectives...............................................................4-8
DOD PERFORMANCE MEASURES ...................................................................................4-9
Cost Perspective: Weapon System Logistics Costs as a Percent of AcquisitionPrice............................................................................................................4-9
Readiness and Sustainability Perspective ................................................................4-9

viii
IMPLEMENTATION .......................................................................................................4-11
SUMMARY ..................................................................................................................4-11
Chapter 5 Functional Performance Measures for Materiel andDistribution Management..................................................................... 5-1
INTRODUCTION .............................................................................................................5-1
PLAN .........................................................................................................................5-1
Functional Metrics..................................................................................................5-1
Enterprise Relationship...........................................................................................5-2
SOURCE ........................................................................................................................5-3
Functional Metrics..................................................................................................5-4
Enterprise Relationship...........................................................................................5-5
MAINTAIN.....................................................................................................................5-6
Functional Metrics..................................................................................................5-6
Enterprise Relationship...........................................................................................5-7
DELIVER .......................................................................................................................5-7
Functional Metrics..................................................................................................5-7
Enterprise Relationship...........................................................................................5-8
SUMMARY ....................................................................................................................5-9
Appendix A SCOR Model
Appendix B DoD Supply Chain
Appendix C OSD, Military Service, and DLA Enterprise PerformanceMeasures
Appendix D Process Performance Measures
Appendix E Performance Measure Definitions
Appendix F Abbreviations
Contents
ix
FIGURES
Figure 1-1. DoD Supply Chain Performance Metrics..........................................................1-2
Figure 3-1. Performance Measurement Users .....................................................................3-3
Figure 3-2. SCOR Model Supply Chain .............................................................................3-4
Figure 4-1. Supply Chain Performance Measurement .........................................................4-1
Figure 4-2. Wholesale Performance Measurement..............................................................4-2
Figure 4-3. Source Cycle Time...........................................................................................4-5
Figure 5-1. Functional Metrics for Plan ..............................................................................5-2
Figure 5-2. Source Functional Metrics................................................................................5-5
Figure 5-3. Maintain Functional Metrics ............................................................................5-7
Figure 5-4. Deliver Functional Metrics...............................................................................5-9
TABLES
Table 3-1. Performance Measurement Definitions..............................................................3-1
Table 3-2. Definitions of Functions ....................................................................................3-4
Table 4-1. SCOR Enterprise Performance Measures...........................................................4-3
Table 4-2. Recommended Enterprise Performance Measures............................................4-11
Table 5-1. Plan Functional Metrics.....................................................................................5-2
Table 5-2. Functional Metrics for Source ...........................................................................5-4
Table 5-3. Functional Metrics for Maintain ........................................................................5-6
Table 5-4. Functional Metrics for Deliver...........................................................................5-8

x

1-1
Chapter 1 Introduction
Customers of the Department of Defense (DoD) logistics system are demandingimproved performance in the areas of reliability, flexibility, and responsiveness. Atthe same time, the customers expect efficiencies similar to those being experiencedin the private sector. The military services and the Office of the Secretary of De-fense (OSD) have several initiatives to improve supply chain performance and re-duce logistics costs.
Supply chain management is the management of all internal and external processesor functions to satisfy a customer’s order (from raw materials through conversionand manufacture through shipment). Performance measures, or “metrics,” are usedto monitor the progress of supply chain initiatives. However, a consensus in DoDconsiders the metrics available to senior DoD managers to be inadequate or lack-ing the depth to measure the effectiveness of the DoD supply chain. The metricsare not “balanced” across customer service, cost, readiness, and sustainabilityperformance objectives.
Because of the lack of adequate measures, the Deputy Under Secretary of Defense(Logistics) (DUSD[L]) tasked Logistics Management Institute (LMI) to propose aset of balanced performance measures that senior decision-makers can use tomonitor supply chain effectiveness.1 This set is a prerequisite for developing a“data strategic plan” that defines the data source, warehousing, and mining re-quirements for supply chain measures. This report addresses our recommendedtop-level, or enterprise-level, performance measures for DoD. Enterprise metricsmeasure the overall performance of the supply chain and are cross-functional. Inaddition, the report presents the functional and process performance measures forthe Assistant Deputy Under Secretary for Materiel and Distribution Management,ADUSD(L)MDM, that can be used to diagnose performance at the enterprise levelthat might be substandard or below expectations.
STUDY APPROACH
Our approach included the following steps:
u Research the metrics used by commercial industry and DoD. We reviewedthe Department of Defense Logistics Strategic Plan and relevant DoD
1 The scope of this study is limited to supply chain management of secondary items.

1-2
logistics policies.2 Next we identified and evaluated commercialmeasurement efforts, such as the Supply Chain Operations Reference(SCOR) model, the American Productivity and Quality Center bench-marking toolkit, and the Wharton School (University of Pennsylvania)benchmarking studies.3 We decided to adopt the SCOR metrics becauseSCOR is the only model that links metrics to individual supply chain func-tional processes. Finally, we interviewed key supply chain managementstaff members in OSD, the military services, and the Defense LogisticsAgency (DLA).
u Select a performance measures architecture. To be consistent with otherlogistics initiatives, we used the performance measures framework recom-mended in the DoD Logistics Functional Requirements Guide.4 Thisframework is discussed in Chapter 3.
u Recommend ideal performance measures for DoD. We used the “balancedscorecard” methodology for developing our recommended set of perform-ance measures.5 This methodology is discussed in Chapter 3.
RECOMMENDED ENTERPRISE PERFORMANCE
MEASURES
After analyzing the measures and applying them to our architecture and frame-work, we developed the balanced enterprise-level scorecard that uses nine metricsas depicted in Figure 1-1.
2 Department of Defense, Deputy Under Secretary of Defense (Logistics), Department of
Defense Logistics Strategic Plan, 1998 edition.3 The SCOR model, developed by the Supply Chain Council, is a widely accepted commer-
cial process and performance measures model.4 Department of Defense, Deputy Under Secretary of Defense (Logistics), Logistics Func-
tional Requirements Guide, Logistics Management Institute, McLean, VA, August 1998,Chapter 5.
5 Robert S. Kaplan and David P. Norton, “The Balanced Scorecard—Measures That DriveHarvard Business Review, Vol. 70, No. 2, January–February 1992.

Introduction
1-3
Figure 1-1. DoD Supply Chain Performance Metrics
Perfect order fulfillment, more than any other metric, captures most aspects (e.g.,on time, right quantity, acceptable quality, adequate paperwork) that a customerconsiders important. It is a key metric used in the SCOR model and many othercommercial supply chain metric frameworks.
Supply chain response time is also a very valuable high-level measure. It is ex-pressed as the total length of the supply chain, measured in days (encompassingplan, source, maintain, and deliver cycle times). The SCOR model defines this timeas “the time for a supply chain to respond to abnormal (significant) changes in de-mand.” Normally a customer is buffered from the total length of the chain (becauseorders are filled from stock); however, for nonstocked items or when a customer’sdemand is exceedingly large and causes backorders, this metric approaches the or-der fulfillment cycle time. In general, the shortest supply chains are the most re-sponsive to change.
Percent change in customer price compared to inflation considers a market basketof items and compares the price that customers pay to inflation. This price indexcan be DoD’s version of the Consumer Price Index (CPI). This metric combineshow well procurement initiatives are keeping prices low with overall supply chainmanagement efficiency.
Supply chain management costs as a percent of sales (at standard price) is a keysupply chain cost measure. It represents all costs associated with operating a sup-ply chain as a percent of the value of materiel moving through it. Industry uses thismetric for benchmarking.
Weapon system logistics costs as a percent of the acquisition price captures theeffects of nontraditional supply chain improvements (not reflected in traditionalsupply chain metrics) for the enterprise level. For example, perfect order fulfillmentrates and total supply chain management costs as a percent of sales are improvedas the number of orders processed increases because costs and failures are spreadover a larger base. In addition, a major goal of most commercial enterprises is toincrease sales, thereby improving market share and profit. However, this metric is
Perfect order fulfillment
Supply chain response time
Customersatisfaction
Percent change in customer price
compared to inflation
Supply chain managementcosts as a
percent of sales
Weapon system logisticscosts as a percentof acquisition price
Inventoryturns
Cost
Weapon system not mission
capable rates
Upside production flexibility
War reserve ratio
Readiness andsustainability
DoD supply chainperformance measures

1-4
improved as the number of orders placed to repair a weapon system is reduced.This metric captures some efforts of design engineers to improve reliability andmaintainability and thereby reduce a weapon system’s life-cycle cost.
Inventory turns (or the inverse of days of supply) is a key commercial supply chainmetric (used by the SCOR model and all other commercial frameworks). It meas-ures the productivity of the inventory investment. In general, the higher the inven-tory turn, the more efficient the supply chain. This metric is more meaningful thanmetrics that simply express the value of inventory levels. Assets held in war reserveaccounts are excluded from the computation (because they are not for peacetimeconsumption).
Weapon system not mission-capable (NMC) rates are key weapon system readi-ness metrics used by DoD. An NMC rate is the percent of time a weapon systemfleet is NMC–supply (NMCS), meaning a lack of parts; NMC–maintenance(NMCM), a lack of maintenance resources; or both. The supply chain’s perform-ance can directly affect NMC rates.6
Upside production flexibility is a key high-level commercial supply chain metricthat is also applicable to DoD operations. It is defined in SCOR as the number ofdays needed to achieve a 20 percent sustainable increase in production. We modi-fied the definition to be the number of days needed to achieve a sustainable in-crease to support a two-major theater war (MTW) scenario. This metric is thebasis for computing war reserve requirements. Ideally, the requirements are re-duced by closer coordination and planning with DoD suppliers.
War reserve ratio measures the ratio of on-hand war reserve assets to the war re-serve requirement. This measure is an indicator of the readiness to sustain a two-MTW conflict until the industrial base is mobilized (as measured by upside pro-duction flexibility). This ratio is an important sustainability metric that is unique toDoD supply chain management.
Ideally, the system that produces these metrics will have a “filter” or “drilldown”capability for the following elements (if applicable):
u Supply source (e.g., inventory control point [ICP], retail supply activity)
u Customer (e.g., military service, geographical area, force structure)
u Weapon system
6 In addition to NMC rates, DoD uses several other equipment readiness indicators, includ-
ing mission-capable (MC), fully mission-capable (FMC), and partially mission-capable (PMC),that apply to all systems or equipment except ships and submarines. FMC and PMC constituteMC. PMC may consist of PMC–supply (PMCS) and PMC–maintenance (PMCM).

Introduction
1-5
u Type of item (e.g., stocked, prime vendor, planned direct vendor delivery[DVD], nonstocked)
u Commodity
u Issue priority (for perfect order fulfillment)
u Mission essentiality code (for perfect order fulfillment).
RECOMMENDED FUNCTIONAL PERFORMANCE
MEASURES
Chapter 5 presents a series of source, maintain, deliver, and plan functional metricsof interest to ADUSD(L)MDM that can be used as diagnostic metrics for the en-terprise level. Suggested diagnostic measures for the functional metrics arediscussed in Appendix D.
REPORT FORMAT
The remainder of this report is organized as follows:
u Chapter 2 describes current DoD performance measures used and explainswhy they are not adequate to measure total supply chain performance.
u Chapter 3 discusses the performance measurement framework used for ouranalysis.
u Chapter 4 presents information about each enterprise measure, potentialdata sources, and barriers to implementation.
u Chapter 5 identifies functional performance measures forADUSD(L)MDM.
u Appendix A presents an overview of the SCOR model.
u Appendix B describes how the SCOR model can be adapted to the DoDsupply chain.
u Appendix C presents a summary of the enterprise measures used by OSD,the military services, and DLA.
u Appendix D contains a list of suggested process performance measures thatare diagnostic to the functional metrics.
u Appendix E contains definitions of the recommended performancemeasures.

1-6
u Appendix F is a list of abbreviations used in this report.

Introduction
1-7

2-1
Chapter 2 Current DoD Supply Chain Performance Measures
BACKGROUND
Two landmark reforms of the 1990s—the Chief Financial Officers Act of 1990 andthe Government Performance and Results Act (GPRA) of 1993—established clearaccountability of federal agencies for their performance. With these two laws,Congress imposed a new and more businesslike framework for management andaccountability. In addition, GPRA created requirements for agencies to generatethe information congressional and executive branch decision-makers need for im-proving government performance and reducing costs.1
Because of the legislation and other factors, government agencies are tasked to runtheir affairs in a more business-like manner. As a result, a balanced set of DoDsupply chain management performance is critically needed.
MEASURES
Government Performance and Results Act
The DoD GPRA Performance Plan for Fiscal Year (FY) 2000 lists the followingfour supply chain-related performance measures and sets goals for improvement:
u Logistics response time (LRT) (days). This metric depicts the average timeit takes to complete a customer’s order—from order creation to order re-ceipt. This metric is a valuable supply chain measure; however, it lacks asense of “on-time” delivery. To be effective, a metric needs to represent thepercent of time that customers receive their materiel by the required date.
u Materiel asset visibility and accessibility (percent). This metric representsthe percent of items that have achieved total asset visibility (TAV). Real-time visibility of all supply chain resources is essential. However, this met-ric does not measure supply chain performance. TAV can be fully imple-mented and not result in supply chain improvement if the information is notproperly used. Similar to electronic data interchange (EDI), real-timevisibility is an enabling technology. If supply chain managers use infor-mation to make better decisions, supply chain performance will improve(similar to LRT).
1 U.S. General Accounting Office, Executive Guide, Effectively Implementing the Govern-
ment Performance and Results Act, GAO/GGD-96-118, June 1996.

2-2
u Reduction of supply inventory (value). DoD has implemented several pro-grams to reduce its inventory. This metric measures the military services’progress toward inventory reduction goals. Post-Cold War inventorieswere too high and needed to be reduced; however, managers cannot simplyconsider the value of the inventory and determine if it is good or bad. Ef-fective supply chain metrics measure the productivity of inventory invest-ment. Managers also need performance measures that can indicate ifcustomer satisfaction or readiness has declined because of inadequateinventory.
u Purchase card micropurchases (percent). This metric is similar to TAV inthat it measures the implementation of a program or project. However,measuring the implementation of one initiative does not place overall sup-ply chain performance in an adequate context. Enterprise supply chain met-rics should measure how well the supply chain performs. Measuring theimplementation of improvement initiatives should be at low levels of ameasurement framework to diagnose problems that are detected at theenterprise level.
Other Sources
OSD uses the supply chain performance measures for secondary items provided bytwo main sources: the Materiel and Distribution Management Annual Fact Bookand DoD Supply Executive Information Management System.2 Appendix C lists36 executive-level metrics maintained in these two sources. The following meas-ures are examples:
u Wholesale supply management cost of operations. Similar to the metric forinventory reduction, this metric depicts supply management costs as an ab-solute value rather than a ratio. Therefore, it is a measure of size and scaleand not of performance. If presented as a percent of a related factor (suchas total sales), it would be more meaningful. Although the measure’s titleincludes “cost” and implies actual expenditures, the basis of the metric isbudgeted cost. In general, DoD should use execution financial data tomeasure performance (unless it is measuring adherence to plans).
u Wholesale inventory turnover. A measurement of inventory turns is a keysupply chain performance metric because it measures inventoryproductivity.
u Wholesale inventory requirements levels. This metric indicates the DoDaverage (in days) of safety level, administrative lead-times, productionlead-times, and repair cycle times. They are useful measures because theyexpress the level of inventory in days. A goal of supply chain management
2 Both sources are available on the Internet at http://www.acq.osd.mil/log/mdm/exinfo.htm.

Current DoD Supply Chain Performance Measures
2-3
is to reduce cycle times by “replacing inventory with information” that canbe used to make better decisions.
u Stock availability for wholesale stocked items. Stock availability, or fillrate, is also a key performance measure. It represents the percent ofstocked item requisitions that are filled immediately and is an important in-dicator of customer satisfaction. When this metric is used with a cost met-ric (e.g., inventory turns), managers can quickly evaluate the productivityof their investments in inventory. However, because this metric measuresonly wholesale availability, it does not provide an integrated supply chainperspective. Many customer orders are satisfied from DoD inventory levelsbelow wholesale.
CONCLUSIONS
Although many current metrics provide useful information, they do not providesenior managers with a sense of how well the supply chain is performing.
u They do not measure total supply chain performance. Many metrics meas-ure only wholesale performance. Others simply measure the implementa-tion of an initiative without any link to the performance metrics that shouldindicate the resulting supply chain improvement.
u They are not linked or correlated to one another so managers can considerimportant supply chain relationships. For example, reduced inventory maynot be beneficial if readiness rates are declining.
In the next chapters we discuss a measurement framework that can provide DoDsupply chain managers with a balanced, linked set of performance measures.

2-4
3-1
Chapter 3 Performance Measures Framework
In this chapter we discuss
u the definition of performance measures,
u the importance of supply chain performance measurement,
u a performance measures pyramid framework,
u the SCOR model, and
u the balanced scorecard methodology.
DEFINITION OF PERFORMANCE MEASURE
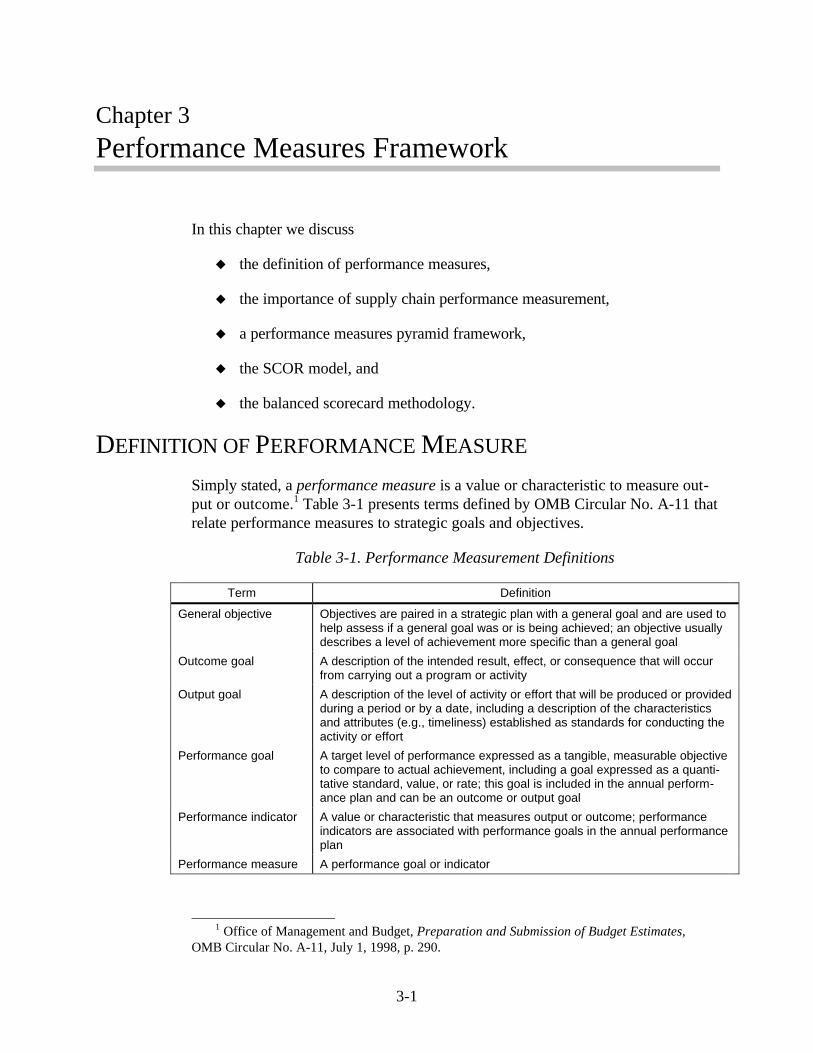
Simply stated, a performance measure is a value or characteristic to measure out-put or outcome.1 Table 3-1 presents terms defined by OMB Circular No. A-11 thatrelate performance measures to strategic goals and objectives.
Table 3-1. Performance Measurement Definitions
Term Definition
General objective Objectives are paired in a strategic plan with a general goal and are used tohelp assess if a general goal was or is being achieved; an objective usuallydescribes a level of achievement more specific than a general goal
Outcome goal A description of the intended result, effect, or consequence that will occurfrom carrying out a program or activity
Output goal A description of the level of activity or effort that will be produced or providedduring a period or by a date, including a description of the characteristicsand attributes (e.g., timeliness) established as standards for conducting theactivity or effort
Performance goal A target level of performance expressed as a tangible, measurable objectiveto compare to actual achievement, including a goal expressed as a quanti-tative standard, value, or rate; this goal is included in the annual perform-ance plan and can be an outcome or output goal
Performance indicator A value or characteristic that measures output or outcome; performanceindicators are associated with performance goals in the annual performanceplan
Performance measure A performance goal or indicator
1 Office of Management and Budget, Preparation and Submission of Budget Estimates,
OMB Circular No. A-11, July 1, 1998, p. 290.

3-2
The overriding objective of the DoD logistics system is to provide responsive andcost-effective support to ensure readiness and sustainability for the total force inpeacetime and war. An effective and efficient supply chain is an important ingredi-ent to overall success.
SUPPLY CHAIN MANAGEMENT PERFORMANCE
Chapter 1 presents the definition of supply chain management. 2 In addition, theCouncil of Logistics Management defines logistics as the “part of the supply chainprocess that plans, implements, and controls the efficient, effective flow and stor-age of goods, services, and related information from the point of origin to thepoint of consumption in order to meet customers’ requirements.”3
Recent studies indicate that supply chain performance affects more than 85 percentof a manufacturer’s costs and a large percent of its revenues.4 Monitoring thisperformance through measurements is, therefore, practical and can help to identifyoptimization opportunities. Superior performers are reengineering their supplychains to decrease costs, improve customer satisfaction, and increase profits. Ef-fective reengineering requires an understanding of the supply chain processes andtheir relationships. This understanding permits the development of a performancescorecard and the setting of improvement goals.
PERFORMANCE MEASURES PYRAMID
Figure 3-1 shows three levels of DoD performance measure users. The top level ofthe pyramid is the enterprise level (i.e., the primary focus of this report). In ourframework the DUSD(L) is this level. The next level of the pyramid is the func-tional level (e.g., supply, maintenance, and transportation). The last level of thepyramid is the process level.
The enterprise metrics measure the overall effectiveness of the supply chain. In thisarchitecture, the metrics are linked. The metrics selected for the enterprise leveltypically are cross-functional and measure overall performance. The functionalmetrics are linked to at least one enterprise metric and measure a major function’sperformance. The process (e.g., warehousing, requirements planning) metrics arerelated to one or more functional metrics and are diagnostic in nature.
2 Supply Chain Council, Supply Chain Operations Reference Model Concept Development
Workshop, 1998.3 Council of Logistics Management, http://www.clm1.org, accessed 22 March 1999.4 Supply Chain Council, Supply Chain Operations Reference Model Concept Development
Workshop, 1998.

Performance Measures Framework
3-3
Figure 3-1. Performance Measurement Users
ENTERPRISEExecutive
informationMission results
FUNCTIONALManagementinformation
Command and component results
PROGRAM, PROCESS, OR PROJECT
Unit, activity, and taskinformation
Workplace results
Alig
nmen
t
Level of detail
SUPPLY CHAIN OPERATIONS REFERENCE MODEL
One way to understand a supply chain is to use a process model. The Supply ChainCouncil created the SCOR model as a way for companies to communicate. It is aframework for examining a supply chain in detail, defining and categorizing theprocesses that make up the supply chain, assigning metrics to the processes, andreviewing comparable benchmarks. More than 400 companies use the SCORmodel to understand and improve their supply chains. The companies includeaerospace and defense manufacturers, large consumer product manufacturers,and third-party logistics providers. The SCOR model is the only supply chainframework that we found that links performance measures, best practices, andsoftware requirements to a detailed business process model.
Figure 3-2 shows that the SCOR model’s supply chain is composed of fourmanagement processes—plan, source, make, and deliver—known as level 1processes. (Table 3-2 defines the processes.) Each link in the supply chain consistsof a level 1 process.

3-4
Figure 3-2. SCOR Model Supply Chain
Supplier
Plan
Customer Customer’scustomer
Supplier’ssupplier
Make DeliverSource Make DeliverMakeSourceDeliver SourceDeliver
Internal or external Internal or external
Company
Source
Table 3-2. Definitions of Functions
Function Definition
Plan Processes that balance aggregate demand and supply for devel-oping the best course of action that meets established businessrules
Source Processes that procure goods and services for meeting plannedor actual demand
Make Processes that transform goods to a finished state for meetingplanned or actual demand
Deliver Processes that provide finished goods and services, includingorder management, transportation management, and warehousemanagement, for meeting planned or actual demand
The SCOR model continues to two more levels of processes and subprocesses.The model recommends performance measures for each SCOR process (seeAppendix A). By implementing the SCOR model, DoD would be able to
u communicate with current and potential vendors using common terminol-ogy and standard descriptions;
u use the model as a planning and forecasting tool;
u leverage metrics and benchmarking to determine performance goals, setpriorities, and quantify the benefits of a process change;
u link functional and process metrics to enterprise performance in astructured way;
u understand the best practices to obtain the best performance;

Performance Measures Framework
3-5
u understand supply chain management and evaluate performance; and
u identify the software tools best suited for DoD processes.
The SCOR model is widely accepted and applied in industry and may be adoptedby the American National Standards Institute as a standard supply chain processmodel. As a result, we conclude that DoD should use the SCOR model’s perform-ance measures when practical and supplemented with additional metrics as needed.
BALANCED SCORECARD METHODOLOGY
To be consistent with the Logistics Functional Requirements Guide5 and theSCOR model, we selected the “balanced scorecard” methodology for developingour recommended set of performance measures.6 This methodology is widely ac-cepted for developing performance measures because it balances past performancewith the “drivers of future financial and competitive performance.”7 The balancedscorecard approach requires that the scorecard results be balanced for external andinternal, financial and nonfinancial, and short-term and long-term perspectives. Webalanced the metrics for the three levels of the pyramid using the following per-spectives:
u Customer satisfaction (external)
u Supply chain costs (internal)
u Readiness and sustainability (external).8
Process metrics diagnose process results (internal and short-term). Functional met-rics measure the ability of the process results to satisfy customer satisfaction, cost,and readiness requirements (external and long-term). We maintain this balance atthe enterprise level through the parent and child relationship between enterpriseand functional metrics.
SUMMARY
By combining the best elements of several structures, we developed a hybrid per-formance measurement framework ideally suited for the DoD supply chain. Weused the three levels of linked metrics (enterprise, functional, and process) recom-
5 Department of Defense, Deputy Under Secretary of Defense (Logistics), Logistics Func-tional Requirements Guide, Logistics Management Institute, McLean, VA, August 1998, p. 5-16.
6 Robert S. Kaplan and David P. Norton, “The Balanced Scorecard—Measures That DriveHarvard Business Review, Vol. 70, No. 2, January–February 1992.
7 Robert S. Kaplan and David P. Norton, The Balanced Scorecard—Translating Strategyinto Action, Boston: Harvard Business School Press, 1996, p. 8.
8 We excluded human relations and training perspectives in our modified adaptation of thebalanced scorecard for DoD logistics.
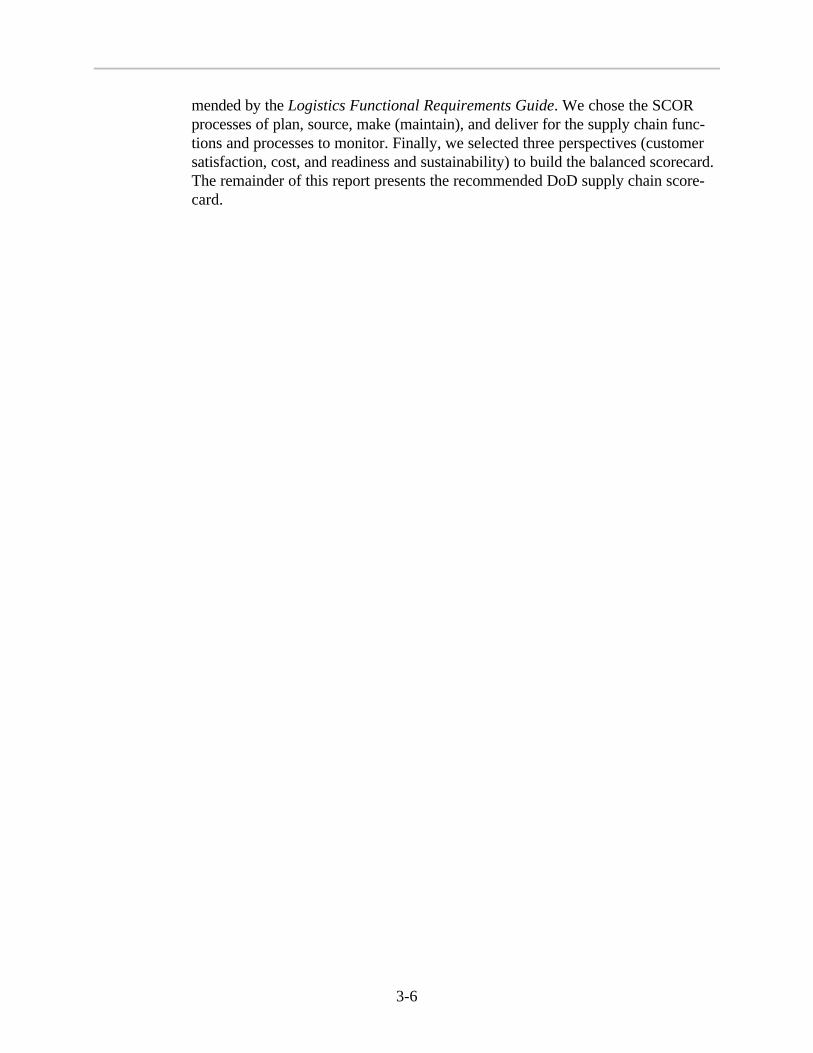
3-6
mended by the Logistics Functional Requirements Guide. We chose the SCORprocesses of plan, source, make (maintain), and deliver for the supply chain func-tions and processes to monitor. Finally, we selected three perspectives (customersatisfaction, cost, and readiness and sustainability) to build the balanced scorecard.The remainder of this report presents the recommended DoD supply chain score-card.

4-1
Chapter 4 Enterprise Performance Measures
BACKGROUND
The enterprise performance measures discussed in this chapter are designed tomeasure the efficiency and effectiveness of the DoD supply chain. To identify therelevant performance measures for DoD, we use the SCOR model methodologyfor graphically depicting a supply chain. Figure 4-1 presents a SCOR process dia-gram for DoD. Customers order materiel from the supply chain (the gray box inFigure 4-1), and orders are delivered. Customer orders can be grouped in the fol-lowing two categories:
u Single line item. “Single line item” requisitions or issue requests preparedby a customer (e.g., mechanic for a weapon system) that are
ä Military Standard Requisition and Issue Procedures documents or
ä documents and transactions (e.g., manually prepared issue requestdocuments, transactions generated by a maintenance application forsubmission to a supply system) unique to a military service.
u Job order. A list of materiel (several line items) to complete a job (e.g., abill of materiel [BOM] for repairing a damaged or failed weapon system).
Figure 4-1. Supply Chain Performance Measurement
Wholesale CustomerSuppliers Retail
S1
D2
D1 D1 S1 D1 S1 D1
P2 P4
S2 D2
M1 M1
Measure overallsupply chain
The first category is consistent with traditional DoD supply chain performancemeasures (e.g., fill rate, LRT). The supply system of the customer receiving theorders can prepare the measures. The second category produces measures that aremeaningful to maintenance personnel (they cannot complete a job until all

4-2
required materiel is received) and are prepared by maintenance systems that openand close jobs.
Figure 4-2 shows the traditional DoD enterprise measurement nodes (for onlywholesale performance) for several measures, including LRT. Measuring the re-sponsiveness of only the wholesale system can be misleading because most ordersare requisitions from a retail level for replenishing stock (i.e., repositioning inven-tory in the supply chain) and do not delay a repair or maintenance action.
Figure 4-2. Wholesale Performance Measurement
Wholesale CustomerSuppliers Retail
S1
D2
D1 D1 S1 D1 S1 D1
P2 P4
S2 D2
M1 M1
Measurewholesalesupply chain
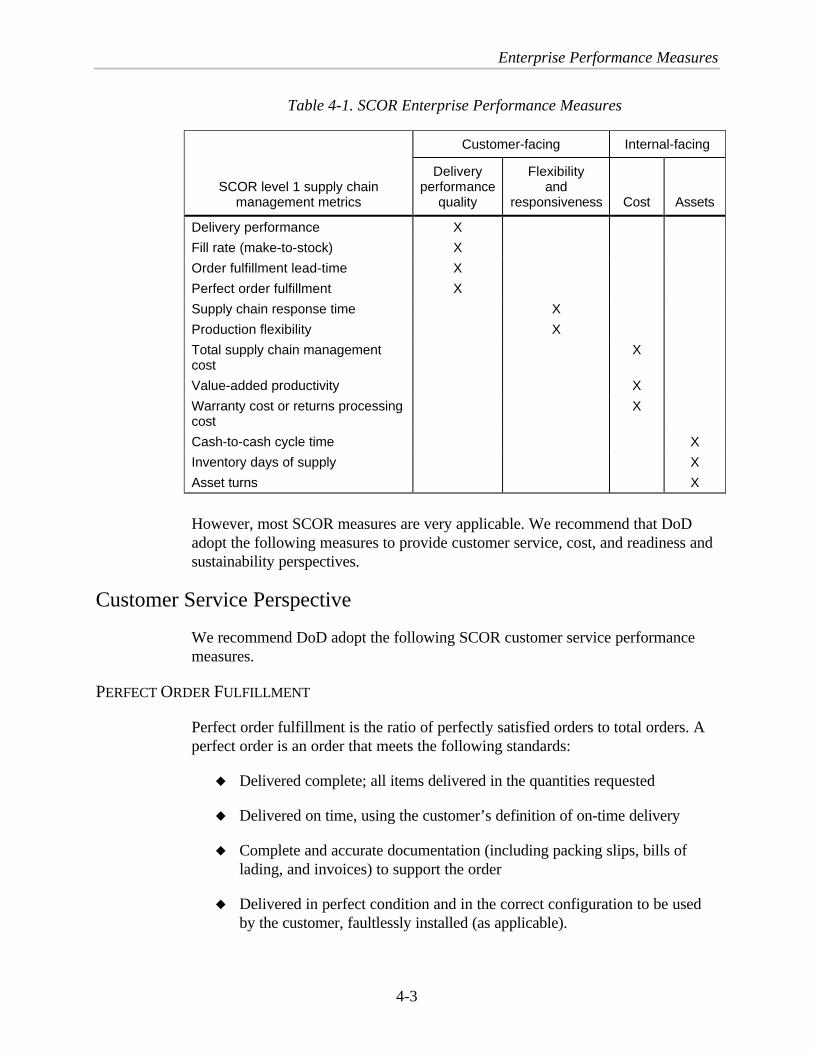
SCOR PERFORMANCE MEASURES
Table 4-1 shows the SCOR level 1, or enterprise-level, performance measures. TheSCOR model includes a standard set of performance measures. We consider somemetrics on the SCOR level 1 scorecard to be more applicable for the functionallevel. For example, delivery performance (to request date), fill rate, and order ful-fillment lead-time focus on aspects of the deliver function. In addition, deliveryperformance is a component of the perfect order fulfillment rate. Order fulfillmentlead-time (deliver) is a segment of supply chain response time.
Some metrics do not apply to the defense environment very well. We do not con-sider warranty costs, value-added productivity, and cash-to-cash cycle time asuseful measures of the DoD supply chain. Warranty costs are useful for manu-facturers as measures of quality and customer satisfaction; they are not applicableto DoD unless depot maintenance activities offer warranties on secondary item re-pairs. Cash-to-cash cycle time measures cash flow and is very sensitive to accountsreceivable (and the quickness that customers pay their bills). Because DoD cus-tomers do not pay directly for an invoice (i.e., internal fund transfers), this metricis not useful. We exclude inventory days of supply because it is the inverse of in-ventory turns (included in our recommended scorecard).
Enterprise Performance Measures
4-3
Table 4-1. SCOR Enterprise Performance Measures
Customer-facing Internal-facing
SCOR level 1 supply chainmanagement metrics
Deliveryperformance
quality
Flexibilityand
responsiveness Cost Assets
Delivery performance X
Fill rate (make-to-stock) X
Order fulfillment lead-time X
Perfect order fulfillment X
Supply chain response time X
Production flexibility X
Total supply chain managementcost
X
Value-added productivity X
Warranty cost or returns processingcost
X
Cash-to-cash cycle time X
Inventory days of supply X
Asset turns X
However, most SCOR measures are very applicable. We recommend that DoDadopt the following measures to provide customer service, cost, and readiness andsustainability perspectives.
Customer Service Perspective
We recommend DoD adopt the following SCOR customer service performancemeasures.
PERFECT ORDER FULFILLMENT
Perfect order fulfillment is the ratio of perfectly satisfied orders to total orders. Aperfect order is an order that meets the following standards:
u Delivered complete; all items delivered in the quantities requested
u Delivered on time, using the customer’s definition of on-time delivery
u Complete and accurate documentation (including packing slips, bills oflading, and invoices) to support the order
u Delivered in perfect condition and in the correct configuration to be usedby the customer, faultlessly installed (as applicable).
4-4
Perfect order fulfillment rate should be measured from the customer’s perspective(Figure 4-1) using both categories (single line items and job orders). The cus-tomer’s required delivery date or Uniform Materiel Movement and Issue PrioritySystem time standards should be used.1 The same drilldown capability as orderfulfillment lead-time should exist.
Implementation of this measurement may be difficult if accurate documentationand condition of the materiel are needed before customers’ systems can accuratelyrecord the conditions. However, time and quantity standards should always beincluded.
SUPPLY CHAIN RESPONSE TIME
Supply chain response is expressed as the total length of the supply chain, meas-ured in days (encompassing plan, source, maintain, and deliver cycle times). ForDoD it is the sum of the average source and order cycle times.2
Source Cycle Time
Source cycle time is the cumulative lead-time (including administrative lead-time[ALT], supplier lead-time, receiving time, and handling time) from demand identi-fication until the materiel is available. In the DoD supply chain, source cycle timefor reparables is the average dollar-weighted time to obtain assets from new pro-curement (ALT and production lead-time [PLT]) and repair (retrograde time andrepair cycle time, or RCT). Consumable items use only ALT and PLT (see Figure4-3).
Source cycle-time metrics should have a drilldown, or filtering, capability for thefollowing elements:
u Military service
u ICP
u Reparable and consumable items
u Weapon system (for unique items)
u Commodity
u Essentiality.
1 Department of Defense, DoD Materiel Management Regulation, DoD 4140.1-R, May
1998, Appendix 8.2 Planning time is not considered relevant as an additive factor. Elements of planning time
are already included in administrative lead-time. Maintain is also included in our definition ofsource cycle time because repair is a primary source of supply for serviceable reparables.

Enterprise Performance Measures
4-5
Figure 4-3. Source Cycle Time
S1
D1
D2
D1M1
Retrograde carcass
Retrograde time
New item
ALT and PLT
RCT
Note: This figure uses SCOR level 2 processes and supply chain threads to illustrate sourcecycle time. Appendix A explains the processes and threads. D1 = deliver stocked product;D2 = deliver make-to-order product; M1 = make to stock; S1 = source stocked materiel.
Order Fulfillment Lead-Time
Order fulfillment lead-time is the average lead-time from customer signature andauthorization to order receipt, order receipt to order entry complete, order entrycomplete to order ready for shipment, and order ready for shipment to customerreceipt of order. In DoD this time is referred to as LRT and includes several seg-ments measured separately. The Logistics Metrics Analysis Reporting System(LMARS) produces LRT metrics (for wholesale only).
Ideally, order fulfillment lead-time is measured from the final customer’s perspec-tive (Figure 4-1). Metrics should be produced for both categories of orders (singleline item and job order).
u The order fulfillment lead-time for a single line item is a measurement takenfrom the supply or procurement system that is the point of entry for the or-der or issue request. (Examples of systems are the Navy’s Shipboard Non-tactical Automated Data Processing [ADP] Program, Shipboard UniformADP System, and Uniform ADP System; Army’s Unit Level LogisticsSystem; Air Force’s Standard Base Supply System; and Marine Corps’Supported Activities Supply System.) This measurement also includes pur-chase card transactions.
u The order fulfillment lead-time for job orders is a measurement taken fromthe maintenance system that is the point of entry for scheduling and re-cording the maintenance action. An order fulfillment lead-time is computedfor the bill and is the time to fill the item that takes the longest time to fill(because the job cannot be completed until all items are received).
4-6
Order fulfillment lead-time metrics should have a drilldown, or filtering, capabilityfor the following elements:
u Ordering military service
u Ordering theater
u Ordering unit
u Issue priority group
u Source of supply (e.g., ICP, retail supply)
u Reparable and consumable items
u Type of item (e.g., stocked, planned DVD, unplanned DVD, localpurchase, outsource product support)
u Weapon system (for unique items)
u Commodity
u Essentiality.
The existing LRT metrics for wholesale should continue as a measure of wholesalesupport; however, they are not measures of the responsiveness of the entire DoDsupply chain.
Cost Perspective
We recommend DoD adopt the following SCOR cost performance measures.
PERCENT CHANGE IN CUSTOMER PRICE COMPARED TO INFLATION
Customer price (standard price) is represented by a market basket of secondaryitems similar to the basket of goods in the CPI. The market basket should be up-dated periodically to reflect changes in weapon system design because DoD re-places many secondary items with new technological versions rather thancontinuing to use the original versions. This metric should be produced every year(after new standard prices are set), and the price of the market basket should becompared to inflation.

Enterprise Performance Measures
4-7
SUPPLY CHAIN MANAGEMENT COSTS AS A PERCENT OF SALES
AT STANDARD PRICE
Supply chain management costs are supply chain-related management informationsystem (MIS), supply chain planning, inventory carrying, materiel acquisition, andorder management costs.
u MIS costs are the costs of developing and operating logistics informationsystems.
u Supply chain planning costs are the costs associated with forecasting, de-veloping finished goods or end item inventory plans, and coordinating thedemand and supply process throughout the supply chain, including allchannels.
u Inventory carrying costs are the costs of shrinkage, insurance, and taxes;obsolescence for raw materiel, work in progress, and finished goods in-ventory; channel obsolescence; and field sample obsolescence.
u Materiel acquisition costs are the costs of materiel management and plan-ning, supplier quality engineering, inbound freight and duties, receiving andstorage, inspection, materiel process engineering, and tooling.
u Order management costs are the costs of creating customer orders; orderentry and maintenance costs; contract, program, and channel managementcosts; installation planning costs; order fulfillment costs; distribution costs;outbound transportation costs; and customer invoicing and accountingcosts.
Ideally, this metric is measured from the customer’s perspective (Figure 4-1);revenue is the value of materiel moving from the gray box to a customer, and sup-ply chain costs are the costs of operating the gray box. Because costs and sales aredifficult to capture at this level, wholesale supply chain costs as a percent ofwholesale revenue should be used as a measure of wholesale support; however,this measure does not reflect the cost of the entire DoD supply chain.
Until the DoD logistics community implements activity-based costing (ABC), allo-cating supply chain management costs to the cost categories discussed is not likely.However, total costs and revenues can be collected (because they are elements forsetting cost recovery rates) at wholesale and retail levels.
INVENTORY TURNS
Inventory turns are computed by dividing the total sales (at last acquisition price)by the value of inventory (at last acquisition price), excluding war reserves. Onemajor goal of supply chain improvement projects is to optimize inventory levelsand thereby increase inventory turns. Inventory turns should be measured from the
4-8
customer’s perspective (Figure 4-1) using the standard price of materiel movingfrom the gray box to the customer and the value of inventory in the box. Whole-sale inventory turns can be used as a measure of wholesale efficiency; however,this metric does not measure the efficiency of the DoD supply chain.
Readiness and Sustainability Perspectives
We recommend DoD adopt the following SCOR performance measures to providereadiness and sustainability perspectives.
UPSIDE PRODUCTION FLEXIBILITY
The SCOR model defines upside production flexibility as the number of days toachieve an unplanned, sustainable 20 percent increase in production. We defineupside production flexibility to be the number of days to achieve a sustainableposture for executing the national military strategy of fighting two MTWs. Ideally,the metric is computed for each item managed and used for computing warreserve requirements.3
We believe that the most promising source for this metric is the DLA IntegratedConsumable Item Support (ICIS) model. ICIS receives peacetime and wartimedemand rates, peacetime ALTs and PLTs, peacetime asset balances, and industrialpreparedness planning factors. One metric that ICIS measures is the projected re-sponse time by item. The difference between the peacetime response time and thewartime response time can be used to approximate upside production flexibility.However, response time estimates are more relevant if industrial preparednessplanning has been performed and contract surge capabilities are used as inputs tothe model. If ICIS were expanded to include service-managed reparables asrequested by the Joint Chiefs of Staff, ICIS would be able to provide this metricfor all items.
Upside production flexibility metrics should have a drilldown, or filtering, capabil-ity for the following elements:
u Military service
u ICP
u Reparable and consumable items
u Weapon system
3 For example, if 60 days are needed to increase production to the two-MTW demand rate,
60 days of war reserves are needed to ensure an uninterrupted supply.

Enterprise Performance Measures
4-9
u Commodity
u Essentiality.
DOD PERFORMANCE MEASURES
We recommend that DoD use three additional measures not included in the SCORmodel. DoD needs a cost perspective to support a weapon system (rather than theorder focus of the SCOR model). As a result, we recommend that DoD measureweapon system logistics costs as a percent of the acquisition price. DoD also needsadditional metrics to measure its supply chain’s ability to support a two-MTWscenario. Therefore, DoD needs performance metrics in peacetime that measurewartime readiness and sustainability because the wartime demand is much higherthan the demand of peacetime operations.
Cost Perspective: Weapon System Logistics Costs as a Percent ofAcquisition Price
This metric is computed annually for selected weapon systems. It is useful to de-termine the benefits of logistics engineering changes and compare changes overtime. The total logistics costs by weapon system consist of the following:
u Total sales of secondary items (at standard price) for the weapon system
u Total depot overhaul and intermediate-level end item repair costs (bothmateriel and labor)
u Total organizational-level maintenance labor.
The acquisition price of the weapon system would be adjusted for inflation as wellas modifications and upgrades.
Readiness and Sustainability Perspective
We recommend that DoD use the following two additional readiness andsustainability performance measures.
WEAPON SYSTEM NMC RATES
FMC rates are equipment readiness metrics that the military services use forweapon systems. The inverse of an FMC rate is the NMC rate. An item of equip-ment can be NMC for two reasons: maintenance or supply.
NMC rates should be produced for key weapon systems and used with the otherenterprise performance measures that can be filtered by weapon system (e.g., per-fect order fulfillment rate and supply chain response time). The Army Readiness

4-10
Integrated Data Base, a classified system, contains NMC rates. The other militaryservices have similar reporting systems that can be used to obtain these rates.
WAR RESERVE RATIO
The DoD Materiel Management Regulation states that “the DoD componentsshall acquire and maintain, in peacetime, war materiel inventories sufficient to sus-tain operations, as prescribed in Defense Planning Guidance scenarios, for com-mitted forces.”4 The DoD Secondary Item Stratification Manual requires that themilitary services and DLA stratify war reserve requirements and assets into retailand wholesale protectable and unprotectable categories.5 The war reserve ratio isthe ratio of war reserve on-hand assets to the war reserve requirements. A drill-down capability should include the following elements:
u Protectable and unprotectable war reserves
u Military service
u ICP
u Reparable and consumable items
u Weapon system
u Commodity.
4 Department of Defense, DoD Materiel Management Regulation, DoD 4140.1-R, May
1998, p. 52. Only the Army currently computes a war reserve requirement.5 Department of Defense, DoD Secondary Item Stratification Manual, DoD 4140.1-M,
June 1995.

Enterprise Performance Measures
4-11
IMPLEMENTATION
Table 4-2 lists the recommended performance measures and our assessment oftheir degree of implementation difficulty.
Table 4-2. Recommended Enterprise Performance Measures
Perspective
Recommended keysupply chain
management metricsCustomer
satisfaction Cost
Readinessand
sustainabilityImplementation
degree of difficulty
Perfect order fulfillment X For wholesale, low for date andquantity, and moderate forquality and documentationHigh for retail
Supply chain response time X Low for wholesale for sourceand order fulfillment lead-timesHigh for retail
Percent change in customerprice compared to inflation
X X Moderate (military services andDLA need to select items forthe market basket and conducta review each year; DefenseLogistics Information Service[DLIS] should to be able toproduce the index easily)
Supply chain managementcosts as a percent of sales(at standard price)
X Low for wholesaleHigh for retail
Weapon system logistics costsas a percent of the acquisitionprice
X Moderate (cost data for all lev-els except the organizationallevel should be available fromthe Visibility and Managementof Operating and Support CostsSystem of each military serv-ice)
Inventory turns X Low for wholesaleHigh for retail
Upside production flexibility X High
Weapon system NMC rates X Low
War reserve ratio X Low
SUMMARY
Based on our review of commercial and DoD supply chain performance measures,we recommend that the measures presented in this chapter be adopted at theenterprise level.

4-12

5-1
Chapter 5 Functional Performance Measures for Materiel andDistribution Management
INTRODUCTION
This chapter presents the supply chain functional performance measures that werecommend as diagnostic to the enterprise metrics. We define the supply chainfunctions to be synonymous with the SCOR model level 1 processes of plan,source, make (changed to maintain for our application), and deliver. Appendix Econtains a definition of each performance measure.
PLAN
Plan, one of the four critical functions for managing the supply chain, is the act ofbalancing supply and demand (i.e., setting the budget and obligation authority toprocure assets to meet anticipated requirements). Processes of the plan functioninclude demand forecasting, aggregating and prioritizing requirements, and pre-paring budgets. In DoD, the processes generally are under the auspices of itemmanagers (the act of procuring items is part of the source function). The planfunction is the beginning of the logistics chain and affects all subsequent activi-ties; therefore, monitoring this function closely is critical for the logistics chain’sproper performance.
Functional Metrics
Table 5-1 contains a comprehensive list of plan functional metrics that can meas-ure the effect of planning on the DoD logistics chain.
The deficit ratio measures the degree of imbalance between assets and require-ments. The supply chain planning cost aggregates labor, overhead, systems, andother costs associated with assets and requirements. The inventory holding costmeasures the cost of holding inventory. The Defense Working Capital Fund(DWCF) net operating result measures the difference between the fund’s incomeand expenses and is the complement to the deficit ratio. When assets exceed re-quirements, the overage measures the excess. The percent of national stock num-bers (NSNs) with two-MTW planning factors measures the thoroughness ofDoD’s planning for a worst-case contingency. The percent of NSNs with war re-serve requirements defined is similar to the previous metric, but examines the warreserve aspect of readiness. The ratio of on-hand to funded war reserves and the

5-2
ratio of funded war reserves to war reserve requirements measure DoD’s warreserve readiness.
Table 5-1. Plan Functional Metrics
MetricCustomer
satisfaction Cost
Readinessand
sustainability
Deficit ratio X X
Supply chain planning cost X
Inventory holding cost X
Defense Working Capital Fund net operating result X
Overage X
Percent of national stock numbers with two-MTWplanning factors X
Percent of national stock numbers with warreserve requirements defined X
Ratio of on-hand to funded war reserves X
Ratio of funded war reserves to war reserverequirements X
Enterprise Relationship
Each enterprise metric requires a set of functional metrics to provide an adequatediagnostic drilldown capability (i.e., when a problem surfaces at the enterpriselevel, the functional metric isolates the source of the problem). Figure 5-1 depictsthe relationship between plan enterprise and functional metrics.
Figure 5-1. Functional Metrics for Plan
Deficit ratio
Perfect order fulfillment
Supply chain response time
Customersatisfaction
Percent change in customer price
compared to inflation
DWCFnet operating result
Supply chain planning cost
Inventory holding cost
Supply chain managementcosts as a
percent of sales
Weapon system logisticscosts as a percent
of the acquisition cost
Overage
Inventoryturns
Cost
Weapon system not mission-
capable rates
Percent of NSNs with two-MTWplanning factors
Upside production flexibility
Percent of NSNs with warreserve requirements
defined
Ratio of on-hand reservesto funded war reserves
Ratio of funded warreserves to war reserve
requirements
War reserve ratio
Readiness andsustainability
DoD supply chainPLAN
performance measures

Functional Performance Measures for Materiel and Distribution Management
5-3
The plan function plays a role in most enterprise metrics. For each enterprise met-ric, the contribution of the plan function is described, and a metric for measuringthe contribution is presented.
u Perfect order fulfillment. When items are not available because of poorplanning, the perfect order fulfillment percent declines. The deficit ratio isused to assess if the supply pipeline has enough assets. This metric de-scribes the shortfall in assets.
u Supply chain management costs as a percent of sales. The plan metricsthat relate to this enterprise metric are the supply chain planning cost,which captures the resources (e.g., labor) associated with planning; in-ventory holding cost, which captures the cost of holding materiel on-hand;and DWCF net operating result, which captures the financial impact offorecasting or asset matching and also measures the fund’s ability to con-trol expenses and establish prices.
u Weapon system logistics costs as a percent of the acquisition cost. Thecosts use the same diagnostic metrics as the supply chain managementcosts; however, they are divided among weapon systems.
u Inventory turns. The overage provides diagnostics into this enterprise met-ric. The functional metric examines the assets in the supply chain pipelinethat do not support requirements in the budget cycle.
u Weapon system NMC rates. Mission-capable rates are influenced by thesame conditions as perfect order fulfillment (i.e., when the supply pipelinedoes not have enough assets, this metric shows a decline). The plan con-tribution is as previously described.
u War reserve ratio. The percent of NSNs with war reserve requirementsidentified is a measurement of the thoroughness of war reserve planning.The ratios of on-hand to funded war reserve and funded to war reserve re-quirement delineate the impact of funding limitations on the war reserveposition.
u Upside production flexibility. The plan function has the primary responsi-bility for computing wartime mobilization requirements. The source func-tion is responsible for obtaining the suppliers needed to support wartimemobilization. The percent of NSNs with two-MRC planning factors meas-ures the thoroughness of DoD planning for the worst-case contingency.
SOURCE
Source, as defined in the SCOR model, includes all activities involved with mate-riel acquisition and the source infrastructure. Materiel acquisition includes ob-taining, receiving, inspecting, holding, and issuing materiel (to its initial storage

5-4
location). Managing the source infrastructure includes vendor certification andfeedback, contracting, source quality, in-bound freight, component engineering,and initiation of vendor payments. In this framework, vendors include traditionalsuppliers (the source for purchasing new items) as well as maintenance depots(the source for obtaining repaired materiel).
Functional Metrics
We examined metrics, including those at the functional level, within the balancedframework of customer satisfaction, cost, and readiness and flexibility. We rec-ommend the metrics for source in Table 5-2.
Table 5-2. Functional Metrics for Source
Functional measureCustomer
satisfaction Cost
Readinessand
sustainability
Percent of perfect order fulfillment(from suppliers)
X
Percent of change in materiel price ascompared to inflation a
X
Materiel acquisition costs as a percent of sales atstandard price
X
Total source cycle time X
Surge volume as a percent of total surge volume X
Upside production flexibility–—source b Xa Materiel price is represented by a market basket of technology, similar to the basket of goods used in the
CPI. The market basket of technology reflects the DoD practice of replacing many secondary items (e.g., radarsystems) with recent technological versions rather than the originalversions.
b Upside production flexibility should be measured for the existing network of suppliers and the process ofadding new suppliers. This measure indicates how quickly more materiel can be obtained from the existingsupplier network and how quickly new suppliers can be added and provide materiel.
The metrics represent a balanced view of how effectively the source function isbeing managed in concert with DoD strategies. The overall source performancedepends on managing suppliers and materiel prices, performing the managementat an acceptable cost, and achieving DoD readiness requirements.
Perfect order fulfillment (from suppliers), change in materiel price as compared toinflation, and total source cycle time measure how well the source function ismanaging the supplier base and the price of materiel. Materiel acquisition costs asa percent of sales at standard price measures how effectively source performs.Surge volume as a percent of total surge volume and upside production flexibil-ity—source measure how well source is meeting DoD readiness requirements.

Functional Performance Measures for Materiel and Distribution Management
5-5
Enterprise Relationship
As stated in Chapter 3, the metrics in the architecture are linked. Functional met-rics are linked to enterprise metrics and measure the performance of the function.The link for the source functional metrics is depicted in Figure 5-2.
Figure 5-2. Source Functional Metrics
Perfect order fulfilllment(from suppliers)
Perfect order fulfillment
Total source cycle time
Supply chain response time
Customersatisfaction
Percent change in materielprice/inflation
Percent change in customer price
compared to inflation
Materiel acquisition costsas a percent of sales
Supply chain managementcosts as a
percent of sales
Weapon system logisticscosts as a percent
of the acquisition price
Inventoryturns
Cost
Perfect order fulfillment(from suppliers)
Weapon system not mission-
capable rates
Upside production flexibility--source
Surge volume identified as a percentof total surge volume
Upside production flexibility
War reserve ratio
Readiness andsustainability
DoD supply chainSOURCE
performance measures
For each enterprise metric, the contribution of the source function is described,and a metric for measuring the contribution is presented.
u Perfect order fulfillment. Difficulty with perfect order fulfillment (fromsuppliers) affects perfect order fulfillment to customers.
u Supply chain response time. The total source cycle time is a part of theformula for supply chain response time.
u Percent change in customer price compared to inflation. The percentchange in materiel price is part of the formula for percent change incustomer price.
u Supply chain management costs as a percent of sales. Materiel acquisitioncosts as a percent of sales at standard price represent (at standard price)the source portion of the supply chain management costs.
u Weapon system NMC rates. Difficulty with perfect order fulfillment (fromsuppliers) may manifest in weapon systems that are not mission-capablebecause materiel is not available.
u Upside production flexibility. Upside production flexibility—source repre-sents source’s contribution to the overall enterprise measurement. Plan,maintain, and deliver contribute the other portions. Surge volume identi-fied as a percent of total surge volume captures the degree that source

5-6
managers have identified and contracted with sources of supply to meetsurge requirements. This metric is very important if surge requirements foran item are to be met by several suppliers with capacity restrictions.
MAINTAIN
For this report, we redefine the SCOR’s make function to maintain. Maintain en-compasses all processes to transform unserviceable assets to a finished state formeeting planned or actual demands. The activities include scheduling repair, is-suing unserviceable carcasses and repair parts, repairing and testing, and stagingand releasing repaired items to the deliver function.
Functional Metrics
For this report, we limited our analysis of the maintenance function to only func-tional and process measures that directly affect the supply chain’s ability to fulfillcustomer demands. We excluded metrics related to the cost of repair operations.1
We recommend the maintain functional metrics in Table 5-3.
Table 5-3. Functional Metrics for Maintain
Functional measureCustomer
satisfaction CostReadiness andsustainability
Upside production flexibility—maintain X
Performance to customer-requestdate—maintain a
X
Repair cycle time Xa This metric can be incorporated eventually into performance to customer-request date—
source because repair is another source for serviceable assets.
Upside production flexibility for maintenance is an important metric. Duringwartime, the depot maintenance activities expect significant increases in repairworkload. Careful planning in peacetime is necessary to ensure that the depotscan respond to the surge requirement.
Two key metrics that impact supply’s ability to fill customer orders for reparableitems are performance to customer-request date and repair cycle time. Thecustomers are the ICPs and retail supply activities that order repaired items fromthe maintenace depots and intermediate maintenance activities.
1 For wholesale supply operations, the cost of repair (labor, materiel, and overhead) is re-
flected in the materiel price that customers pay for a serviceable asset (assuming a carcass is re-turned). The cost is included in the “cost of goods sold” metric. The surcharge added to this costis synonymous to the SCOR supply chain cost metric. Although maintenance activities below thedepot level are not funded in the DWCF, the same relationships should apply for capturing costs.
Functional Performance Measures for Materiel and Distribution Management
5-7
Enterprise Relationship
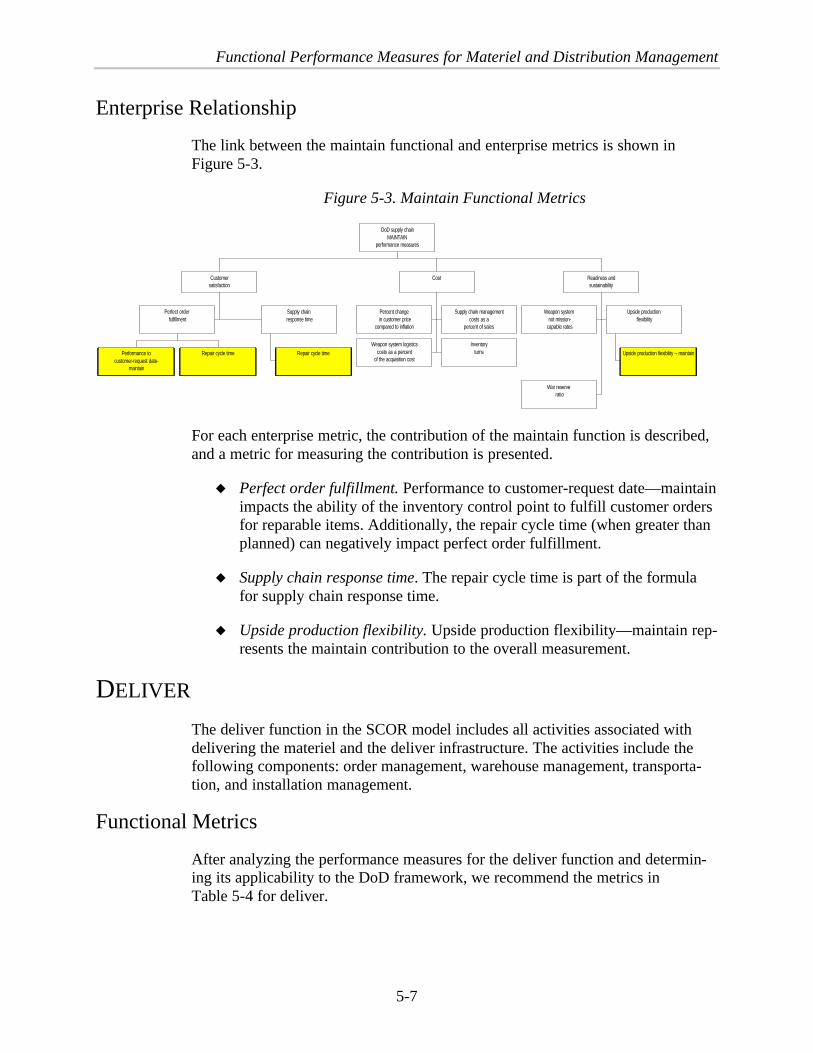
The link between the maintain functional and enterprise metrics is shown inFigure 5-3.
Figure 5-3. Maintain Functional Metrics
Performance tocustomer-request date-
maintain
Repair cycle time
Perfect order fulfillment
Repair cycle time
Supply chain response time
Customersatisfaction
Percent change in customer price
compared to inflation
Supply chain managementcosts as a
percent of sales
Weapon system logisticscosts as a percent
of the acquisition cost
Inventoryturns
Cost
Weapon system not mission-
capable rates
Upside production flexibility -- maintain
Upside production flexibility
War reserve ratio
Readiness andsustainability
DoD supply chainMAINTAIN
performance measures
For each enterprise metric, the contribution of the maintain function is described,and a metric for measuring the contribution is presented.
u Perfect order fulfillment. Performance to customer-request date—maintainimpacts the ability of the inventory control point to fulfill customer ordersfor reparable items. Additionally, the repair cycle time (when greater thanplanned) can negatively impact perfect order fulfillment.
u Supply chain response time. The repair cycle time is part of the formulafor supply chain response time.
u Upside production flexibility. Upside production flexibility—maintain rep-resents the maintain contribution to the overall measurement.
DELIVER
The deliver function in the SCOR model includes all activities associated withdelivering the materiel and the deliver infrastructure. The activities include thefollowing components: order management, warehouse management, transporta-tion, and installation management.
Functional Metrics
After analyzing the performance measures for the deliver function and determin-ing its applicability to the DoD framework, we recommend the metrics inTable 5-4 for deliver.
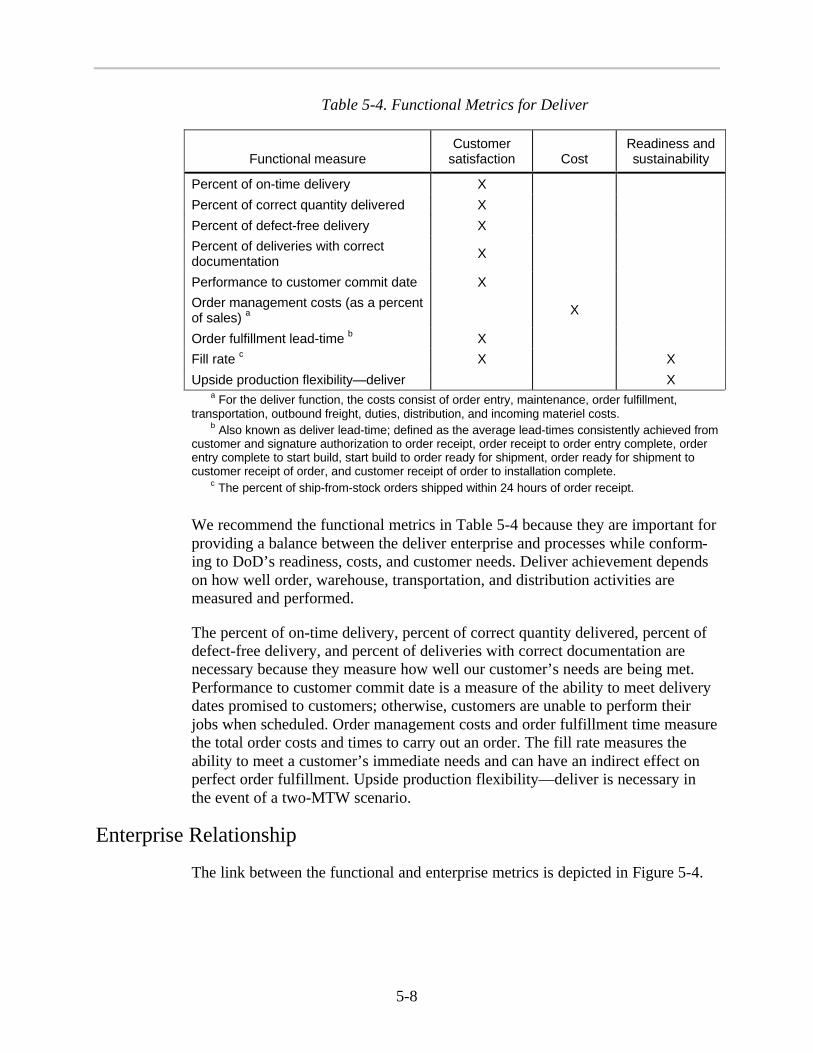
5-8
Table 5-4. Functional Metrics for Deliver
Functional measureCustomer
satisfaction CostReadiness andsustainability
Percent of on-time delivery X
Percent of correct quantity delivered X
Percent of defect-free delivery X
Percent of deliveries with correctdocumentation
X
Performance to customer commit date X
Order management costs (as a percentof sales) a
X
Order fulfillment lead-time b X
Fill rate c X X
Upside production flexibility—deliver Xa For the deliver function, the costs consist of order entry, maintenance, order fulfillment,
transportation, outbound freight, duties, distribution, and incoming materiel costs.b Also known as deliver lead-time; defined as the average lead-times consistently achieved from
customer and signature authorization to order receipt, order receipt to order entry complete, orderentry complete to start build, start build to order ready for shipment, order ready for shipment tocustomer receipt of order, and customer receipt of order to installation complete.
c The percent of ship-from-stock orders shipped within 24 hours of order receipt.
We recommend the functional metrics in Table 5-4 because they are important forproviding a balance between the deliver enterprise and processes while conform-ing to DoD’s readiness, costs, and customer needs. Deliver achievement dependson how well order, warehouse, transportation, and distribution activities aremeasured and performed.
The percent of on-time delivery, percent of correct quantity delivered, percent ofdefect-free delivery, and percent of deliveries with correct documentation arenecessary because they measure how well our customer’s needs are being met.Performance to customer commit date is a measure of the ability to meet deliverydates promised to customers; otherwise, customers are unable to perform theirjobs when scheduled. Order management costs and order fulfillment time measurethe total order costs and times to carry out an order. The fill rate measures theability to meet a customer’s immediate needs and can have an indirect effect onperfect order fulfillment. Upside production flexibility—deliver is necessary inthe event of a two-MTW scenario.
Enterprise Relationship
The link between the functional and enterprise metrics is depicted in Figure 5-4.

Functional Performance Measures for Materiel and Distribution Management
5-9
Figure 5-4. Deliver Functional Metrics
For each enterprise metric, the contribution of the deliver function is described,and a metric for measuring the contribution is presented.
u Perfect order fulfillment. This metric is composed of four key functionalmetrics: percent of on-time delivery, percent of correct quantity delivered,percent of defect-free delivery, and percent of deliveries with correctdocumentation. The four components reflect the ability to provide excel-lent customer service. The fill rate at the functional level indirectly links tothe enterprise metric. If DoD cannot fill its customer’s needs in the allot-ted time, a perfect order does not exist.
u Supply chain response time. Order fulfillment lead-time (deliver lead-time) is the deliver portion of the total supply chain response time. Per-formance to customer commit date is also diagnostic to supply chainresponse time.
u Supply chain management costs as a percent of sales (at standard price).Order management costs are expressed as a percent of sales and representthe deliver cost portion of the supply chain.
u Weapon system NMC rates. If perfect order fulfillment and fill rate are notachieved, NMC rates are affected negatively.
u Upside production flexibility. Upside production flexibility—deliver rep-resents the deliver portion of upside production flexibility—measurement.
SUMMARY
The functional performance measures presented in this chapter can diagnose theenterprise measures. Appendix D describes several process metrics to diagnosethe functional metrics.
Percent on-time deliver
Percent correct quantity delivered
Percent defect-free delivery
Percent deliveries with correctdocumentation
Fill rate
Perfect order fulfillment
Order fulfillment lead-time
Performance to commit date
Supply chain response time
Customersatisfaction
Percent change in customer price
compared to inflation
Order management costsas a percent of sales
Supply chain managementcosts as a
percent of sales
Weapon system logisticscosts as a percent
of the acquisition cost
Inventoryturns
Cost
Fill rate
Weapon system not mission-
capable rates
Upside production flexibility--deliver
Upside production flexibility
War reserve ratio
Readiness andsustainability
DoD supply chainDELIVER
performance measures

5-10

A-1
Appendix A SCOR Model
A process model frequently is used to describe a supply chain to make it under-standable. The Supply Chain Council created the SCOR model to allowcompanies to
u communicate using common terminology and standard descriptions;
u leverage metrics and benchmarking to determine performance goals,set priorities, and quantify the benefits of process changes;
u understand the practices yielding the best performance;
u understand the supply chain management process and evaluate overallperformance; and
u identify the best software tools for their process requirements.
Figure A-1 depicts the SCOR model supply chain thread. Each link in the supplychain is made up of a SCOR level 1 process (plan, source, make, or deliver).
Figure A-1. SCOR Model Supply Chain Thread
Supplier
Plan
Customer Customer’scustomer
Suppliers’supplier
Make DeliverSource Make DeliverMakeSourceDeliver SourceDeliver
Internal or external Internal or external
Company
Source
Level 2 processes, the next level of the SCOR model, comprises the elements ofthe level 1 processes (Table A-1).
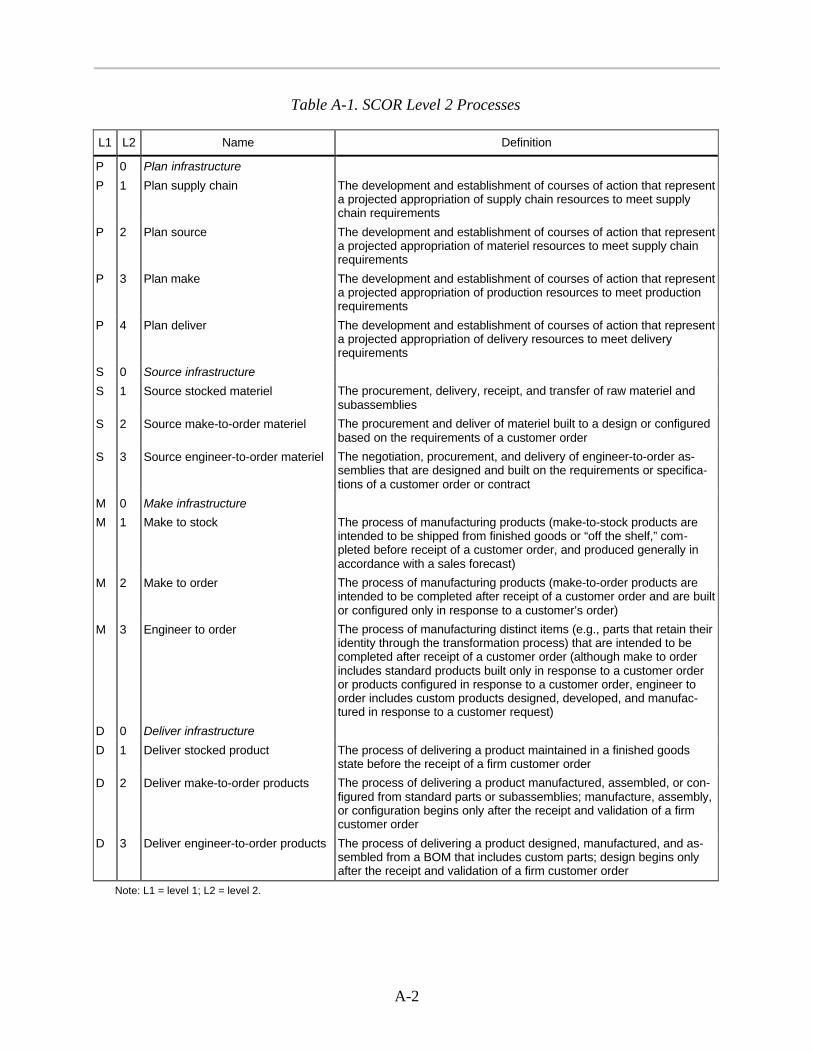
A-2
Table A-1. SCOR Level 2 Processes
L1 L2 Name Definition
P 0 Plan infrastructure
P 1 Plan supply chain The development and establishment of courses of action that representa projected appropriation of supply chain resources to meet supplychain requirements
P 2 Plan source The development and establishment of courses of action that representa projected appropriation of materiel resources to meet supply chainrequirements
P 3 Plan make The development and establishment of courses of action that representa projected appropriation of production resources to meet productionrequirements
P 4 Plan deliver The development and establishment of courses of action that representa projected appropriation of delivery resources to meet deliveryrequirements
S 0 Source infrastructure
S 1 Source stocked materiel The procurement, delivery, receipt, and transfer of raw materiel andsubassemblies
S 2 Source make-to-order materiel The procurement and deliver of materiel built to a design or configuredbased on the requirements of a customer order
S 3 Source engineer-to-order materiel The negotiation, procurement, and delivery of engineer-to-order as-semblies that are designed and built on the requirements or specifica-tions of a customer order or contract
M 0 Make infrastructure
M 1 Make to stock The process of manufacturing products (make-to-stock products areintended to be shipped from finished goods or “off the shelf,” com-pleted before receipt of a customer order, and produced generally inaccordance with a sales forecast)
M 2 Make to order The process of manufacturing products (make-to-order products areintended to be completed after receipt of a customer order and are builtor configured only in response to a customer’s order)
M 3 Engineer to order The process of manufacturing distinct items (e.g., parts that retain theiridentity through the transformation process) that are intended to becompleted after receipt of a customer order (although make to orderincludes standard products built only in response to a customer orderor products configured in response to a customer order, engineer toorder includes custom products designed, developed, and manufac-tured in response to a customer request)
D 0 Deliver infrastructure
D 1 Deliver stocked product The process of delivering a product maintained in a finished goodsstate before the receipt of a firm customer order
D 2 Deliver make-to-order products The process of delivering a product manufactured, assembled, or con-figured from standard parts or subassemblies; manufacture, assembly,or configuration begins only after the receipt and validation of a firmcustomer order
D 3 Deliver engineer-to-order products The process of delivering a product designed, manufactured, and as-sembled from a BOM that includes custom parts; design begins onlyafter the receipt and validation of a firm customer order
Note: L1 = level 1; L2 = level 2.

SCOR Model
A-3
The SCOR level 2 processes are used to display supply chain threads, such as themap example in Figure A-2.
Figure A-2. SCOR Process Map
D3
ACMETaiwan
Semiconductordistributor
S1
P2
P1
P4P3
M1 D1
CustomerCompany
Company’slaptop
production
Company’slaptop
production
Company’slaptop
distribution
P4
Semiconductormanufacturer
Customer’scustomer
Laptopdistributor
Laptopretailer
S1
P2
D1S1 D1
P1
P2
SupplierSupplier’ssupplier
D2S1D2
Level 3 of SCOR divides the level 2 processes into subprocesses. Figure A-3 is anexample of a SCOR level 3 process.
Figure A-3. SCOR Level 3 Subprocesses for Deliver Stocked Product
D1.6 D1.5 D1.3 D1.2 D1.1
D1.8 D1.9 D1.10 D1.11 D1.12 D1.13
D1.4D1.7
Selectcarriersand rate
shipments
Processinquiry
and quote
Receive,enter, andvalidate
order
Reserveinventory and
determinedelivery date
Routeshipments
Plan andbuild loads
Consolidateorders
Receiveproduct
Pickproduct
Loadvehicle,
generatedocuments,
and ship
Receiveand verifyproduct atcustomer
site
Installproduct
Invoiceand
receivepayment
Frommake orsource
Table A-2 identifies the SCOR level 3 processes.
Table A-2. SCOR Level 3 Processes
L1 L2 L3 Name Definition
P 1 1 Identify, prioritize, and aggregatesupply chain requirements
The process of identifying, prioritizing, and considering allsources of demand, as a whole with constituent parts, in thesupply chain of a product or service
P 1 2 Identify, assess, and aggregate supplychain resources
The process of identifying, prioritizing, and considering allsources of demand, as a whole with constituent parts, in thesupply chain of a product or service
P 1 3 Balance supply chain resources withsupply chain requirements
The process of developing a time-phased course of action thatcommits supply chain resources to meet supply chainrequirements
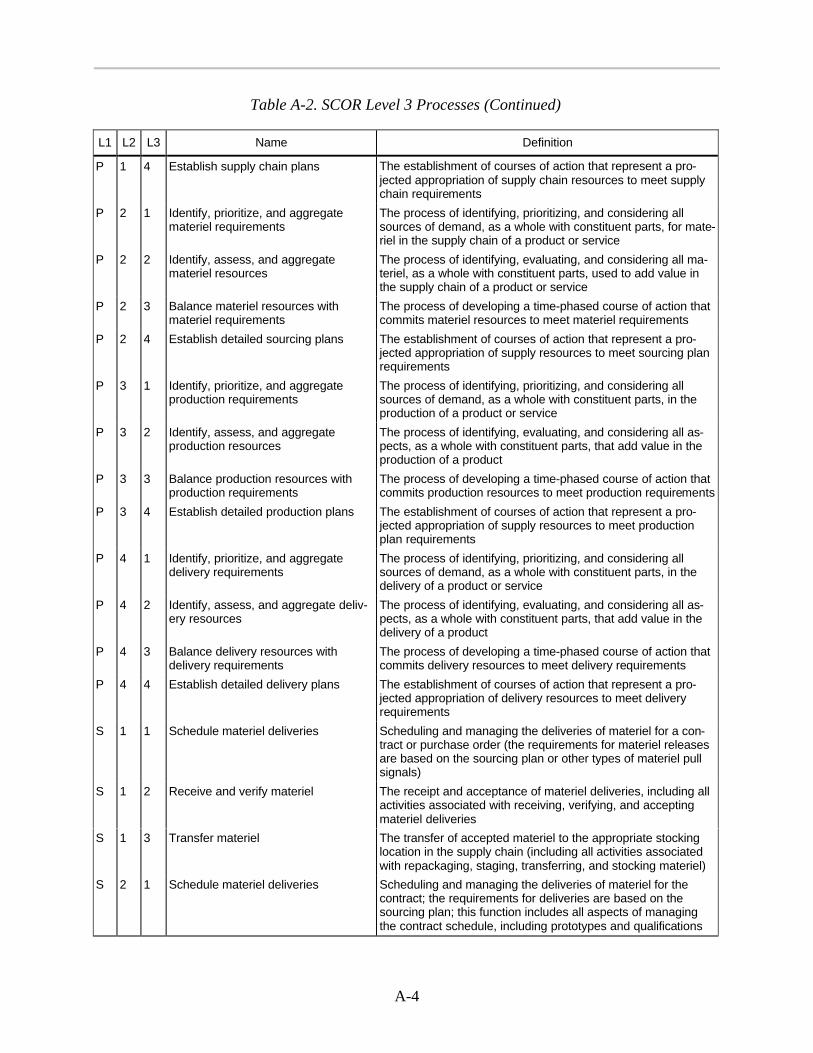
A-4
Table A-2. SCOR Level 3 Processes (Continued)
L1 L2 L3 Name Definition
P 1 4 Establish supply chain plans The establishment of courses of action that represent a pro-jected appropriation of supply chain resources to meet supplychain requirements
P 2 1 Identify, prioritize, and aggregatemateriel requirements
The process of identifying, prioritizing, and considering allsources of demand, as a whole with constituent parts, for mate-riel in the supply chain of a product or service
P 2 2 Identify, assess, and aggregatemateriel resources
The process of identifying, evaluating, and considering all ma-teriel, as a whole with constituent parts, used to add value inthe supply chain of a product or service
P 2 3 Balance materiel resources withmateriel requirements
The process of developing a time-phased course of action thatcommits materiel resources to meet materiel requirements
P 2 4 Establish detailed sourcing plans The establishment of courses of action that represent a pro-jected appropriation of supply resources to meet sourcing planrequirements
P 3 1 Identify, prioritize, and aggregateproduction requirements
The process of identifying, prioritizing, and considering allsources of demand, as a whole with constituent parts, in theproduction of a product or service
P 3 2 Identify, assess, and aggregateproduction resources
The process of identifying, evaluating, and considering all as-pects, as a whole with constituent parts, that add value in theproduction of a product
P 3 3 Balance production resources withproduction requirements
The process of developing a time-phased course of action thatcommits production resources to meet production requirements
P 3 4 Establish detailed production plans The establishment of courses of action that represent a pro-jected appropriation of supply resources to meet productionplan requirements
P 4 1 Identify, prioritize, and aggregatedelivery requirements
The process of identifying, prioritizing, and considering allsources of demand, as a whole with constituent parts, in thedelivery of a product or service
P 4 2 Identify, assess, and aggregate deliv-ery resources
The process of identifying, evaluating, and considering all as-pects, as a whole with constituent parts, that add value in thedelivery of a product
P 4 3 Balance delivery resources withdelivery requirements
The process of developing a time-phased course of action thatcommits delivery resources to meet delivery requirements
P 4 4 Establish detailed delivery plans The establishment of courses of action that represent a pro-jected appropriation of delivery resources to meet deliveryrequirements
S 1 1 Schedule materiel deliveries Scheduling and managing the deliveries of materiel for a con-tract or purchase order (the requirements for materiel releasesare based on the sourcing plan or other types of materiel pullsignals)
S 1 2 Receive and verify materiel The receipt and acceptance of materiel deliveries, including allactivities associated with receiving, verifying, and acceptingmateriel deliveries
S 1 3 Transfer materiel The transfer of accepted materiel to the appropriate stockinglocation in the supply chain (including all activities associatedwith repackaging, staging, transferring, and stocking materiel)
S 2 1 Schedule materiel deliveries Scheduling and managing the deliveries of materiel for thecontract; the requirements for deliveries are based on thesourcing plan; this function includes all aspects of managingthe contract schedule, including prototypes and qualifications
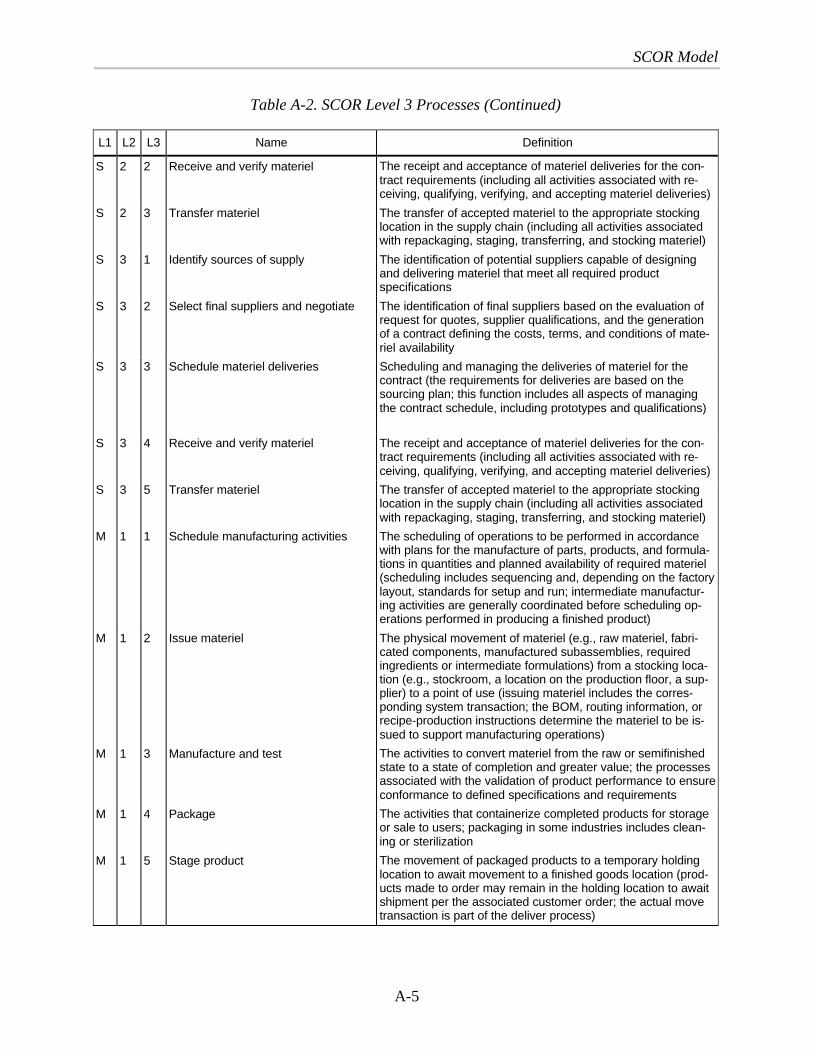
SCOR Model
A-5
Table A-2. SCOR Level 3 Processes (Continued)
L1 L2 L3 Name Definition
S 2 2 Receive and verify materiel The receipt and acceptance of materiel deliveries for the con-tract requirements (including all activities associated with re-ceiving, qualifying, verifying, and accepting materiel deliveries)
S 2 3 Transfer materiel The transfer of accepted materiel to the appropriate stockinglocation in the supply chain (including all activities associatedwith repackaging, staging, transferring, and stocking materiel)
S 3 1 Identify sources of supply The identification of potential suppliers capable of designingand delivering materiel that meet all required productspecifications
S 3 2 Select final suppliers and negotiate The identification of final suppliers based on the evaluation ofrequest for quotes, supplier qualifications, and the generationof a contract defining the costs, terms, and conditions of mate-riel availability
S 3 3 Schedule materiel deliveries Scheduling and managing the deliveries of materiel for thecontract (the requirements for deliveries are based on thesourcing plan; this function includes all aspects of managingthe contract schedule, including prototypes and qualifications)
S 3 4 Receive and verify materiel The receipt and acceptance of materiel deliveries for the con-tract requirements (including all activities associated with re-ceiving, qualifying, verifying, and accepting materiel deliveries)
S 3 5 Transfer materiel The transfer of accepted materiel to the appropriate stockinglocation in the supply chain (including all activities associatedwith repackaging, staging, transferring, and stocking materiel)
M 1 1 Schedule manufacturing activities The scheduling of operations to be performed in accordancewith plans for the manufacture of parts, products, and formula-tions in quantities and planned availability of required materiel(scheduling includes sequencing and, depending on the factorylayout, standards for setup and run; intermediate manufactur-ing activities are generally coordinated before scheduling op-erations performed in producing a finished product)
M 1 2 Issue materiel The physical movement of materiel (e.g., raw materiel, fabri-cated components, manufactured subassemblies, requiredingredients or intermediate formulations) from a stocking loca-tion (e.g., stockroom, a location on the production floor, a sup-plier) to a point of use (issuing materiel includes the corres-ponding system transaction; the BOM, routing information, orrecipe-production instructions determine the materiel to be is-sued to support manufacturing operations)
M 1 3 Manufacture and test The activities to convert materiel from the raw or semifinishedstate to a state of completion and greater value; the processesassociated with the validation of product performance to ensureconformance to defined specifications and requirements
M 1 4 Package The activities that containerize completed products for storageor sale to users; packaging in some industries includes clean-ing or sterilization
M 1 5 Stage product The movement of packaged products to a temporary holdinglocation to await movement to a finished goods location (prod-ucts made to order may remain in the holding location to awaitshipment per the associated customer order; the actual movetransaction is part of the deliver process)
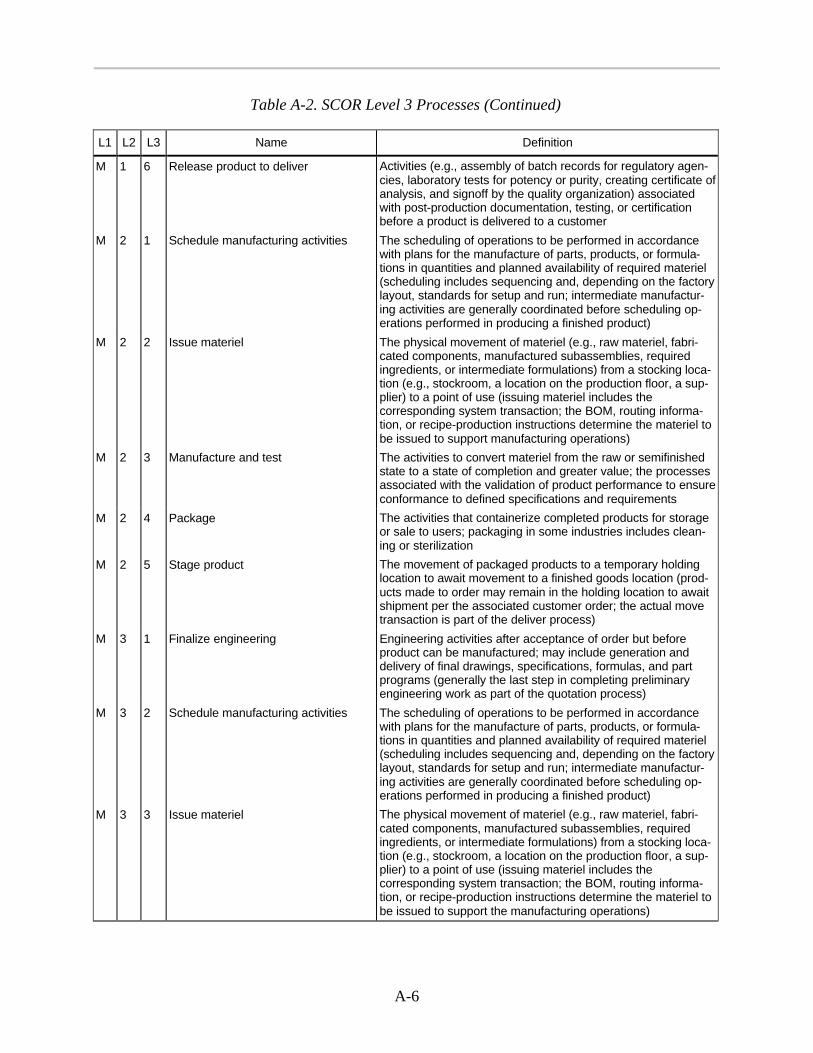
A-6
Table A-2. SCOR Level 3 Processes (Continued)
L1 L2 L3 Name Definition
M 1 6 Release product to deliver Activities (e.g., assembly of batch records for regulatory agen-cies, laboratory tests for potency or purity, creating certificate ofanalysis, and signoff by the quality organization) associatedwith post-production documentation, testing, or certificationbefore a product is delivered to a customer
M 2 1 Schedule manufacturing activities The scheduling of operations to be performed in accordancewith plans for the manufacture of parts, products, or formula-tions in quantities and planned availability of required materiel(scheduling includes sequencing and, depending on the factorylayout, standards for setup and run; intermediate manufactur-ing activities are generally coordinated before scheduling op-erations performed in producing a finished product)
M 2 2 Issue materiel The physical movement of materiel (e.g., raw materiel, fabri-cated components, manufactured subassemblies, requiredingredients, or intermediate formulations) from a stocking loca-tion (e.g., stockroom, a location on the production floor, a sup-plier) to a point of use (issuing materiel includes thecorresponding system transaction; the BOM, routing informa-tion, or recipe-production instructions determine the materiel tobe issued to support manufacturing operations)
M 2 3 Manufacture and test The activities to convert materiel from the raw or semifinishedstate to a state of completion and greater value; the processesassociated with the validation of product performance to ensureconformance to defined specifications and requirements
M 2 4 Package The activities that containerize completed products for storageor sale to users; packaging in some industries includes clean-ing or sterilization
M 2 5 Stage product The movement of packaged products to a temporary holdinglocation to await movement to a finished goods location (prod-ucts made to order may remain in the holding location to awaitshipment per the associated customer order; the actual movetransaction is part of the deliver process)
M 3 1 Finalize engineering Engineering activities after acceptance of order but beforeproduct can be manufactured; may include generation anddelivery of final drawings, specifications, formulas, and partprograms (generally the last step in completing preliminaryengineering work as part of the quotation process)
M 3 2 Schedule manufacturing activities The scheduling of operations to be performed in accordancewith plans for the manufacture of parts, products, or formula-tions in quantities and planned availability of required materiel(scheduling includes sequencing and, depending on the factorylayout, standards for setup and run; intermediate manufactur-ing activities are generally coordinated before scheduling op-erations performed in producing a finished product)
M 3 3 Issue materiel The physical movement of materiel (e.g., raw materiel, fabri-cated components, manufactured subassemblies, requiredingredients, or intermediate formulations) from a stocking loca-tion (e.g., stockroom, a location on the production floor, a sup-plier) to a point of use (issuing materiel includes thecorresponding system transaction; the BOM, routing informa-tion, or recipe-production instructions determine the materiel tobe issued to support the manufacturing operations)

SCOR Model
A-7
Table A-2. SCOR Level 3 Processes (Continued)
L1 L2 L3 Name Definition
M 3 4 Manufacture and test The activities to convert materiel from the raw or semifinishedstate to a state of completion and greater value; the processesassociated with the validation of product performance to ensureconformance to defined specifications and requirements
M 3 5 Stage product The activities that containerize completed products for storageor sale to users; packaging in some industries includes clean-ing or sterilization
M 3 6 Release product to deliver The movement of packaged products to a temporary holdinglocation to await movement to a finished goods location (prod-ucts made to order may remain in the holding location to awaitshipment per the associated customer order; the actual movetransaction is part of the deliver process)
D 1 1 Process inquiry and quote The actions to receive and respond to customer inquiries andrequests for quotes
D 1 2 Receive, enter, and validate order The actions to receive orders from a customer and enter themin a company’s order processing system (orders can be re-ceived through phone, fax, or electronic media); examine or-ders “technically” to ensure an orderable configuration andprovide accurate price, and check the customer’s credit
D 1 3 Reserve inventory and determinedelivery date
The actions to identify and reserve inventory (on-hand andscheduled) for orders and schedule a delivery date
D 1 4 Consolidate orders The process of analyzing orders to determine the groupingsthat result in least cost and best service fulfillment andtransportation
D 1 5 Plan and build loads The actions to select transportation modes and build efficientloads
D 1 6 Route shipments The actions to consolidate and route loads by mode, lane, andlocation
D 1 7 Select carriers and rate shipments The actions to select carriers by lowest cost per route and rateand tender shipments
D 1 8 Receive product The activities (e.g., receiving product, verifying, recordingproduct receipt, determining put-away location, putting away,and recording location) that a company performs at its ware-houses and that sometimes include quality inspection
D 1 9 Pick product The activities (including retrieving orders to pick, determininginventory availability, building the pick wave, picking the prod-uct, recording the pick, and delivering product to shipping) inresponse to an order
D 1 10 Load vehicle, generate shippingdocuments, and ship
The tasks of placing product on vehicles; generating the docu-mentation to meet internal, customer, carrier, and governmentneeds; and sending the product to the customer
D 1 11 Receive and verify product at cus-tomer’s site
The process of receiving the shipment at the customer’s siteand verifying that the shipped order is complete and theproduct meets quality requirements
D 1 12 Install product The process of preparing and installing the product at the cus-tomer’s site (the product is fully functional after completion)
D 1 13 Invoice and receive payment The actions to send a signal to the financial organization thatthe order has been shipped and that the billing process shouldbegin (payment is received from the customer within the pay-ment terms of the invoice)

A-8
Table A-2. SCOR Level 3 Processes (Continued)
L1 L2 L3 Name Definition
D 2 1 Process inquiry and quote The actions to receive and respond to customer inquiries andrequests for quotes
D 2 2 Receive, configure, enter, and validateorder
The actions to receive orders from a customer and enter themin a company’s order processing system (orders can be re-ceived through phone, fax, or electronic media), configureproduct to the customer’s needs based on standard availableparts or options, examine order to ensure an orderable configu-ration and provide accurate price, and check the customer’scredit
D 2 3 Reserve resources and determinedelivery date
The actions to identify and reserve inventory or planned capac-ity for orders and schedule a delivery date
D 2 4 Consolidate orders The process of analyzing orders to determine the groupingsthat result in least-cost and best-service fulfillment andtransportation
D 2 5 Plan and build loads The actions to select transportation modes and build efficientloads
D 2 6 Route shipments The actions to consolidate and route loads by mode, lane, andlocation
D 2 7 Select carriers and rate shipments The actions to select carriers by lowest cost per route and rateand tender shipments
D 2 8 Pick staged product The activities (including retrieving orders to pick, verifying in-ventory availability, building the pick wave, picking the product,recording the pick, and delivering product to shipping) per-formed in the distribution center in response to an order
D 2 9 Load vehicle, generate shippingdocuments, and ship
The tasks of placing product on vehicles; generating the docu-mentation to meet internal, customer, and government needs;and sending the product to the customer
D 2 10 Receive and verify product at cus-tomer’s site
The process of receiving the shipment at the customer’s siteand verifying that the shipped order is complete and the prod-uct meets quality requirements
D 2 11 Test and install product The process of preparing, testing, and installing the product atthe customer’s site; the product is fully functional after comple-tion
D 2 12 Invoice and receive payment The actions to send a signal to the financial organization thatthe order has been shipped and that the billing process shouldbegin (payment is received from the customer within the pay-ment terms of the invoice)
D 3 1 Obtain and respond to request forproposals and request for quotes
The process of delivering a product designed, manufactured,and assembled from a BOM that includes custom parts (designbegins only after the receipt and validation of a firm customerorder)
D 3 2 Negotiate and receive contract The process of negotiating order details (e.g., price, schedule,product performance) with customers and finalizing thecontract
D 3 3 Enter order, commit resources, andlaunch program
The process of entering and finalizing the customer order, ap-proving the planned resources (e.g., engineering, manufactur-ing), and officially launching the program
D 3 4 Schedule installation The process of evaluating the design and build schedules rela-tive to customer’s requested installation date to determine in-stallation schedule

SCOR Model
A-9
Table A-2. SCOR Level 3 Processes (Continued)
L1 L2 L3 Name Definition
D 3 5 Plan and build loads and shipments The process of scheduling simultaneous and consolidatedshipments, and planning and building loads
D 3 6 Route shipments and select carrier The process of consolidating and routing shipments by mode,lane, and location (carriers are selected and shipments arerated)
D 3 7 Pick staged product The activities of retrieving orders to pick, verifying inventoryavailability, building the pick wave, picking the product, record-ing the pick, and delivering product to shipping performed inthe distribution center in response to an order
D 3 8 Load vehicle, generate shippingdocuments, and ship
The tasks of placing product on vehicles; generating the docu-mentation to meet internal, customer, and government needs;and sending the product to the customer
D 3 9 Receive and verify product at cus-tomer’s site
The process of receiving the shipment at the customer’s siteand verifying that the shipped order is complete and the prod-uct meets quality requirements
D 3 10 Test and install product The process of preparing, testing, and installing a product atthe customer’s site; product is fully functional after completion
D 3 11 Invoice receive payment The actions to send a signal to the financial organization thatthe order has been shipped and that the billing process shouldbegin (payment is received from the customer within the pay-ment terms of the invoice)
Note: L3 = level 3.
For each of the SCOR processes, the model provides several performance meas-ures (Table A-3).
Table A-3. SCOR Performance Measures
Term Definition
Process category andprocess element
numbers
Actual-to-theoretical cycletime
See note P1.2, P3, P3.4
Asset turns Total gross product revenue divided by total net assets M1, M1.3, M1.4, M2,M2.3, M2.4, M3, M3.4,M3.5
Average plant-wide salary Total payroll for salaried employees divided by totalheadcount
M1, M2, M3
Build cycle time Average cycle time for build-to-stock products calculatedas the average number of units in process divided by theaverage daily output in units
Build-to-ship cycle time Average time from when a unit or product is deemedshippable by manufacturing until the unit or product isshipped to a customer
M1.4, M1.5, M2.4, M2.5,M3.5, M3.6

A-10
Table A-3. SCOR Performance Measures (Continued)
Term Definition
Process category andprocess element
numbers
Capacity utilization Measure of how intensively a resource is used to producea good or service that considers several factors (e.g.,internal manufacturing capacity, constraining processes,direct labor availability, and key components and materielavailability)
P1, P1.3, M1, M1.1,M1.3, M1.4, M2, M2.1,M2.3, M3, M3.1, D2.3
Cash-to-cash cycle time Inventory days of supply (DOS) plus days sales out-standing minus average payment period for materiel (timefor funds to flow back into a company after being spentfor raw materiel)
P1, M1.2, M2.2, M3.3,D2.12, D3.11
Commodity managementprofile
Number of distinct part numbers (purchased commodi-ties) sourced in the following areas: within 200 miles,country, continent, and offshore
P2, P2.2, P2.4
Complete manufacture toorder ready for shipmenttime
Time to pick, pack, and prepare for shipment time(in calendar days)
D2.8, D2.9
Create customer ordercosts
Costs for creating and pricing configurations to order andpreparing order documents
D1.2, D2.2, D3.2
Cross-training Training or experience provided in several areas (e.g.,training an employee on several machines rather thanone); cross-training provides workers in case the primaryoperator is unavailable
M3.2
Cumulative source andmake cycle time
Cumulative external and internal lead-time to build ashippable product (begun with no inventory on-hand, noparts on-order, and no prior forecasts with suppliers) incalendar days
P1, P2, P3, P3.3, P3.4
Customer invoicing andaccounting costs
Costs for invoicing, processing customer payments, andverifying customer satisfaction
D1.13, D2.12, D3.11
Customer receipt of orderto installation complete
Time for product installation, acceptance, and initiation ofoperations (in calendar days)
D2.10, D2.11, D3.9,D3.10
Customer signature andauthorization to orderreceipt time
Time (in calendar days) from when the customer author-izes an order to the time that the order is received
D1.2, D2.2, D3.2
Days sales outstanding 5-point annual average of gross accounts receivable di-vided by the total gross annual sales that has beendivided by 365
D1.13, D2.12, D3.11
Delivery performance tocustomer-request date
Percent of orders fulfilled on or before the customer’srequested date
P1, P1.3, P4, P4.3,P4.4, M1, M2, M3,D1.10, D2, D2.9, D3,D1.3, D3.8
Delivery performance toscheduled commit date
Percent of orders fulfilled on or before the original sched-uled or committed date
M1, M2, M3, M3.1,D1.10, D2, D2.9, D3,D3.8
Demand and supply plan-ning costs
Costs associated with forecasting, developing finishedgoods or end item inventory plans, and coordinating de-mand and supply process across entire supply chain,including all channels (but excluding MIS-related costs)
P1

SCOR Model
A-11
Table A-3. SCOR Performance Measures (Continued)
Term Definition
Process category andprocess element
numbers
Distribution costs Costs for warehouse space and management, finishedgoods receiving and stocking, processing shipments,picking and consolidating, selecting carriers, and stagingproducts and systems
D1.8, D1.9, D2.4, D2.5,D2.6, D2.7, D2.8, D3.5,D3.6, D3.7
Engineering change order(ECO) cost
Cost incurred from revisions to a blueprint or design re-leased by engineering to modify or correct a part (therequest for the change can be from a customer, produc-tion quality control, or another department)
M3, M3.1
End-of-life inventory Inventory on-hand that will satisfy future demand forproducts no longer in production at an entity
D1.8
Faultless invoices Number of invoices issued without error; examples ofinvoice defects are:
• Change from customer purchase order withoutproper customer involvement
• Wrong customer information (e.g., name, address,telephone number)
• Wrong product information (e.g., part number, prod-uct description)
• Wrong price (e.g., discounts not applied)
• Wrong quantity, terms, or date
D1.13, D2.12, D3.11
Field finished goodsinventory
Inventory kept at locations (e.g., distribution center, ware-house) outside the manufacturing plant
D2.9, D2.11, D3.10
Fill rates Percent of ship-from-stock orders shipped within 24 hoursof order receipt
P1, P1.3, P4, P4.4,M1.3, D1, D1.3, D1.9,D2
Finished goods inventorycarrying costs
Costs (e.g., opportunity cost, shrinkage, insurance andtaxes, total obsolescence, channel obsolescence andfield sample obsolescence) associated with finishedgoods inventory
P4, P4.3
Finished goods inventoryDOS
Gross finished goods inventory divided by the averagedaily value of transfers
P4, P4.4, D1, D1.8, D2,D3, D3.8
Finished goods shrinkage Costs associated with breakage, pilferage, and deteriora-tion of finished goods inventories
P4
Forecast accuracy Forecast sum (the sum of the units or dollars forecastedto be shipped each month based on the forecast gener-ated 3 months earlier) minus the sum of variances (thesum of the absolute values, for the forecasted line item, ofthe differences between each month’s forecast and actualdemand for the month) divided by the forecast sum (fore-cast accuracy is calculated in units and dollars byshippable end product for each distribution channel)
P1, P1.1, P2.1, P3.1,P4, P4.1, P4.2

A-12
Table A-3. SCOR Performance Measures (Continued)
Term Definition
Process category andprocess element
numbers
Forecast cycle Time between forecast regenerations that reflect truechanges in marketplace demand for shippable end prod-ucts; only valid “bottom-up” forecasts are counted (e.g., ifweekly or monthly updates to the forecast only shift datesfor the forecast to avoid changing the annual dollar-basedforecast, they should not be considered forecastregenerations)
P1.1, P2.1
Incoming materiel quality Number of received parts that fail inspection divided bythe total number of parts received
D1.8
Indirect-to-direct laborheadcount ratio
Ratio of number of employees to support production ingeneral without being related to a product (indirect labor)to the number of employees applied to the product beingmanufactured or used in the performance of the service(direct labor)
M1, M2, M3
In-process failure rates See note M3.4
Installation costs Costs for verifying site preparation, installing, certifying,and authorizing billing
D2.11, D3.10
Intramanufacturing replancycle
Time between the acceptance of a regenerated forecastby locations that produce the end product and the reflec-tion of the revised plan in the master production scheduleof all affected plants, excluding external vendors
M1.3, M2.3, M3.4
Inventory accuracy Absolute value of the sum of the variances betweenphysical inventory and perpetual inventory
P2.2, M1.2, M2.2, M3.3
Inventory aging Percent of total gross inventory (based on value) coveredby expected demand within time periods
M1, M2, M3
Inventory carrying costs Sum of opportunity cost; shrinkage; insurance and taxes;total obsolescence for raw materiel, work-in-process(WIP), and finished goods inventory; channel obsoles-cence; and field sample obsolescence
P1
Inventory cycle-countingaccuracy
Absolute value of the sum of the variances betweenphysical inventory and perpetual inventory
P1.2
Inventory DOS Total gross value of inventory at standard cost beforereserves for excess and obsolescence (only includesinventory on company books; future liabilities should notbe included) calculated using the 5-point annual averageof the sum of all gross inventories (e.g., raw materiel,WIP, plant finished goods, field finished goods, field sam-ples) divided by the cost of goods sold that has beendivided by 365
P1, P1.3, S1, S2, S3,M1.1, M2.1, M3.2
Inventory obsolescenceas a percent of totalinventory
Annual obsolete and scrap reserves taken for inventoryobsolescence expressed as a percent of annual averagegross inventory value
P1, P3, P3.3, P3.4, M1,M1.2, M2.1, M2.2, M3.3,D1.8, D2
Machine wait-time See note M1.1, M2.1

SCOR Model
A-13
Table A-3. SCOR Performance Measures (Continued)
Term Definition
Process category andprocess element
numbers
Make cycle time Sum of the following average times: Order release to startactual build, total build cycle, and end build to leavesplant (i.e., moves to on- and off-site distribution or goes tocustomer); for continuous and mixed processes, manu-facturing cycle time is calculated as the average numberof units (e.g., doses, kilos, pounds, gallons) in processdivided by the average daily output in units
M1.2
Make flexibility Time to implement a sustainable unplanned increase inend product supply of 20 percent if each of the followingfactors is the only constraint:
• Internal manufacturing capacity
• Direct labor availability
• Constraining processes
• Key components and materiel availability
• Direct labor availability
P3, P3.3
Materiel acquisition costs Costs for production materiel (materiel management andplanning, supplier quality engineering, inbound freight andduties, receiving and materiel storage, incoming inspec-tion, and materiel process engineering and tooling costs)
S1, S2, S3, D1.8
Materiel management andplanning costs as a per-cent of materiel acquisi-tion costs
Costs associated with supplier sourcing, contract nego-tiation, and qualification and the preparation, placement,and tracking of a purchase order expressed as a percentof materiel acquisition costs; category includes all costsrelated to buyers and planners
P2.3, S1.1, S2.1, S3.2,S3.3
Materiel overhead costper dollar of materielexpenditure
See note P3
Materiel process engi-neering as a percent ofmateriel acquisition costs
Costs associated with tasks to document and communi-cate materiel specification as well as reviews to improvethe manufacturability of the purchased item expressed asa percent of materiel acquisition costs
S3.1
Materiel requisition cycletime
See note M1.2, M2.2, M3.3
Number of call backs as apercent of total inquiries
Number of call backs divided by total inquiries D1.1, D2.1
Number of ECOs Number of revisions to a blueprint or design released byengineering to modify or correct a part (the request for thechange can be from a customer, production quality con-trol, or another department)
M3, M3.1
Number of end productsand stock-keeping units
Number of end item offerings individually planned andmanaged
P3, P3.2
Number of orders not de-livered complete
Number of orders that all items on order are not deliveredin the quantities requested
D2.8
Number of orders withcomplete and accuratedocumentation
Number of orders with correct documentation supportingthe order, including packing slips, bills of lading, andinvoices
D2.8
Number of supply sources Number of internal and external direct production materielsuppliers used
P2, P2.2, P2.4

A-14
Table A-3. SCOR Performance Measures (Continued)
Term Definition
Process category andprocess element
numbers
Order consolidation profile Consolidation consists of activities associated with fillinga customer order by bringing together all line items or-dered by the customer (some items may come directlyfrom the production line; others may be picked fromstock); the following profiles are captured:
• Shipped direct to customer’s dock from point ofmanufacture (no consolidation)
• Shipped direct to customer with consolidation com-pleted local to customer by organic transportcompany
• Moved to on-site staging location for consolidationand shipment direct to customer
• Moved to on-site stockroom for later pick, pack, andship
• Shipped to different locations for consolidation orlater pick, pack, and ship
D1.4
Order entry and mainte-nance costs
Costs for maintaining the customer database, checkingcredit, accepting new orders, and adding them to the or-der system as well as later order modifications
D1.2, D2.2
Order entry complete toorder ready for shipmenttime
Release to manufacturing, order configuration verification,production scheduling, build, pick-pack, and prepare forshipment time (in calendar days)
D1.4, D1.5, D1.6, D1.7,D1.9, D1.10, D3.5,D3.6, D3.7
Order entry complete tostart manufacture time
Time from completion of order entry to the release tomanufacturing (in calendar days)
D2.4, D2.5, D2.6, D2.7,D3.4
Order fulfillment costs Costs for processing the order, allocating inventory, or-dering from the internal or external supplier, schedulingthe shipment, reporting order status, and initiatingshipment
D1.3, D2.3, D3.3, D3.4
Order fulfillment lead-times
Average actual lead-times consistently achieved fromcustomer signature and authorization to order receipt,order receipt to order entry complete, order entry com-plete to start build, start build to order ready for shipment,order ready for shipment to customer receipt of order, andcustomer receipt of order to installation complete
M3, M3.1, D1, D2, D3
Order management costs Aggregation of the following cost elements (defined inAppendix E):
• Create customer order costs
• Order entry and maintenance costs
• Contract, program, and channel management costs
• Installation planning costs
• Order fulfillment costs
• Distribution costs
• Transportation costs
• Installation costs
• Customer invoicing and accounting costs
P1, P4, P4.1, P4.2, D1,D1.1, D2, D2.1, D3,D3.1

SCOR Model
A-15
Table A-3. SCOR Performance Measures (Continued)
Term Definition
Process category andprocess element
numbers
Order management cycletime
See note P4, P4.1, P4.2
Order ready for shipmentto customer receipt oforder time
Time that includes total transit time (all components toconsolidation point), consolidation, queue time, and addi-tional transit time to customer receipt of order (in calendardays)
D1.11, D2.9, D3.8
Order receipt to orderentry complete time
Time (in calendar days) for order revalidation, configura-tion check, credit check, and scheduling of receivedorders
D1.2, D1.3, D2.2, D2.3,D3.3
Overhead cost Costs of operating a business that cannot be directly re-lated to the products or services produced; the costs(e.g., light, heat, supervision, and maintenance) aregrouped in several pools and distributed to units of prod-uct or service by a standard allocation method (e.g., di-rect labor hours, direct labor expenses, or direct materielexpenses)
M1, M2, M3
Percent defective See note S1, S1.1, S3
Percent of EDItransactions
Percent of orders received via EDI S1.1, S2.1, S3.3
Percent of faultlessinstallations
Number of faultless installations divided by total numberof units installed
D1.12, D2.11, D3.10
Percent of orders sched-uled to customer request
Percent of orders with delivery scheduled within anagreed time frame of the customer’s requested deliverydate
M2.1, M3.2, D2.3
Percent of parts deliveredto point of use
Percent of materiel receipts delivered directly to produc-tion or a consolidation point or point of use on the pro-duction floor with no inspection or only minor visual andpaperwork inspection
M1.2, M2.2, M3.3
Perfect order fulfillment Orders that meet all of the following standards:
• Delivered complete; all items on order delivered inthe quantities requested
• Delivered on time, using the customer’s definition ofon-time delivery
• Complete and accurate documentation (includingpacking slips, bills of lading, and invoices) to supportthe order
• Delivered in perfect condition, correct configuration,customer-ready, no damage, and faultlessly installed(as applicable)
D1.10, D1.11, D2, D2.2,D2.9, D2.10, D3, D3.8,D3.9
Plan stability See note P1.4
Plant cost per hour See note M1, M2
Plant finished goodsinventory DOS
Gross plant finished goods inventory divided by theaverage daily value of transfers
M1.5, D2.8, D3.7

A-16
Table A-3. SCOR Performance Measures (Continued)
Term Definition
Process category andprocess element
numbers
Plant-level ordermanagement costs
Aggregation of the following cost elements (defined inAppendix E) for which manufacturing is the central focalpoint of orders:
• Create customer order costs
• Order entry and maintenance costs
• Contract, program, and channel management costs
• Installation planning costs
• Order fulfillment costs
• Distribution costs
• Transportation costs
• Installation costs
• Customer invoicing and accounting costs
M2.1, M3.2
Product and gradechangeover time
See note M1, M1.3, M2, M2.3
Product and process dataaccuracy (e.g., BOMs,routings, planning factors)
See note P1, P1.2
Production flexibility Upside flexibility—number of days to achieve an un-planned sustainable 20 percent increase in production
Downside flexibility—percent of order reduction sustain-able at 30 days before delivery with no inventory or costpenalties
M1.1, M2.1, M3.2
Production planadherence
See note P3, P3.4
Published delivery lead-times
Standard lead-time (after receipt of order) published tocustomers by the sales organization for only typicalorders (not standing and resupply orders)
D1, D2
Purchased materiel bygeography
Number of the distinct part numbers of raw materiel, ex-ternally manufactured components, manufactured fin-ished products, packaging materiel, and labeling materielsourced in the following areas: within 200 miles, country,continent, and offshore
S3.1
Quality levels See note M1.3, M2.3
Quarantine time Time for setting items aside from availability for use orsale until required quality tests have been performed andconformance certified
M1.6, M2.6
Ratio of actual to theoreti-cal cycle time
See note M1.3, M1.4, M2.3, M3.4
Raw materiel and WIPinventory DOS
Gross raw materiel and WIP inventory divided by theaverage daily value of transfers
P2, P3, D2, D3
Raw materiel DOS Gross raw materiel inventory divided by the average dailyvalue of transfers
P2, P2.3, M1.2, S1.1,S2.1, S3.2, S3.3
Raw materiel inventorycarrying costs
Costs associated with raw materiel inventory (e.g., op-portunity cost, shrinkage, insurance and taxes, andobsolescence)
P2

SCOR Model
A-17
Table A-3. SCOR Performance Measures (Continued)
Term Definition
Process category andprocess element
numbers
Raw materiel shrinkage Costs associated with breakage, pilferage, and deteriora-tion of raw materiel inventories
P2
Receiving and materielstorage costs as a percentof materiel acquisitioncosts
Costs associated with taking possession of and storingmateriel; includes warehouse space and management,materiel receiving and stocking, processing work orders,pricing, and internal materiel movement but does not in-clude incoming inspections
S1.3, S2.3, S3.5
Receiving and put awaycycle time
See note M3.3
Receiving costs as a per-cent of materiel acquisi-tion costs
Costs associated with taking possession of materiel (ex-cluding inspection) expressed as a percent of materielacquisition costs
S1.2, S2.2, S3.4
Replan cycle time Time between the initial creation of the regenerated fore-cast and its reflection in the master production scheduleof the production facilities for the end product
P1, P1.1, P1.3, P1.4,P2.3, M1, M2
Responsiveness lead-time See note M1.1, M2.1, M3.2
Return on assets Financial measure of the income-producing value of anasset calculated as net income divided by total assets
P1
Routing data accuracy See note P0
Schedule achievement Percent of time that a plant achieves its productionschedule based on the number of scheduled end items orvolume for a period (overshipments do not make up forundershipments)
M1.1,M2.1, M3.2
Scrap expense Expense incurred from materiel being outside specifica-tions and possessing characteristics that make reworkimpractical
M1.3, M2.3, M3.4
Shrinkage Costs associated with breakage, pilferage, and deteriora-tion of inventories
P4
Source cycle time Cumulative lead-time (total average combined inside-plant planning, supplier lead-time [internal or external],receiving, and handling from demand identification at thefactory until materiel are available in the production facil-ity) to source 95 percent (chosen to eliminate outlyingdata) of the value of materiel from internal and externalsuppliers
S1.2, S2.2, S3.4
Source flexibility See note P2, P2.3
Supplier cycle time See note P2, P2.4
Supplier fill rate See note P2, P2.4
Supplier on-time deliveryperformance
Percent of orders fulfilled on or before the customer’srequested date (supplier’s performance measured by thecustomer)
P2, P2.3, P2.4, S1.2,S2.2, S3.4
Supply chain financecosts
Costs associated with paying invoices, auditing physicalcounts, performing inventory accounting, and collectingaccounts receivable (does not include customer invoicingand accounting costs)
P1.3

A-18
Table A-3. SCOR Performance Measures (Continued)
Term Definition
Process category andprocess element
numbers
Total build time Average time for build-to-stock or configure-to-orderproducts from when production begins on the releasedwork order until the build is completed and unit deemedshippable
M1.3, M2.3, M3.4
Total logistics costs All supply chain-related MIS, finance and planning, in-ventory carrying, materiel acquisition, and ordermanagement costs
P4
Total manufacturingemployment
See note M1.3, M2.3, M3.4
Total source lead-time Cumulative lead-time to source 95 percent of the value ofmateriel from internal and external suppliers
S1, S1.1, S2, S2.1, S3,S3.1, S3.2, S3.3
Total WIP inventory DOS Gross WIP inventory divided by the average daily value oftransfers
P3, P3.3, P3.4
Training and education See note M1.3, M2.3
Transportation costs Company-paid freight and duties from point of manufac-ture to end customer or channel
D1.4, D1.5, D1.6, D1.7,D2.9, D3.8
Unit cost Total labor, materiel, and overhead cost for one unit ofproduction (e.g., part, gallon, pound)
M2, M3
Value-added employeeproductivity
Total product revenue minus total materiel purchasesdivided by total employment (in full-time equivalents)
P1, M1, M1.3, M2,M2.3, M3, M3.4
Warranty and returns Number of returns in the warranty period (a warranty is acommitment, expressed or implied, that a fact regardingthe subject matter of a contract is or will be true)
M1.3, M1.4
Warranty costs Costs associated with materiel, labor, and problemdiagnoses for product defects
M1, M1.3, M1.4, M2,M2.3, M2.4, M3, M3.4,M3.5
WIP shrinkage Costs associated with breakage, pilferage, and deteriora-tion of WIP inventories
P3
WIP inventory carryingcosts
Costs associated with WIP inventory (e.g., opportunitycost, shrinkage, insurance and taxes, and totalobsolescence)
P3, P3.4
Yield Ratio of usable output from a process to its input M1, M1.3, M2, M2.3,M2.4, M3.4
Yield variability Condition that occurs when the output of a process is notconsistently repeatable in quantity or quality
M1.3, M2.3, M3.4
Note: Term not defined by SCOR model.

B-1
Appendix B DoD Supply Chain
DOD SUPPLY CHAIN
Figure B-1 is an adaptation of the high-level SCOR model to the DoD supplychain. For our analysis we rename the “make” process as “maintain” for the DoDorganizations because maintenance activities generally perform the functions of amanufacturer. The DoD supply chain includes many participants, includingICPs, maintenance organizations, distribution depots, and retail activities.
Figure B-1. DoD Supply Chain
Plan(ICP)
DoD retail CustomerSuppliers
MakeDeliver
(distributiondepot)
Source(ICP)
Maintain(maintenance
depot)
SourceDeliver DeliverMaintain SourceDeliver
DoD wholesale
Source
DOD SUPPLY CHAIN DESCRIPTION
Figure B-2 shows the SCOR level 2 configuration for DoD.
Figure B-2. DoD SCOR Level 2 Supply Chain Diagram
Wholesale CustomerSuppliers Retail
S1
D2
D1 D1 S1 D1 S1 D1
P2 P4
S2 D2
M1 M1
In Figure B-2, materiel flows from left to right beginning with DoD’s suppli-ers. DoD has two basic types of suppliers: suppliers that stock items in
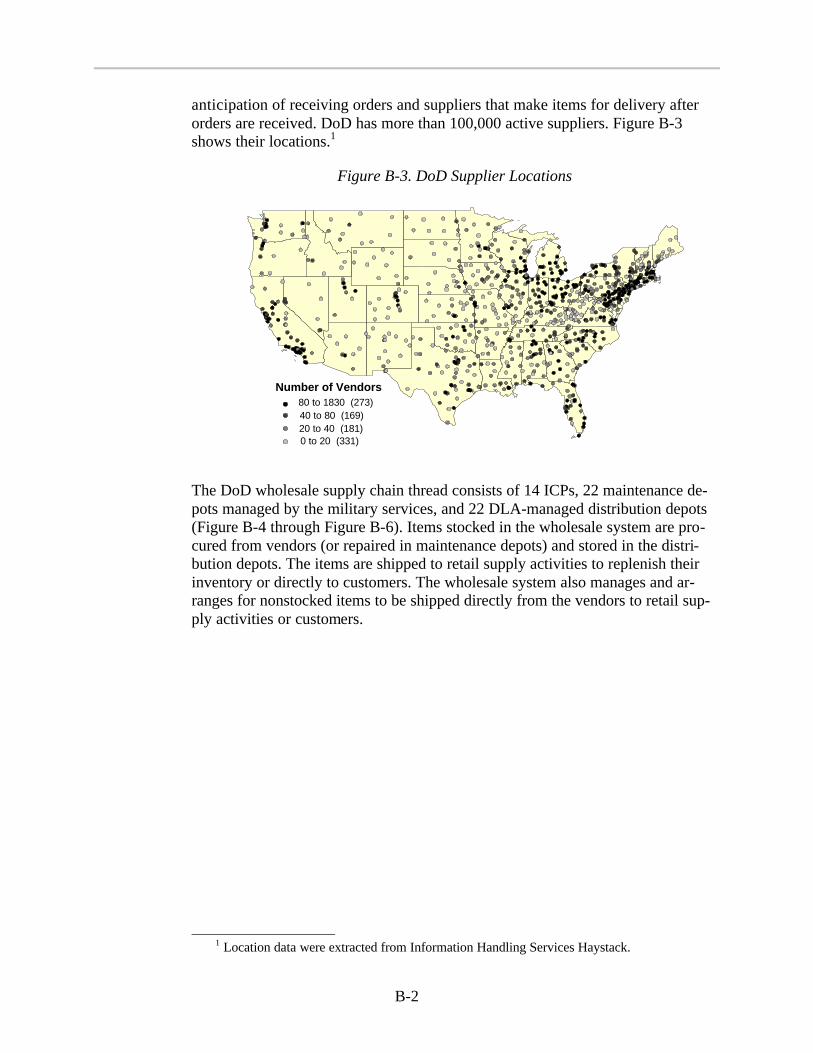
B-2
anticipation of receiving orders and suppliers that make items for delivery afterorders are received. DoD has more than 100,000 active suppliers. Figure B-3shows their locations.1
Figure B-3. DoD Supplier Locations
Number of Vendors80 to 1830 (273)40 to 80 (169)20 to 40 (181)0 to 20 (331)
The DoD wholesale supply chain thread consists of 14 ICPs, 22 maintenance de-pots managed by the military services, and 22 DLA-managed distribution depots(Figure B-4 through Figure B-6). Items stocked in the wholesale system are pro-cured from vendors (or repaired in maintenance depots) and stored in the distri-bution depots. The items are shipped to retail supply activities to replenish theirinventory or directly to customers. The wholesale system also manages and ar-ranges for nonstocked items to be shipped directly from the vendors to retail sup-ply activities or customers.
1 Location data were extracted from Information Handling Services Haystack.

DoD Supply Chain
B-3
Figure B-4. Inventory Control Points
SM-ALC (AF) OO-ALC (AF)
SA-ALC (AF)
OC-ALC (AF)
WR-ALC (AF)
MCLB-Albany (USMC)
AMCOM (ARMY)
DSCC(DLA)
TACOM (ARMY)DSCP(DLA)
CECOM (ARMY)
DSCR (DLA)DESC (DLA)
NAVICP (NAVY)
AMCOM U.S. Army Aviation Missile CommandCECOM U.S. Army Communications-Electronics CommandDESC Defense Energy Support CenterDSCC Defense Supply Center, ColumbusDSCP Defense Supply Center, PhiladelphiaDSCR Defense Supply Center, RichmondMCLB Marine Corps Logistics BaseNAVICP Naval Inventory Control PointOC-ALC Oklahoma City Air Logistics CenterOO-ALC Ogden Air Logistics CenterSA-ALC San Antonio Air Logistics CenterSM-ALC Sacramento Air Logistics CenterTACOM U.S. Army Tank-automotive and Armaments CommandWR-ALC Warner-Robins Air Logistics Center
Note: AF = Air Force; USMC = United Stated Marine Corps.
Figure B-5. Maintenance Depots
SacramentoALC
Puget SoundNSY
NADEP North Island
Oklahoma CityALC
Ogden ALC
MCLB Barstow
San AntonioALC
Corpus ChristiArmy Depot
Red RiverArmy Depot MCLB Albany
NADEP Jacksonville
Warner Robins ALC
NADEP Cherry PointAnniston
Army Depot
Norfolk NSY
TobyhannaArmy Depot
LetterkenneyArmy Depot
Pearl Harbor NSY
AMARC
NUWC Keyport
Closing/Realigning
Note: ALC = Air Logistics Center; AMARC = Aerospace Maintenance and RegenerationCenter; NADEP = naval aviation depot; NSY = naval shipyard; NUWC = Naval Undersea Warfare Center.

B-4
Figure B-6. Distribution Depots
McClellan
Puget Sound
San Joaquin
San DiegoOklahoma City
Hill AFB
Barstow
San Antonio
Corpus Christi
Red RiverAlbany
Jacksonville
Warner Robins
Cherry Point
Anniston
Columbus
NorfolkRichmond
TobyhannaSusquehanna
Germany
Letterkenney
Note: AFB = Air Force Base.
The DoD delivery system includes cargo consolidation points (Figure B-7), com-mercial carriers on contract, military air ports (11 in the United States and 32overseas), and military seaports (17 in the United States and 27 overseas).
Figure B-7. Cargo Consolidation Points
Puget Sound (MTMC)
San Joaquin (DLA)Norfolk (MTMC & AMC)
Susquehanna (DLA) Travis AFB (AMC)
McChord AFB(AMC)
Dover AFB
Charleston AFB (AMC)
Oakland(MTMC)
Note: AMC = Air Mobility Command; MTMC = Military Traffic Management Command.
The DoD retail supply chain is made up of hundreds of retail supply and in-termediate-level maintenance activities that stock, repair, and store assets.They replenish their inventory from the wholesale supply system or directly fromsuppliers.
At the end of the supply chain are the customers. Their orders are filled from or-ganizational supplies, designated retail supply activities, the wholesale supplysystem, or directly from vendors. The DoD Activity Address Directory, main-tained by the Defense Automatic Addressing System Center, contains the DoD

DoD Supply Chain
B-5
Activity Address Codes (DoDAACs), which identify every unit, activity, and or-ganization that has the authority to requisition or receive materiel. More than30,000 DoD customers (i.e., requisitioners) place materiel orders.
Figure B-8 shows the distribution of CONUS DoDAACs.
Figure B-8. DoD CONUS Customers
40 to 1100 (103)30 to 40 (43)20 to 30 (111)0 to 20 (637)
Number of DoDAACs

B-6

C-1
Appendix C OSD, Military Service, and DLA EnterprisePerformance Measures
This appendix presents OSD, military service, and DLA enterprise performancemeasures.
OSD
OSD uses secondary item supply chain performance measures from two mainsources: the MDM Annual Fact Book and DoD Supply Executive InformationManagement System.1 The measures are briefly described in Table C-1.
Table C-1. OSD Performance Measures
Name Description Primary data source
Wholesale supplymanagement cost ofoperations
Nonmateriel costs to the supply working capital fund President’s Budget
Wholesale supply man-agement personnel(military and civilian)
Number of military and civilian personnel assigned towholesale supply management
President’s Budget
Net wholesale materielsales
Sales (excluding fuel) at acquisition cost for the pastfiscal year
President’s Budget
Wholesale materielobligations
Past fiscal year obligations at latest acquisition cost President’s Budget
Number of DoD itemsmanaged bycomponents
Number of NSN items managed by primary controlactivities
DLIS
Number of DoD itemsmanaged
Number of NSNs managed during the last 6 years DLIS
Secondary item inven-tory by component
Prior-year inventory value at latest acquisition cost Supply System Inven-tory Report (SSIR)
Secondary iteminventory value
Value of the DoD inventory for the last 7 years atacquisition cost
SSIR
DoD active inventoryand inactive inventory tototal inventory
Percent of inventory that is active and inactive foreach of the last 7 years
SSIR
Secondary inventory byitem type
Percent of reparable and consumable inventory for thelast year, the division between active and inactiveinventory, and values at acquisition cost
SSIR
1 Both sources are available on the Internet at http://www.acq.osd.mil/log/mdm/exinfo.htm.
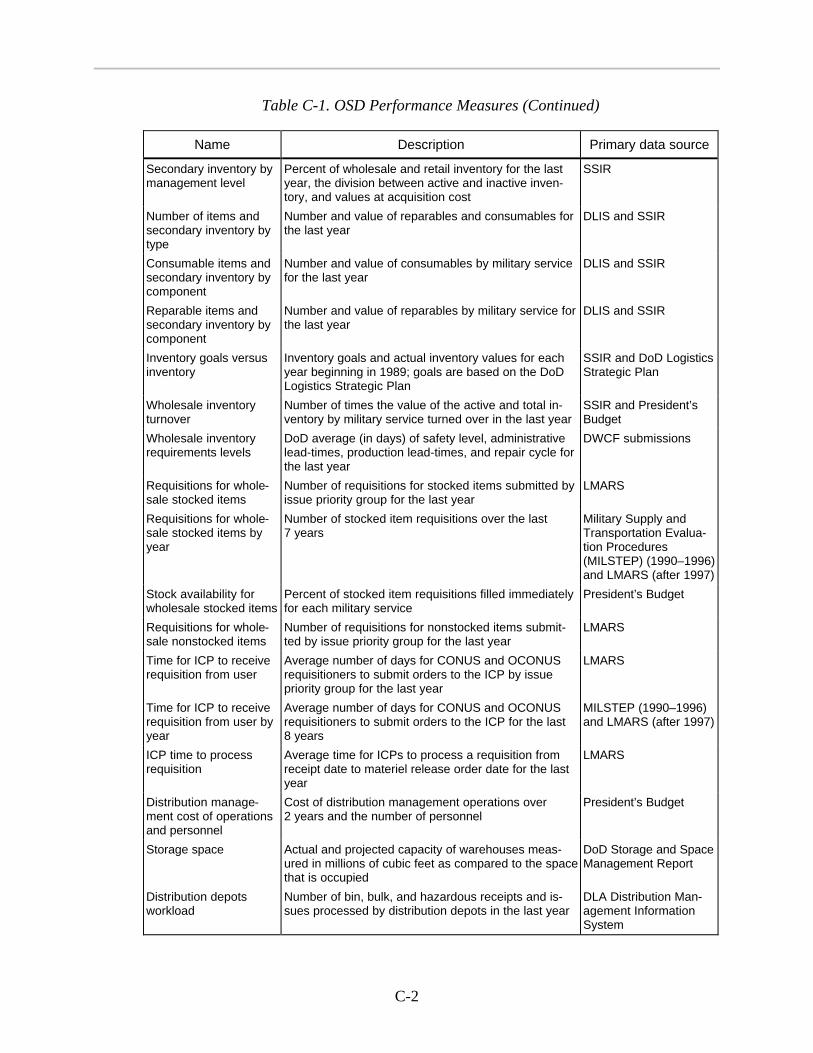
C-2
Table C-1. OSD Performance Measures (Continued)
Name Description Primary data source
Secondary inventory bymanagement level
Percent of wholesale and retail inventory for the lastyear, the division between active and inactive inven-tory, and values at acquisition cost
SSIR
Number of items andsecondary inventory bytype
Number and value of reparables and consumables forthe last year
DLIS and SSIR
Consumable items andsecondary inventory bycomponent
Number and value of consumables by military servicefor the last year
DLIS and SSIR
Reparable items andsecondary inventory bycomponent
Number and value of reparables by military service forthe last year
DLIS and SSIR
Inventory goals versusinventory
Inventory goals and actual inventory values for eachyear beginning in 1989; goals are based on the DoDLogistics Strategic Plan
SSIR and DoD LogisticsStrategic Plan
Wholesale inventoryturnover
Number of times the value of the active and total in-ventory by military service turned over in the last year
SSIR and President’sBudget
Wholesale inventoryrequirements levels
DoD average (in days) of safety level, administrativelead-times, production lead-times, and repair cycle forthe last year
DWCF submissions
Requisitions for whole-sale stocked items
Number of requisitions for stocked items submitted byissue priority group for the last year
LMARS
Requisitions for whole-sale stocked items byyear
Number of stocked item requisitions over the last7 years
Military Supply andTransportation Evalua-tion Procedures(MILSTEP) (1990–1996)and LMARS (after 1997)
Stock availability forwholesale stocked items
Percent of stocked item requisitions filled immediatelyfor each military service
President’s Budget
Requisitions for whole-sale nonstocked items
Number of requisitions for nonstocked items submit-ted by issue priority group for the last year
LMARS
Time for ICP to receiverequisition from user
Average number of days for CONUS and OCONUSrequisitioners to submit orders to the ICP by issuepriority group for the last year
LMARS
Time for ICP to receiverequisition from user byyear
Average number of days for CONUS and OCONUSrequisitioners to submit orders to the ICP for the last8 years
MILSTEP (1990–1996)and LMARS (after 1997)
ICP time to processrequisition
Average time for ICPs to process a requisition fromreceipt date to materiel release order date for the lastyear
LMARS
Distribution manage-ment cost of operationsand personnel
Cost of distribution management operations over2 years and the number of personnel
President’s Budget
Storage space Actual and projected capacity of warehouses meas-ured in millions of cubic feet as compared to the spacethat is occupied
DoD Storage and SpaceManagement Report
Distribution depotsworkload
Number of bin, bulk, and hazardous receipts and is-sues processed by distribution depots in the last year
DLA Distribution Man-agement InformationSystem

OSD, Military Service, and DLA Enterprise Performance Measures
C-3
Table C-1. OSD Performance Measures (Continued)
Name Description Primary data source
Distribution depotsprocessing time
Average depot processing times for routine and high-priority issues for the last fiscal year
DLA Distribution Man-agement InformationSystem
Distribution depots totalprocessing time by year
Average depot processing times for CONUS andOCONUS for the last 8 years
MILSTEP (1990–1996)and DLA DistributionManagement Informa-tion System (after 1997)
Materiel locationaccuracy
Accuracy of location records (excluding ammunitionand subsistence) for the last 8 years
Defense Logistics Man-agement StandardsOffice (DLMSO) Inven-tory Control Effective-ness Report
Warehouse denials Percent of materiel release orders (MROs) (excludingammunition and subsistence) that result in warehousedenials for the last 8 years
DLMSO Inventory Con-trol Effectiveness Report
Materiel transferred todisposal system
Value of disposals (excluding aircraft, ships, and am-munition from end users) for the last 8 years
DLA’s Program Admin-istrator’s Report
Secondary item inven-tory projections
Projected value of inventory for each military service(interactive Web application)
DoD inventory projec-tion model
Inventory on hand atend of fiscal year
Interactive Web-based tool to drill down through on-hand inventory values of military services; categoriesare military service, commodity, stock type, and fund-ing source
SSIR
Disposal of declaredexcess by year
Disposal statistics by commodity by year (interactiveWeb application)
DLA’s Program Admin-istrator’s Report(DD Form 1143)
Inventory controleffectiveness
Effectiveness of inventory control DLMSO Inventory Con-trol Effectiveness Report
ARMY
The Army periodically reviews logistics performance metrics at the enterprise levelat the following three forums: Deputy Chief of Staff for Logistics (DCSLOG)Quarterly Review, Inventory Management Review, and Army Performance Re-view. In each review, several metrics are presented. Although no metric conveys aholistic look, together they present a comprehensive picture of Army logistics.
DCSLOG Quarterly Review
The DCSLOG Quarterly Review is the most comprehensive review of enterprisemetrics. The metrics range from “end objective” metrics (e.g., operational readiness)to key process metrics (e.g., order-ship time). The review consists of the followingmetrics: operational readiness by weapon system; number of S-4 (lowsustainability) units; unit breakouts; stock availability by weapon system and com-ponent; consumable and reparable status by activity (e.g., wholesale, retail);NMCS items; items managed by the Army and DLA; order-ship time by
C-4
command, issue priority group, location (e.g., CONUS, OCONUS), process step,and materiel class; inventory levels by activity and materiel class; approved stock-age list requirements on backorder by command; percent of requisitions on back-order; administrative lead-time and production lead-time; Defense Reutilizationand Marketing Office actions by command and item condition; redistributableClass IX assets; and several maintenance metrics. The metrics are also presented inseveral dimensions to provide a “drilldown” diagnostic capability.
Inventory Status Review
The Inventory Status Review contains metrics that the Army Materiel Commandand DLA present to the DCSLOG to describe their performance of inventory man-agement.
The Army Materiel Command’s metrics include the following: requirements objec-tive by command and requirements stratification; procurement due-in beyond therequisitioning objective as a percentage of total due-in by command; inducted as-sets beyond repair by command; on-hand inventory by command and stratificationrequirements; requisition processing time; requisition volume by weapon system(NMCS and all items); fill rate (NMCS and all items); demand accommodation(NMCS and all items); backorders (nonstocked) for NMCS and all items and retailand wholesale levels; average number of NMCS days by weapon system; MC rateby weapon system; stock availability for stocked and nonstocked items by weaponsystem and command for depot maintenance, Army, and non-Army customers; or-der-ship time (for Class IX, approved stockage list, and nonbackorders) by com-mand; average number of days of materiel returns by process step and location forautomatic return and standard items; and percent of materiel returns within targetby process step and location for automatic return and standard items.
The DLA metrics include the following: gross requisitions by weapon system; sup-ply availability by ICP and weapon system; and backorders for stocked and non-stocked items by ICP, military service, and weapon system.
Quarterly Army Performance Review
In the Quarterly Army Performance Review, the DCSLOG presents the status ofthe Army logistics system to the Secretary of the Army and the Army Chief ofStaff. This presentation contains primarily high-level sizing metrics (i.e., metricsthat describe size and makeup of the system rather than its performance).
The review consists of the following metrics: Army working capital fund secon-dary item inventory level by commodity and requirements stratification for retailand wholesale levels, Army portion of DoD Class IX stock-funded inventory, andadministrative lead-time by installation. The metrics also convey the Army’s useof DoD resources relative to other military services and the status of key ini-tiatives.

OSD, Military Service, and DLA Enterprise Performance Measures
C-5
Logistics Metrics Web Page
In addition to the periodic reviews, the Army has developed a Web page(Figure C-1) that contains most metrics it uses to monitor logistics performance.The Web page is one of the most advanced DoD applications of information tech-nology in logistics performance measurement.
Figure C-1. Army Logistics Performance Metrics Web Site
The Web site categorizes dozens of metrics under four headings: readiness, sus-tainment, power projection, and resourcing. Table C-2 presents the list.
Table C-2. Army Logistics Performance Metrics Web Site
Readiness Sustainment Power projection Resourcing
FMC rates Order-ship time (Transportation metrics) (Metrics underdevelopment)
Percent fill of pre-positioned stocks
Pipeline asset levels
War reserve inven-tory levels
Administrative lead-time
Production lead-time
On-hand inventory
Backorder level
Requirements objectives
Requisitioning objectives
Materiel returns
Process time to induct andrelease materiel returns
The Web site also provides subcomponents for each metric by several dimensions,similar to the dimensions used in the briefings. This set of metrics was selected

C-6
from more than 1,000 metrics used by the Army. The set continues to evolve tomeet user needs.
NAVY
The Navy is proposing that the metrics in Table C-3 be used at the Navy enterpriselevel to indicate the performance of its supply chain. The Navy has decided to dis-play its metrics in a balanced scorecard form with metrics in three general catego-ries: customer satisfaction and quality, cost, and readiness.
Table C-3. Recommended Key Supply Chain Management Metrics
Recommended key supply chainmanagement metrics
Customer satisfactionand quality Cost Readiness
Customer wait time (part of response to customer)
X
Response to failure (part of response to customer) X
Asset visibility (part of TAV) X
Asset access (part of TAV) X
Supply materiel availability X
Materiel obligations outstanding X
Inventory level X
Total sales X
Cost recovery X
Net cash X
Workforce level X
Level percent of time free of casualty reports(CASREPs)
X
MC and FMC rates X
Percent of downtime due to maintenance or supply X

OSD, Military Service, and DLA Enterprise Performance Measures
C-7
The Navy defines the metrics in Table C-3 as follows:
u Response to customer. Consists of two customer-focused metrics—customerwait time and response to failure—that provide a snapshot of the mean waittime for parts delivery to customers and a distribution curve of the meantime for repair equipment failure:
ä Customer wait time. A time measure from the Julian date of a cus-tomer’s requisition to the receipt date that is derived by using the LRTmetric from DLA’s LMARS and modifying it as follows:
n Adding retail issues
n Adding requisitions not processed by the Defense AutomatedAddressing System (DAAS)
n Removing nonreadiness elements (e.g., publications, forms,General Services Administration items, stock replenishments).
ä Response to failure. A distribution curve that charts the mean wait timeto complete a repair job compared to the percent of time it takes tomeet the mean wait time; metric is derived for aviation, surface, andsubsurface customers with data from maintenance informationsystems.
u Total asset visibility. A ratio of the value of inventory in which TAV hasbeen achieved to the value of inventory targeted for TAV. TAV will be re-ported in the following two ways:
ä Visibility achieved. The ability to see the asset electronically.
ä Access achieved. The ability to redistribute the asset (using businesspolicies).
u Supply materiel availability. A measure of wholesale (i.e., ICP) effective-ness in filling customer requisitions (for stocked items).
u Materiel obligations outstanding. A measure of the number and averageage of backordered requirements.
u Inventory level. The value of wholesale inventories managed by theNAVICP for the Navy Working Capital Fund (NWCF); inventory is de-rived from the SSIR published annually during the second quarter of eachfiscal year.
u Total sales. A measure of the value (at standard price) of wholesale andretail net and credit sales of NWCF-owned materiel.

C-8
u Cost recovery rate. A measure of the value of the controllable supply sys-tem costs, including maintenance, supply operations, and payments toothers.
u Net cash. A measure of cash flow for the NWCF; net cash is derived fromsubtracting total expenditures from total collections.
u Workforce level. A measure of the number of military and civilian endstrength.
u Percent of time free of C-3 and C-4 casualty reports. A measure of shipmission readiness that focuses on operational periods only (i.e., excludingtime in scheduled maintenance availabilities); compiled from data in theCASREP database maintained at NAVICP.
u MC and FMC rates. Measurements of mission readiness.
ä MC. The materiel condition of an aircraft or aircraft population that in-dicates the ability to perform at least one and potentially all assignedmissions. Subsystem Capability Impact Reporting (SCIR) informationis used to determine historical MC rates.
ä FMC. The materiel condition of an aircraft or population of aircraft in-dicating the ability to perform all assigned missions. SCIR informationis used to determine historical FMC rates.
u Downtime due to maintenance or supply. A measurement of the percent oftime an aviation or ship asset is not operational due to maintenance or sup-ply. Aviation downtime due to maintenance is NMCM, and downtime dueto supply is NMCS; both times are derived from historical SCIR data. Forship (surface and subsurface) assets, the percent of downtime due to main-tenance or supply is compiled from data in the CASREP database main-tained at NAVICP.
Systems
The Navy uses the Consumable Item Support System to provide visibility andmeasure the effectiveness of the Naval Supply Systems Command (NAVSUP).The system reports several categories—readiness, supply support, financial, con-tracting, and inventory—of measurement. A user can select a complete list of indi-cators or indicators from shorter lists associated with executive, fleet and industrialsupply center, ICP, fleet, DLA, weapon system, and personal categories.
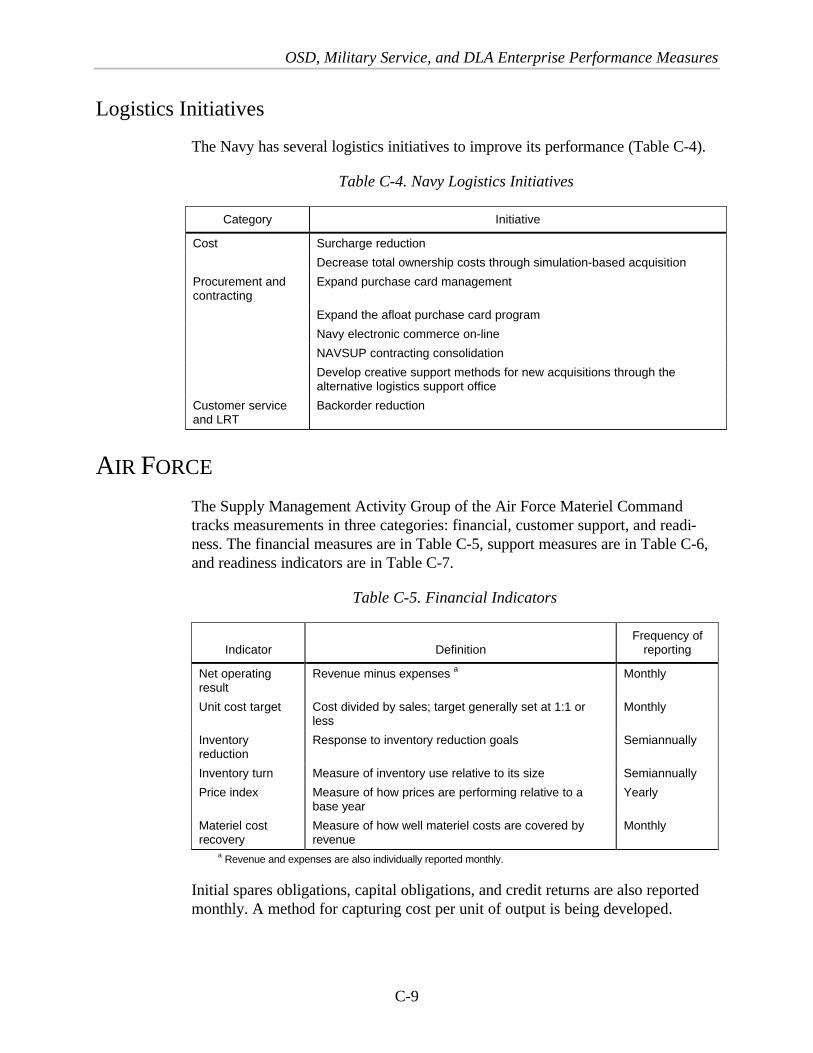
OSD, Military Service, and DLA Enterprise Performance Measures
C-9
Logistics Initiatives
The Navy has several logistics initiatives to improve its performance (Table C-4).
Table C-4. Navy Logistics Initiatives
Category Initiative
Cost Surcharge reduction
Decrease total ownership costs through simulation-based acquisition
Procurement andcontracting
Expand purchase card management
Expand the afloat purchase card program
Navy electronic commerce on-line
NAVSUP contracting consolidation
Develop creative support methods for new acquisitions through thealternative logistics support office
Customer serviceand LRT
Backorder reduction
AIR FORCE
The Supply Management Activity Group of the Air Force Materiel Commandtracks measurements in three categories: financial, customer support, and readi-ness. The financial measures are in Table C-5, support measures are in Table C-6,and readiness indicators are in Table C-7.
Table C-5. Financial Indicators
Indicator DefinitionFrequency of
reporting
Net operatingresult
Revenue minus expenses a Monthly
Unit cost target Cost divided by sales; target generally set at 1:1 orless
Monthly
Inventoryreduction
Response to inventory reduction goals Semiannually
Inventory turn Measure of inventory use relative to its size Semiannually
Price index Measure of how prices are performing relative to abase year
Yearly
Materiel costrecovery
Measure of how well materiel costs are covered byrevenue
Monthly
a Revenue and expenses are also individually reported monthly.
Initial spares obligations, capital obligations, and credit returns are also reportedmonthly. A method for capturing cost per unit of output is being developed.
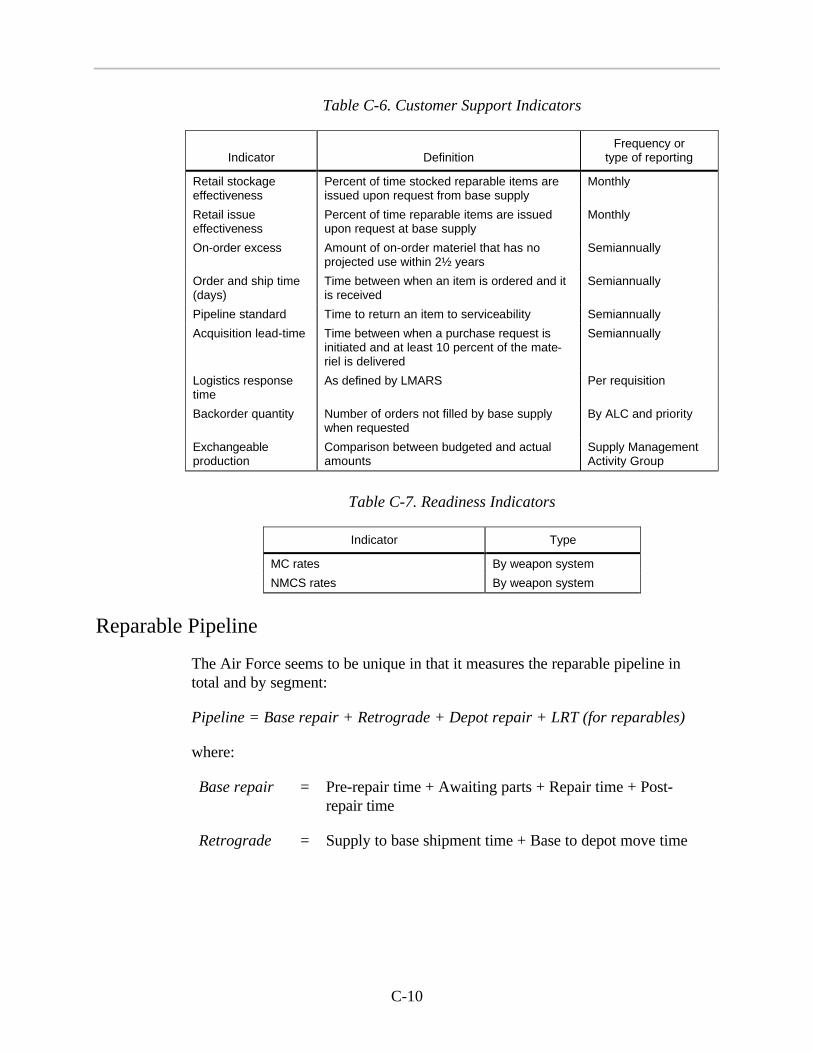
C-10
Table C-6. Customer Support Indicators
Indicator DefinitionFrequency or
type of reporting
Retail stockageeffectiveness
Percent of time stocked reparable items areissued upon request from base supply
Monthly
Retail issueeffectiveness
Percent of time reparable items are issuedupon request at base supply
Monthly
On-order excess Amount of on-order materiel that has noprojected use within 2½ years
Semiannually
Order and ship time(days)
Time between when an item is ordered and itis received
Semiannually
Pipeline standard Time to return an item to serviceability Semiannually
Acquisition lead-time Time between when a purchase request isinitiated and at least 10 percent of the mate-riel is delivered
Semiannually
Logistics responsetime
As defined by LMARS Per requisition
Backorder quantity Number of orders not filled by base supplywhen requested
By ALC and priority
Exchangeableproduction
Comparison between budgeted and actualamounts
Supply ManagementActivity Group
Table C-7. Readiness Indicators
Indicator Type
MC rates By weapon system
NMCS rates By weapon system
Reparable Pipeline
The Air Force seems to be unique in that it measures the reparable pipeline intotal and by segment:
Pipeline = Base repair + Retrograde + Depot repair + LRT (for reparables)
where:
Base repair = Pre-repair time + Awaiting parts + Repair time + Post-repair time
Retrograde = Supply to base shipment time + Base to depot move time

OSD, Military Service, and DLA Enterprise Performance Measures
C-11
Depot repair = DLA reparable processing time + Total shop repair time+ DLA serviceable processing time
LRT = Base requisition time + Depot asset release time + DLAshipment processing time + Depot to base move time.
Systems
The Pipeline Tracking Analysis and Metrics System (PTAMS) is a new systembeing developed for the Air Force by the Navy. It will replace several visibility andtracking systems, incorporate the best functionality of these systems, and removethe data duplication caused by operating several systems. PTAMS will allow a userto perform custom data queries and the ALCs and major commands to view thedata to the NSN level.
Logistics Initiatives
The Air Force Materiel Command has begun the following logistics initiatives toimprove its performance:
u Lean logistics pipeline reduction
u Acquisition lead-time reduction
u Maintain and improve economic retention policy
u Reduce repair backlog
u Reduce cost of operations
u Maintain and improve the contract and depot repair enhancementprograms
u Ensure functions of the contract repair enhancement program mirror thefunctions of the depot repair enhancement program
u Implement and support Joint TAV
u Realign materiel management responsibilities
u Implement and support seamless supply chain management
u Identify and implement alternative inventory management businessprocesses
u Develop and implement PTAMS.
C-12
MARINE CORPS
The Marine Corps is in the early stages of developing its performance measure-ment system as part of the Precision Logistics program. Although metrics havebeen used for several years to examine logistics performance, the Marine Corps isbringing the metrics together and displaying them on a Web site to provide an un-derstanding of logistics behavior. The system generally focuses on three metrics:fill rate, order-ship time, and repair cycle time.
Fill rate is measured at the retail level. When all items to complete an equipmentrepair order are available, it is considered filled. If an item has to be backordered,the equipment repair order is considered not filled. Hence, this metric is more di-rectly tied to maintenance of a weapon system than is general supply availability.Order-ship times are identified by wholesale and retail levels as well as by organi-zation and process segment.
DEFENSE LOGISTICS AGENCY
Performance monitoring has been a consistent feature of DLA performance man-agement. To achieve timely and accurate performance measurement, DLA insti-tuted the Director’s Quarterly Review and Analysis to provide a periodic review ofperformance and relate it to the goals and objectives in the DLA Strategic Plan.
DLA defines a performance goal as “a target level of performance expressed as atangible, measurable objective, against which actual achievement can be compared,including a goal expressed as a quantitative standard, value, or rate.” DLA uses aperformance measurement system that is based on the goals and targets that setforth in its strategic plan. The plan includes the following five strategic goals:
u Consistently provide responsive, best-value supplies and services tocustomers
u Serve as a catalyst for the revolution in business affairs and acquisition re-form
u Ensure the workforce is enabled to deliver and sustain world-classperformance
u Rapidly exploit technology to provide agile, responsive, interoperablesolutions
u Aggressively pursue partnerships with industry and suppliers.
OSD, Military Service, and DLA Enterprise Performance Measures
C-13
DLA Definitions
The following definitions describe DLA’s interpretation of goals, objectives, meas-urements, indicators, and targets:
u General goal. This goal defines how an agency will carry out its mission.The goal is expressed in a manner that allows a future assessment to de-termine if the goal was or is being achieved. The goal may have a pro-grammatic, policy, or management nature. General goals are predominatelyoutcome-oriented.
u General objective. Objectives are paired with a general goal and can beused to assess if a general goal was or is being achieved. An objective usu-ally describes a more specific level of achievement than a general goal.
u Outcome measure. An assessment of the result of a program activity com-pared to its intended purpose.
u Output measure. The tabulation, calculation, or recording of activity oreffort and expressed in a quantitative or qualitative manner.
u Performance indicator. A value or characteristic to measure an output oroutcome. Performance indicators are associated with performance targetsor goals.
u Performance target. Used by DLA to differentiate between DLA strategicgoals (that relate to the Office of Management and Budget’s definition ofgeneral goals and objectives) and the supporting measures that appear inperformance plans and long-range business plans; sometimes called a per-formance goal.
Metric Example
DLA uses the following format for each metric that depicts the goal-objective re-lationship, identifies issues and concerns, and presents current status (Figure C-2).The example presents information on Goal 1, Objective 1, which is to “exceed a 95percent reliability rate for on-time products and services by FY 2000.” Each DLAstrategic goal is linked to a goal in the DoD Logistics Strategic Plan.

C-14
Figure C-2. DLA Metric Example
Goal: 1 Day
Avg. Days
Issues and Concerns
• Goal for routine requisitions changed from4 days in FY97 to l day in FY98
• Process and data measurement will improvewith implementation of DSS
• DSS will capture response time in hours byFY98; distribution MIS will report time in hoursby FY990
0.5
1
1.5
2
2.5
OctDec Feb Apr
Jun
Aug
LRT
Goal: 1 Day
Avg. Days
Depot Logistics Response TimeHigh-Priority
0
0.3
0.6
0.9
1.2
1.5
OctDec
Feb Apr Jun
Aug
LRT
Depot Logistics Response TimeRoutine
DLA Goal Consistently provide responsive,best-value supplies and servicesto our customers
DLA Objective 1.1 Exceed a 95% reliability rate foron-time products and services by2000
DLA PerformanceContract Measure
The average depot processingLRT for both high-priority androutine requisitions during FY98is less than 1 day. In FY99 thegoal will remain less than 1 day.
DoD LogisticsStrategic PlanGoal 1.1
Reduce LRT to 18 days byFebruary 2000
Note: DSS = Distribution Standard System.
Table C-8 lists the 35 indicators that DLA uses to track its performance as pre-sented in the DLA FY97 Performance Report. The indicators are snapshots ofDLA’s performance in accordance with GPRA requirements; in addition, someperformance indicators are being developed. The table presents the indicator andthe associated business (e.g., Defense Logistics Support Command [DLSC], De-fense Reutilization and Marketing Service [DRMS], DLIS, Defense NationalStockpile Center [DNSC], Defense Distribution Center, Defense Contract Man-agement Command [DCMC]). Additionally, it presents the target goal for FY97and the performance level achieved. Table C-9 presents DLA’s definitions of theperformance indicators.
Table C-8. FY97 Performance
Indicator Business Target Actual
Customer complaints Distribution 0.50% 0.38%
Customer price change Supply (non-fuels) –2.1% –2.1%
Customer satisfaction DLSC 65% 79%
Customer satisfaction rating (right reception) DCMC 4.0 5.3
Disposal release order processing time Distribution ≤21 days 2.17 days
Disposal unit cost (hazardous item) DRMS $219.57 $265.06
Disposal unit cost (nonhazardous) DRMS $0.47 $0.46

OSD, Military Service, and DLA Enterprise Performance Measures
C-15
Table C-8. FY97 Performance (Continued)
Indicator Business Target Actual
DLIS percent of real-time inquiries completedwithin 2 seconds
DLIS 90% 95%
DLIS processing time (batch inquiries) DLIS ≤18 hours 11.17hours
DLIS publications on-time distribution DLIS 99.1% 99.8%
DNSC sale revenue (less diamonds) DNSC $273million
$478.2million
Increase acquisition planning and request forproposal review participation (right advice)
DCMC 175reviews
185reviews
Increase conforming items (right item) DCMC TBD 99%
Increase cost savings and avoidances return oninvestment (right price)
DCMC 4.85 to 1 4.62 to 1
Increase on-time contractor delivery (right time) DCMC 5% TBD
Inventory value (active) Supply (non-fuels) TBD $5.0billion
Inventory value (inactive) Supply (non-fuels) TBD $3.1billion
Logistics response time (ICP delayed issues) Supply (non-fuels) TBD 91 days
Logistics response time (ICP immediate issues) Supply (non-fuels) 1 day 1 day
Logistics response time (MRO processing—high-priority)
Distribution ≤1 day 0.72 days
Logistics response time (MRO processing—routine)
Distribution ≤4 days 2.17 days
Logistics response time (planned direct vendordeliveries)
Supply (non-fuels) TBD 20 days
Product availability Supply (fuels) 90% 100%
Product conformance Supply (non-fuels) 95% 95%
Return on investment DRMS 3% 3.6%
Reutilization, transfer, and donation ratio DRMS 17.5% 17.9%
Right efficiency (measure under development) DCMC TBD TBD
Sample inventory accuracy Distribution 92% 66.2% to97.13%
Space utilization Distribution 85% 69%
Stock availability Supply (non-fuels) 85% 85.7%
Unit cost Supply (non-fuels) $0.90 $0.98
Unit cost (covered storage) Distribution $7.17 $5.48
Unit cost (open storage) Distribution $0.75 $0.67
Unit cost (receiving and shipping) Distribution $18.48 $23.57
Unit cost per barrel Supply (fuels) $32.54 $30.36
Note: TBD = to be determined.

C-16
Table C-9. Metric Definitions
Indicator Definition
Customer complaints Percentage based on the number of valid reports of discrepancies received andthe number of MROs shipped
Customer pricechange
Change in customer price expressed as a percentage; the difference in price(standard price) charged for an item from one year to the next (not applicable tofuels, subsistence sales to the Defense Commissary Agency, and items nothaving a standard price, e.g., local purchase items); the customer price changeis a measure of DLA’s supply management and financial performance to itsexternal customers
Customer satisfaction Customer satisfaction based on survey data (the percentage of customers sat-isfied with DLA services and products)
Customer satisfactionrating (right reception)
Average program manager and procuring contracting officer ratings based on ascale of 1 (totally dissatisfied) to 6 (completely satisfied); the survey questionsgenerally relate to the quality and timeliness of support DCMC provides inproduct conformance, product delivery, product cost, advice, and overall sup-port
Disposal release orderprocessing time
Average number of calendar days for depots to process and ship disposal re-lease orders; metric measures the time between when the depot receives thedisposal release order and the time transportation ships the materiel
Disposal unit cost(hazardous item)
Cost per line to operate the environmental (hazardous) program; calculated bydividing the environmental operating cost by the line items of hazardous wastedisposed by service contract
Disposal unit cost(nonhazardous)
Cost per dollar of proceeds realized from the reutilization, transfer, donations,and sales of nonhazardous materiel; metric calculated by dividing the cost ofoperating the program by the workload; workload is defined as a portion of theacquisition value of property that is disposed plus total sales proceeds
DLIS percent ofreal-time inquiriescompleted within2 seconds
Time for customers to process their Federal Logistics Information Systems on-line transactions through the DLSC Logistics On-line Access System; ex-pressed as the percent of the number of monthly transactions processed within2 seconds; metric is inclusive of queries and updates and accounts for simpleand complex transactions
DLIS processing time(batch inquiries)
Transaction response time for system inquires, expressed as a monthly aver-age of the processing times; the types of transactions that enter the systemthrough the batch process are routine maintenance of segment data or dataelements; database queries, such as data retrieval and provisioning screening;andrequests for NSN assignments for new items entering the supply system
DLIS publications on-time distribution
Percent of publications distributed on time; some products are producedmonthly, bimonthly, semiannually, and annually; the metric measures DLIS’sability to distribute the publications according to schedule
DNSC sales revenue(less diamonds)
Estimated revenue expected to be generated by the sale of assets (other thandiamonds) held in the DNSC inventory; measure is one factor to determine thesuccess of the public offering of strategic assets
Increase acquisitionplanning and requestfor proposal reviewparticipation (rightadvice)
Measure of DCMC acquisition activity, including participation in acquisitionstrategy panels and other acquisition planning meetings as well as review ofacquisition planning documents; metric tracks the quantity of requests receivedfrom customer buying activities to participate in acquisition planning or requestfor proposal
Increase conformingitems (right item)
Measure of items that satisfy contract requirements; metric tracks items foundusable following lab testing as a percentage of all items lab-tested
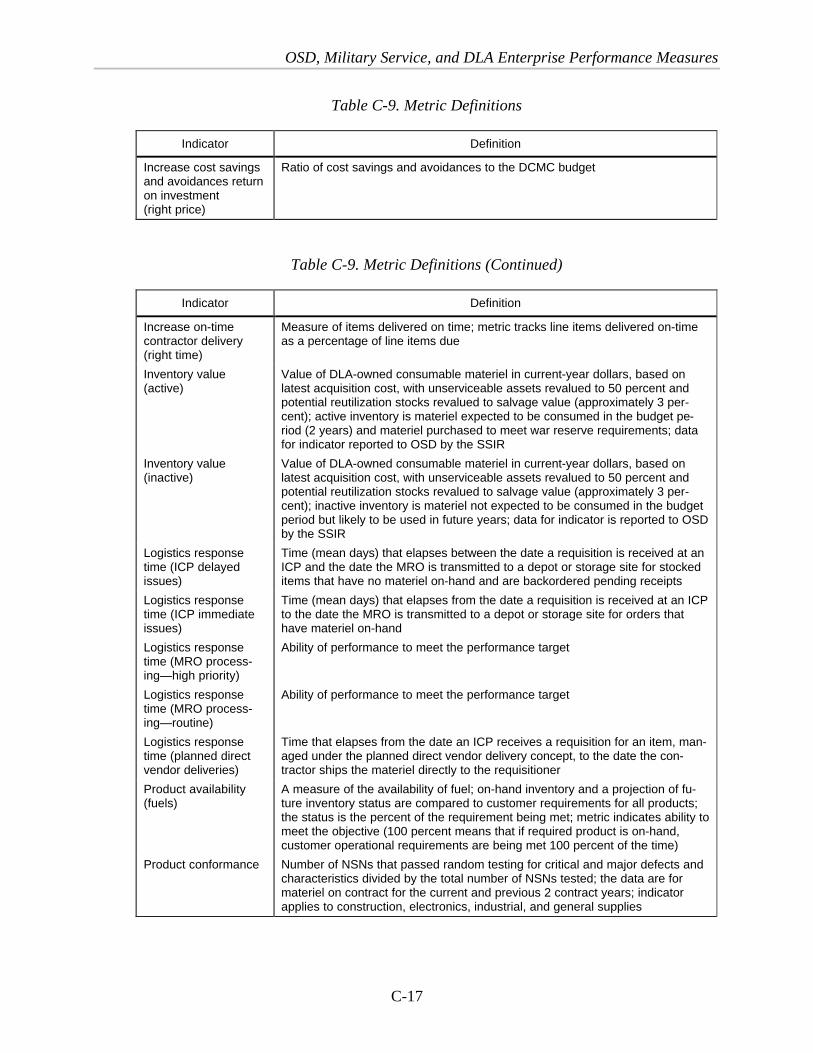
OSD, Military Service, and DLA Enterprise Performance Measures
C-17
Table C-9. Metric Definitions
Indicator Definition
Increase cost savingsand avoidances returnon investment(right price)
Ratio of cost savings and avoidances to the DCMC budget
Table C-9. Metric Definitions (Continued)
Indicator Definition
Increase on-timecontractor delivery(right time)
Measure of items delivered on time; metric tracks line items delivered on-timeas a percentage of line items due
Inventory value(active)
Value of DLA-owned consumable materiel in current-year dollars, based onlatest acquisition cost, with unserviceable assets revalued to 50 percent andpotential reutilization stocks revalued to salvage value (approximately 3 per-cent); active inventory is materiel expected to be consumed in the budget pe-riod (2 years) and materiel purchased to meet war reserve requirements; datafor indicator reported to OSD by the SSIR
Inventory value(inactive)
Value of DLA-owned consumable materiel in current-year dollars, based onlatest acquisition cost, with unserviceable assets revalued to 50 percent andpotential reutilization stocks revalued to salvage value (approximately 3 per-cent); inactive inventory is materiel not expected to be consumed in the budgetperiod but likely to be used in future years; data for indicator is reported to OSDby the SSIR
Logistics responsetime (ICP delayedissues)
Time (mean days) that elapses between the date a requisition is received at anICP and the date the MRO is transmitted to a depot or storage site for stockeditems that have no materiel on-hand and are backordered pending receipts
Logistics responsetime (ICP immediateissues)
Time (mean days) that elapses from the date a requisition is received at an ICPto the date the MRO is transmitted to a depot or storage site for orders thathave materiel on-hand
Logistics responsetime (MRO process-ing—high priority)
Ability of performance to meet the performance target
Logistics responsetime (MRO process-ing—routine)
Ability of performance to meet the performance target
Logistics responsetime (planned directvendor deliveries)
Time that elapses from the date an ICP receives a requisition for an item, man-aged under the planned direct vendor delivery concept, to the date the con-tractor ships the materiel directly to the requisitioner
Product availability(fuels)
A measure of the availability of fuel; on-hand inventory and a projection of fu-ture inventory status are compared to customer requirements for all products;the status is the percent of the requirement being met; metric indicates ability tomeet the objective (100 percent means that if required product is on-hand,customer operational requirements are being met 100 percent of the time)
Product conformance Number of NSNs that passed random testing for critical and major defects andcharacteristics divided by the total number of NSNs tested; the data are formateriel on contract for the current and previous 2 contract years; indicatorapplies to construction, electronics, industrial, and general supplies
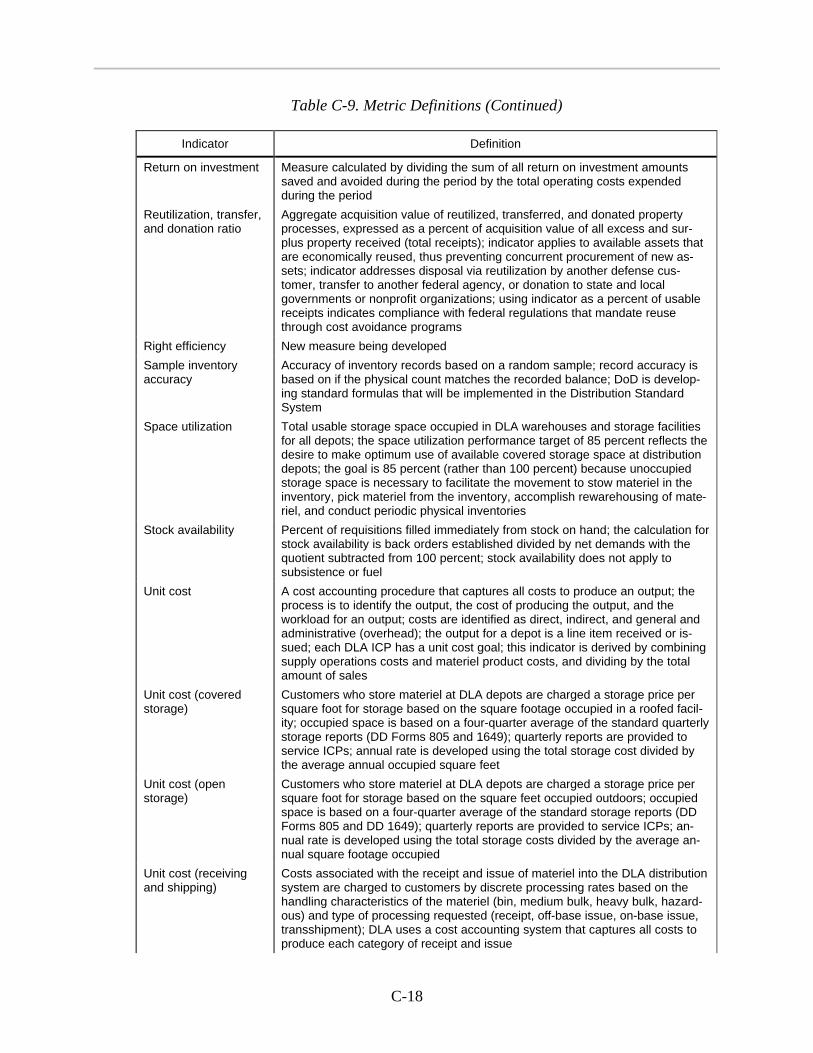
C-18
Table C-9. Metric Definitions (Continued)
Indicator Definition
Return on investment Measure calculated by dividing the sum of all return on investment amountssaved and avoided during the period by the total operating costs expendedduring the period
Reutilization, transfer,and donation ratio
Aggregate acquisition value of reutilized, transferred, and donated propertyprocesses, expressed as a percent of acquisition value of all excess and sur-plus property received (total receipts); indicator applies to available assets thatare economically reused, thus preventing concurrent procurement of new as-sets; indicator addresses disposal via reutilization by another defense cus-tomer, transfer to another federal agency, or donation to state and localgovernments or nonprofit organizations; using indicator as a percent of usablereceipts indicates compliance with federal regulations that mandate reusethrough cost avoidance programs
Right efficiency New measure being developed
Sample inventoryaccuracy
Accuracy of inventory records based on a random sample; record accuracy isbased on if the physical count matches the recorded balance; DoD is develop-ing standard formulas that will be implemented in the Distribution StandardSystem
Space utilization Total usable storage space occupied in DLA warehouses and storage facilitiesfor all depots; the space utilization performance target of 85 percent reflects thedesire to make optimum use of available covered storage space at distributiondepots; the goal is 85 percent (rather than 100 percent) because unoccupiedstorage space is necessary to facilitate the movement to stow materiel in theinventory, pick materiel from the inventory, accomplish rewarehousing of mate-riel, and conduct periodic physical inventories
Stock availability Percent of requisitions filled immediately from stock on hand; the calculation forstock availability is back orders established divided by net demands with thequotient subtracted from 100 percent; stock availability does not apply tosubsistence or fuel
Unit cost A cost accounting procedure that captures all costs to produce an output; theprocess is to identify the output, the cost of producing the output, and theworkload for an output; costs are identified as direct, indirect, and general andadministrative (overhead); the output for a depot is a line item received or is-sued; each DLA ICP has a unit cost goal; this indicator is derived by combiningsupply operations costs and materiel product costs, and dividing by the totalamount of sales
Unit cost (coveredstorage)
Customers who store materiel at DLA depots are charged a storage price persquare foot for storage based on the square footage occupied in a roofed facil-ity; occupied space is based on a four-quarter average of the standard quarterlystorage reports (DD Forms 805 and 1649); quarterly reports are provided toservice ICPs; annual rate is developed using the total storage cost divided bythe average annual occupied square feet
Unit cost (openstorage)
Customers who store materiel at DLA depots are charged a storage price persquare foot for storage based on the square feet occupied outdoors; occupiedspace is based on a four-quarter average of the standard storage reports (DDForms 805 and DD 1649); quarterly reports are provided to service ICPs; an-nual rate is developed using the total storage costs divided by the average an-nual square footage occupied
Unit cost (receivingand shipping)
Costs associated with the receipt and issue of materiel into the DLA distributionsystem are charged to customers by discrete processing rates based on thehandling characteristics of the materiel (bin, medium bulk, heavy bulk, hazard-ous) and type of processing requested (receipt, off-base issue, on-base issue,transshipment); DLA uses a cost accounting system that captures all costs toproduce each category of receipt and issue

OSD, Military Service, and DLA Enterprise Performance Measures
C-19
Table C-9. Metric Definitions (Continued)
Indicator Definition
Unit cost per barrel Cost per net barrel sold; the unit cost per barrel of fuel is equal to the projectedcosts (materiel, materiel related, and operations) divided by the number of bar-rels projected to be sold; credit barrels have a separate unit cost that is equal tothe standard price

C-20
Table C-10 matches LMI’s recommended enterprise metrics with the metrics DLAuses.
Table C-10. Metric Matching
PerspectiveRecom-
mended keysupply-chainmanagement
metricCustomer
satisfaction Cost
Readinessand
sustainability Possible DLA metric equivalents
Supply chainresponsetime
X Can be obtained from several measure-ments; LRT metrics in DLA performancereport include LRT (ICP immediate issues),LRT (ICP delayed issue), LRT (plannedDVD), LRT (MRO processing—high-priority), LRT (MRO processing); data canbe obtained from DAAS; other sources in-clude PLT and ALT from Standard Auto-mated Materiel Management System
Perfect orderfulfillment
X Can be obtained from several measure-ments, including DCMC’s customer satis-faction rating (DCMC’s role in getting theright item, getting it at the right time, gettingthe right price, and providing the right ad-vice), customer complaints (reports of dis-crepancies, although discrepancies lessthan $100 are not reported), and metrics onmeeting required delivery dates
WeaponsystemNMCS rates
X Weapon system supply availability rates,stock availability rates, and fill rates
Upside pro-ductionflexibility
X Metric needs to be developed; however, theICIS model is a good candidate source forthe data
Total supplychain man-agementcosts as apercent ofsales
X Unit cost equivalents include unit cost (re-ceiving and shipping), unit cost (coveredstorage), and unit cost (open storage);some information on operations and mate-riel costs can be obtained from DLA over-head costs
War reserveratio
X Metric needs to be developed; ICIS modelcould be a source
Net asset(inventory)turns
X Metric tracked by DLA

OSD, Military Service, and DLA Enterprise Performance Measures
C-21

D-1
Appendix D Process Performance Measures
PLAN
Process metrics provide another level of drilldown; each metric provides diagnos-tics for a functional metric. The SCOR model facilitates this drilldown by identi-fying many processes to perform the planning function. Figure D-1 captures theprocesses used in the plan function.
Figure D-1. SCOR Process Model: Plan Supply Chain
Balance supply chain resourceswith requirements Establish supply chain plans
P1.3 P1.4
Identify, prioritize, and aggregatesupply chain requirements
Identify, assess, and aggregatesupply chain resources
P1.1
P1.2
The first step is determining current requirements and estimating them for thenear future. Pipeline assets, those already in the system and those planned, are ag-gregated and applied to the requirements. The assets typically are separated intothe categories of on-hand inventory, in maintenance (or waiting to be inducted),or in procurement (a vendor contract has been signed or is being developed).
In addition to balancing assets and requirements, the plan function has the respon-sibility for examining long-term supply chain requirements and configuration.Figure D-2 shows the processes used to create supply chain infrastructure.
Figure D-2. SCOR Process Model: Plan Infrastructure
Perform make-buydecision-making
Reconfigure thesupply chain
Perform long-termcapacity and
resource planning
Manage productline plans
Manageplanning data
Perform supply chainbenchmarking
Perform businessplanning
P0.1 P0.2 P0.3 P0.4
P0.5 P0.6 P0.7

D-2
For the deficit ratio, metrics can be divided along a time horizon (to identify themagnitude of a potential problem) and pipeline position (to identify the locationof a potential problem). Table D-1 shows the deficit ratio process metrics.
Table D-1. Deficit Ratio Process Performance Measures
Process metric Planning process Process element
Deficit ratio Plan supply chain Balance supply chain resources with requirements
Under-induction intomaintenance
Plan supply chain Balance supply chain resources with requirements
Over-induction intomaintenance
Plan supply chain Balance supply chain resources with requirements
Deficit on contract Plan supply chain Balance supply chain resources with requirements
Deficit in commitment Plan supply chain Balance supply chain resources with requirements
Forecast accuracy Plan supply chain Aggregate supply chain requirements
Percent assets notcounted
Plan supply chain Identify supply chain resources
Components of inventory holding cost provide diagnostics for this importantmetric (Table D-2).
Table D-2. Holding Cost Process Performance Measures
Process metric Planning process Process element
Obsolete inventory Plan supply chain Balance supply chain resources with requirements
Inventory loss Plan supply chain Balance supply chain resources with requirements
Inventory storagecosts
Plan supply chain Balance supply chain resources with requirements
Overage diagnostics (Table D-3) identify the location of pipeline excesses. Thefunctional metrics determine if the overage begins in the current year or in fore-casted years. For current-year overages, process metrics determine the pipelinelocation of the excesses. Two metrics of inapplicable assets help to determine ifexcesses are being introduced unnecessarily into the pipeline during procurement.
Table D-3. Overage Process Performance Measures
Process metric Planning process Process element
Overage Plan supply chain Balance supply chain resources with supply chainrequirements
Inapplicable asset oncontract
Plan supply chain Balance supply chain resources with supply chainrequirements
Inapplicable assetsin commitment
Plan supply chain Balance supply chain resources with supply chainrequirements

Process Performance Measures
D-3
SOURCE
Process Metrics
One of the primary responsibilities of source (materiel acquisition) may beviewed in terms of the kind of materiel that is sourced: stocked, make-to-order,and engineer-to-order materiel. Secondary items, the subject of this report, arestocked or make-to-order materiel (because stocked and make-to-order materielhave the same processes, this report refers to only stocked materiel in discussingsecondary items in this section). SCOR represents these processes in Figure D-3.
Figure D-3. SCOR Process Model: Source Stocked Items
S1.1 S1.2 S1.3
Schedule materieldeliveries
Receive and verifymateriel
Transfer materiel(put away)
Before sourcing can occur, the infrastructure needs to be in place. SCOR repre-sents the processes involved with managing the source infrastructure inFigure D-4. Metrics for source infrastructure and source stocked product are proc-ess metrics and provide diagnostic insight to the functional metrics. If the resultsof the functional metrics are not acceptable to the managers of the source func-tion, they would examine the process metrics to determine the underlying causesfor the unacceptable results. Process metrics may be diagnostic to more than onefunctional metric.
Figure D-4. SCOR Process Model: Source Infrastructure
Establish newmateriel
S0.8
S0.3
S0.4 S0.5 S0.7S0.6
S0.10S0.9
Establish newsource
Managevendor
agreements
Maintain sourceplanning and
execution data
Manageincoming
freight
Managevendor
certification
Managesource
business rules
Authorizevendor
payment
Determineemergingsupplier
technologies
Managematerielinventory
S0.1 S0.2
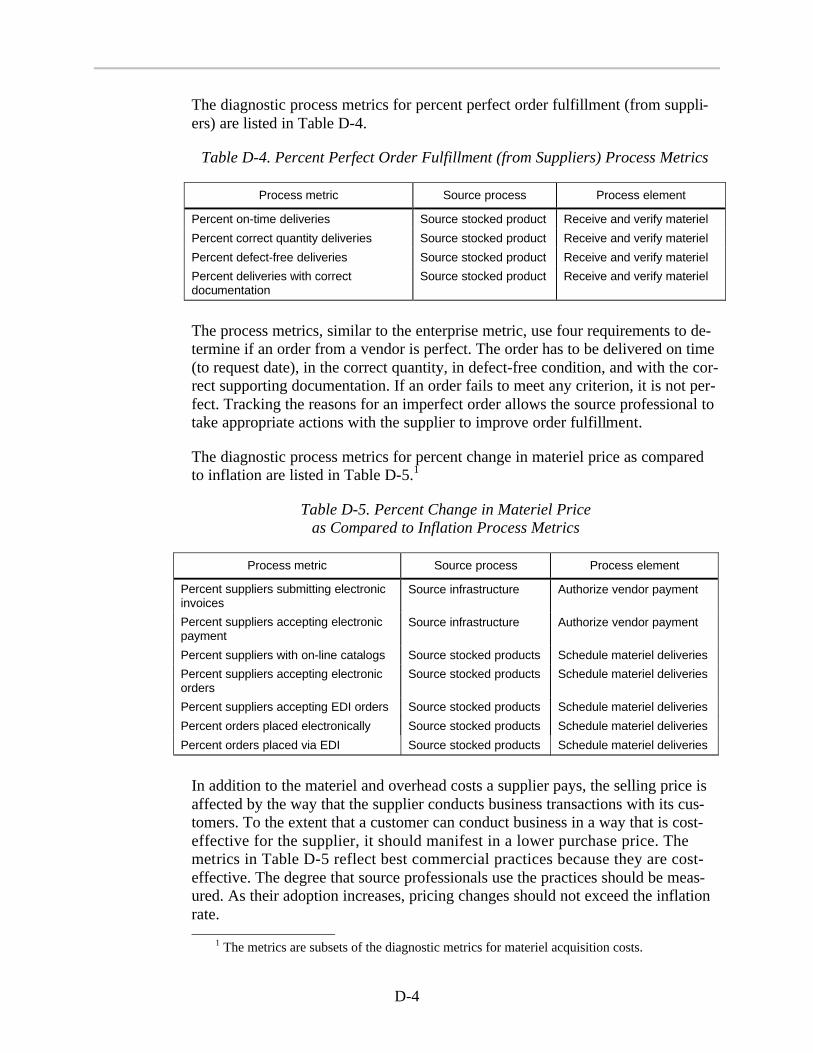
D-4
The diagnostic process metrics for percent perfect order fulfillment (from suppli-ers) are listed in Table D-4.
Table D-4. Percent Perfect Order Fulfillment (from Suppliers) Process Metrics
Process metric Source process Process element
Percent on-time deliveries Source stocked product Receive and verify materiel
Percent correct quantity deliveries Source stocked product Receive and verify materiel
Percent defect-free deliveries Source stocked product Receive and verify materiel
Percent deliveries with correctdocumentation
Source stocked product Receive and verify materiel
The process metrics, similar to the enterprise metric, use four requirements to de-termine if an order from a vendor is perfect. The order has to be delivered on time(to request date), in the correct quantity, in defect-free condition, and with the cor-rect supporting documentation. If an order fails to meet any criterion, it is not per-fect. Tracking the reasons for an imperfect order allows the source professional totake appropriate actions with the supplier to improve order fulfillment.
The diagnostic process metrics for percent change in materiel price as comparedto inflation are listed in Table D-5.1
Table D-5. Percent Change in Materiel Priceas Compared to Inflation Process Metrics
Process metric Source process Process element
Percent suppliers submitting electronicinvoices
Source infrastructure Authorize vendor payment
Percent suppliers accepting electronicpayment
Source infrastructure Authorize vendor payment
Percent suppliers with on-line catalogs Source stocked products Schedule materiel deliveries
Percent suppliers accepting electronicorders
Source stocked products Schedule materiel deliveries
Percent suppliers accepting EDI orders Source stocked products Schedule materiel deliveries
Percent orders placed electronically Source stocked products Schedule materiel deliveries
Percent orders placed via EDI Source stocked products Schedule materiel deliveries
In addition to the materiel and overhead costs a supplier pays, the selling price isaffected by the way that the supplier conducts business transactions with its cus-tomers. To the extent that a customer can conduct business in a way that is cost-effective for the supplier, it should manifest in a lower purchase price. Themetrics in Table D-5 reflect best commercial practices because they are cost-effective. The degree that source professionals use the practices should be meas-ured. As their adoption increases, pricing changes should not exceed the inflationrate.
1 The metrics are subsets of the diagnostic metrics for materiel acquisition costs.
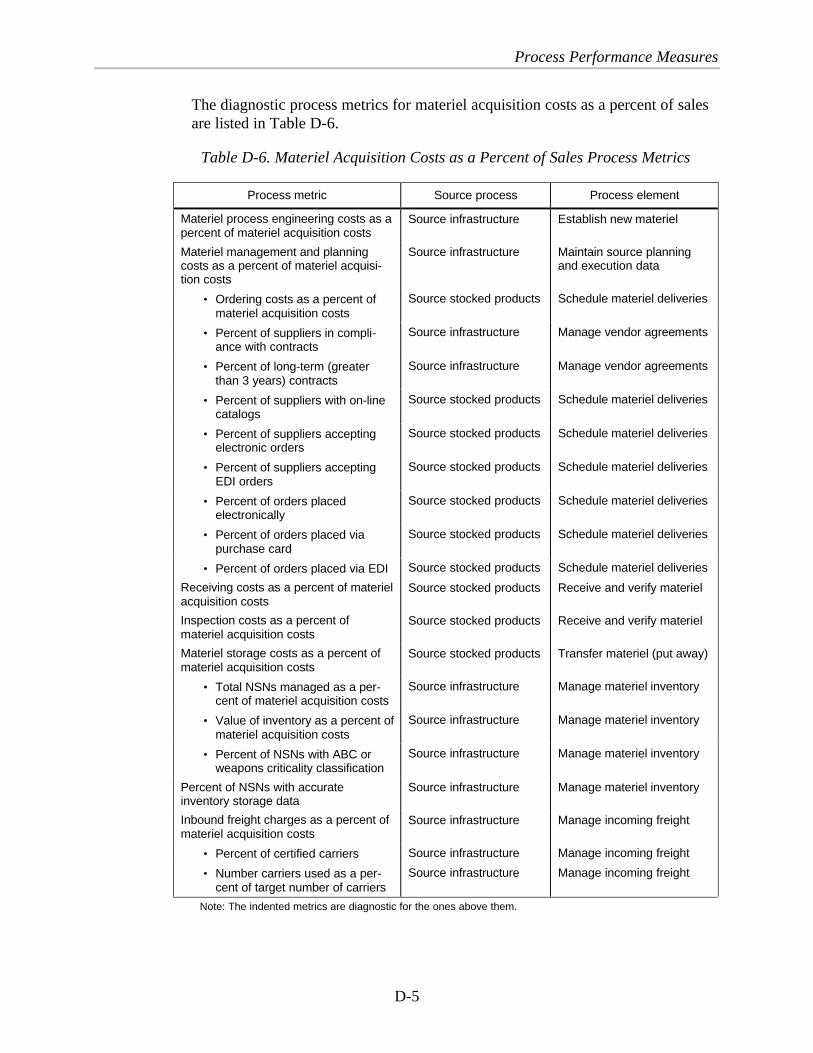
Process Performance Measures
D-5
The diagnostic process metrics for materiel acquisition costs as a percent of salesare listed in Table D-6.
Table D-6. Materiel Acquisition Costs as a Percent of Sales Process Metrics
Process metric Source process Process element
Materiel process engineering costs as apercent of materiel acquisition costs
Source infrastructure Establish new materiel
Materiel management and planningcosts as a percent of materiel acquisi-tion costs
Source infrastructure Maintain source planningand execution data
• Ordering costs as a percent ofmateriel acquisition costs
Source stocked products Schedule materiel deliveries
• Percent of suppliers in compli-ance with contracts
Source infrastructure Manage vendor agreements
• Percent of long-term (greaterthan 3 years) contracts
Source infrastructure Manage vendor agreements
• Percent of suppliers with on-linecatalogs
Source stocked products Schedule materiel deliveries
• Percent of suppliers acceptingelectronic orders
Source stocked products Schedule materiel deliveries
• Percent of suppliers acceptingEDI orders
Source stocked products Schedule materiel deliveries
• Percent of orders placedelectronically
Source stocked products Schedule materiel deliveries
• Percent of orders placed viapurchase card
Source stocked products Schedule materiel deliveries
• Percent of orders placed via EDI Source stocked products Schedule materiel deliveries
Receiving costs as a percent of materielacquisition costs
Source stocked products Receive and verify materiel
Inspection costs as a percent ofmateriel acquisition costs
Source stocked products Receive and verify materiel
Materiel storage costs as a percent ofmateriel acquisition costs
Source stocked products Transfer materiel (put away)
• Total NSNs managed as a per-cent of materiel acquisition costs
Source infrastructure Manage materiel inventory
• Value of inventory as a percent ofmateriel acquisition costs
Source infrastructure Manage materiel inventory
• Percent of NSNs with ABC orweapons criticality classification
Source infrastructure Manage materiel inventory
Percent of NSNs with accurateinventory storage data
Source infrastructure Manage materiel inventory
Inbound freight charges as a percent ofmateriel acquisition costs
Source infrastructure Manage incoming freight
• Percent of certified carriers Source infrastructure Manage incoming freight
• Number carriers used as a per-cent of target number of carriers
Source infrastructure Manage incoming freight
Note: The indented metrics are diagnostic for the ones above them.

D-6
The SCOR model defines materiel acquisition costs as materiel management andplanning, supplier quality and engineering, inbound freight and duties, receivingand materiel storage, incoming inspection, materiel process engineering, andtooling costs. The metrics in Table D-6 assess the components of materiel acqui-sition costs. Measuring the components allows the source professional to identifycauses and take corrective action if managers determine that materiel acquisitioncosts are unacceptable.
The diagnostic process metric for surge volume identified as a percent of totalsurge volume is presented in Table D-7. This metric is needed because most con-tracts contain a surge clause. The requirement to demonstrate a surge capability(e.g., drills) should also be included in the contracts.
Table D-7. Surge Volume Identified as a Percent ofTotal Surge Volume Process Metric
Process metric Source process Process element
Number of supplier contracts with surgeclauses as a percent of total contracts
Source infrastructure Manage vendor agreements
The diagnostic process metrics for upside production flexibility—source are pre-sented in Table D-8. The metrics measure how effectively the source function cansatisfy the need for new materiel or the increased demand for existing materiel.They measure how well the source function manages the existing and potentialsupplier networks. A well-managed supplier network usually includes a certifica-tion program for its suppliers. Requirements and methods are established foridentifying and prequalifying backup suppliers for single-sourced materiel andmateriel that meet certain criteria (e.g., criticality, dollar investment, technologicalrequirements).
Table D-8. Upside Production Flexibility—Source Process Metrics
Process metric Source process Process element
Time (days) to identify a newsupplier
Source infrastructure Establish new source
Percent of prequalified suppliers Source infrastructure Establish new source
Percent of NSNs single-sourced Source infrastructure Manage materiel inventory
Percent of single-source suppliershaving backup suppliers
Source infrastructure Manage vendor agreements
Percent of certified suppliers Source infrastructure Manage vendor certification
Percent change in certified suppliers Source infrastructure Manage vendor certification

Process Performance Measures
D-7
MAINTAIN
Process Metrics
The SCOR processes for maintenance are depicted in Figure D-5. The relevantmaintenance metrics for the processes in Figure D-5 are diagnostic to the maintainfunctional metrics.
Figure D-5. SCOR Process Model: Maintain Stocked Product
Releaseproduct to
deliver
Schedulerepair
activities
M1.1 M1.2 M1.3 M1.4 M1.6M1.5
Issuemateriel
Repairand test
PackageStage
product
The process metric for performance to customer-request date—maintain is pre-sented in Table D-9. Schedule achievement compares the repair activity’s per-formance to its schedule. When repair customers place orders for repair,maintenance depots schedule the workload to be accomplished. The inability tocomply with the production schedule affects the depot’s ability to deliver repairedmateriel by the customer’s required delivery date.
Table D-9. Performance to Customer-Request Date—MaintainProcess Metric
Process metric Maintain process Process element
Schedule achievement Maintain stocked product Schedule repair activities
The process metrics for repair cycle time are listed in Table D-10. An importantmetric that affects repair cycle time is product and grade changeover time. As lotsizes are decreased, depots need to react quicker when orders are received. Thetimely availability of repair parts is measured by materiel requisition cycle time.One of the best supply chain practices is to position parts as close to the point ofconsumption as possible to reduce cycle time. The percent of parts delivered topoint of use metric captures progress in implementing the strategy. Finally, theratio of actual to theoretical cycle time measures how well the repair activity setsstandards and executes the workload.
Table D-10. Repair Cycle Time Process Metrics
Process metric Maintain process Process element
Product and grade changeover time Maintain stocked product Schedule repair activities
Materiel requisition cycle time Maintain stocked product Issue materiel
Percent of parts delivered to point of use Maintain stocked product Issue materiel
Ratio of actual to theoretical cycle time Maintain stocked product Repair and test
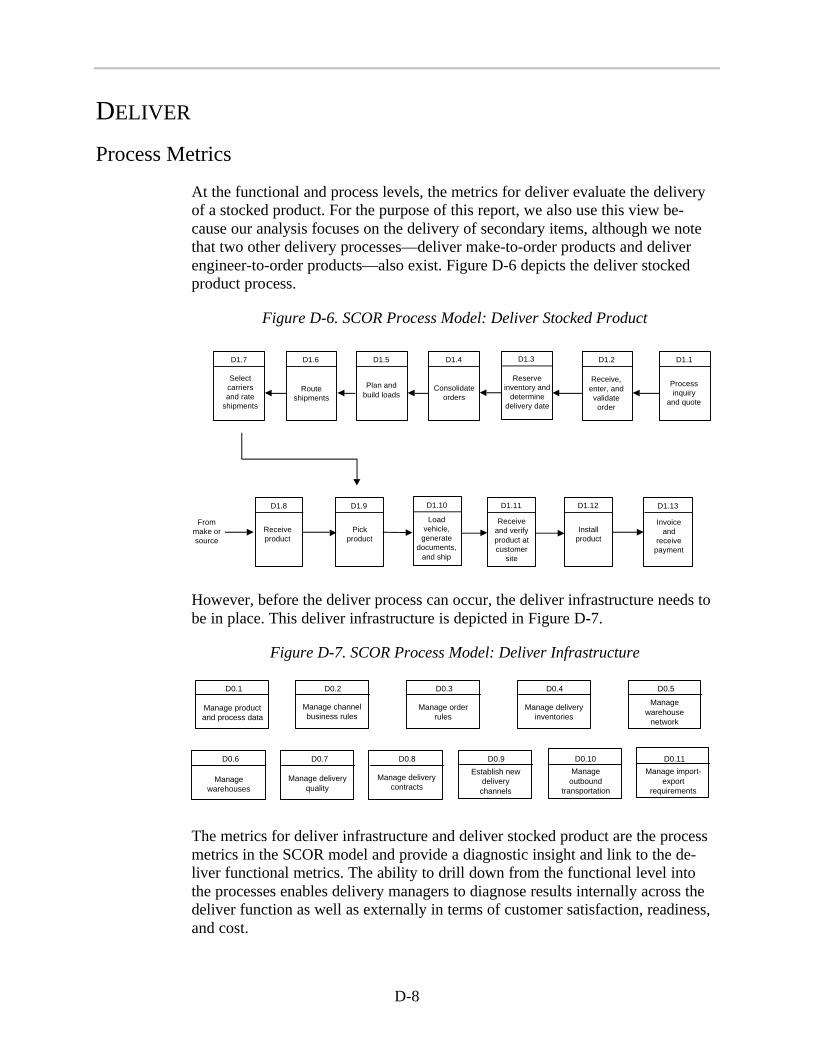
D-8
DELIVER
Process Metrics
At the functional and process levels, the metrics for deliver evaluate the deliveryof a stocked product. For the purpose of this report, we also use this view be-cause our analysis focuses on the delivery of secondary items, although we notethat two other delivery processes—deliver make-to-order products and deliverengineer-to-order products—also exist. Figure D-6 depicts the deliver stockedproduct process.
Figure D-6. SCOR Process Model: Deliver Stocked Product
D1.6 D1.5 D1.3 D1.2 D1.1
D1.8 D1.9 D1.10 D1.11 D1.12 D1.13
D1.4D1.7
Selectcarriersand rate
shipments
Processinquiry
and quote
Receive,enter, andvalidateorder
Reserveinventory and
determinedelivery date
Routeshipments
Plan andbuild loads
Consolidateorders
Receiveproduct
Pickproduct
Loadvehicle,
generatedocuments,
and ship
Receiveand verifyproduct atcustomer
site
Installproduct
Invoiceand
receivepayment
Frommake orsource
However, before the deliver process can occur, the deliver infrastructure needs tobe in place. This deliver infrastructure is depicted in Figure D-7.
Figure D-7. SCOR Process Model: Deliver Infrastructure
Manage productand process data
D0.1 D0.2 D0.4 D0.5
D0.6 D0.7 D0.8 D0.9 D0.10 D0.11
D0.3
Manage channelbusiness rules
Manage orderrules
Manage deliveryinventories
Managewarehouse
network
Managewarehouses
Establish newdelivery
channels
Manageoutbound
transportation
Manage import-export
requirements
Manage deliveryquality
Manage deliverycontracts
The metrics for deliver infrastructure and deliver stocked product are the processmetrics in the SCOR model and provide a diagnostic insight and link to the de-liver functional metrics. The ability to drill down from the functional level intothe processes enables delivery managers to diagnose results internally across thedeliver function as well as externally in terms of customer satisfaction, readiness,and cost.

Process Performance Measures
D-9
Table D-11 presents the process performance measures for percent of on-time de-livery, percent of correct quantity delivered, percent of defect-free delivery, per-cent of deliveries with correct documentation, and fill rate.
Table D-11. Percent of On-Time Delivery, Percent of Correct QuantityDelivered, Percent of Defect-Free Delivery, and Percent of
Deliveries with Correct Documentation Metrics
Process metric Deliver process Process element
Inventory accuracy Deliver infrastructure Manage deliver inventories
Picking accuracy Deliver stocked product Pick product
Packing accuracy Deliver infrastructure Manage deliver quality
Shipping accuracy Deliver infrastructure Manage outbound transportation
Order entry accuracy Deliver infrastructure Manage product and process data
Inventory, picking, packing, and shipping accuracy are diagnostic because theydirectly affect percent of on-time delivery, percent of correct quantity delivered,and percent of deliveries with correct documentation. If the inventory is inaccu-rate, the product is picked incorrectly, or the product picked is obsolescent orshipped at the wrong time, cascading negative effects on perfect order fulfillmentwill occur—orders will be delivered late, the incorrect quantity will be delivered,and the documentation will be incorrect. Also, order entry accuracy can affectpercent of on-time delivery, percent of correct quantity delivered, and percent ofdeliveries with correct documentation. If the order is entered incorrectly, thedocumentation will be wrong, on-time delivery will not occur, and the incorrectquantity will be delivered.
Table D-12 shows the process performance measures for order management costs.With the exception of capacity utilization, the order management costs processmetrics are diagnostic because they aggregate of the costs of the order manage-ment function. Capacity utilization (distribution) is indicative of the effective useof resources at distribution depots. Capacity utilization affects the storage space tofacilitate physical movement to stow materiel, pick materiel from inventory, re-warehouse materiel, and conduct physical inventories; all metrics are diagnosticto distribution costs that are part of the order management costs.
Table D-13 presents the process metrics associated with order fulfillment lead-time. The process metrics are diagnostic because each metric is a component oforder fulfillment lead-time (deliver lead-time).

D-10
Table D-12. Order Management Costs Process Metrics
Process metric Deliver process Process element
Order entry and maintenance costs Deliver stocked product Receive, enter, and validateorder
Create customer order costs Deliver stocked product Receive, enter, and validateorder
Order fulfillment costs Deliver stocked product Reserve inventory anddetermine delivery date
Transportation, outbound freight, andduties cost
Deliver stocked product Consolidate orders, plan andbuild loads, route shipments,select carriers and rateshipments
Distribution costs Deliver stocked product Receive and pick product
Incoming materiel costs Deliver stocked product Receive product
Customer invoicing and accountingcosts
Deliver stocked product Invoice and receive payment
Capacity utilization Deliver infrastructure Manage warehouse network;manage warehouses
Table D-13. Order Fulfillment Lead-Time (Deliver Lead-Time) Process Metrics
Process metric Deliver process Process element
Customer signature and authori-zation to order receipt time
Deliver stocked product Receive, enter, and validate order
Order receipt to order entrycomplete time
Deliver stocked product Receive, enter, and validate order;reserve inventory and determinedelivery date
Order entry complete to orderready for shipment time
Deliver stocked product Consolidate order, plan and buildloads, route shipments, select car-riers and rate shipments, pick prod-uct, load vehicle generate shipmentdocuments and ship product
Order ready for shipment tocustomer receipt of order time
Deliver stocked product Receive and verify product atcustomer site

E-1
Appendix E Performance Measure Definitions
This appendix presents definitions of enterprise performance measures as well asdefinitions of the following SCOR functions:
u Plan
u Source
u Maintain
u Deliver.
ENTERPRISE
Inventory turns. Inventory turns are computed by dividing the total revenue (atlatest acquisition cost) by the value of inventory at latest acquisition cost.
Percent change in customer price compared to inflation. Price is represented by amarket basket of technology, similar to the basket of goods used in the CPI. Themarket basket of technology reflects the DoD practice of replacing many secon-dary items (e.g., radar systems) with the most recent technological version ratherthan the original version.
Perfect order fulfillment rate. The ratio of perfectly satisfied orders to total or-ders. A perfect order is an order that meets the following standards:
u Delivered complete; all items delivered in the quantities requested
u Delivered on time, using the customer’s definition of on-time delivery
u Complete and accurate documentation (including packing slips, bills oflading, and invoices) to support the order
u Delivered in perfect condition and in the correct configuration ready to beused by the customer; no damage; faultlessly installed (as applicable).
Supply chain management costs as a percent of sales (at standard price). Supplychain management costs (i.e., supply chain-related MIS, supply chain planning,inventory carrying, materiel acquisition, and order management costs) expressed asa percent of sales at standard price.
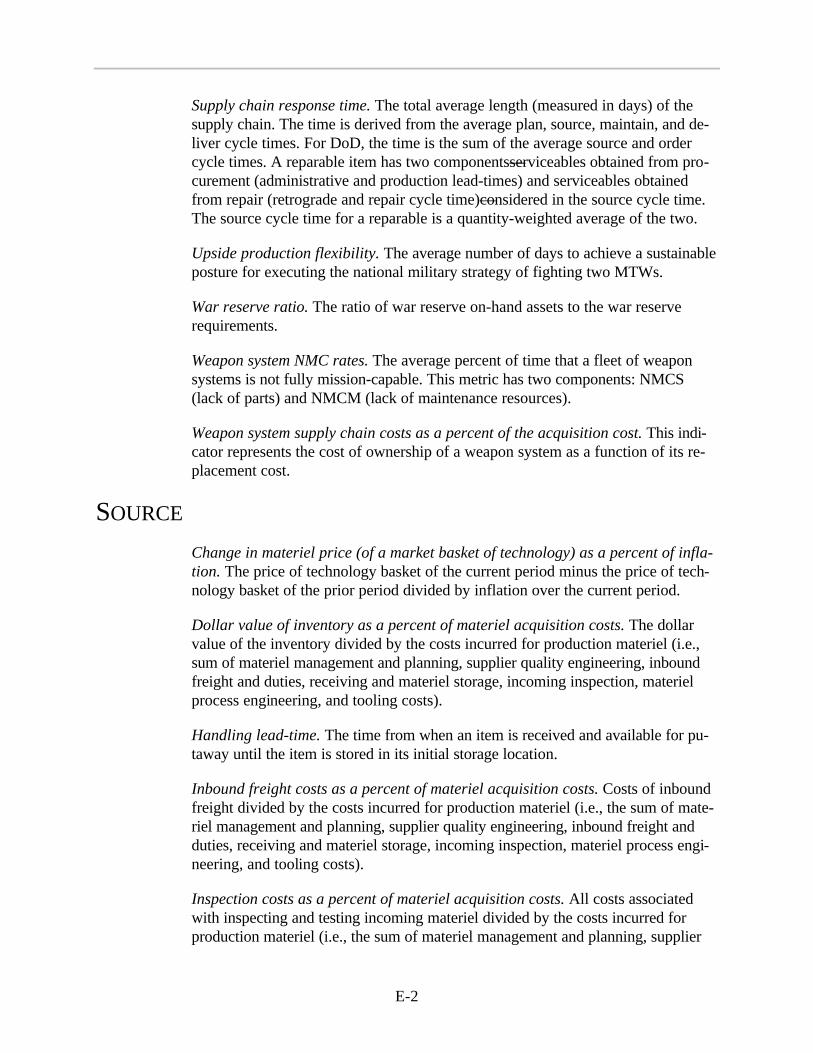
E-2
Supply chain response time. The total average length (measured in days) of thesupply chain. The time is derived from the average plan, source, maintain, and de-liver cycle times. For DoD, the time is the sum of the average source and ordercycle times. A reparable item has two components—serviceables obtained from pro-curement (administrative and production lead-times) and serviceables obtainedfrom repair (retrograde and repair cycle time)—considered in the source cycle time.The source cycle time for a reparable is a quantity-weighted average of the two.
Upside production flexibility. The average number of days to achieve a sustainableposture for executing the national military strategy of fighting two MTWs.
War reserve ratio. The ratio of war reserve on-hand assets to the war reserverequirements.
Weapon system NMC rates. The average percent of time that a fleet of weaponsystems is not fully mission-capable. This metric has two components: NMCS(lack of parts) and NMCM (lack of maintenance resources).
Weapon system supply chain costs as a percent of the acquisition cost. This indi-cator represents the cost of ownership of a weapon system as a function of its re-placement cost.
SOURCE
Change in materiel price (of a market basket of technology) as a percent of infla-tion. The price of technology basket of the current period minus the price of tech-nology basket of the prior period divided by inflation over the current period.
Dollar value of inventory as a percent of materiel acquisition costs. The dollarvalue of the inventory divided by the costs incurred for production materiel (i.e.,sum of materiel management and planning, supplier quality engineering, inboundfreight and duties, receiving and materiel storage, incoming inspection, materielprocess engineering, and tooling costs).
Handling lead-time. The time from when an item is received and available for pu-taway until the item is stored in its initial storage location.
Inbound freight costs as a percent of materiel acquisition costs. Costs of inboundfreight divided by the costs incurred for production materiel (i.e., the sum of mate-riel management and planning, supplier quality engineering, inbound freight andduties, receiving and materiel storage, incoming inspection, materiel process engi-neering, and tooling costs).
Inspection costs as a percent of materiel acquisition costs. All costs associatedwith inspecting and testing incoming materiel divided by the costs incurred forproduction materiel (i.e., the sum of materiel management and planning, supplier
Performance Measure Definitions
E-3
quality engineering, inbound freight and duties, receiving and materiel storage, in-coming inspection, materiel process engineering, and tooling costs).
Materiel acquisition costs as a percent of revenue. The costs incurred for produc-tion materiel (e.g., materiel management and planning, supplier quality engineering,inbound freight and duties, receiving and materiel storage, incoming inspection,materiel process engineering, and tooling costs) divided by sales at the latest acqui-sition cost.
Materiel management and planning costs as a percent of materiel acquisitioncosts. All costs associated with supplier source; contract negotiation and qualifica-tion; and the preparation, placement, and tracking of a purchase order divided bythe costs incurred for production materiel (i.e., sum of materiel management andplanning, supplier quality engineering, inbound freight and duties, receiving andmateriel storage, incoming inspection, materiel process engineering, and toolingcosts).
Materiel process engineering as a percent of materiel acquisition costs. Costs as-sociated with tasks to document and communicate materiel specifications as wellas reviews to improve the manufacturability of a purchased item divided by thecosts incurred for production materiel (i.e., the sum of materiel management andplanning, supplier quality engineering, inbound freight and duties, receiving andmateriel storage, incoming inspection, materiel process engineering, and toolingcosts).
Materiel storage costs as a percent of materiel acquisition costs. All costs associ-ated with storing materiel (including warehouse space and management, materielstocking, processing work orders, pricing, and internal materiel movement) dividedby the costs incurred for production materiel (i.e., sum of materiel managementand planning, supplier quality engineering, inbound freight and duties, receivingand materiel storage, incoming inspection, materiel process engineering, and tool-ing costs).
Number of carriers used as a percent of target number of carriers. The number ofcarriers used divided by the target number of carriers.
Number of supplier contracts with surge clauses as a percent of total contracts.The number of contracts with surge clauses divided by the total number ofcontracts.
Order lead-time. The time between requisition acknowledgement and supplierconfirmation of the order.
Ordering costs as a percent of materiel acquisition costs. All costs associated withthe preparation, placement, and tracking of a purchase order divided by the costsincurred for production materiel (i.e., sum of materiel management and planning,
E-4
supplier quality engineering, inbound freight and duties, receiving and materielstorage, incoming inspection, materiel process engineering, and tooling costs).
Percent of certified carriers. The number of certified carriers divided by the totalnumber of carriers.
Percent of certified suppliers. The number of certified suppliers divided by the to-tal number of suppliers.
Percent of change in certified suppliers. The number of certified suppliers in thecurrent period minus the number of certified suppliers in previous period dividedby the number of certified suppliers in the previous period.
Percent of correct quantity deliveries. The number of deliveries (from suppliers)with ordered quantity divided by the total number of deliveries.
Percent of defect-free deliveries. The number of deliveries (from suppliers) with-out damage divided by the total number of deliveries.
Percent of deliveries with correct documentation. The number of deliveries (fromsuppliers) with correct documentation divided by the total number of deliveries.
Percent of long-term contracts. The number of long-term (greater than 3 years)contracts divided by the total number of contracts.
Percent of NSNs single-sourced. The number of NSNs having single-source sup-pliers divided by the total number of NSNs.
Percent of NSNs with ABC and weapons criticality classification. The number ofNSNs having ABC and weapons criticality classification divided by the total num-ber of NSNs.
Percent of NSNs with accurate inventory storage data. The number of NSNs hav-ing accurate inventory storage data divided by the total number of NSNs.
Percent of on-time deliveries. The number of deliveries (from suppliers) on-time(relative to the request date) divided by the total number of deliveries.
Percent of orders placed electronically. The number of orders placed electroni-cally divided by the total number of orders.
Percent of orders placed via EDI. The number of orders placed by EDI divided bythe total number of orders.
Percent of perfect order fulfillment. The number of orders received on time, in thecorrect quantity, defect-free, and with correct documentation divided by the totalnumber of orders.

Performance Measure Definitions
E-5
Percent of prequalified suppliers. The number of suppliers prequalified for a sub-set of general supplier requirements divided by the total number of suppliers.
Percent of purchases made via purchase card. The number of purchases madewith purchase cards divided by the total number of purchases.
Percent of single-source suppliers having backup suppliers. The number of single-source suppliers for which a contingency plan exists to use another (prequalified)supplier divided by the number of single-source suppliers.
Percent of suppliers with on-line catalogs. The number of suppliers having on-linecatalogs divided by the total number of suppliers.
Percent of suppliers accepting EDI orders. The number of suppliers acceptingEDI orders divided by the total number of suppliers.
Percent of suppliers accepting electronic funds transfer payment. The number ofsuppliers accepting electronic funds transfer payments divided by the total numberof suppliers.
Percent of suppliers accepting electronic orders. The number of suppliers accept-ing electronic orders divided by the total number of suppliers.
Percent of suppliers in compliance with contracts. The number of suppliers incontract compliance divided by the total number of suppliers.
Percent of suppliers submitting electronic invoices. The number of suppliers sub-mitting electronic invoices divided by the total number of suppliers.
Receiving costs as a percent of materiel acquisition costs. All costs associatedwith taking possession of materiel (excluding inspection) divided by the costs in-curred for production materiel (i.e., the sum of materiel management and planning,supplier quality engineering, inbound freight and duties, receiving and materielstorage, incoming inspection, materiel process engineering, and tooling costs).
Receiving lead-time. The time between dock delivery and release for putaway intostorage.
Supplier lead-time. The time between order confirmation and dock delivery.
Time to identify a new supplier. The time (in days) from the recognition of theneed to locate a new supplier for a product to the date an agreement (contract) issigned with the supplier.
Time to identify new product specifications. The time (in days) from the recogni-tion of the need to develop new product specifications to the agreement on specifi-cations by all necessary parties.
E-6
Total NSNs managed as a percent of materiel acquisition costs. Total number ofNSNs managed divided by all costs associated with storing materiel (includingwarehouse space and management, materiel stocking, processing work orders,pricing, and internal materiel movement) and the costs incurred for productionmateriel (i.e., sum of materiel management and planning, supplier quality engi-neering, inbound freight and duties, receiving and materiel storage, incoming in-spection, materiel process engineering, and tooling costs).
Total source lead-time. Cumulative lead-time (inside-plant planning, supplier [in-ternal or external] lead-time, receiving, and handling from demand identificationuntil the materiel is available for use) to source 95 percent of the value of materielfrom internal and external suppliers.
Upside production flexibility—source (existing supplier network). Time (in days)to increase supply from existing suppliers to support a two-MTW scenario.
Upside production flexibility—source (new suppliers). Time (in days) to identifyand begin to obtain materiel from a new supplier to support a two-MTW scenario.
MAINTAIN
Materiel requisition cycle time. The average time for maintenance personnel toreceive repair parts from the time they order the materiel to the time they receiveit.
Percent of parts delivered to point of use. The percent of materiel receipts deliv-ered directly to production, a consolidation point, or point of use on the produc-tion floor with no inspection or only a minor visual or paperwork inspection.
Performance to customer-request date—maintain. The percent of repair ordersfulfilled on or before the ICP’s requested date.
Product and grade changeover time. The average time (in hours) to change a re-pair line to repair a different item.
Ratio of actual to theoretical cycle time. The percent of time that the actual repaircycle time deviates from the standard (or theoretical) cycle time.
Repair cycle time. The sum of retrograde time (i.e., base processing and intransittime) to the repair depot, supply to maintenance movement time, shop flow time,and maintenance to supply movement time.
Schedule achievement. The percent of time that a plant achieves its productionschedule.

Performance Measure Definitions
E-7
Upside production flexibility—maintain. Time (in days) to increase repair fromexisting repair rate to support a two-MTW scenario surge requirement.
DELIVER
Capacity utilization. A measure of the use of a resource to produce a good orservice. Factors that should be considered include internal manufacturing capacity,constraining processes, direct labor availability, and materiel availability of keycomponents.
Create customer order costs. Costs for creating and pricing configurations to or-der and preparing order documents.
Customer invoicing and accounting costs. Costs for invoicing, processing cus-tomer payments, and verifying customer satisfaction.
Customer signature and authorization to order receipt time. Time from when thecustomer authorizes an order to the time that the order is received (in calendardays).
Days of sales outstanding. The gross accounts receivable divided by the totalgross annual sales that has been divided by 365.
Delivery performance to customer-request date. The percent of orders that arefulfilled on or before a customer’s requested date.
Delivery performance to scheduled commit date. The percent of orders that arefulfilled on or before the original scheduled or committed date.
Distribution and warehousing costs. Costs for warehouse space and management,finished goods receiving and stocking, processing shipments, picking and consoli-dating, selecting carrier, and staging products and systems.
End-of-life inventory. Inventory on-hand that will satisfy future demand for prod-ucts no longer in production.
Faultless invoices. The number of invoices issued without error. Examples of po-tential invoice defects are a change from customer purchase order without propercustomer involvement; wrong customer information (e.g., name, address,telephone number); wrong product information (e.g., part number, productdescription); wrong price (e.g., discounts not applied); and wrong quantity, terms,or date.
Fill rates. The percent of ship-from-stock orders shipped within 24 hours of orderreceipt.

E-8
Finished goods inventory days of supply. Gross finished goods inventory dividedby the value of transfers that has been divided by 365.
Incoming materiel costs. The costs of materiel entering the distribution center ordepot.
Incoming materiel quality. The number of received parts that fail inspection di-vided by the total number of parts received.
Inventory accuracy. The percent of total items with no inventory discrepancies.
Inventory obsolescence as a percent of total inventory. The annual obsolete andscrap reserves taken for inventory obsolescence expressed as a percent of the an-nual average gross inventory value.
Materiel acquisition costs. Costs incurred for production materiel (i.e., sum ofmateriel management and planning, supplier quality engineering, inbound freightand duties, receiving and materiel storage, incoming inspection, materiel processengineering, and tooling costs).
Number of orders not delivered complete. The number of orders for which allitems on order are not delivered in the quantities requested.
Number of orders with complete and accurate documentation. The number of or-ders with correct documentation supporting the order, including packing slips, billsof lading, and invoices.
Order entry accuracy. The percent of orders entered correctly into the system.
Order entry and maintenance costs. Costs for maintaining the customer database,checking credit, accepting new orders, and adding them to the order system as wellas order modifications.
Order entry complete to order ready for shipment time. Time for release tomanufacturing, order configuration verification, production scheduling, build, pick-pack, and prepare for shipment (in calendar days).
Order fulfillment costs. Costs for processing the order, allocating inventory, or-dering from the internal or external supplier, scheduling the shipment, reportingorder status, and initiating shipment.
Order fulfillment lead-times. The average lead-times achieved from customer sig-nature and authorization to order receipt, order receipt to order entry complete,order entry complete to start build, start build to order ready for shipment, orderready for shipment to customer receipt of order, and customer receipt of order toinstallation complete.
Performance Measure Definitions
E-9
Order management costs as a percent of sales. The aggregation of the followingcost elements:
u Create customer order costs
u Order entry and maintenance costs
u Contract, program, and channel management costs
u Installation planning costs
u Order fulfillment costs
u Distribution costs
u Transportation costs
u Installation costs
u Customer invoicing and accounting costs.
Order ready for shipment to customer receipt of order time. Time that consists ofthe total transit time (all components to consolidation point), consolidation, queuetime, and additional transit time to customer receipt of order (in calendar days).
Order receipt to order entry complete time. Time for order revalidation, configu-ration check, credit check, and scheduling of received orders (in calendar days).
Packing accuracy. The percent of items packed without damage or proper packinglists and documentation.
Percent of faultless installations. The number of faultless installations divided bytotal number of units installed.
Performance to customer commit date. The percent of orders fulfilled on or beforethe customer committal date.
Picking accuracy. The percent of lines picked with no errors.
Published delivery lead-times. The standard lead-time (after receipt of order) cur-rently published to customers by the sales organization for typical orders only (notstanding and resupply orders).
Shipping accuracy. The percent of items shipped when transportation isscheduled.

E-10
Transportation, outbound freight, and duties costs. All company-paid transporta-tion, freight, and duties costs from point of manufacture to end customer orchannel.
Upside production flexibility—deliver. Time to increase deliver from existing issuerate to support a two-MTW scenario surge requirement (in calendar days).
PLAN
DWCF net operating result. The annual budget variance of the DWCF as a per-cent of budget.
Deficit ratio. Requirements minus assets divided by requirements. For items inshort supply, this metric measures the degree of shortfall. The functional metricshould apply to the entire supply chain, while process metrics focus on portions(e.g., retail level, wholesale on-hand, wholesale pipeline) of the supply chain. In thewholesale pipeline, further subdivision can be achieved by isolating the deficit oncontract and the deficit in commitment to measure how effectively items arebrought into the supply system.
Forecast accuracy. Forecast accuracy is measured for each item, in dollars andunits, and calculated by subtracting the sum of the variances from the forecast sumand dividing by the forecast sum. The forecast sum is the sum of the units or dol-lars forecasted to be shipped in each month based upon the forecast generated 3months before. The sum of the variances is the sum of the absolute values, at theforecasted line-item level, of the differences between each month’s forecast andactual demand for the month.
Inapplicable assets in commitment. The percent of materiel on purchase request(i.e., a purchase request has been forwarded from the item manager to purchasing)that does not fill current requirements.
Inapplicable assets on contract. The percent of materiel on contract that does notfill current requirements.
Inventory carrying costs. The sum of opportunity cost, shrinkage, insurance andtaxes, and total obsolescence for inventory (for serviceables and unserviceables).
Inventory losses. The amount of inventory lost because of causes other than obso-lescence as a percent of the total inventory value.
Inventory storage costs. The costs to store assets in distribution warehouses as apercent of the total inventory value.
Obsolete inventory. The amount of inventory lost because of obsolescence as apercent of the total inventory value.
Performance Measure Definitions
E-11
Overage. The number of assets minus requirements divided by requirements.
Overinduction. The number of assets inducted prematurely divided by the numberof assets inducted.
Percent of assets not counted. The percent of known assets not considered in theforecast.
Percent of NSNs with 2-MTW planning factors. The number of NSNs with two-MTW planning factors divided by the total number of NSNs. This metric is a sim-ple ratio that measures planning comprehensiveness for mobilization.
Percent of NSNs with war reserve requirements developed. The number of NSNswith war reserve requirements divided by the total number of NSNs. This metric isa simple ratio that measures the comprehensiveness of war reserve planning.
Ratio of funded war reserves to war reserve requirements. This metric measurescongressional authorization limits to total mobilization requirements. It is usefulfor separating congressionally imposed limitations from DoD efforts for managingwar reserves.
Ratio of on-hand war reserves to funded war reserves. This metric measures DoDmanagement of war reserves within congressional authorization limits.
Supply chain planning costs. The costs associated with forecasting, developingfinished goods or end item inventory plans, and coordinating the demand and sup-ply process throughout the supply chain, including all channels. For items in along-supply position, this metric measures the degree of long supply. Requirementsare measured for current year, budget horizon, and usage at any horizon.
Underinduction. The number of assets inducted by the number of assets requiringinduction. A measure of how well unserviceable assets are inducted into mainte-nance to provide adequate supplies.

E-12

F-1
Appendix F Abbreviations
ABC activity-based costing
ADP automated data processing
ADUSD(L)MDM Assistant Deputy Under Secretary of Defense (Logistics)for Materiel and Distribution Management
AF Air Force
AFB Air Force Base
ALC Air Logistics Center
ALT administrative lead-time
AMARC Aerospace Maintenance and Regeneration Center
AMC Air Mobility Command
AMCOM U.S. Army Aviation Missile Command
BOM bill of materiel
CASREP casualty report
CECOM U.S. Army Communications-Electronics Command
CONUS Continental United States
CPI Consumer Price Index
DAAS Defense Automated Addressing System
DCMC Defense Contract Management Command
DCSLOG Deputy Chief of Staff for Logistics
DESC Defense Energy Support Center
DLA Defense Logistics Agency
DLIS Defense Logistics Information Service
F-2
DLMSO Defense Logistics Management Standards Office
DLSC Defense Logistics Support Command
DNSC Defense National Stockpile Center
DoD Department of Defense
DoDAAC DoD Activity Address Code
DOS days of supply
DRMS Defense Reutilization and Marketing Service
DSCC Defense Supply Center, Columbus
DSCP Defense Supply Center, Philadelphia
DSCR Defense Supply Center, Richmond
DSS Distribution Standard System
DUSD(L) Deputy Under Secretary of Defense (Logistics)
DVD direct vendor delivery
DWCF Defense Working Capital Fund
ECO engineering change order
EDI electronic data interchange
FMC fully mission-capable
FY fiscal year
GPRA Government Performance and Results Act
ICIS Integrated Consumable Item Support
ICP inventory control point
LMARS Logistics Metrics Analysis Reporting System
LMI Logistics Management Institute
LRT logistics response time
L1 level 1

Abbreviations
F-3
L2 level 2
L3 level 3
MC mission-capable
MCLB Marine Corps Logistics Base
MDM Materiel and Distribution Management
MILSTEP Military Supply and Transportation Evaluation Procedures
MIS management information system
MRO materiel release order
MTMC Military Traffic Management Command
MTW major theater war
NADEP naval aviation depot
NAVICP Navy Inventory Control Point
NAVSUP Naval Supply Systems Command
NMC not mission-capable
NMCM not mission-capable—maintenance
NMCS not mission-capable—supply
NSN national stock number
NSY naval shipyard
NUWC Naval Undersea Warfare Center
NWCF Navy Working Capital Fund
OC-ALC Oklahoma City Air Logistics Center
OCONUS outside the continental United States
OO-ALC Ogden Air Logistics Center
OSD Office of the Secretary of Defense
PLT production lead-time

F-4
PMC partially mission-capable
PMCM partially mission-capable—maintenance
PMCS partially mission-capable—supply
PTAMS Pipeline Tracking Analysis and Metrics System
RCT repair cycle time
SA-ALC San Antonio Air Logistics Center
SCIR Subsystem Capability Impact Reporting
SCOR Supply Chain Operations Reference
SM-ALC Sacramento Air Logistics Center
SSIR Supply System Inventory Report
TACOM U.S. Army Tank-Automotive and Armaments Command
TAV total asset visibility
TBD to be determined
USMC United States Marine Corps
WIP work in process
WR-ALC Warner-Robins Air Logistics Center

REPORT DOCUMENTATION PAGE Form ApprovedOPM No.0704-0188
Public reporting burden for this collection of information is estimated to average 1 hour per response, including the time for reviewing instructions, searching existing data sourcesgathering, and maintaining the data needed, and reviewing the collection of information. Send comments regarding this burden estimate or any other aspect of this collection ofinformation, including suggestions for reducing this burden, to Washington Headquarters Services, Directorate for Information Operations and Reports, 1215 Jefferson Davis Highway,
Suite 1204, Arlington, VA 22202-4302, and to the Office of Information and Regulatory Affairs, Office of Management and Budget, Washington, DC 20503.1. AGENCY USE ONLY (Leave Blank) 2. REPORT DATE
Jun 1999
3. REPORT TYPE AND DATES COVERED
Final
4. TITLE AND SUBTITLE
Supply Chain Management: A Recommended Performance Measurement Scorecard
5. FUNDING NUMBERS
C DASW01-95-C-0019
PE 0902198D
6. AUTHOR(S)
Larry S. Klapper, Neil Hamblin, Linda Hutchison, Linda Novak, Jonathan Vivar
7. PERFORMING ORGANIZATION NAME(S) AND ADDRESS(ES)
Logistics Management Institute2000 Corporate RidgeMcLean, VA 22102-7805
8. PERFORMING ORGANIZATIONREPORT NUMBER
LMI– LG803R1
9. SPONSORING / MONITORING AGENCY NAME(S) AND ADDRESS(ES)
Mr. Walt AtchleyOffice of the Assistant Deputy Under Secretary of Defense (Materiel and Distribution Management)Room 3B730The Pentagon, Washington, DC 20301
10. SPONSORING / MONITORING AGENCY REPORT NUMBER
11. SUPPLEMENTARY NOTES
12a. DISTRIBUTION / AVAILABILITY STATEMENT
A: Approved for public release; distribution unlimited
12b. DISTRIBUTION CODE
13. ABSTRACT (Maximum 200 words)
Supply chain management is the management of all processes or functions to satisfy a customer’s order (from raw materials through conversion and manufacturethrough shipment). Performance measures, or metrics, are used to monitor the progress of supply chain initiatives. However, a consensus in DoD considers the metricsavailable to senior DoD managers to be inadequate or lacking the depth to measure the effectiveness of the DoD supply chain. The metrics are not balanced acrosscustomer service, cost, readiness, and sustainability performance objectives.
Because of the lack of adequate measures, the Deputy Under Secretary of Defense (Logistics) tasked Logistics Management Institute (LMI) to propose a set of balancedperformance measures that senior decision-makers can use to monitor supply chain effectiveness. This report addresses the recommended top-level, or enterprise-level,performance measures. Enterprise metrics measure the overall performance of the supply chain and are cross-functional. In addition, the report presents functional andprocess performance measures for the Assistant Deputy Under Secretary for Materiel and Distribution Management that can be used to diagnose performance at theenterprise level that might be substandard or below expectations.
14. SUBJECT TERMS
Logistics, metrics, performance measures, supply chain, supply chain management, Supply Chain Operations Reference,SCOR
15. NUMBER OF PAGES
118
16. PRICE CODE
17. SECURITY CLASSIFICATIONOF REPORT
Unclassified
18. SECURITY CLASSIFICATIONOF THIS PAGE
Unclassified
19. SECURITY CLASSIFICATIONOF ABSTRACT
Unclassified
20. LIMITATION OF ABSTRACT
UL
NSN 7540-01-280-5500 Standard Form 298, (Rev. 2-89)Prescribed by ANSI Std. 239-18299-01

blank page