performance measurement of manufacturing supply chain … · iii abstract performance measurement...
TRANSCRIPT
i
Performance Measurement of Manufacturing Supply Chain
Wei Wei
A Thesis
In
The Department
of
Concordia Institute for Information Systems Engineering
Presented in Partial Fulfillment of the Requirements
for the Degree of Master of Applied Science of Quality Systems Engineering at
Concordia University
Montreal, Quebec, Canada
Feb 2014
© Wei Wei, 2014
ii
CONCORDIA UNIVERSITY
School of Graduate Studies
This is to certify that the thesis prepared
By: Wei Wei
Entitled: Performance Measurement of Manufacturing Supply Chain
And submitted in partial fulfillment of the requirements for the degree of
Master of Applied Science (Quality Systems Engineering)
Complies with the regulations of the University and meets the accepted standards with
respect to originality and quality.
Signed by the final Examining Committee:
Dr. A. Ben Hamza Chair
Dr. X. Huang Examiner
Dr. C. Wang Examiner
Dr. A. Schiffauerova Supervisor
Approved by: Dr. R. Dssouli, Director
Concordia Institute for Information Systems Engineering
Dr. C. W. Trueman, Interim, Dean
Faculty of Engineering and Computer Science
Date: Jan 13, 2014
iii
Abstract
Performance Measurement of Manufacturing Supply Chain
Wei Wei
In order to achieve a fully integrated manufacturing supply chain and to maximize its
effectiveness and efficiency, the manufacturing supply chain needs to be assessed for its
performance. My thesis has two main objectives: 1. To develop a new methodology for
the performance measurement of manufacturing supply chain. 2. To evaluate
manufacturing supply chain performance and carry out a comparative analysis of existing
supply chains.
To accomplish the first objective a simple, generic and comprehensive tool for measuring
the performance of supply chains was developed. The tool was validated by several
interviews from various industries.
In order to achieve the second objective the proposed tool was used as a basis for a
questionnaire, and a survey of the manufacturing supply chains across various countries
and industries was conducted. The results show that even though performance
measurement in the whole supply chain is considered as critical by many respondents,
some supply chains have not implemented any performance measurement system. A four-
factor index for the assessment of the supply chain performance was developed and used.
The results suggest that the supply chains which use performance measurement systems
are perceived as better performing than those which do not use any performance
measurement systems. Also, the weighted performance scores for the national supply
chains were higher than the scores for the international ones. Finally, supply chains with
strategic alliance showed better performance than those which do not have strategic
alliance.
iv
Table of Contents 1. Introduction .......................................................................................................................................................................................................... 1
2. Literature review ................................................................................................................................................................................................... 3
2.1 Manufacturing supply chain management..................................................................................................................................................... 3
2.2 Performance measurement of manufacturing supply chain .......................................................................................................................... 5
2.3 Implementation of performance measurement systems ............................................................................................................................... 8
2.4 Introduction of balanced scorecard in performance measurement of manufacturing supply chain ........................................................... 11
2.5 Research concerning BSC in performance measurement of manufacturing supply chain ........................................................................... 19
2.6 Other popular performance measurement models ..................................................................................................................................... 23
2.6.1 The supply chain operations reference (SCOR) model ......................................................................................................................... 24
2.6.2 Total quality management (TQM) model............................................................................................................................................. 25
2.7 Research gaps in performance measurement of manufacturing supply chain ............................................................................................ 26
3. Objective ............................................................................................................................................................................................................. 27
4. Methodology ....................................................................................................................................................................................................... 29
4.1 Tool development ........................................................................................................................................................................................ 29
4.1.1 Development of importance of attributes ........................................................................................................................................... 30
4.1.2 Development of status of attributes .................................................................................................................................................... 35
4.2 Tool validation ............................................................................................................................................................................................. 35
4.2.1 The interview with statistical analysis expert ...................................................................................................................................... 35
4.2.2 The interviews with 5 professionals from different industries ............................................................................................................ 36
4.3 Proposed application of the tool .................................................................................................................................................................. 38
4.4 Development of questionnaire .................................................................................................................................................................... 38
4.4.1 Part 1: demographic Information ........................................................................................................................................................ 40
4.4.2 Part 2: general information ................................................................................................................................................................. 43
4.4.3 Part 3 and part 4 .................................................................................................................................................................................. 44
4.5 Distribution of questionnaire ....................................................................................................................................................................... 44
5. Analysis of result ................................................................................................................................................................................................. 45
5.1 Analysis of data from part 1 and part 2 of questionnaire ............................................................................................................................ 45
5.2 Analysis of data from part 3 and part 4 of questionnaire ............................................................................................................................ 54
5.2.1 Data analysis of perspectives ............................................................................................................................................................... 55
5.2.3 Data analysis of attributes ................................................................................................................................................................... 60
6. Summary and conclusions ................................................................................................................................................................................... 70
7. Contributions ....................................................................................................................................................................................................... 71
8. Limitations ........................................................................................................................................................................................................... 72
9. Future works ....................................................................................................................................................................................................... 73
Bibliography ............................................................................................................................................................................................................ 74
Appendix ................................................................................................................................................................................................................. 80
1
1. Introduction
In order to achieve a fully integrated supply chain (SC) and to maximize its effectiveness and
efficiency, the SC needs to be assessed for its performance, i.e. the performance measures and
metrics should be developed and deployed (Basnet, 2003; Beamon, 1998). This will not only
help in improvement of performance of SC and in the in pursuit of SC excellence (Beamon,
1999), but also it will also facilitate a greater understanding of the SC and positively influence
actors’ behavior (Beamon, 2001). Nevertheless, it is widely acknowledged that only little
attention in the literature has been given to the evaluation of SC performance measurement
systems and metrics (e.g. Basnet, 2003; Beamon, 1998; Beamon, 1999; Bititci, 2005; Bourne,
2002). The existing research into SC performance measurement systems and metrics involves
mainly their categorization (e.g. Benton, 2005; Bourne, 2000), the design of conceptual
frameworks by which performance measurement systems can be developed for various types of
systems (Beamon, 1998; Boyer, 2002), or the development and the implementation of
performance measures for SC management (Beamon, 1998; Benton, 2005; Bititci, 2005; Brewer,
2000; Caprice, 1994).
Current SC performance measurement systems are reported to suffer from numerous deficiencies
(Basnet, 2003; Beamon, 1998; Benton, 2005; Bourne, 2002; Caprice, 1995). One of the
deficiencies which is most discussed in the literature is the lack of a systemic approach (Beamon,
1999; BS4778, 1987; Bourne, 2002) and a SC holistic context (Benton, 2005; Bourne, 2002).
Shepherd and Gunter (1998) suggest addressing the lack of systemic approach to SC
performance measurement by integrating performance measurement systems with modern
manufacturing practices, such as Just in Time (JIT) or Total Quality Management (TQM). It has
already been shown by Wood et al. (Chan, 2003) that the integration of these modern
manufacturing practices can lead to statistically significant increases in performance. Flynn and
Flynn (2002) proposed that the integration of quality goals with SC goals will create cumulative
capabilities and, in the same vein, Kannan and Tan (2001) suggested that simultaneous
commitment to both quality and SC improvement will have the greatest effect on performance.
However, comprehensive SC performance measurement systems and metrics could not be found
in literature. This thesis proposes a novel methodology for the manufacturing SC performance
2
evaluation, which consists in the integration of the concepts of manufacturing SC management
with balanced scorecard.
We can observe that in many research studies (e.g. Brewer, 2000; Besterfield-Sacre, 2003; Chen,
2007), the SC performance measurement systems are studied. Many different types of
performance measurement systems are suggested, for example Balanced Scorecard (BSC), Total
Quality Management (TQM), Supply Chain Operations Reference (SCOR) and so on. They are
cited commonly in manufacturing SC performance measurement field. However, while I read
through the research studies related to Balanced Scorecard, Total Quality Management or Supply
Chain Operations Reference I could not find very detailed implementation information on how
they are applied in industries. Based on the literature review which I have conducted I have
found several research gaps, which I have addressed in this thesis. First, even though there are a
few articles which mention the implementation in industry, they are discussing concerning it
within an individual company’s SC, not in the whole SC (e.g. Barbara, 2010; Milind, 2007). For
example, in an electronic manufacturing services company whose main products are laptops, the
company’s SC involves its various suppliers (e.g. supplying battery, keyboard, and mechanical
parts and so on). Its SCs are mainly these suppliers. However, in the whole SC concept, we can
only regard this company as a manufacturer among the whole SC, including end-user, retailer,
distributor, manufacturer and supplier. Also as we know, EMS company is focusing on
manufacturing, assembling. It is easy to identify its role among the whole SC.
Second, there are some research studies which discuss the concept of BSC, e.g. the Balanced
Scorecard framework including customer perspective, internal business perspective, financial
perspective and innovation and learning perspective (Rajat, 2007; Brewer, 2000). There are also
some works which mention attributes in detail for particular categories (e.g. Beamon, 1999;
Rajat, 2007), but we cannot find a comprehensive system of attributes. Meanwhile, different
attributes may produce various kinds of impacts on the manufacturing SC in a variety of levels.
It is thus proposed in this thesis that every attribute in a performance measuring system should
not be considered as having an equal impact on manufacturing SC performance. I tried to define
different attribute’s weights as representative to present the performance of whole manufacturing
SC by applying objective statistical analysis.
3
Third, various research articles create different categories of performance measurement of
manufacturing SC. for example, Beamon(1999) proposes three separate categories of
performance measures including resource measures, output measures and flexibility measures.
However, based on my working experience and several interviews with professionals from
different industries, I created a more comprehensive categorization which is resource, customer-
based, interaction, SC-based Interaction and flexibility.
Moreover, there is not any SC performance measuring system which could be applied to measure
all types of manufacturing SCs. Here in the thesis I propose a more generic tool, which will be
defined by 23 typical attributes which can apply to all types of manufacturing SCs. The
following chapter will introduce the literature review in a good detail in order to present well the
research gaps.
2. Literature review
2.1 Manufacturing supply chain management
As business evolves into the 21st century, supply chain management (SCM) is the predominant
management focus driving many organizations. A recent study cited SCM as one of the three
most important management practices which will decide about world class performance. Since
its introduction in retailing, the SC concept has spread to other industries, including automotive,
electronics, and chemicals. SCM is fast becoming critical for any company which intends to
stabilize its position in the market (Brewer, 2000). This is the same situation for Canadian
companies. Globalization of the market, growing competition and an increasing emphasis on
customer satisfaction are regularly considered to be the catalysts in the growing interest in SCM
(Gunasekaran, 2001; Webster, 2002). Effective SCM is considered as a key to building a
sustainable competitive advantage via improved relationships within and among firms (Ellinger,
2000). SCs involve all activities related to the flow and transformation of goods from the raw
material stage through to the end user (Handfield, 1999). Many benefits have been associated
with SCM, for example reduced costs, increased market share and sales, and improved customer
relations (Fergueson, 2000). Moreover, it has been suggested that measuring SC performance can
4
facilitate a greater understanding of the SC, positively influence actors’ behaviour, and improve
its overall performance (Chen, 2004). However, there is some evidence to suggest that this may
be a dream rather than organizational reality. For example, according to Deloitte Consulting only
2% of North American manufacturers considered their SCs as world class, in spite of the fact that
91% of them viewed SCM as important, or critical, to organizational success (Thomas, 1999).
Similarly, an international study of modern manufacturing practices reported only moderate
perceived effectiveness of SCM among the examined companies (Clegg, 2002). In view of these
modest levels of improvement and effectiveness, it could be expected that an increased interest in
developing measurement systems and metrics for evaluating SC performance will appear.
A SC involves all the activities related to moving goods from the raw material stage through to
the end-user. It includes many different companies, for example those engaged in processing
raw materials, wholesaling and retailing, transportation, warehousing, information processing,
and materials handling. Functions which are carried out through the SC include sourcing,
procurement, production scheduling, manufacturing, order processing, inventory management,
warehousing, and customer service. SC can be managed in either an integrated or disintegrated
manner. Integrated SCM focuses on managing relationships, information, and material flow
across organizational borders, and through the integration it is expected that the costs are cut and
flow enhanced. Companies following the SCM approach usually attempt to achieve the
integration of their logistics, procurement operations, and marketing functions with other SC
members, so that materials, information, component parts, and finished product flow smoothly
from the beginning until the end-user at lowest possible cost while providing the customers with
high levels of service. SCM is based on partnership and cooperation of the involved companies,
otherwise it would be difficult to achieve an integration of effort. SCM may require the
companies to share sensitive and proprietary information about customers, actual demand, point-
of-sale transactions, corporate strategic plans, and the like. It involves a great amount of planning
and communication among the companies, and often involves teams of people that cut across
functional and company boundaries to coordinate the movement of product to market. To say it
differently, in order to achieve the real potential of SCM an integration not only among
departments within the organization but also with external partners is required. Every company
within the SC must break the functional hierarchy within its organization and encourage true
5
coordination and integration of marketing, production, procurement, sales, and logistics.
Moreover, actions, systems, and processes among all the SC participants must be integrated and
coordinated. This means that the integration within a company is a necessary, but not sufficient
condition for achieving the full potential benefits of SCM. Integration must be achieved at the
higher level as well, by which functions and processes can become truly coordinated across all
the organizations in the SC (Bourne , 2000).
However, the implementation of SCM is not an easy task, and many obstacles are usually
encountered. Some of these obstacles are shown in Table 1. As it was discussed, SCM involves
sharing of proprietary information, strategy, planning, and goals and companies usually do not
feel comfortable exposing such elements to other companies, because they are afraid of a loss of
control (Benton, 2005).
Table 1 (Benton, 2005)
Barriers to effective supply chain management:
1. Failure to share information
2. Fear of loss of control
3. Lack of self awareness
4. Lack of partner awareness
5. Enormity of supply chain
6. Lack of supply chain satisfaction
7. Lack of customer understanding
8. Lack of understanding of supply chain
9. Myopic strategies
10. Deficiency of mutuality
2.2 Performance measurement of manufacturing supply chain
As was discussed above, manufacturing SC is a complicated system and the managing
manufacturing SC is a difficult task. Now, let us discuss the performance measurement of
manufacturing SC which is one of the most important aspects of manufacturing SCM.
6
Neely et al. (1995) define performance measurement as "the process of quantifying the
effectiveness and efficiency of action. Effectiveness is the extent to which a customer’s
requirements are met and efficiency measures how economically a company’s resources are
utilised when providing a pre-specified level of customer satisfaction." Performance
measurement systems are described as the overall set of metrics used to quantify both the
efficiency and effectiveness of action .Many approaches to performance measurement have been
discussed in the literature, for example the balanced scorecard (Kaplan, 1992); the performance
measurement matrix (Keegan, 1989); performance measurement questionnaires (Dixon, 1990);
criteria for measurement system design (Globerson, 1985); and computer aided manufacturing
approaches. However, existing approaches are often criticised, where their main limitations are
proposed to be the fact that they encourage short termism; they lack strategic focus (the
measurement system is not aligned correctly with strategic goals, organization culture or reward
systems); they encourage local optimisation by forcing managers to minimise the variances from
standard, rather than seek to improve continually; and, they fail to provide adequate information
on what competitors are doing through benchmarking (Shepherd, 2006). Neely et al. (1995)
provide an overview of performance measurement, which has been widely cited in recent
research into SC measurement systems and metrics (e.g. Beamon, 1999; Beamon, 2001;
Gunasekaran, 2001; Gunasekaran, 2004). These papers, together with other similar studies, have
suggested that the majority of the limitations cited by Neely et al. (1995) are greatly important in
the case of performance measurement systems for SCs. Moreover, the need to develop new
measurement systems and metrics which would remove these limitations has been suggested.
The research in the area of performance measurement systems then focused on a number of
important issues, for example the factors that affect the successful implementation of
performance measurement systems (Bourne, 2000; Bourne, 2002); the forces which shape the
evolution of performance measurement systems (Kennerley, 2002; Waggoner, 1999); the way of
maintaining performance measurement systems which would allow them to be flexible and
remain aligned with dynamic environments and changing strategies (Bourne, 2000; Kennerley,
2003).
The development of performance measurement systems is an important research area which
involves creating the methods by which an organization can build its measurement system.
7
Important questions must be addressed here, as for example what should be measured, how
multiple measures will be integrated into one coherent measurement system, the frequency of the
measurements and the issues of re-evaluation. In general, it is difficult to develop a good
measurement system for the SC or chains of interest (Beamon, 1999). Neely et al. (1995) makes
an overview of various measurement frameworks which have been developed and of criteria for
the measurement system design. However, it is argued that a generally applicable systematic
approach to performance measurement has not been developed. There are many kinds of systems,
where each of them requires different specific measurement system characteristics, which makes
creating such a general approach very difficult. Some of the previous studies have attempted to
develop various performance measure frameworks pertinent to different types of systems that
share certain typical important characteristics (Beamon, 1999).
The limitations cited for the performance measurement systems for the SCs are similar to the
limitations of measurement systems found in the more general management literature (Neely,
1995). These include:
Lack of connection with strategy (Beamon, 1999; Chan, 2003; Gunasekaran, 2004)
Focus on cost while neglecting non-cost indicators (Beamon, 1999; De Toni, 2001)
Lack of a balanced approach (Beamon, 1999; Chan, 2003)
Little focus on customers and competitors (Beamon, 1999)
Focus on local optimization instead of SC optimization (Beamon, 1999)
Lack of system thinking (Chan, 2003 )
Researchers have responded to these limitations by proposing performance measurements
systems which are systemic and balanced. One of the most recognized systems is the Supply
Chain Operations Reference (SCOR) model, which was developed by the Supply Chain Council
in 1997. It has been described as a ‘systematic approach for identifying, evaluating and
monitoring supply chain performance’ (Stephens, 2001). The most critical factor for this model is
a balanced approach. It is proposed that single indicators (e.g. cost or time) cannot be adopted to
measure supply chain performance, instead, it is suggested to measure the SC performance at
multiple levels.
8
Consequently, business processes, technology and metrics are all included in the model, which
offers 5 groups of metrics; reliability, responsiveness, flexibility, cost and efficiency. There has
been a criticism that the model does not provide a systematic method for prioritizing measures.
However, recently some researchers have proposed to combine the method decision making tools
such as Analytic Hierarchy Processing, or AHP (Huang, 2004; Li, 2005). Nevertheless, AHP is
considered as the most appropriate technique for selecting measures by everybody. For example,
even though Chan (2003) supports the of AHP, Chan and Qi (2003) argue that it is not very
effective and propose to use fuzzy ratios instead.
Beamon (1996 proposed several characteristics which should be used in evaluation of the
performance measurement systems. These characteristics are listed as follows: inclusiveness
(measurement of all important aspects), universality (to enable comparisons under various
operating conditions), measurability (data required are measurable), and consistency (measures
are consistent with organization goals).
2.3 Implementation of performance measurement systems
Even though many research studied on the performance measurement systems could be found in
the literature, much less attention has been given to the performance measurement systems
implementation (Mee, 1998; Bourne, 1999; Hudson, 2001). The main reasons for success and
failure have been categorized into 3 groups, which are contextual issues, processual issues and
content issues (Bourne, 2002)
1. Contextual issues: (Bourne, 2002)
The required information system needed to be highly developed (Bierbusse, 1997)
The required time and expense were significant (Bierbusse, 1997; McCunn, 1998)
There was lack of leadership and great resistance to change (Hacker, 1998; Meekings, 1995)
2. Processual issues: (Bourne, 2002)
9
Vision and strategy were not practical and easy to translate into actions (Kaplan, 1996).
There were difficulties in evaluating the relative importance of measures and the problems of
identifying true “drivers’’ (Bierbusse, 1997; Schneiderman, 1999)
Strategy was not directly connected to the allocation of resources (Kaplan, 1996; Meekings,
1995)
Goals did not reflect the requirements of stakeholders (Schneiderman, 1999)
The improvement methods which were used were not the best available (Schneiderman,
1999)
Perfectionism has undermined success (McCunn, 1998; Schneiderman, 1999)
3. Content issues: (Bourne, 2002)
Strategy was not connected to the goals at the level of departments, teams and individuals
(Kaplan, 1996; Bierbusse, 1997; Schneiderman, 1999)
Too many measures were used (Bierbusse, 1997)
Metrics were not well defined (Schneiderman, 1999)
The qualitative results were difficult to quantify (Bierbusse, 1997)
Categorization of the performance measures
Another problem is related to the method used to evaluate the performance. Only a few
researchers have attempted to systematically gather measures for evaluating the performance of
SCs. Moreover, the consensus over the most appropriate way to categorise them has not been
reached in the literature. For example, Shepherd (2006) has recorded several types of groupings
of the measures:
Qualitative versus quantitative measures (Beamon, 1999; Chan, 2003)
The subject of the measure: cost versus non-cost (Gunasekaran, 2001; De Toni, 2001);
quality, cost, delivery or flexibility (Scho n̈sleben, 2004); cost, quality, resource utilization,
flexibility, visibility, trust or innovativeness (Chan, 2003); resources, outputs or flexibility
(Beamon, 1999); supply chain collaboration efficiency; coordination efficiency or
configuration (Hieber, 2002); and, input, output or composite measures (Chan, 2003)
The level of the measures: strategic, operational or tactical (Gunasekaran, 2001)
10
The related process in the supply chain (e.g. Chan, 2003; Huang, 2004; Li, 2005; Lockamy,
2004; Stephens, 2001)
Another categorization has been proposed by Chan and Qi (2003) who divide the SC into six
core processes (supplier, inbound logistics, manufacturing, outbound logistics, marketing and
sales, end customers). For each of these core processes they the authors present input, output and
composite measures. Similarly, the supporters of the supply chain operations reference (SCOR)
model, (e.g. Huang, 2004; Li, 2005; Lockamy, 2004; Stephens, 2001) argue that SC performance
must be measured at multiple levels. They assign five categories of metrics to level 1 of this
model; reliability, responsiveness, flexibility, cost and efficiency indicators.
Financial aspect of SC performance measurement has been focus of many companies. However,
it has been proposed by (Kaplan & Norton, 1996) that the evaluation methods which are based
on financial measures are not suitable for newer generation of SCM applications. Many
companies realized the potentials of SCM in their operations management, but they are often not
able to develop effective performance measures and metrics. One of the reasons is that they lack
a balanced approach and do not distinguish between metrics at strategic, tactical, and operational
levels (Gunasekaran, 2001; Hudson, 2001). An effective SCM must consider the metrics which
represent a balanced approach and which are classified at strategic, tactical, and operational
levels, and which include both financial and non-financial measures (Rajat, 2007).
In summary, the need and importance of adopting a systemic and balanced approach while
designing performance measurement systems for SCs have been generally recognized in the
literature. However, a few gaps in the research related to the SC performance systems
measurement have been identified. .
First, the performance measurement systems have not been integrated with human resource
management (HRM) and modern manufacturing practices such as TQM, business process re-
engineering, JIT, or new information technologies (Shepherd, 2006). This is important since as
Wood et al. (2004) observe that the combination of these practices can lead to important
increases in success. Moreover, even though certain metrics are highly supported by some of the
manufacturing practices, they are not aligned with the strategic objectives. For example, JIT
11
encourages low inventory levels, but this can in fact contradict the strategic goal of increased SC
flexibility. Second, existing measurement systems for evaluating the performance of SCs are not
very dynamic; in fact they are rather static. Therefore, it has been suggested to focus on the
ongoing management of performance measurement systems, or on the forces that have an impact
on their evolution (Waggoner, 1999; Kennerley, 2002; Kennerley, 2003). Moreover, it has been
proposed to further examine the frequency of the evaluation and re-evaluation of the SC
performance metrics Bourne et al. (2002). Third, the literature lacks empirical studies examining
the factors influencing the success and failure in the implementation of the SC performance
measurement systems Bourne et al. (2002). Only a few studies have provided this empirical
evidence, as for example (Bititci, 2005) and (Nudurupati, 2005). This point is however
considered to be very important, because the failure rates in the implementation have been
estimated at 70%. Specifically in the SC literature there has been little research describing the
implementation. Fourth, the benchmarking of the performance of SCs is rarely found in the
literature, even though the importance of the competitors has been highlighted (e.g. Beamon,
1999). The existing studies have been usually conducted in a single country and within a specific
industrial sector (e.g. Basnet, 2003). Therefore, there the need for international benchmarking of
supply chain performance has been proposed in order to make comparisons among different
countries and various industries. Finally, only few research studies have examined the benefits
versus costs in the implementation of SC performance measurement systems. Especially in case
of small companies this can be quite important, as these may not have money, time or
information to carry out the analyses required in order to improve their SC activities (Morgan,
2004). Morgan even argues that larger companies themselves may even need to develop the
capabilities of their suppliers in order to be able to implement meaningful performance
measurement systems.
2.4 Introduction of balanced scorecard in performance measurement of
manufacturing supply chain
The need of performance measurement systems at different levels of decision-making, either in
the industry or service contexts, is not something new (Bititci, 2005). Kaplan (1992) has
proposed the balanced scorecard (BSC), as a means to evaluate corporate performance from four
different perspectives: the financial, the internal business process, the customer, and the learning
12
and growth. Their BSC is designed to complement ‘‘financial measures of past performance with
their measures of the drivers of future performance’’. The name of their concept reflects an intent
to keep score of a set of items that maintain a balance ‘‘between short term and long term
objectives, between financial and non-financial measures, between lagging and leading
indicators, and between internal and external performance perspectives’’. The early image of the
BSC serving the CEO like a control panel serves an aircraft pilot seems to have expanded to
include mechanisms to alter the course of action as well. Now, the BSC seems to serve as a
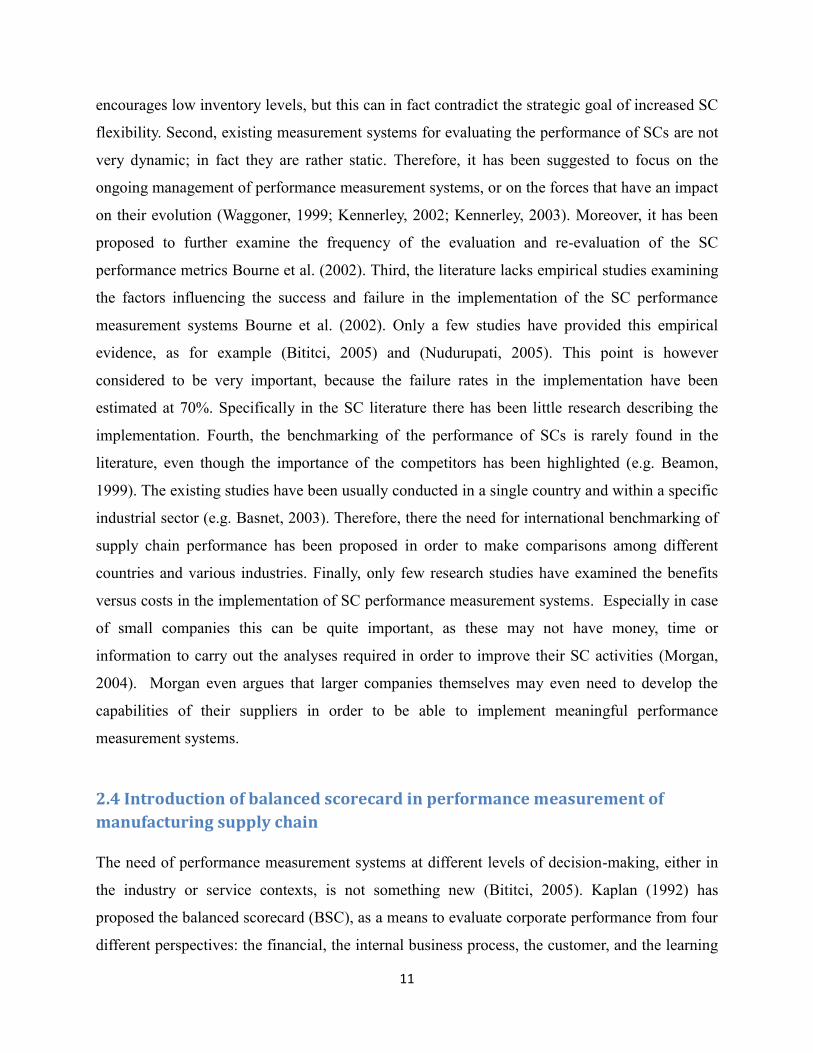
control panel, pedals and steering wheel (Malmi, 2001). Table 2 outlines the four perspectives
included in a BSC.
Table 2
The four perspectives in a balanced scorecard (Kaplan, 1992):
1. Customer perspective (value-adding view)
Mission: to achieve our vision by delivering value to our customer
2. Financial perspective (shareholders’ view)
Mission: to succeed financially, by delivering value to our shareholders
3. Internal perspective (process-based view)
Mission: to promote efficiency and effectiveness in our business processes
4. Learning and growth perspective (future view)
Mission: to achieve our vision, by sustaining innovation and change capabilities, through
continuous improvement and preparation for future challenges
The process of formulating a BSC begins when senior managers define the company’s strategy.
Spending time at the beginning to create a consistent understanding of strategy ensures that each
measure ultimately incorporated into the scorecard emanates from a company’s strategic goals
and subsequently drives the realization of those goals. It is dangerous to assume that a common
perception already exists regarding a company’s strategy, as this can lead to an incoherent
measurement system that pulls the organization in opposing directions (Brewer, 2000).
13
Once the strategy is clearly understood and articulated, the next step is to translate it into a set of
performance measures. The balanced scorecard framework created by Kaplan and Norton
suggests that balance is obtained by adopting performance measures from four different areas. As
shown in Table 2 and Figure 1, these are the customer perspective, the internal business process
perspective, the innovation and learning perspective, and the financial perspective. This
framework balances the inclination to overemphasize financial performance by incorporating
metrics related to the underlying drivers of long-term profitability, namely, business process
measures, innovation and learning measures, and customer satisfaction measures (Brewer, 2000).
The customer perspective asks for customer’s opinion. They can be general, such as those
focusing on customer value, and customer retention, or they can more specifically address a
dimension of customer value such as product and service quality, response time, flexibility, or
cost. The internal business process perspective asks what must be done internally to meet and
exceed the customers’ needs. The predominantly nonfinancial measures used here tend to focus
on four types of performance attributes: (1) quality-oriented measures, such as scrap rates or
“parts per million” defect rates; (2) time-based measures, such as throughput time or cycle time;
(3) flexibility-oriented measures, such as changeover times or yield uniformity across a range of
products; and (4) cost measures, such as no value-added costs or cost per unit of production. The
innovation and learning perspective asks what needs to be done on a continuing basis to delight
and retain customers. The focus is on the future as opposed to current capabilities. Measures tend
to relate to such issues as new product development cycle time, percentage of sales from new
products, and process improvement rates. Also, this is the segment of the scorecard in which
companies tend to incorporate human resource management measures, thereby recognizing that
people are the true drivers of innovation and learning. Finally, rather than reply solely on leading
indicators of performance that are process oriented and nonfinancial in nature, the scorecard
recognizes that ultimately companies must succeed in that all-important lagging indicator, the
financial perspective. The financial perspective can be conceptualized as a system of checks and
balances. Success in terms of the three other perspectives does not guarantee financial success. In
other words, when financial success does not materialize despite glowing nonfinancial
performance, that is a signal of flawed strategy, and senior-level managers need to rethink the
14
company’s perceived source of competitive advantage, or of flawed understanding about which
nonfinancial indicators drive financial success (Brewer, 2000).
These four perspectives of the BSC are applied to these discussed metrics or in another words the
different metrics are fitted into four different perspectives of BSC as shown in Tables 3–6. Each
of the four perspectives should be translated into corresponding metrics and measures that reflect
strategic goals and objectives. The perspectives should be reviewed periodically and updated as
necessary. The measures included in the given BSC should be tracked and traced over time, and
integrated explicitly into the strategic SCM process (Rajat, 2007).
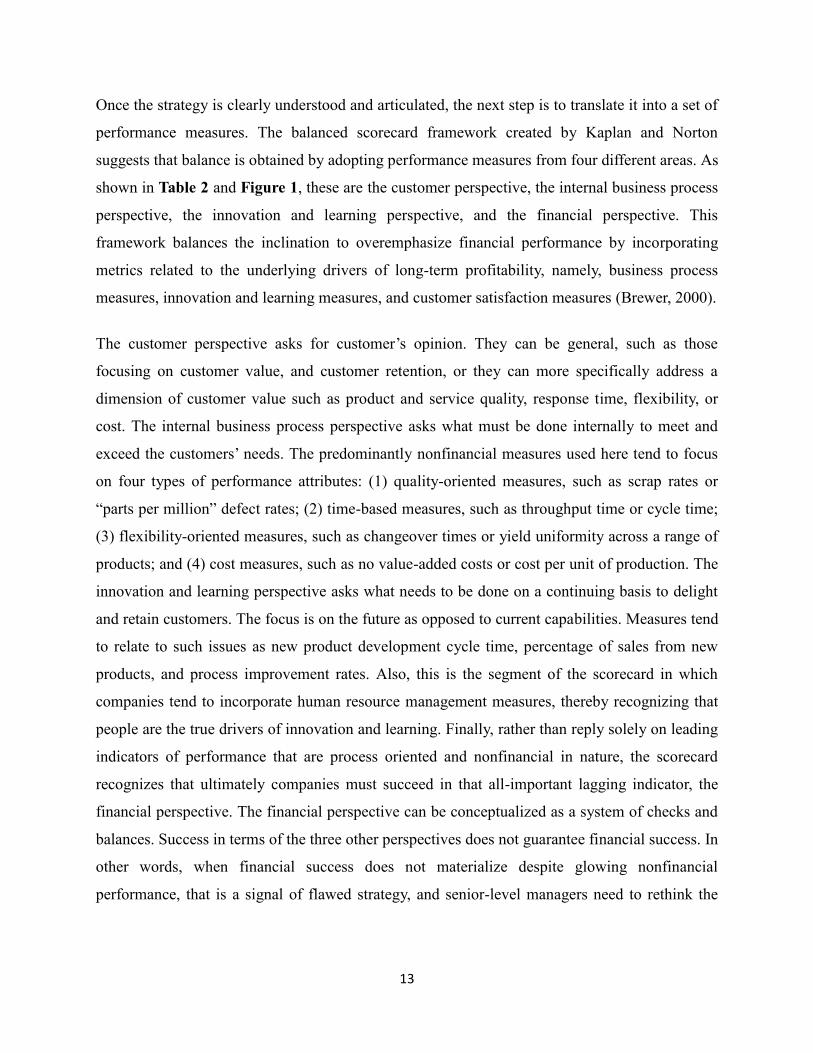
Table 3 (Rajat, 2007)
Performance metrics for the financial perspective:
1. Customer query time
2. Net profit vs. productivity ratio
3. Rate of return on investment
4. Variations against budget
5. Buyer–supplier partnership level
6. Delivery performance
7. Supplier cost saving initiatives
8. Delivery reliability
9. Cost per operation hour
10. Information carrying cost
11. Supplier rejection rate
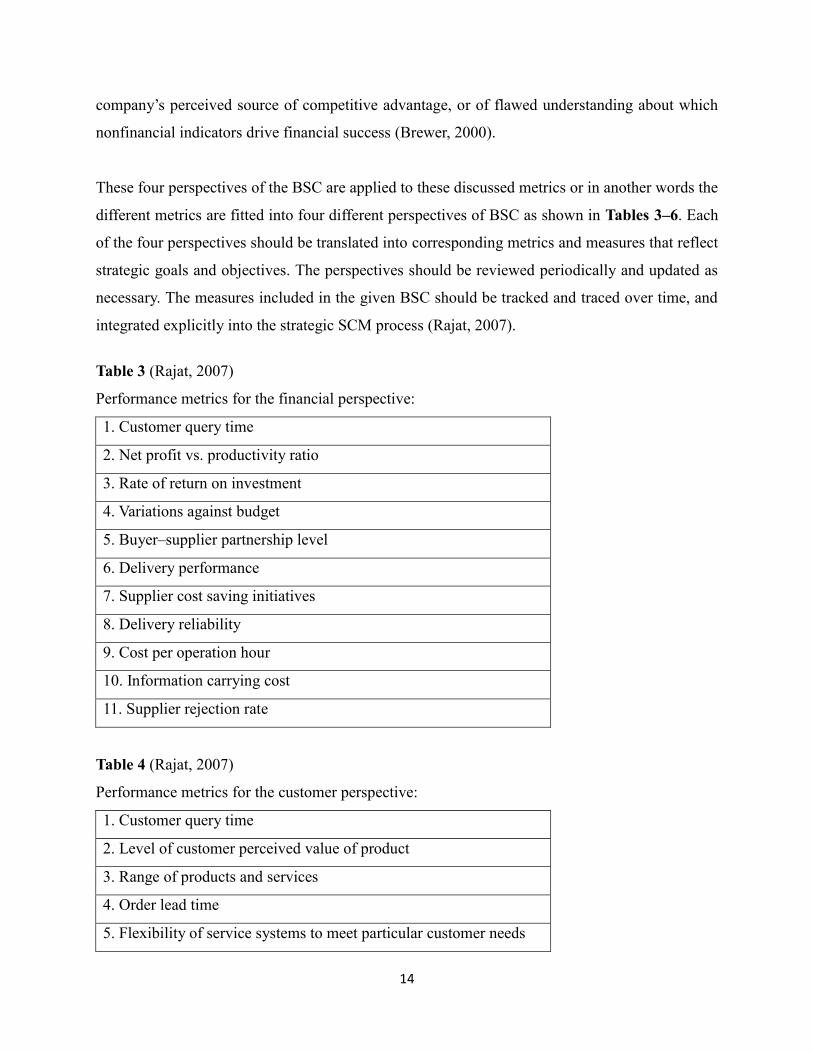
Table 4 (Rajat, 2007)
Performance metrics for the customer perspective:
1. Customer query time
2. Level of customer perceived value of product
3. Range of products and services
4. Order lead time
5. Flexibility of service systems to meet particular customer needs
15
6. Buyer–supplier partnership level
7. Delivery lead time
8. Delivery performance
9. Effectiveness of delivery invoice methods
10. Delivery reliability
11. Responsiveness to urgent deliveries
12. Effectiveness of distribution planning schedule
13. Information carrying cost
14. Quality of delivery documentation
15. Driver reliability for performance
16. Quality of delivered goods
17. Achievement of defect free deliveries
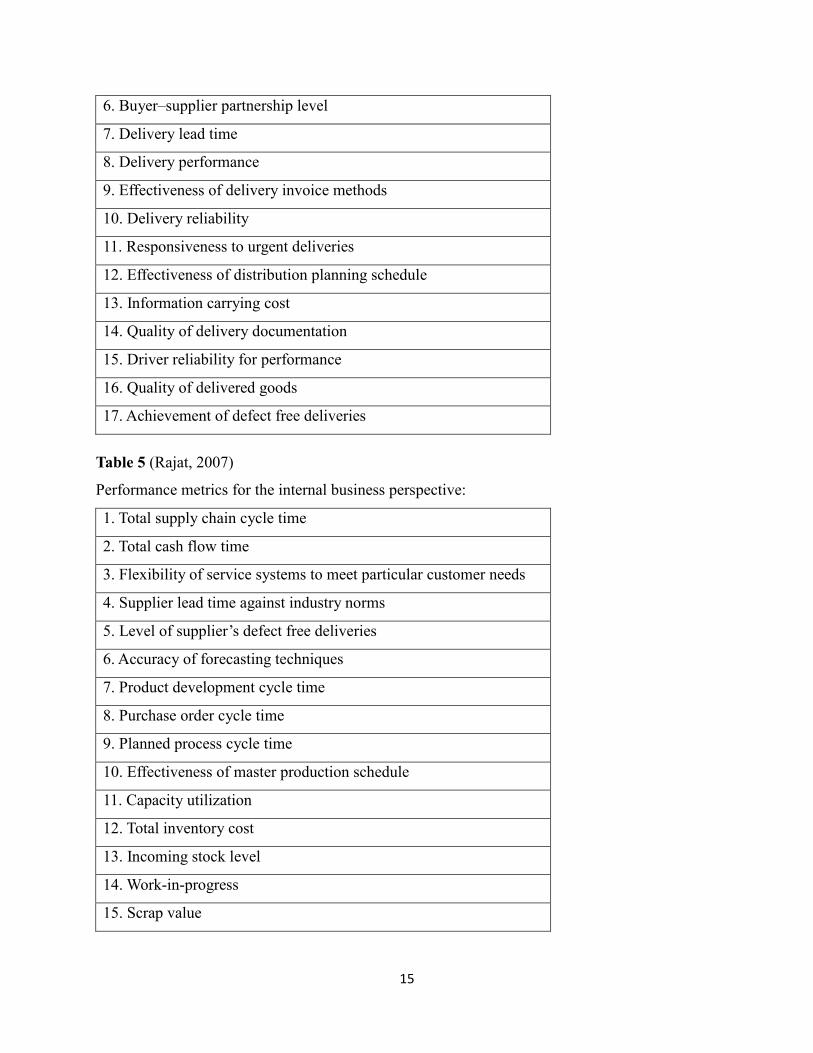
Table 5 (Rajat, 2007)
Performance metrics for the internal business perspective:
1. Total supply chain cycle time
2. Total cash flow time
3. Flexibility of service systems to meet particular customer needs
4. Supplier lead time against industry norms
5. Level of supplier’s defect free deliveries
6. Accuracy of forecasting techniques
7. Product development cycle time
8. Purchase order cycle time
9. Planned process cycle time
10. Effectiveness of master production schedule
11. Capacity utilization
12. Total inventory cost
13. Incoming stock level
14. Work-in-progress
15. Scrap value
16
16. Finished goods in transit
17. Supplier rejection rate
18. Efficiency of purchase order cycle time
19. Frequency of delivery
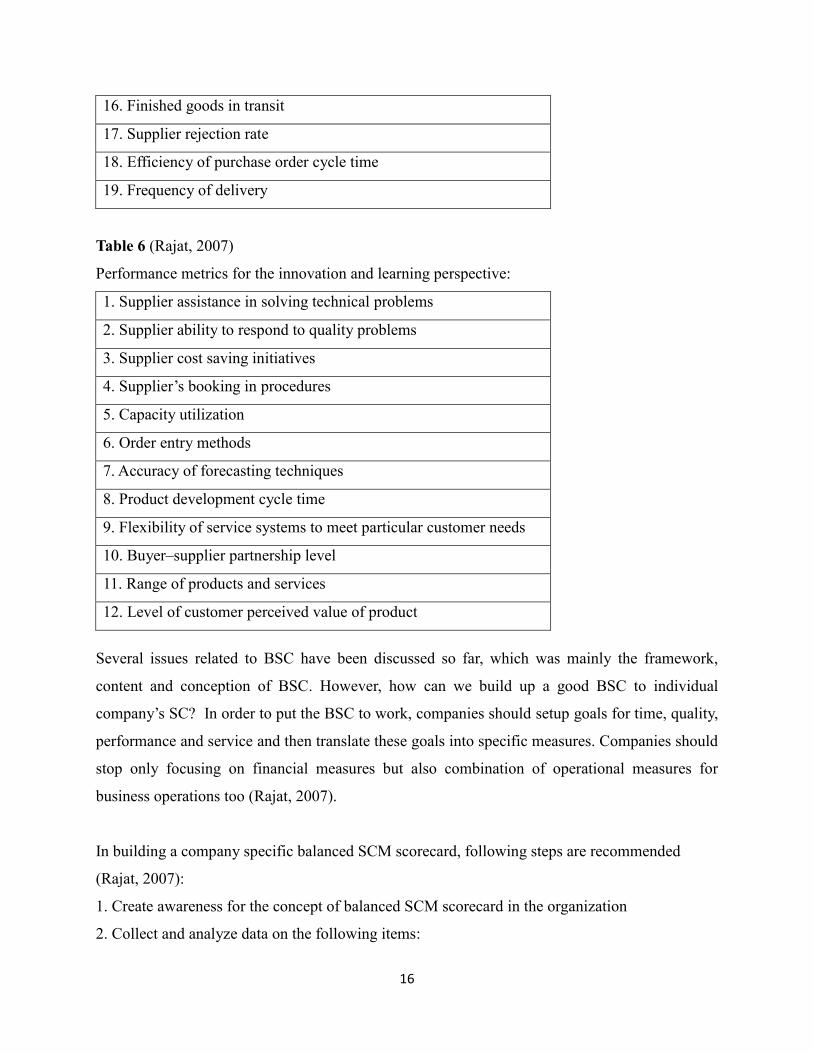
Table 6 (Rajat, 2007)
Performance metrics for the innovation and learning perspective:
1. Supplier assistance in solving technical problems
2. Supplier ability to respond to quality problems
3. Supplier cost saving initiatives
4. Supplier’s booking in procedures
5. Capacity utilization
6. Order entry methods
7. Accuracy of forecasting techniques
8. Product development cycle time
9. Flexibility of service systems to meet particular customer needs
10. Buyer–supplier partnership level
11. Range of products and services
12. Level of customer perceived value of product
Several issues related to BSC have been discussed so far, which was mainly the framework,
content and conception of BSC. However, how can we build up a good BSC to individual
company’s SC? In order to put the BSC to work, companies should setup goals for time, quality,
performance and service and then translate these goals into specific measures. Companies should
stop only focusing on financial measures but also combination of operational measures for
business operations too (Rajat, 2007).
In building a company specific balanced SCM scorecard, following steps are recommended
(Rajat, 2007):
1. Create awareness for the concept of balanced SCM scorecard in the organization
2. Collect and analyze data on the following items:
17
Corporate strategy, business strategy and SCM strategy
Specific objectives and goals related to corporate strategy, business strategy and SCM
strategy
Traditional metrics already in use for SCM evaluation
Potential metrics related to four perspectives of BSC
3. Clearly define the company specific objectives and goals of the SCM function for each of the
four perspectives
4. Develop a preliminary balanced SCM scorecard based on the defined objectives and goals of
the enterprise and the approach outlined in the paper
5. Receive comments and feedback on the balanced SCM scorecard from the management, and
revise it accordingly
6. Achieve a consensus on the balanced SCM scorecard that will be used by the organization
7. Communicate both the balanced SCM scorecard and its underlying rationale to all
stakeholders
The metrics included in the balanced SCM scorecard should meet three criteria. They should be
quantifiable, easy to understand, and ones for which data can be collected and analyzed in cost-
effective manner. It is recognized that certain aspects do not have metrics that can be measured in
quantitative terms. In such cases, it will be significant to relate these aspects to other ones that
can be quantifiable (Rajat, 2007).
Kaplan and Norton (1996) also stress the importance of adhering to three principles in order to
develop BSC that is more than a group of isolated and eventually conflicting strategies and
measures:
Build in cause-and-effect relationships
18
Include sufficient performance drivers
Provide a linkage to financial measures
Rajat and Milind (2007) mention that a strategy is a set of assumptions about cause-and-effect. If
cause-and-effect relationships are not reflected in the BSC, it will not translate and communicate
company’s vision and strategy. These cause-and-effect relationships can involve several or all
four of the perspectives in the BSC framework. For example, flexibility of service systems to
meet particular customer needs (internal business operations perspective) will be more likely to
meet customer expectations (customer perspective). Higher level of customer expectations will
lead companies to supply more innovative products and services (learning and growth
perspective). This in turn will increase the market share and profitability (financial perspective).
A well-built BSC will include an appropriate mix of outcome measures and performance drivers.
Outcome measures like total SC cycle time without performance drivers like buyer–supplier
partnership level do not communicate how the outcomes are to be achieved. Furthermore,
performance drivers without outcome measures may enable the achievement of short-term
operational improvements, but will fail to reveal whether the operational improvements have
been translated into enhanced financial performance. A company may invest resources
significantly in maintaining buyer–supplier partnership and coordination in order to improve
day-to-day business operations. If, however, there is no outcome measure for buyer–supplier
partnership (e.g. faultless deliveries), it will be difficult for companies to determine whether their
strategy has been effective. Outcome measures are more or less generic, but performance drivers
are more company-specific and will often be based on the particular strategy that is being
pursued. The ultimate aim of a balanced SCM scorecard will be to support management in a
manner that improves the overall financial performance of the enterprise. ‘‘A failure to convert
improved operational performance into improved financial performance should send executives
back to the drawing board to rethink the company’s strategy or its implementation plans’’
(Kaplan, 1996). Further, we must continuously keep in mind the fact that measurements are not
enough, since they must be used and acted upon by the management. The BSC is not only an
operational tool, but it can also be the foundation for strategic management system (Rajat, 2007).
19
2.5 Research concerning BSC in performance measurement of manufacturing
supply chain
In the previous section I addressed SCM, performance measurement in SCM and BSC in
performance measurement of SCM. All of the works which I have reviewed are related to SCM,
performance measurement, but only some of them go into a greater detail of performance
measurement of SC while used BSC. For instance, “Measuring Supply Chain Performance:
Current Research and Future Directions” (Shepherd, 2006), “Measuring supply chain
performance” (Beamon, 1999), “Using the balanced scorecard to measure supply chain
performance” (Brewer, 2000), “Analyzing supply chain performance using a balanced
measurement method” (Hans-Jörg, 2002).
Now, I will focus in detail on 2 research studies which applied similar methodologies in order to
examine performance in manufacturing SC.
In “Using the balanced scorecard in assessing the performance of e-SCM diffusion: A multi-stage
perspective”, Electronic supply chain management (e-SCM), a specific form of inter
organizational systems, has generally been regarded as one of the major strategies to create
competitive advantage. The diffusion of e-SCM among trading partners is critical for its final
successful use and accordingly, performance impact. However, the diffusion process is complex
and dynamic in nature and involves an evolutionary property across time. Innovation diffusion
Theory (IDT) is defined for effectively exploring diffusion process with multiple stages.
Moreover, prior studies have found inconclusive results of IT-enabled performance due to
inadequate measures. The balanced scorecard (BSC) with the extension to SCM, incorporating
four performance perspectives, is appropriate for overcoming this problem. Grounding on the
IDT and BSC, this study proposes a novel framework for exploring the relationships between a
stage-based structure and the BSC. Data are collected from a questionnaire survey. The results
indicate that there are significant differences between external diffusion and the two earlier
stages, adoption and internal diffusion, on the four BSC perspectives. Furthermore, all of the four
perspectives are well realized at external diffusion stage. Implications for managers and scholars
are discussed (Ing-Long, 2012). Based on the literature review and hypotheses development
which chooses e-SCM three stages model (Adoption, Internal diffusion, external diffusion), this
20
research also chooses company attributes by industry type and size. Four hypotheses are
implemented based on BSC four perspectives (Learning and Growth, Business Process,
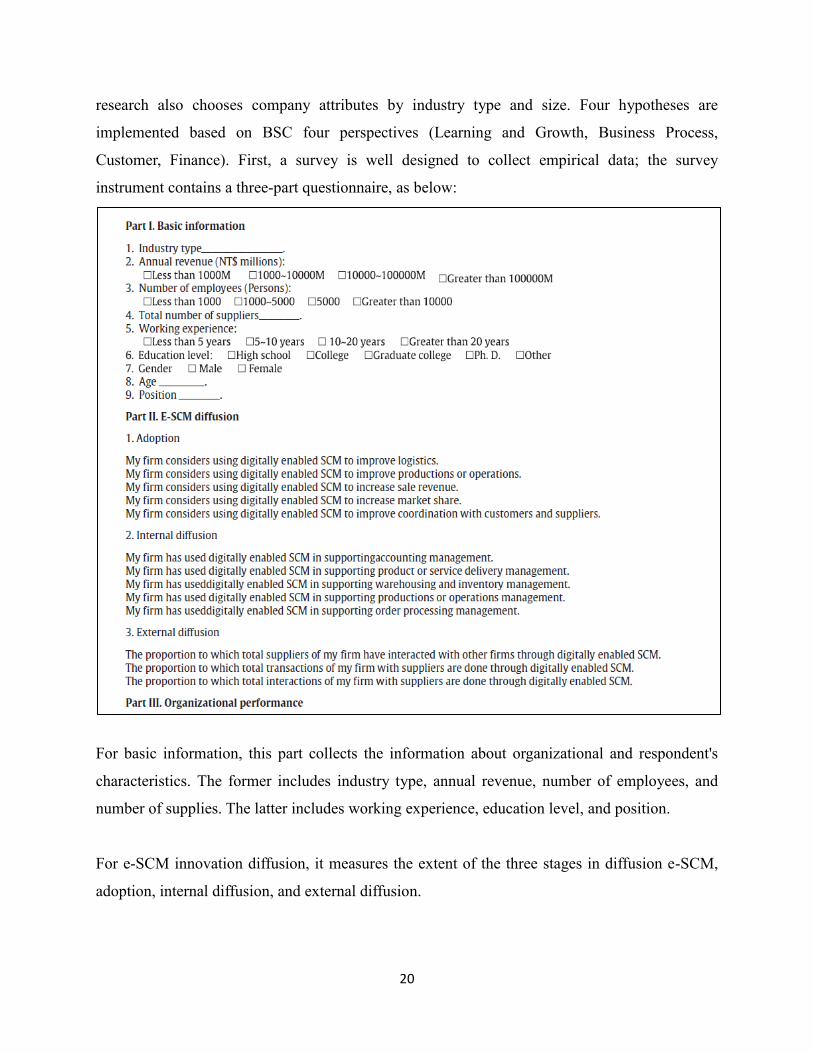
Customer, Finance). First, a survey is well designed to collect empirical data; the survey
instrument contains a three-part questionnaire, as below:
For basic information, this part collects the information about organizational and respondent's
characteristics. The former includes industry type, annual revenue, number of employees, and
number of supplies. The latter includes working experience, education level, and position.
For e-SCM innovation diffusion, it measures the extent of the three stages in diffusion e-SCM,
adoption, internal diffusion, and external diffusion.
21
For organization performance, this part measures the four performance perspectives of the BSC,
that is, finance, customer, business process, and learning and growth. The four perspectives first
identify their objectives/sub-constructs and then develop their measuring items from an extensive
literature review. As a result, the financial, customer, business process, and learning and growth
constructs comprise 7 items, 8 items, 17 items, and 6 items, respectively.
For the moderating variable, industry type was defined to include three types of industries, that is,
high-tech manufacturing, traditional manufacturing, and service. Company size was also
measured using total number of employees in a company. It consists of three types of company
size, that is, large size, medium size, and small size.
This study primarily explores the performance impact of e-SCM diffusion in organizations. The
qualified companies for this study require an emphasis on investments in SC technologies and
have considerable experience in SCM practice. Thus, it is assumed that larger companies would
be more likely to have these experiences. A sample frame was assembled from the 2009 listing of
manufacturing and service companies published by the Taiwan Stock Exchange Corporation,
which contains 1000 manufacturing and 500 service companies. Furthermore, 600 manufacturing
and 250 service companies were randomly selected as the study sample from this source. The
target respondents for this survey would be the top managers, including general managers, vice
general managers, or logistics/purchase executives in SCM division. These people are more
likely familiar with the issue of e-SCM and its performance impact. The names and addresses of
the top managers for the companies have been made publicly on their web sites. A survey
method was used for this study. This survey was conducted during the period of April–June in
2009. First, the questionnaire with a returned envelope was mailed to one of the top managers for
each company, and each company only received one questionnaire. Furthermore, in order to
improve survey return, follow-up procedure was carried out by mailing reminders for non-
respondents after 2–3 weeks (Ing-Long, 2012).
After data collection, hypotheses testing were implemented. The results show that the three
diffusion stages indicate different impacts on the four performance perspectives. In particular,
significant differences have been reported between the final stage (external diffusion) and the
22
two earlier stages (adoption and internal diffusion). Furthermore, the four performance
perspectives are well realized at external diffusion stage. First, the issue on e-SCM diffusion has
been particularly external focus on the collaboration among trading partners. Time-lag effect is
the important determinant for effectively measuring organizational performance, in particular,
customer and financial performances. In general, this can also provide insight to IT productivity
paradox for effectively designing implementation program of technology innovation. This may
be the major contribution of this research (Ing-Long, 2012).
In “Performance measurement in supply chain entities: balanced scorecard perspective”, for the
research methodology in this literature, using the framework of the BSC’s four perspectives, 15
generic performance measures were incorporated. As many companies do not wish to reveal
information concerning performance, they asked their respondents whether they measured such
performance elements, whether it was important, and the percentage change compared to the
previous year. The questions developed for the survey were derived after studying the process
and formulation of the BSC which was carried out in another study on the adoption and
formulation of the BSC in logistics companies. They also asked the respondents to denote the
importance of each indicator was important to them, on a seven-point scale (1 = not important at
all, 7 = very important). The third question required the respondents to put down the percentage
change of each indicator as compared to the previous year’s performance (Adrien, 1999).
For the sampling frame, the survey population for this study includes organizations in logistics,
manufacturing, IPOs and retailing, they wanted to view performance measurement as perceived
by different clusters of entities. And the total sampling frame comprised 652 companies. About
the return rate, 113 useful filled out questionnaires were finally returned, giving a response rate
of 17.33 percent. These results were gained after 3 rounds of phone calls.
After the collection of sample of 113 respondents, it was found that despite the need to provide a
balanced approach to performance measurement; these responding companies are still focusing
primarily on traditional measures such as gross revenue, profit before tax. From a SC perspective,
the non-tangible logistics performance indicators such as on-time delivery, customer satisfaction,
23
and cost reduction are perceived to be most important but they are not the most measured of the
indicators (Adrien, 1999).
The results further suggest that managing a given SC’s overall performance necessitates the
coordination of measures across the different entities on the SC. In essence, this requires all
entities on the SC to adopt a common balanced perspective in their performance measurement
and management in order to facilitate the overall performance and competitiveness of the entire
SC (Adrien, 1999).
The results also concur with (Norreklit, 2008) in that there are clear and obvious pitfalls when
measuring the performance of a company, even in applying the BSC perspective. While financial
measures are critical in determining the failure and success of a company, these are not holistic
enough to ensure long-term sustainability of the company especially in the light of the current
climate of ecological and social responsibility. The BSC approach should never be applied as a
method to justify the financial performance of a company at the expense of the other less
tangible but equally significant measures such as employee retention.
They also mentioned that this study could be extended to other countries in the surrounding
Asian region, thus making a comparative study possible. Further, the study could be enabling a
longitudinal analysis of the SC clusters over time. The results collected over time could also be
used as benchmarks to the SC entities in Singapore, and such benchmarks may then be evaluated
(Adrien, 1999).
2.6 Other popular performance measurement models
I already addressed BSC model more in detail, but in over 50 literatures which have been
reviewed, there are also other popular models which have been implemented in real world. Here,
I want to discuss the most popular ones which are the Supply Chain Operations Reference
(SCOR) model and Total Quality Management (TQM) model.
24
2.6.1 The supply chain operations reference (SCOR) model
The Supply Chain Operations Reference (SCOR) model released by Supply Chain Council (SCC)
in 1996 has been widely studied and used in research and industry. Researchers and practitioners
have found the SCOR Model which is a good reference that integrates most of the business
processes of an organization in a cross-functional framework. SCOR is based on five distinct
management processes, namely Plan, Source, Produce, Deliver and Return. These five processes
form the top level of the SCOR model. Each process is further decomposed into lower levels
(Chen, 2007).
SCOR is developed as a cross-industry standard for SCM. It uses a process reference model to
explain a SC. The process reference model is a combination of business-process reengineering,
benchmarking and best practices analysis. The process reference model is aimed at providing a
framework for performance measures and best practices for standard processes. SCOR apply
interactions with customers/markets and transactions with products. SCOR is based on
management processes like plan, source, make, deliver and return. It actually defines the SC as
an integrated process of these management processes. It gets activated from the stage of
supplier’s supplier up to customer’s customer. It is aligned with operational strategy, material,
work and information flows. Thus SCOR enables communication among SC partners. The heart
of the SCOR system is a pyramid of four levels that represent the path a company takes on the
road to SC improvement. The pyramid can be seen in the Figure 2. The top level defines the
scope and content for the model and sets the basis for performance targets. Configuration level
configures the SC so that the operational strategy can be implemented. The third level e.g. the
process element level consists of process element definitions, information inputs and outputs,
performance metrics, best practices and system capabilities to support best practices. The
implementation level is concerned with defining practices to achieve competitive advantage.
SCOR thus provides list of performance measure for each activity and process in a SC, aligns
these measures with the strategic objectives and provides the best practices for each
measurement. It is therefore used to describe measure and evaluate SC (Ambuj, 2012).
The SCOR model involves more than sixty process steps and more than two hundred metrics.
While the Supply Chain Council indicates that the model can be used in almost every industry,
25
any SC from a simple supply chain network to a very complex one, the SCOR model is not easy
to implement. In order to use the SCOR model effectively, managers need to examine and
understand their companies’ specific SC processes. Simply following all the processes and
metrics listed in the SCOR model will not work for most companies. First, the SCOR model was
originally designed mainly for the manufacturing industry, and so a large portion of the model is
focused on three processes, “Make” (production), “Build-to-Order Product Source” and “Deliver”
(Chou, 2004).
2.6.2 Total quality management (TQM) model
TQM is a philosophy, a set of guiding principles, and actions which compel an entire origination
to excellence and efficiency in personal and corporate activities. It is the application of
quantitative methods, technical tools, and management techniques to improve all the processes
within an organization and continuously exceed customer needs (Chou, 2004).
According to (Besterfield, 2003), TQM requires six basic concepts:
1. A committed and involved management to provide long-term top-to-bottom organizational
support
2. A focus on the customer, both internally and externally
3. Effective involvement and utilization of the entire work force
4. Continuous improvement of the business and production process
5. Treating suppliers as partners
6. Establishment of performance measures for the processes
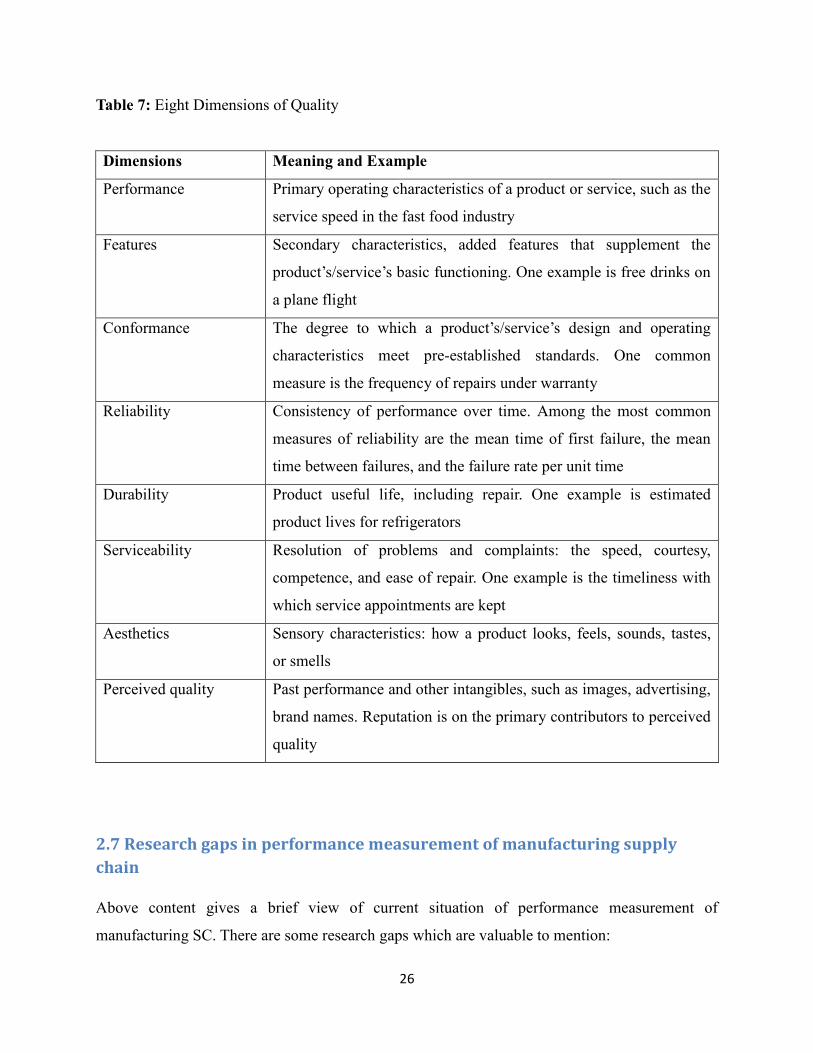
Garvin (1988) identified eight dimensions of quality. The table below shows these eight
dimensions with their meanings and explanations. These dimensions are partly independent,
which means that a product or service can be excellent in on dimension and average or poor in
another.
26
Table 7: Eight Dimensions of Quality
Dimensions Meaning and Example
Performance Primary operating characteristics of a product or service, such as the
service speed in the fast food industry
Features Secondary characteristics, added features that supplement the
product’s/service’s basic functioning. One example is free drinks on
a plane flight
Conformance The degree to which a product’s/service’s design and operating
characteristics meet pre-established standards. One common
measure is the frequency of repairs under warranty
Reliability Consistency of performance over time. Among the most common
measures of reliability are the mean time of first failure, the mean
time between failures, and the failure rate per unit time
Durability Product useful life, including repair. One example is estimated
product lives for refrigerators
Serviceability Resolution of problems and complaints: the speed, courtesy,
competence, and ease of repair. One example is the timeliness with
which service appointments are kept
Aesthetics Sensory characteristics: how a product looks, feels, sounds, tastes,
or smells
Perceived quality Past performance and other intangibles, such as images, advertising,
brand names. Reputation is on the primary contributors to perceived
quality
2.7 Research gaps in performance measurement of manufacturing supply
chain
Above content gives a brief view of current situation of performance measurement of
manufacturing SC. There are some research gaps which are valuable to mention:
27
1. Based on most of the research papers which have been reviewed, they only focus on their
company’s SC, they did address the whole SC based concept (e.g. Basnet, 2003; Barbara
Bigliardi, 2010), as a typical model which includes supplier, manufacturer, distributor and
retailer
2. Because different types of manufacturing SCs require specific performance measurement
system, it is very difficult to create a general approach which can be applied on all types of
manufacturing industries and no literatures mentioned it
3. Most of the research works focus only on a specific country and on a specific market sector
(e.g. Basnet, 2003; Barbara Bigliardi, 2010). There is a need for international benchmarking of
SC performance, across countries and different market sectors
4. There are some studies which did surveys for data collection of performance measurement
research within manufacturing SC. But collected data are limited because of the creation of items
of questionnaires (e.g. Ing-Long , 2012; Basnet, 2003)
5. Most of the research studies which have been reviewed only apply four perspectives from
BSC model (e.g. Rajat , 2007; Barbara, 2010)
6. Most works which have been reviewed do not discuss the weightings of different metrics in
order to measure manufacturing SC performance (e.g. Hans-Jörg Bullinger, 2002; Brewer, 2000)
3. Objective
My research was inspired by BSC concept and also from my working experience, because I was
dealing with international electronics’ SCs, and there was no performance measurement system
to measure the SC performance in these SCs. From here came an idea which to motivated me to
28
develop a simple, practice and comprehensive tool which can measure SC performance. The
thesis has 2 main objectives:
1. To develop a new methodology for the performance measurement of manufacturing SC.
It was determined that the methodology should be generic, comprehensive, simple but still
capturing well the importance of the criteria. Each of these characteristics are discussed below:
The proposed methodology should represent a generic approach, i.e. the developed tool
should be effective when applied to a wide range of manufacturing SCs. Also, this
methodology is not limited geographically; it can be applied in any country or region. These
characteristics will greatly increase the applicability and usefulness of the methodology.
Another important characteristic of the methodology is its simplicity. In order for the
companies to regularly use an assessment tool it should be relatively simple. For example,
SCOR model may be the most popular model which has been applied to a mount of
manufacturing SCs, but normally the number of attributes is over 200 and they are not fixed.
It will be very difficult to handle those values even using advanced IT solutions. BSC, on the
other hand, usually involves less attributes, but the attributes are not fixed. BSC does not give
specific attributes in each perspective, and companies need to choose or create by themselves
according to their business goals or requirements. My objective is thus to develop a simple
methodology compared to these methodologies, with a hope that it may be easily applied in
the real life.
As discussed above, most of the tools proposed in the literature do not take into consideration
weights of various metrics and indicators. For example, BSC or SCOR do not incorporate the
weights for the various attributes. Because you cannot know which attribute is more
important and which one is less important for measuring the SC performance without
weights. The introduction of weights for the attributes should allow capturing the importance
of each criterion for each specific SC. These weights should therefore be one of the important
features of the methodology.
29
2. To evaluate manufacturing SC performance and carry out a comparative analysis of
existing SCs. Here, 3 sub-objectives were determined as follows:
To analyze the general status of performance measurement of manufacturing SCs based on
the globally collected data.
To evaluate weighted performances of manufacturing SCs based on 4 factors: Evaluations
and comparisons will be performed based on different industries, different countries, based
on the adherence of the companies to a strategic alliance and based on the use of the
performance measurement systems in the companies.
To determine the most important attributes for each compared group (heavy versus light
industry SCs, national versus international SCs, SCs with and without strategic alliance, SCs
using and not using the performance measurement systems)
4. Methodology
4.1 Tool development
In this part, I will introduce the development process of this tool in details within 2 parts, first is
the importance of attributes, there are totally 23 attributes in this part within 4 different
perspectives. The objective in this part is to gain different values of importance weights for each
attribute. The second part is the status of attributes; there are also totally 23 attributes in this part
within 4 different perspectives. The objective in this part is to gain values of current
performances for each attribute.
As it was decided, this tool should be a very simple tool to use; it should be easy to apply to the
whole manufacturing SC. After consideration, 23 attributes have been selected. It was decided
that for any manufacturing SC, a little more over 20 attributes should not be that difficult and
time consuming to apply.

30
This tool should be also a comprehensive tool, it should cover all elements of a manufacturing
SC. It was therefore decided that 4 perspectives of this tool can accomplish this task within 23
attributes in details.
It is also should be a generic tool, therefore in the development process, I evaluated every single
attribute in order to make sure each of them can be applied to all kinds of manufacturing SCs.
One of the characteristics of this tool is that it should be able to capture the different weights of
importance for different attribute in the whole SC. In order to achieve this objective I developed
the 1 to 5 scale system and applied the student T-distribution.
4.1.1 Development of importance of attributes
As I mentioned earlier, I want this tool can measure different attributes of the whole SC, and also
their associated weights. 4 perspectives which are resource, customer-based interaction, SC-
based interaction and flexibility have been developed in this tool, totally 23 different high level
attributes have been given. There are 4 attributes in resource perspective, 8 in customer-based
interaction perspective, 7 in SC-based interaction perspective and 4 in flexibility perspective. I
will discuss the reasons to develop these 4 perspectives in details, the first perspective is resource,
as we can see, resource is a very typical and important perspective, because resources are the
fundamentals for any manufacturing SCs, without materials, no manufacturing SCs can exist.
Resource is also an important perspective which has been mentioned in (Beamon, 1999), I agree
with Beamon’s opinion here and define resource as the first perspective. The fourth perspective
which is flexibility is developed by my working experience, I saw the real performances for my
company’s SC against some emergencies such as customer’s large amount of orders and I
thought it is a very good perspective to measure the SC’s performance. It can be also found in
some literatures (e.g. Beamon, 1999). As we know in BSC model, there are total 4 perspectives
which are financial perspective, customer perspective, internal business perspective and
innovation and learning perspective. Because the scope of BSC is not based on the whole
manufacturing SC, some behaviors of SC are lost in these 4 perspectives, for example, SC-based
interaction, it covers all the activities inside the whole SC, but BSC model cannot cover them
31
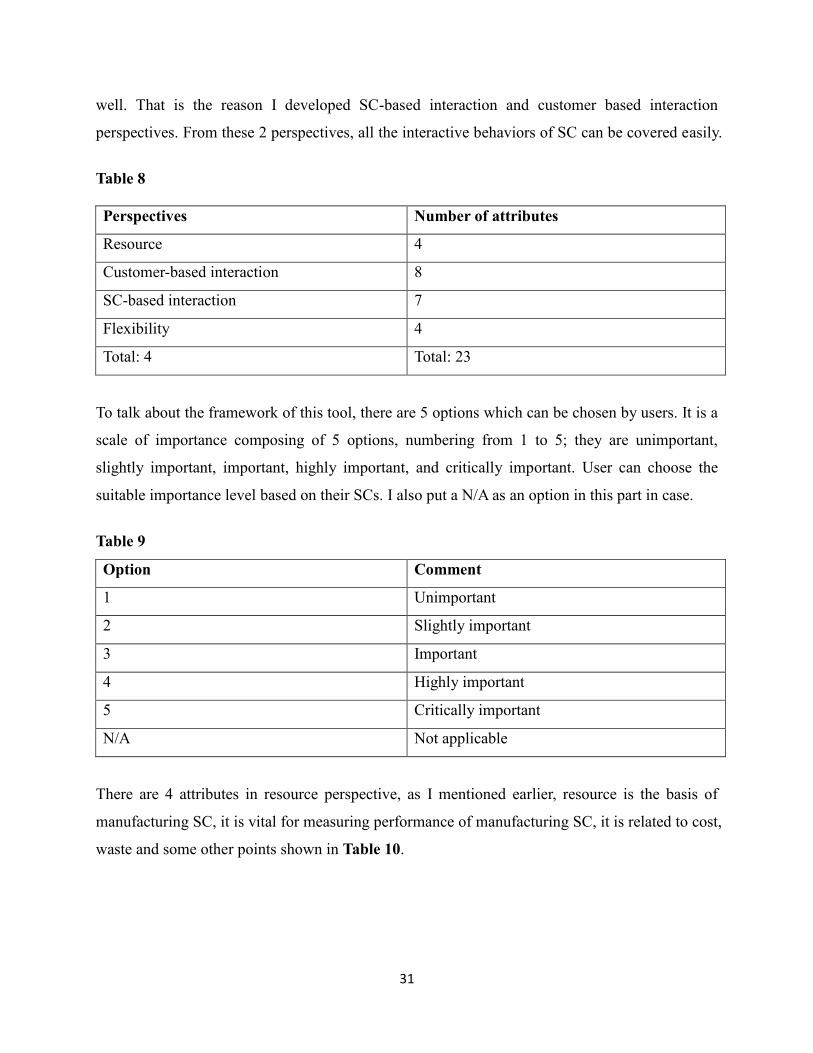
well. That is the reason I developed SC-based interaction and customer based interaction
perspectives. From these 2 perspectives, all the interactive behaviors of SC can be covered easily.
Table 8
Perspectives Number of attributes
Resource 4
Customer-based interaction 8
SC-based interaction 7
Flexibility 4
Total: 4 Total: 23
To talk about the framework of this tool, there are 5 options which can be chosen by users. It is a
scale of importance composing of 5 options, numbering from 1 to 5; they are unimportant,
slightly important, important, highly important, and critically important. User can choose the
suitable importance level based on their SCs. I also put a N/A as an option in this part in case.
Table 9
Option Comment
1 Unimportant
2 Slightly important
3 Important
4 Highly important
5 Critically important
N/A Not applicable
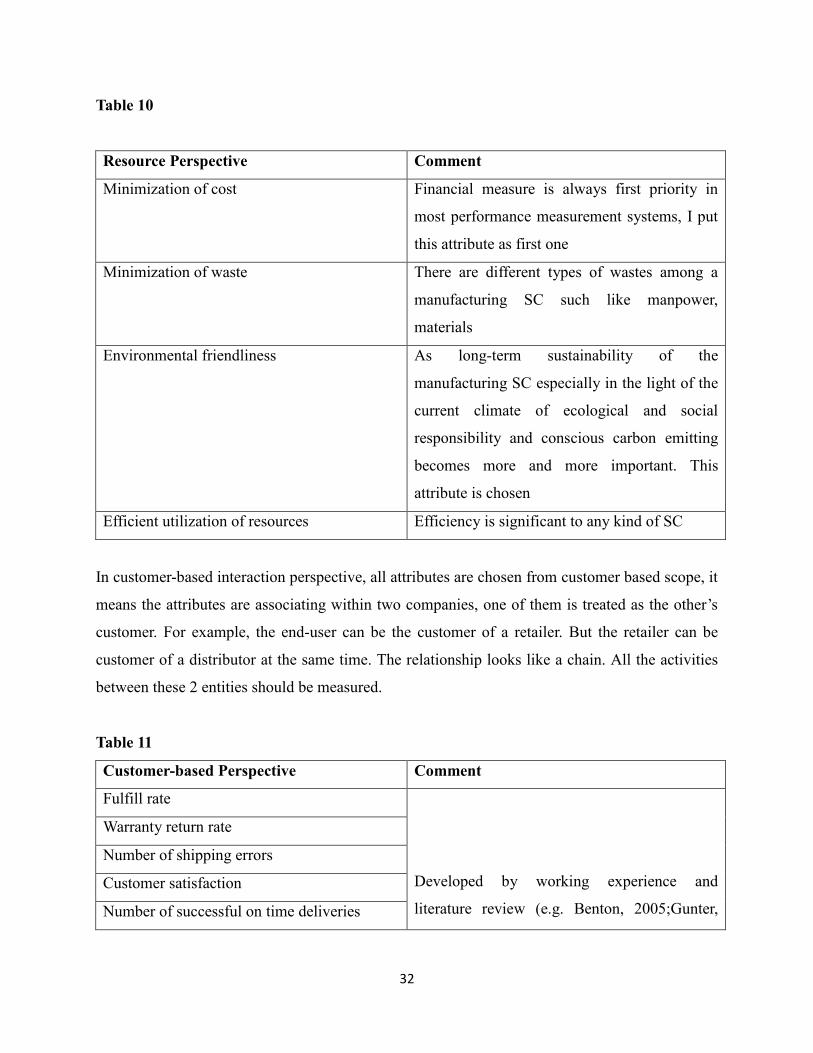
There are 4 attributes in resource perspective, as I mentioned earlier, resource is the basis of
manufacturing SC, it is vital for measuring performance of manufacturing SC, it is related to cost,
waste and some other points shown in Table 10.
32
Table 10
Resource Perspective Comment
Minimization of cost Financial measure is always first priority in
most performance measurement systems, I put
this attribute as first one
Minimization of waste There are different types of wastes among a
manufacturing SC such like manpower,
materials
Environmental friendliness As long-term sustainability of the
manufacturing SC especially in the light of the
current climate of ecological and social
responsibility and conscious carbon emitting
becomes more and more important. This
attribute is chosen
Efficient utilization of resources Efficiency is significant to any kind of SC
In customer-based interaction perspective, all attributes are chosen from customer based scope, it
means the attributes are associating within two companies, one of them is treated as the other’s
customer. For example, the end-user can be the customer of a retailer. But the retailer can be
customer of a distributor at the same time. The relationship looks like a chain. All the activities
between these 2 entities should be measured.
Table 11
Customer-based Perspective Comment
Fulfill rate
Developed by working experience and
literature review (e.g. Benton, 2005;Gunter,
Warranty return rate
Number of shipping errors
Customer satisfaction
Number of successful on time deliveries
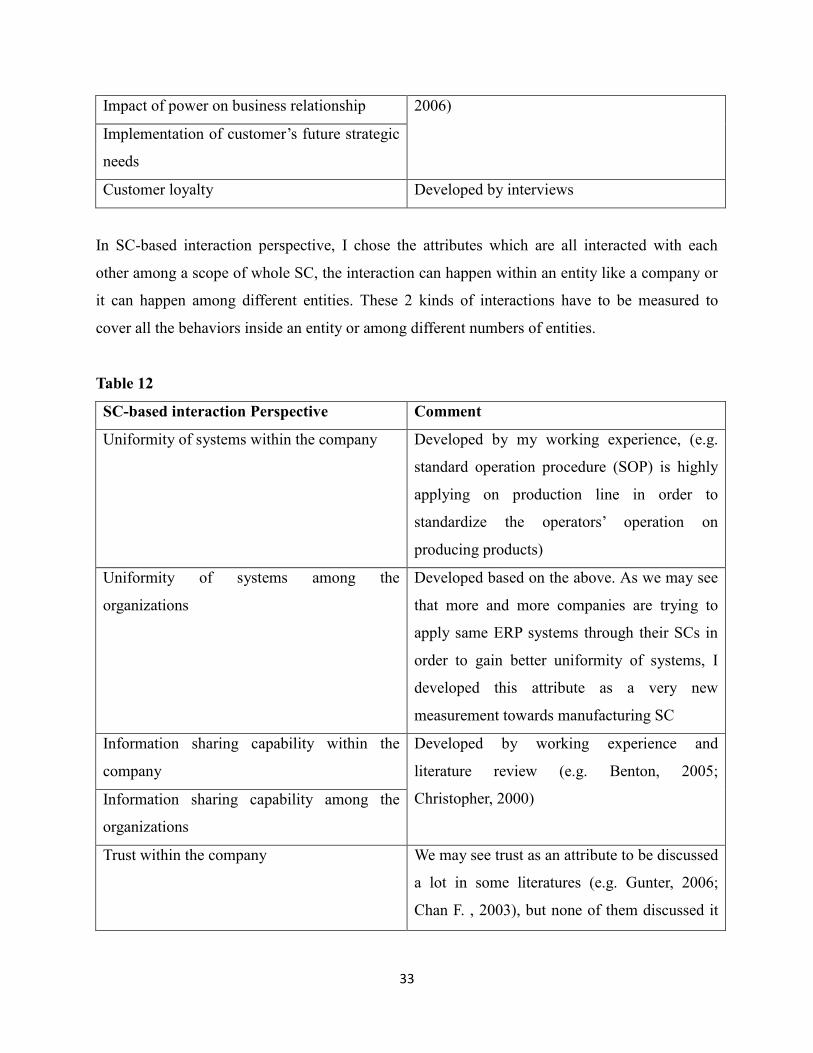
33
Impact of power on business relationship 2006)
Implementation of customer’s future strategic
needs
Customer loyalty Developed by interviews
In SC-based interaction perspective, I chose the attributes which are all interacted with each
other among a scope of whole SC, the interaction can happen within an entity like a company or
it can happen among different entities. These 2 kinds of interactions have to be measured to
cover all the behaviors inside an entity or among different numbers of entities.
Table 12
SC-based interaction Perspective Comment
Uniformity of systems within the company Developed by my working experience, (e.g.
standard operation procedure (SOP) is highly
applying on production line in order to
standardize the operators’ operation on
producing products)
Uniformity of systems among the
organizations
Developed based on the above. As we may see
that more and more companies are trying to
apply same ERP systems through their SCs in
order to gain better uniformity of systems, I
developed this attribute as a very new
measurement towards manufacturing SC
Information sharing capability within the
company
Developed by working experience and
literature review (e.g. Benton, 2005;
Christopher, 2000) Information sharing capability among the
organizations
Trust within the company We may see trust as an attribute to be discussed
a lot in some literatures (e.g. Gunter, 2006;
Chan F. , 2003), but none of them discussed it
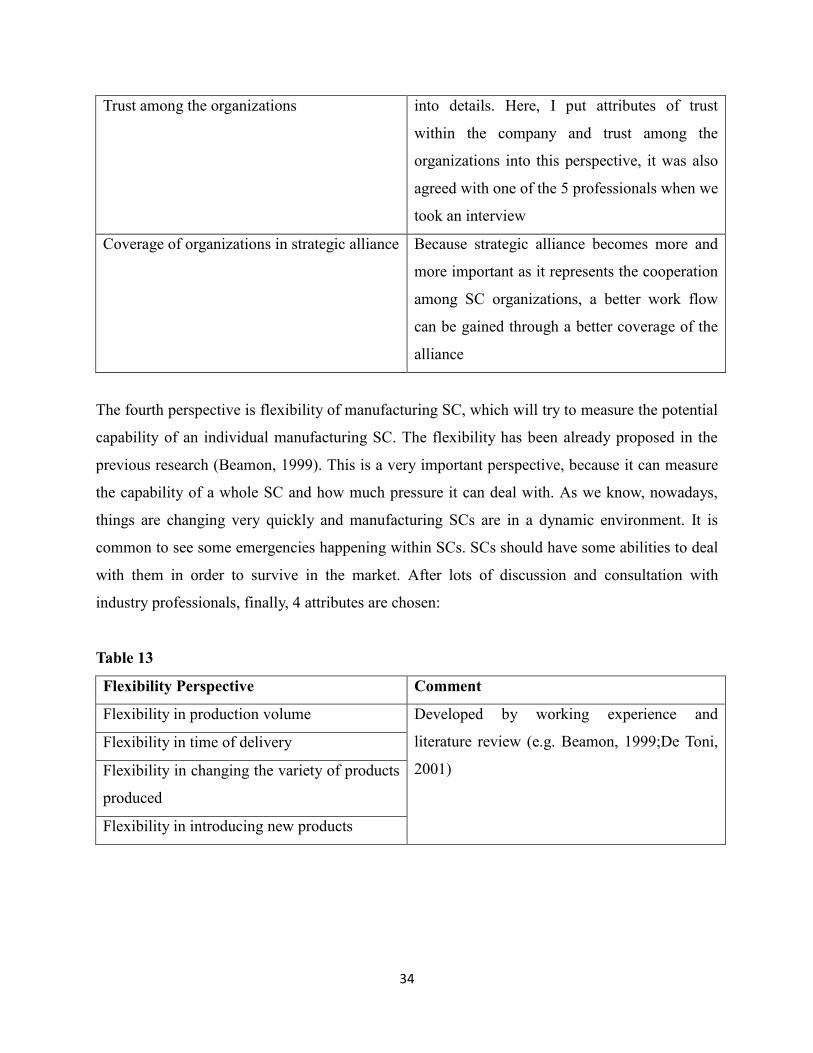
34
Trust among the organizations into details. Here, I put attributes of trust
within the company and trust among the
organizations into this perspective, it was also
agreed with one of the 5 professionals when we
took an interview
Coverage of organizations in strategic alliance Because strategic alliance becomes more and
more important as it represents the cooperation
among SC organizations, a better work flow
can be gained through a better coverage of the
alliance
The fourth perspective is flexibility of manufacturing SC, which will try to measure the potential
capability of an individual manufacturing SC. The flexibility has been already proposed in the
previous research (Beamon, 1999). This is a very important perspective, because it can measure
the capability of a whole SC and how much pressure it can deal with. As we know, nowadays,
things are changing very quickly and manufacturing SCs are in a dynamic environment. It is
common to see some emergencies happening within SCs. SCs should have some abilities to deal
with them in order to survive in the market. After lots of discussion and consultation with
industry professionals, finally, 4 attributes are chosen:
Table 13
Flexibility Perspective Comment
Flexibility in production volume Developed by working experience and
literature review (e.g. Beamon, 1999;De Toni,
2001)
Flexibility in time of delivery
Flexibility in changing the variety of products
produced
Flexibility in introducing new products
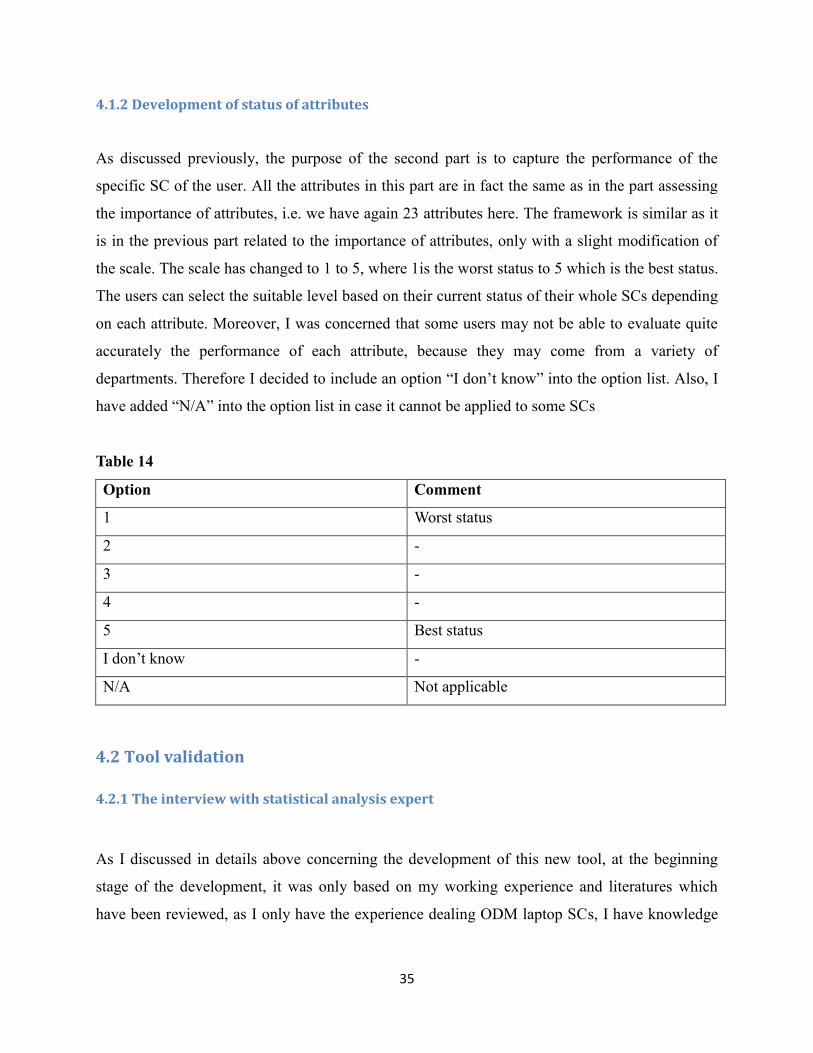
35
4.1.2 Development of status of attributes
As discussed previously, the purpose of the second part is to capture the performance of the
specific SC of the user. All the attributes in this part are in fact the same as in the part assessing
the importance of attributes, i.e. we have again 23 attributes here. The framework is similar as it
is in the previous part related to the importance of attributes, only with a slight modification of
the scale. The scale has changed to 1 to 5, where 1is the worst status to 5 which is the best status.
The users can select the suitable level based on their current status of their whole SCs depending
on each attribute. Moreover, I was concerned that some users may not be able to evaluate quite
accurately the performance of each attribute, because they may come from a variety of
departments. Therefore I decided to include an option “I don’t know” into the option list. Also, I
have added “N/A” into the option list in case it cannot be applied to some SCs
Table 14
Option Comment
1 Worst status
2 -
3 -
4 -
5 Best status
I don’t know -
N/A Not applicable
4.2 Tool validation
4.2.1 The interview with statistical analysis expert
As I discussed in details above concerning the development of this new tool, at the beginning
stage of the development, it was only based on my working experience and literatures which
have been reviewed, as I only have the experience dealing ODM laptop SCs, I have knowledge
36
concerning electronics SCs, but as I mentioned early in this research, I want to develop a general
approach in order to apply to all kinds of manufacturing SCs and also my opinion is subjective.
It can be verified by interviews with industry professionals, and they should be from different
industries instead of only one specific industry in order to validate this tool.
The number of necessary interviews which would validate the tools has been discussed with a
statistical analysis expert whose name is Mr. Carl St-Pierre from Ecole Polytechnique. It is
confirmed that 5 to 10 interviews can validate this tool.
4.2.2 The interviews with 5 professionals from different industries
The next step involved finding the professionals from various SCs which would be willing to be
interview. When there was an opportunity to join an annual event of American Society of
Quality (ASQ) in HEC Montreal, I registered this event and went to HEC Montreal to participate
in it. This way I got a lot of opportunities to talk with quality professionals from a variety of
backgrounds, and I got the chance to know a few senior experts who are working in
manufacturing fields. Also, since Linked-In as a professional social networking tool has become
very popular among professionals, I became also a member in hope to find some suitable
interviewees. I even paid to upgrade my membership to the highest level, which allowed sending
more in-mails to invite more members. Further than finding suitable interviewees through events
and online, I even contacted my networks in China as the manufacturing industry in China is
developed. My effort was paid back well; finally, I invited 2 professionals from the ASQ event, 1
from Linked-in and 2 from my networks in China. These 5 professionals are from 5 different
industries as I expected:
The first interview I took is with Ms. Sandra Lafleur who is a Linked-in member and also a
senior buyer from Hector Larivee, Hector Larivee is a food service company, it is the No. 1 food
service company in Quebec, it plays a role as distributor among its food SC and Ms. Lafleur
takes the responsibility of sourcing raw materials. She invited me to take a business trip to her
office which is located in Montreal, I went to her office which is also the distributor center and
warehousing center of Hector Larivee, in 2 hours interview, she gave me lots of suggestions
37
concerning the framework, attributes for this tool, after that, she took me to visit her company,
and told me a lot concerning her company’s whole SC.
The second interview I took is with Ms. Veronica Marquez, Ms. Marquez is a certified lean Six
Sigma Black Belt holder, also ASQ member and mentor. She has very rich working experience
with logistics and SC operations. Now, she is working in CHEP international, CHEP
international is a large international company and it has many branches including one branch in
China, its Montreal office is located in Saint-Laurent area. CHEP is helping other companies to
handle their logistics, they provide pallets service, especially have expertise in dealing with
chemical materials. Its SC models contain B2B. Ms. Marquez is an Account Manager in CHEP
and dealing with internal operations and logistics, external suppliers, such as carriers as well as
customers to ensure satisfaction whole making processes as efficient as possible to reduce cost
and eliminate waste. We took the interview in CIISE department of Concordia, in 2 hours
interview, she gave me advice concerning this tool and research methodology.
The third interview I took is with Mr. Tao Liu, Mr. Liu is a Project Manager in MCC China,
MCC China is a company in metallurgy industry, and they produce large instruments for
producing metals. Mr. Liu is dealing with many suppliers for their production of instruments and
their SCs also include B2B model, their customers are among the world especially in Europe.
Because we are in different time zones and the long distance between us, I chose an online
interview with him, I make an appointment with him then we took it.
The fourth interview I took is with Mr. Alex Zhao, Owner and General Manager of AVAN
international. AVAN international is a private company which is dealing with plastic injection,
and produces many plastic products for food industry. As the owner of AVAN, Mr. Zhao has 25
years working experience in plastic manufacturing field and also SC operations, he gave me very
useful suggestions related to the attributes and data collection.
The last interview was taken with Mr. Mutair Kadiri, he is a Project Manager who is taking care
of supplier performance management in Honeywell Aerospace, and he is ASQ-CSSBB and
ASQ-CQE member. It is worth to mention that Mr. Kadiri’s job function is to deal with suppliers’
38
performance; it is highly related to my research. We took the interview in CIISE department of
Concordia.
To summarize, I took around 20 hours for these 5 interviews and for each about 2 hours. The
interviews have been fully recorded and analyzed after that. The main conclusion of all the
interviewed professionals was that this is an effective tool for measuring manufacturing SC.
4.3 Proposed application of the tool
The proposed tool has been developed as very practical and it is one of the hopes of this research
that the tool can be used in the real industrial setting. As discussed previously, any
manufacturing SC in any industry and any country can use it. It may be slightly modified to suit
the specific SC features, but no special preparation is necessary in order to start using the tool.
The simplicity of the tool will encourage the companies to adopt the tool. Here is the proposed
application of the tool:
Representatives from each company within a specific manufacturing SC will be selected and
they should have regular meetings where they would sit together and provide assessment with
each attributes’ status, and after enough data has been collected, the calculation will give the
final value of performance for each perspective and attribute. I suggest that the tool can be
applied every quarter and the results should be compared to the ones from the last quarter. This
will allow an easy tracking of the performance of the SC. Through this method, companies in the
whole manufacturing SC can note their weaknesses concerning perspectives or attributes, then,
they can work on that to improve the performances in next quarter.
4.4 Development of questionnaire
After development of the tool, I need to evaluate the SCs and compare different SCs based on the
4 perspectives and 23 attributes. I need to get insight into a lot of SCs within a lot of industries
39
and a lot of countries, therefore in order to get the data, to take interviews is impossible or very
difficult to achieve. A survey with questionnaires is decided in order to obtain enough data.
Therefore, I created the format and content of the questionnaire according to this tool. A survey
was ongoing and questionnaires were distributed through online and over email, when data was
collected, the calculation was applied to give results on specific manufacturing SC’s performance
across a variety of countries and industries. Based on the results, different SCs can obtain a good
insight on their SC performance and improve those attributes with poor performance in future.
In the introductory part of my questionnaire I included apart from the usual information three
important points. First of them was a figure which shows five typical organizations of a whole
supply chain. They are supplier, manufacturer, distributor, retailer and end-user. It is not
common to see a figure at beginning of a questionnaire. The reason is that my research is based
on the whole SC concept, not a single company’s SC. I want to make this very clear to the
respondents that this is as a fundamental for my research, because any responses which evaluate
attributes of single companies instead of the whole SCs would alter the results. I therefore
further highlighted this point within a figure. I also included the comment as below:
“As indicated in the figure above, please pay attention that this questionnaire is based on the
whole SC which includes your company. It is not based on your company’s SC. If your company
has headquarters and branches, please consider the one you are currently working in.”
The second consideration was related to a confidentiality issue. Nowadays, the market
competition is stiff. Some business information or data is very important and confidential for
those companies. As a consequence, the companies may be reluctant to provide this information.
However, obtaining the necessary data is critical for achieving the second objective of my thesis
in order to be able to run the statistical analysis and make conclusions. I decided that I would
reassure companies about the confidentiality of the information they will provide, and added
explanation as below:

40
“Please notice that this questionnaire is highly confidential. We will not release your information
to any other third party without your permission.”
Third, as mentioned above, obtaining sufficient amount of the data is crucial for this step. In
order to increase the response rate I decided to include some motivation to encourage the
respondents to fill out this questionnaire and sent it back to me. I thought to put 50 dollars firstly,
but then I changed to put a mini-iPad as a gift, as it is a pure academic research, cash may let
respondents feel uncomfortable and may refuse to fill out the questionnaire. After consideration
with research budget, mini-iPad seems a best choice for this position:
“By responding to the questionnaire you will get an opportunity to be a randomly selected
respondent who will win a mini iPad!”
The questionnaire has 4 parts as follows:
Part 1: Demographic Information
Part 2: General Information
Part 3: Importance of Attributes
Part 4: Status of Attributes
Each of these parts will be discussed in detail in the following sections.
4.4.1 Part 1: demographic Information
I created 13 questions in order to gain enough information concerning our respondents. Every
question is designed technically.
Question 1 is to know respondent’s company’s industry, 12 typical manufacturing fields have
been chosen, which are electronics, food, beverage, textile, mechanical, aerospace, chemical,
metallurgy, automotive, pharmaceutical, construction, logistics. Since I may not have included
all the possibilities I put a blank option at the end for the others.
41
Since my research scope is based on international SCs, not only local SCs, question 2 is
concerning respondent’s company’s country. In order to know our respondent’s company scale,
question 3 asks number of employees in respondent’s company. 11 options have been developed
as: Less than 50, 50-100, 101-250, 501-1000, 1001-2500, 2501-5000, 5001-10000, 10001-50000,
50001-100000 and 100001 & above. If the number of employees in respondent’s company can
be gained, the different scales of SCs can be divided and the performance for different scales of
SCs can be compared.
Question 4 is concerning the profits, it asks annual sales of respondent’s company, 8 options
have been developed as follow: Less than 1 million, 1-5 million, 6-25 million, 26-50 million, 51-
100 million, 101-250 million, 21-0.5 billion, and 0.5 billion & above.
Question 5 asks concerning respondent’s department, 11 options have been developed; which are
Production, Quality Control, Technical Support, Logistics, HR, Finance, Marketing, Sales, RD,
Sourcing, and Supply Chain. I put others as a blank for the respondent who does not find their
specific answer among the ones above.
Question 6 asks respondent’s company’s role in their whole SC, without only choosing 4 typical
organizations in SC. 7 options have been chosen; they are supplier, transporter, manufacturer,
distributor, wholesaler, retailer, and customer. I put others as a blank for filling out.
Question 7 is concerning respondent’s position in the company. The purpose of the question is to
understand whether the respondent belongs to the senior level management. As my research is
based on the whole SC, it needs a comprehensive knowledge about the business, which may be
difficult to gain while working on some low level positions. 6 options have been provided to
choose from, which are Owner, General Manager, Manager, Supervisor, Project Leader/Manager
and Buyer. Again, I included the option "others" a blank space to fill out.
Question 8 is concerning respondent’s working experience in the position. Again, this will help
me understand whether the respondent may have gained sufficient knowledge to fill the
42
questionnaire. 8 options have been developed, they are less than 1 year, 1-2 years, 2-3 years, 3-4
years, 4-5 years, 5-10 years, 10-15 years and more than 15 years.
Based on the literature review (e.g. Benton, 2005; Kuo-Pin, 2010), strategic alliance is very
important to a SC’s success. It represents a cooperation and friendship level among SC
organizations. Therefore, in question 9, a “YES/NO” question has been included to find out
whether the respondent’s whole SC has any strategic alliance.
Question 10 is based on the respondent’s answer in question 9, if respondent answered “YES”,
they can choose the organizations belonging to the strategic alliance, which are supplier,
transporter, manufacturer, distributor, wholesaler, retailer and customer. As previously, I included
"others" as a blank space for specifying if none of the option applies. Here, you can see that
instead of only putting retailer as an option, I added wholesaler, because they are similar but not
same. I added customer as an option because B2B model is popular in some manufacturing SCs.
In order to identify whether the respondent’s company’s SC is part of a local SC or an
international one, question 11 is developed to ask if the whole SC is within a same country or not.
The question 12 is based on the answer provided in question 11, if the answer is “NO”, the
respondent can choose which organization is out of the country.
The last question in part 1 is question 13, which helps better identify respondent’s SC scale. This
question asks about the numbers of suppliers, manufacturers, distributors, retailers and customers
in the whole SC. I was concerned that because my respondent is from only one company within
the whole SC, he or she may be a senior engineer or manager, he or she may know the scale of
those numbers, but not exact number. I put different ranges for each organization. As I mentioned
before, some SCs involve B2B model. I put one option as “I don’t know” for the respondent who
has no idea concerning the numbers and one option as “N/A” for distributors, retailers and
customers based on B2B model.
43
4.4.2 Part 2: general information
The purpose of the second part is to get some basic information concerning respondent’s whole
SC, for example, the knowledge of performance measurement for those respondents who are
working on manufacturing SC daily, the implementation of performance measurement systems in
those SCs and etc.
5 general questions have been developed; question 1 asks about respondent’s view concerning
performance measurement in their SCs. From strongly disagree to strongly agree, there are 1 to 5
scales for the respondent to choose the importance level of performance measurement in the
whole SC.
Question 2 asks respondent whether the SC of his company has implemented any kinds of
performance measurement systems in the whole SC. Here they can choose “YES” or “NO”.
Question 3 is based on the answer given in question 2, if the respondent chose “YES”, they can
choose performance measurement systems which have been implemented in the whole SC. 3
current most popular performance measurement systems are proposed as options; and these are
BSC, TQM and SCOR. Aware that other possible systems may be in use I put "others" and a
blank space to fill in case the respondent wants to share the name of the system.
Question 4 asks respondent about which aspect of the whole SC is the most important one to
measure. After a long time consideration and discussion, 4 options have been developed, they are
time, flexibility, reliability and cost. Some aspects like number of shipping errors and fulfill rate
are not generic aspects, they are in detail level. Therefore, they are not added. Again, I included
"other" as a blank for filling out if any other aspect is suggested by a respondent.
Question 5 asks respondent: “What are the main reasons which prevent the whole supply chain
from implementing performance measurement systems?” The purpose is to understand why
some SCs still do not implement any performance measurement systems 8 options are given as
some common reasons as cost, manpower, time, lack of data, lack of interest, lack of
management commitment, lack of priority among projects and lack of knowledge. I included a
44
“N/A” into this option list, because some respondents’ SCs already implemented advanced
performance measurement systems. As previously, I included "others" as a blank to let
respondent to fill out if they have other reasons not listed.
4.4.3 Part 3 and part 4
Part 3 and 4 are also created according to the description in the tool development part. Part 3 is
related to the importance of 23 different attributes, Part 4 is related to the status of 23 different
attributes.
At the end of this questionnaire, I added three questions; in the first one I ask our respondents if
they are interested in receiving the research summary. This may be interesting for certain
companies. i assume that the fact that they spend time and filled the questionnaire is a certain
proof that they are interested in the topic and may be glad to access the results of this study. I do
plan to compile a summary of the thesis in a few pages and to send it to the interested
respondents. The second question asked the respondents whether they want to be included in the
draw to win the gift which is the mentioned mini-iPad. In the third question they are asked to
leave their e-mail addresses if they want to get the above two items.
4.5 Distribution of questionnaire
The targeted recipients of the questionnaire are international professionals who are working in
manufacturing SCs, In order to distribute the questionnaire among them I applied Linked-in
again. I joined around 100 groups related to manufacturing SCs. This was not a simple task, as
some groups are not open to public, and some groups may allow you to enter but after posting
the questionnaire in the group they may review your postings and may refuse it. It took a
considerable amount of time to post questionnaires in those groups. The other way was to
distribute questionnaires was over email. I developed two formats of the questionnaire. The first
one was an online version created by Google Doc. I have selected Google because it is known to
have a very stable web server and it is very convenient to develop a questionnaire based on
45
specific requirements. The online version of the developed questionnaire can be found at below
URL:
https://docs.google.com/forms/d/10LQAM8-JsfJKB2wT82PDGW4xELd7dO0alR3zDs8_tio/viewform?embedded=true"
The second format used was PDF (fillable) version of questionnaire. Although in most of the
cases the web-based format is more convenient it was necessary to use the pdf format as well.
The reason is that the collection of the responses residing in some countries (specifically in Iran)
was difficult through the web-based version, because the respondents could not access the
website.
5. Analysis of result
5.1 Analysis of data from part 1 and part 2 of questionnaire
After 6 months of running the survey, I obtained in total 311 responses, which after validation
gave me 43 responses considered as useful data. The reason is that I found many of the responses
are from unreliable resources, so I decided to not include them The percentage is 14%. Because
some questionnaires were sent by friends, the total number of sent out questionnaires cannot be
obtained. Therefore, I will not calculate percentage of response rate. Based on the 43 responses’
data, it is enough to apply student-T distribution to calculate final needed values. I will provide
analysis with some questions of the questionnaire of Part 1 and Part 2 as below:
Does the whole supply chain have any strategic alliance?
Based on the 43 responses, 13(30%) SCs do not have any strategic alliances, 30(70%) SCs have
strategic alliances. One of the reasons is that one of the purposes of building up strategic alliance
is to share information, and sharing information can improve the performance of whole SC
dramatically. Based on my research results, we can see that most SCs do have strategic alliances.
The results are shown in Figure 1:
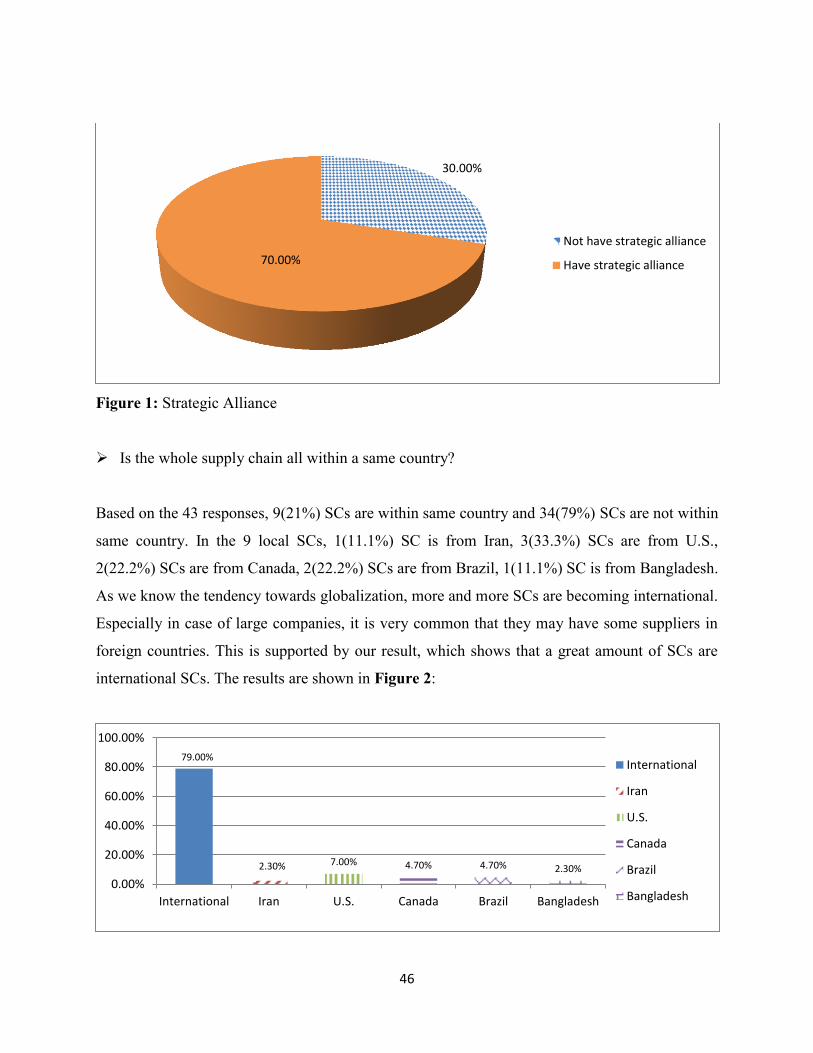
46
Figure 1: Strategic Alliance
Is the whole supply chain all within a same country?
Based on the 43 responses, 9(21%) SCs are within same country and 34(79%) SCs are not within
same country. In the 9 local SCs, 1(11.1%) SC is from Iran, 3(33.3%) SCs are from U.S.,
2(22.2%) SCs are from Canada, 2(22.2%) SCs are from Brazil, 1(11.1%) SC is from Bangladesh.
As we know the tendency towards globalization, more and more SCs are becoming international.
Especially in case of large companies, it is very common that they may have some suppliers in
foreign countries. This is supported by our result, which shows that a great amount of SCs are
international SCs. The results are shown in Figure 2:
30.00%
70.00%
Not have strategic alliance
Have strategic alliance
79.00%
2.30% 7.00% 4.70% 4.70% 2.30%
0.00%
20.00%
40.00%
60.00%
80.00%
100.00%
International Iran U.S. Canada Brazil Bangladesh
International
Iran
U.S.
Canada
Brazil
Bangladesh
47
Figure 2: Distribution of Country
Performance measurement is important in the whole SC
Based on the 43 responses, only 1(2.3%) respondent chose 1(strongly disagree), no respondent
chose scale of 2, 1 (2.3%) respondents chose scale of 3, 11 (25.6%) respondents chose scale of 4,
30(69.8%) respondents chose scale of 5(strongly agree). Therefore, most of the respondents
think performance measurement is important in the whole SC. This result was expected and the
advantages of the performance measurement have been extensively discussed in the literature.
The information from the performance measurement is needed especially in top management
level, but also several kinds of SCM measures are needed at every management and operational
level. The management’s main interest is to know how efficient the SMC is. Also several
management levels are interested in knowing about SCM capability and performance.
Performance measuring is also essential when the SC is developed. Performance measurement
provides information on how effective the development work has been. In manufacturing
companies performance measurement provides information for the monitoring, control,
evaluation and feedback functions for operations management. When implementing and
executing a new business strategy, the performance measurement provides important feedback
about the improvement. Good performance measurement system also generates more open
communication between people in organizations and in the network, and hence improves the
performance (Waal, 2003; Kaplan., 1996; Lohman , 2004; Neely, 1994 ; Gunasekaran, 2007).
Gunasekaran & Kobu (2007) presented following purposes of a performance measurement
system:
- Identifying success
- Identifying whether customer needs are met
- Better understanding of processes
- Identifying bottlenecks, waste, problems and improvement opportunities
- Providing factual decisions
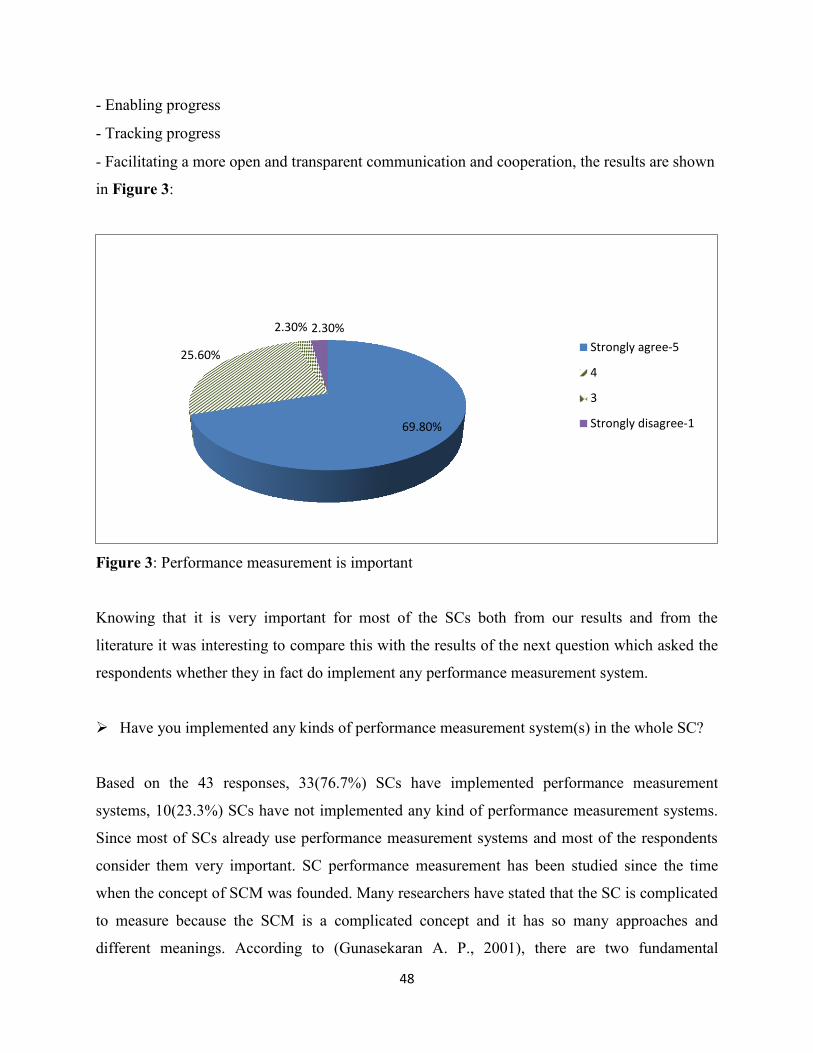
48
- Enabling progress
- Tracking progress
- Facilitating a more open and transparent communication and cooperation, the results are shown
in Figure 3:
Figure 3: Performance measurement is important
Knowing that it is very important for most of the SCs both from our results and from the
literature it was interesting to compare this with the results of the next question which asked the
respondents whether they in fact do implement any performance measurement system.
Have you implemented any kinds of performance measurement system(s) in the whole SC?
Based on the 43 responses, 33(76.7%) SCs have implemented performance measurement
systems, 10(23.3%) SCs have not implemented any kind of performance measurement systems.
Since most of SCs already use performance measurement systems and most of the respondents
consider them very important. SC performance measurement has been studied since the time
when the concept of SCM was founded. Many researchers have stated that the SC is complicated
to measure because the SCM is a complicated concept and it has so many approaches and
different meanings. According to (Gunasekaran A. P., 2001), there are two fundamental
69.80%
25.60%
2.30% 2.30%
Strongly agree-5
4
3
Strongly disagree-1
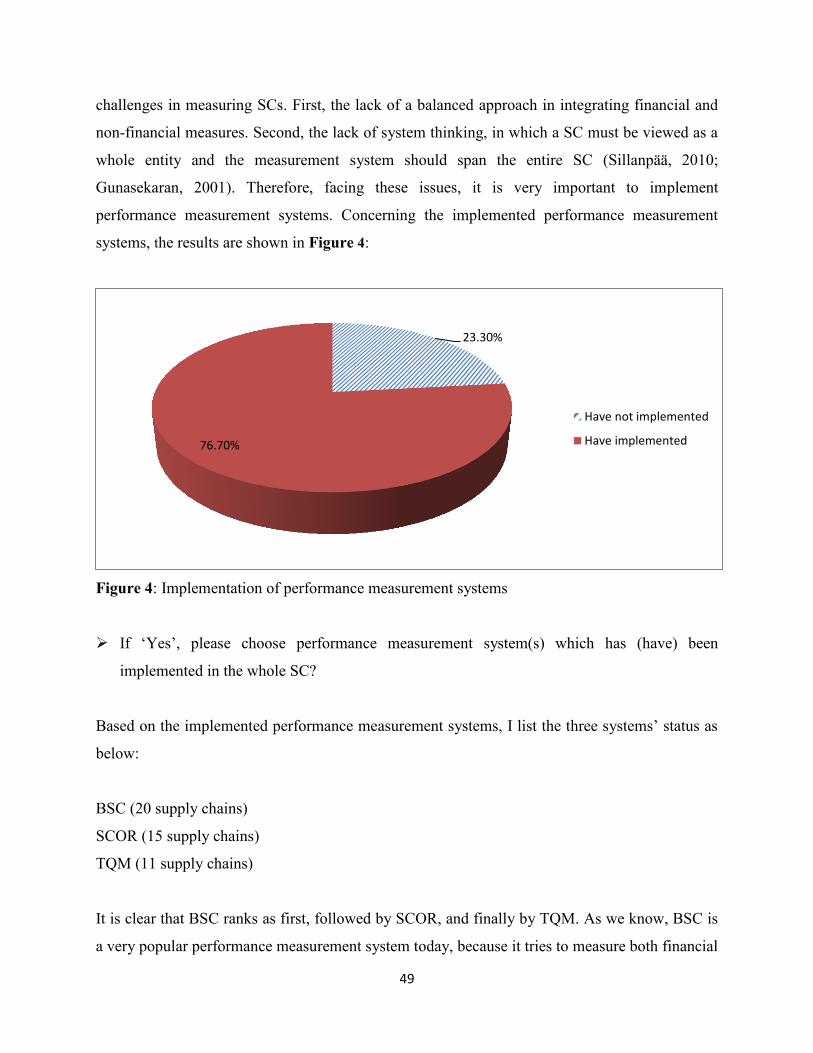
49
challenges in measuring SCs. First, the lack of a balanced approach in integrating financial and
non-financial measures. Second, the lack of system thinking, in which a SC must be viewed as a
whole entity and the measurement system should span the entire SC (Sillanpää, 2010;
Gunasekaran, 2001). Therefore, facing these issues, it is very important to implement
performance measurement systems. Concerning the implemented performance measurement
systems, the results are shown in Figure 4:
Figure 4: Implementation of performance measurement systems
If ‘Yes’, please choose performance measurement system(s) which has (have) been
implemented in the whole SC?
Based on the implemented performance measurement systems, I list the three systems’ status as
below:
BSC (20 supply chains)
SCOR (15 supply chains)
TQM (11 supply chains)
It is clear that BSC ranks as first, followed by SCOR, and finally by TQM. As we know, BSC is
a very popular performance measurement system today, because it tries to measure both financial
23.30%
76.70%
Have not implemented
Have implemented
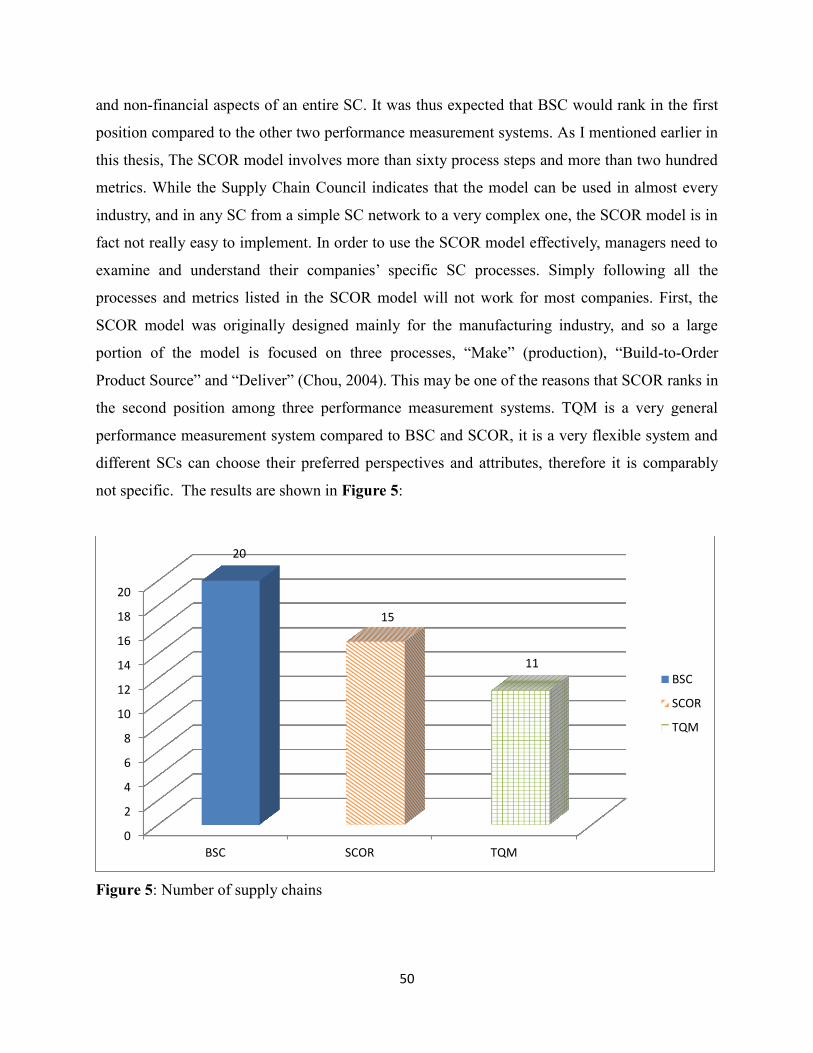
50
and non-financial aspects of an entire SC. It was thus expected that BSC would rank in the first
position compared to the other two performance measurement systems. As I mentioned earlier in
this thesis, The SCOR model involves more than sixty process steps and more than two hundred
metrics. While the Supply Chain Council indicates that the model can be used in almost every
industry, and in any SC from a simple SC network to a very complex one, the SCOR model is in
fact not really easy to implement. In order to use the SCOR model effectively, managers need to
examine and understand their companies’ specific SC processes. Simply following all the
processes and metrics listed in the SCOR model will not work for most companies. First, the
SCOR model was originally designed mainly for the manufacturing industry, and so a large
portion of the model is focused on three processes, “Make” (production), “Build-to-Order
Product Source” and “Deliver” (Chou, 2004). This may be one of the reasons that SCOR ranks in
the second position among three performance measurement systems. TQM is a very general
performance measurement system compared to BSC and SCOR, it is a very flexible system and
different SCs can choose their preferred perspectives and attributes, therefore it is comparably
not specific. The results are shown in Figure 5:
Figure 5: Number of supply chains
0
2
4
6
8
10
12
14
16
18
20
BSC SCOR TQM
20
15
11 BSC
SCOR
TQM
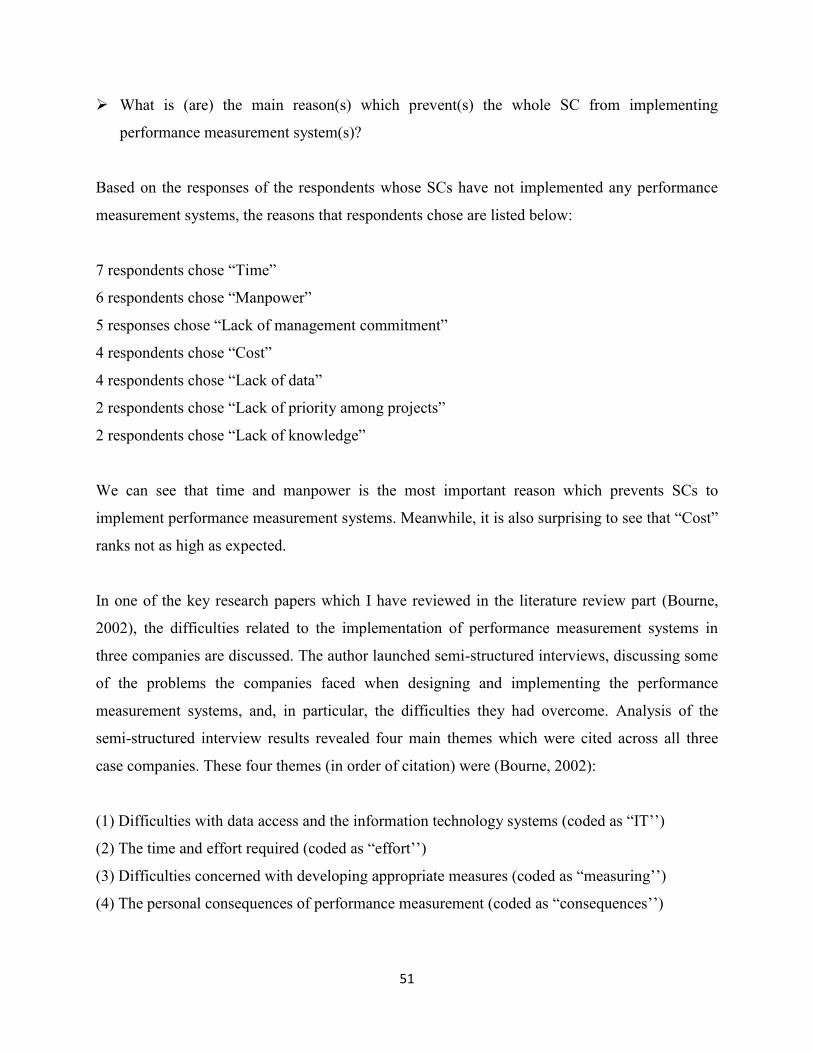
51
What is (are) the main reason(s) which prevent(s) the whole SC from implementing
performance measurement system(s)?
Based on the responses of the respondents whose SCs have not implemented any performance
measurement systems, the reasons that respondents chose are listed below:
7 respondents chose “Time”
6 respondents chose “Manpower”
5 responses chose “Lack of management commitment”
4 respondents chose “Cost”
4 respondents chose “Lack of data”
2 respondents chose “Lack of priority among projects”
2 respondents chose “Lack of knowledge”
We can see that time and manpower is the most important reason which prevents SCs to
implement performance measurement systems. Meanwhile, it is also surprising to see that “Cost”
ranks not as high as expected.
In one of the key research papers which I have reviewed in the literature review part (Bourne,
2002), the difficulties related to the implementation of performance measurement systems in
three companies are discussed. The author launched semi-structured interviews, discussing some
of the problems the companies faced when designing and implementing the performance
measurement systems, and, in particular, the difficulties they had overcome. Analysis of the
semi-structured interview results revealed four main themes which were cited across all three
case companies. These four themes (in order of citation) were (Bourne, 2002):
(1) Difficulties with data access and the information technology systems (coded as “IT’’)
(2) The time and effort required (coded as “effort’’)
(3) Difficulties concerned with developing appropriate measures (coded as “measuring’’)
(4) The personal consequences of performance measurement (coded as “consequences’’)
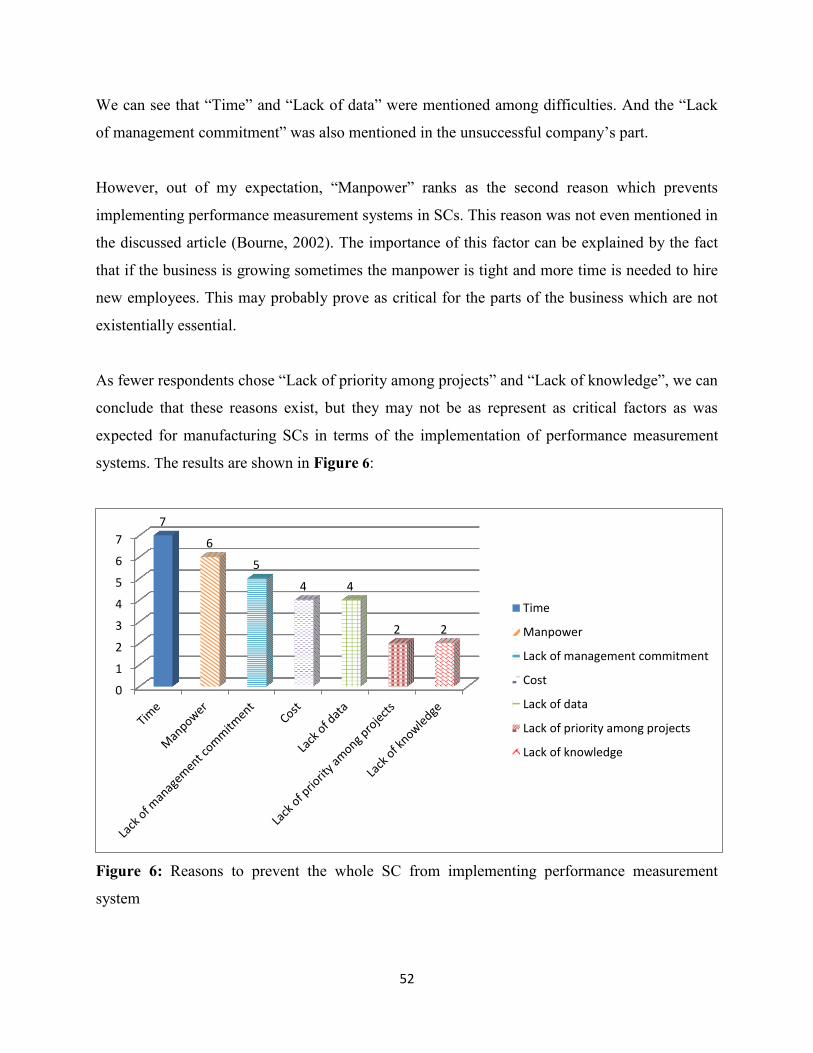
52
We can see that “Time” and “Lack of data” were mentioned among difficulties. And the “Lack
of management commitment” was also mentioned in the unsuccessful company’s part.
However, out of my expectation, “Manpower” ranks as the second reason which prevents
implementing performance measurement systems in SCs. This reason was not even mentioned in
the discussed article (Bourne, 2002). The importance of this factor can be explained by the fact
that if the business is growing sometimes the manpower is tight and more time is needed to hire
new employees. This may probably prove as critical for the parts of the business which are not
existentially essential.
As fewer respondents chose “Lack of priority among projects” and “Lack of knowledge”, we can
conclude that these reasons exist, but they may not be as represent as critical factors as was
expected for manufacturing SCs in terms of the implementation of performance measurement
systems. The results are shown in Figure 6:
Figure 6: Reasons to prevent the whole SC from implementing performance measurement
system
0
1
2
3
4
5
6
7
7
6
5
4 4
2 2
Time
Manpower
Lack of management commitment
Cost
Lack of data
Lack of priority among projects
Lack of knowledge
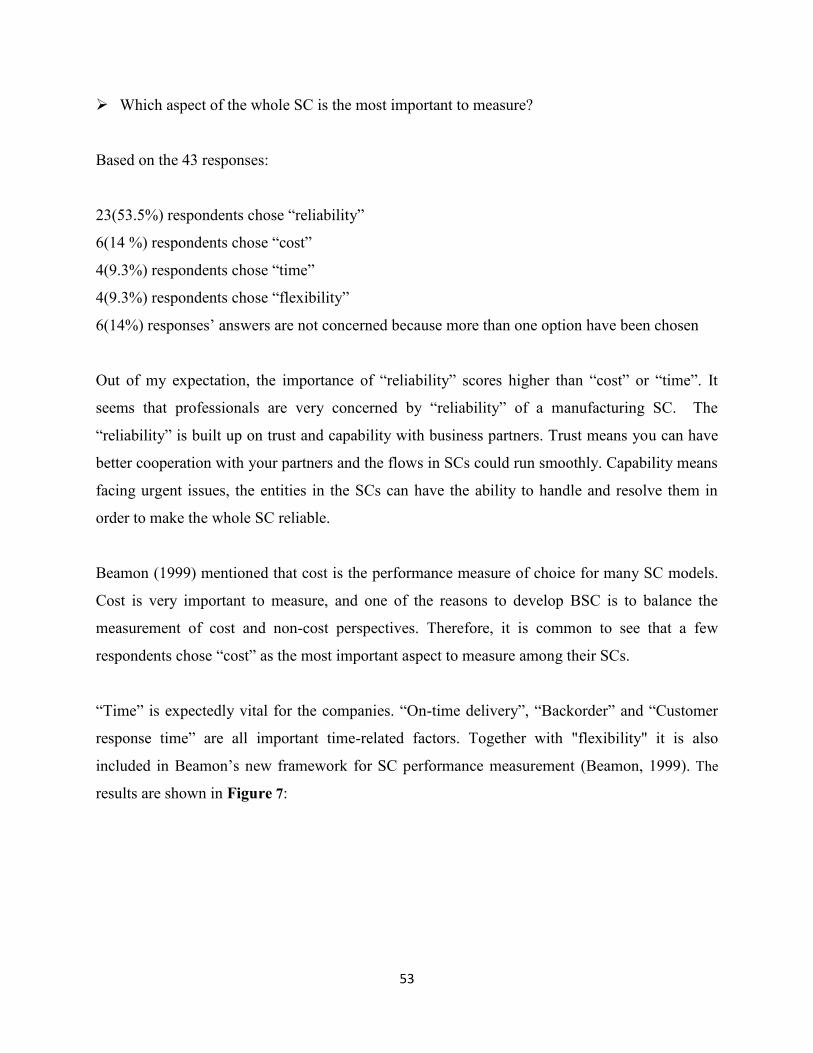
53
Which aspect of the whole SC is the most important to measure?
Based on the 43 responses:
23(53.5%) respondents chose “reliability”
6(14 %) respondents chose “cost”
4(9.3%) respondents chose “time”
4(9.3%) respondents chose “flexibility”
6(14%) responses’ answers are not concerned because more than one option have been chosen
Out of my expectation, the importance of “reliability” scores higher than “cost” or “time”. It
seems that professionals are very concerned by “reliability” of a manufacturing SC. The
“reliability” is built up on trust and capability with business partners. Trust means you can have
better cooperation with your partners and the flows in SCs could run smoothly. Capability means
facing urgent issues, the entities in the SCs can have the ability to handle and resolve them in
order to make the whole SC reliable.
Beamon (1999) mentioned that cost is the performance measure of choice for many SC models.
Cost is very important to measure, and one of the reasons to develop BSC is to balance the
measurement of cost and non-cost perspectives. Therefore, it is common to see that a few
respondents chose “cost” as the most important aspect to measure among their SCs.
“Time” is expectedly vital for the companies. “On-time delivery”, “Backorder” and “Customer
response time” are all important time-related factors. Together with "flexibility" it is also
included in Beamon’s new framework for SC performance measurement (Beamon, 1999). The
results are shown in Figure 7:
54
Figure 7: The most important aspect to measure
5.2 Analysis of data from part 3 and part 4 of questionnaire
I intended to get the mean of importance weight and mean of performance for each attribute.
Because populations of SC are unknown, as are the variances of the populations I intend to
calculate the mean of the population which are all responses against individual attribute,
therefore I applied sample distribution with student T distribution:
= ̅
√
I wish to test the hypothesis of population mean of each attribute using α = 0.05, two tails of t:
, - , therefore if the calculated value of the test statistic does not exceed
value of or - , I cannot reject the null hypothesis which is the mean of all
responses’ values. Therefore, there is no strong evidence to conclude that the mean of the
population of responses is different from the hypothesis. The values of means in the rest of paper
are all hypotheses which have been verified.
In this second data analysis part, I will discuss in two aspects, the first one will be from four
perspectives which are resource, customer-based interaction, SC-based interaction and flexibility,
I will present the results by applying 4 indexes. The second aspect will be from 23 attributes
53.50%
14.00%
9%
9.30%
14.00%
Reliability
Cost
Time
Flexibility
N/A
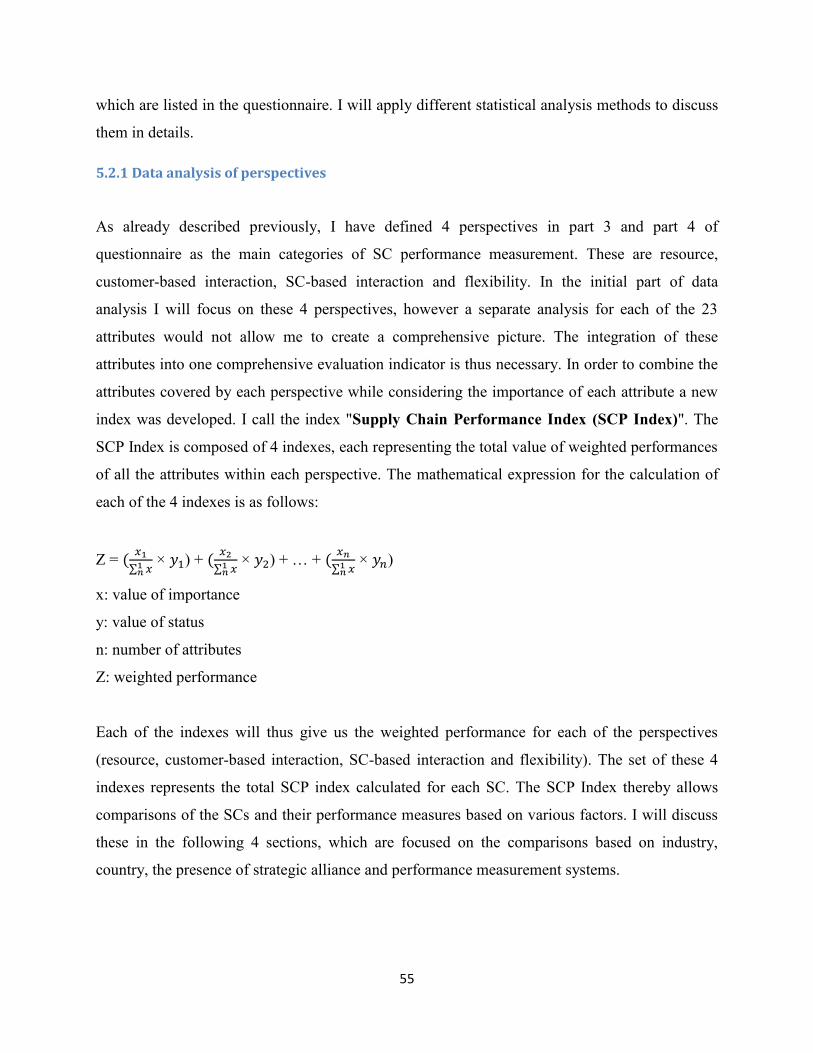
55
which are listed in the questionnaire. I will apply different statistical analysis methods to discuss
them in details.
5.2.1 Data analysis of perspectives
As already described previously, I have defined 4 perspectives in part 3 and part 4 of
questionnaire as the main categories of SC performance measurement. These are resource,
customer-based interaction, SC-based interaction and flexibility. In the initial part of data
analysis I will focus on these 4 perspectives, however a separate analysis for each of the 23
attributes would not allow me to create a comprehensive picture. The integration of these
attributes into one comprehensive evaluation indicator is thus necessary. In order to combine the
attributes covered by each perspective while considering the importance of each attribute a new
index was developed. I call the index "Supply Chain Performance Index (SCP Index)". The
SCP Index is composed of 4 indexes, each representing the total value of weighted performances
of all the attributes within each perspective. The mathematical expression for the calculation of
each of the 4 indexes is as follows:
Z =
∑
× ) +
∑
× ) + … +
∑
× )
x: value of importance
y: value of status
n: number of attributes
Z: weighted performance
Each of the indexes will thus give us the weighted performance for each of the perspectives
(resource, customer-based interaction, SC-based interaction and flexibility). The set of these 4
indexes represents the total SCP index calculated for each SC. The SCP Index thereby allows
comparisons of the SCs and their performance measures based on various factors. I will discuss
these in the following 4 sections, which are focused on the comparisons based on industry,
country, the presence of strategic alliance and performance measurement systems.
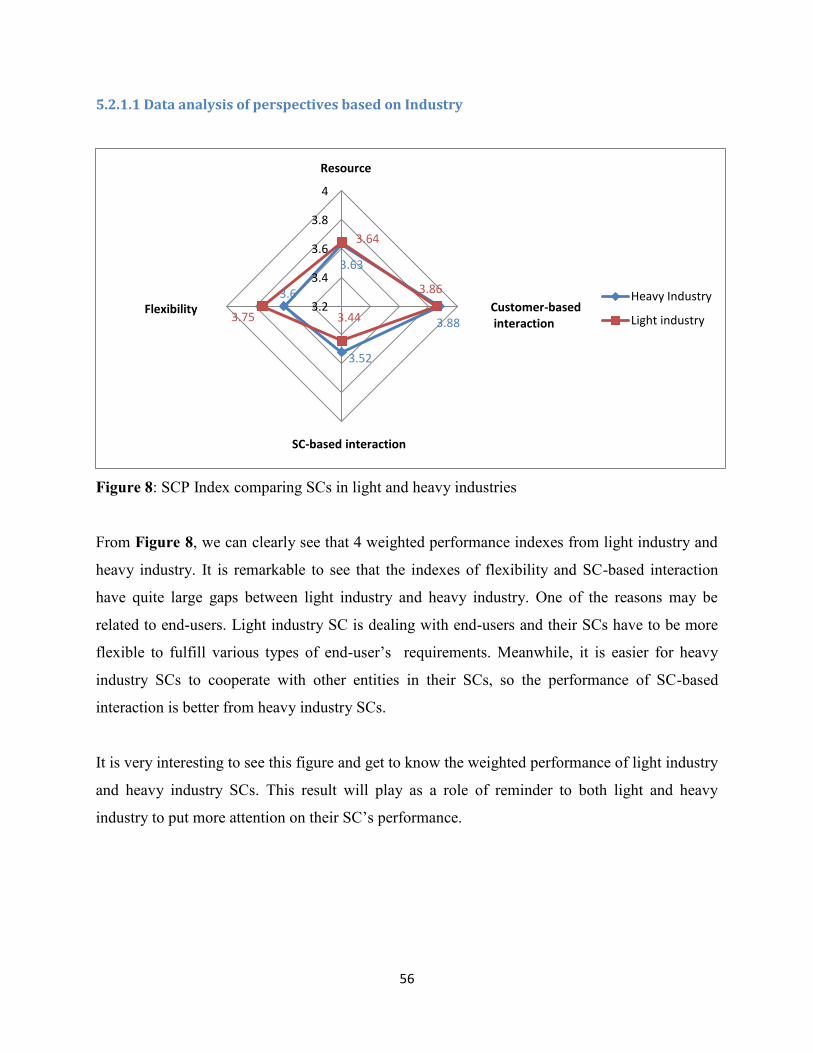
56
5.2.1.1 Data analysis of perspectives based on Industry
Figure 8: SCP Index comparing SCs in light and heavy industries
From Figure 8, we can clearly see that 4 weighted performance indexes from light industry and
heavy industry. It is remarkable to see that the indexes of flexibility and SC-based interaction
have quite large gaps between light industry and heavy industry. One of the reasons may be
related to end-users. Light industry SC is dealing with end-users and their SCs have to be more
flexible to fulfill various types of end-user’s requirements. Meanwhile, it is easier for heavy
industry SCs to cooperate with other entities in their SCs, so the performance of SC-based
interaction is better from heavy industry SCs.
It is very interesting to see this figure and get to know the weighted performance of light industry
and heavy industry SCs. This result will play as a role of reminder to both light and heavy
industry to put more attention on their SC’s performance.
3.63
3.88
3.52
3.6
3.64
3.86
3.44 3.75 3.2
3.4
3.6
3.8
4
Heavy Industry
Light industry
Resource
Customer-based interaction
SC-based interaction
Flexibility
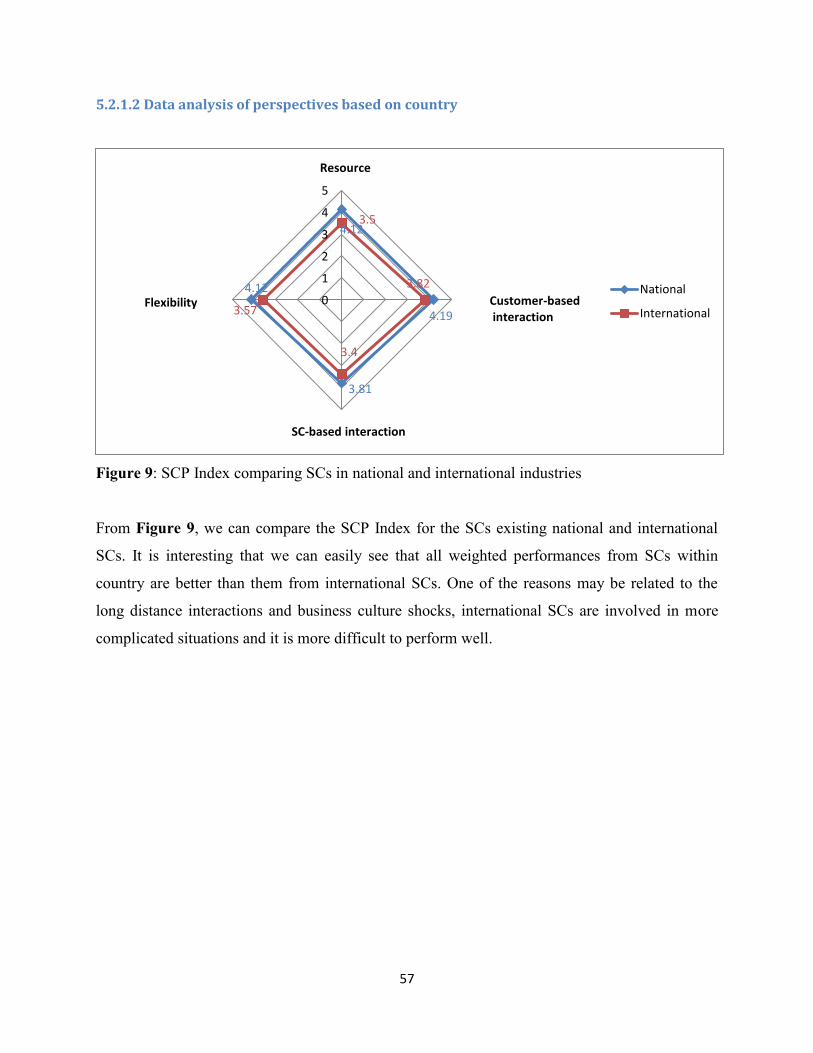
57
5.2.1.2 Data analysis of perspectives based on country
Figure 9: SCP Index comparing SCs in national and international industries
From Figure 9, we can compare the SCP Index for the SCs existing national and international
SCs. It is interesting that we can easily see that all weighted performances from SCs within
country are better than them from international SCs. One of the reasons may be related to the
long distance interactions and business culture shocks, international SCs are involved in more
complicated situations and it is more difficult to perform well.
4.12
4.19
3.81
4.12
3.5
3.82
3.4
3.57 0
1
2
3
4
5
National
International
Resource
Customer-based interaction
SC-based interaction
Flexibility
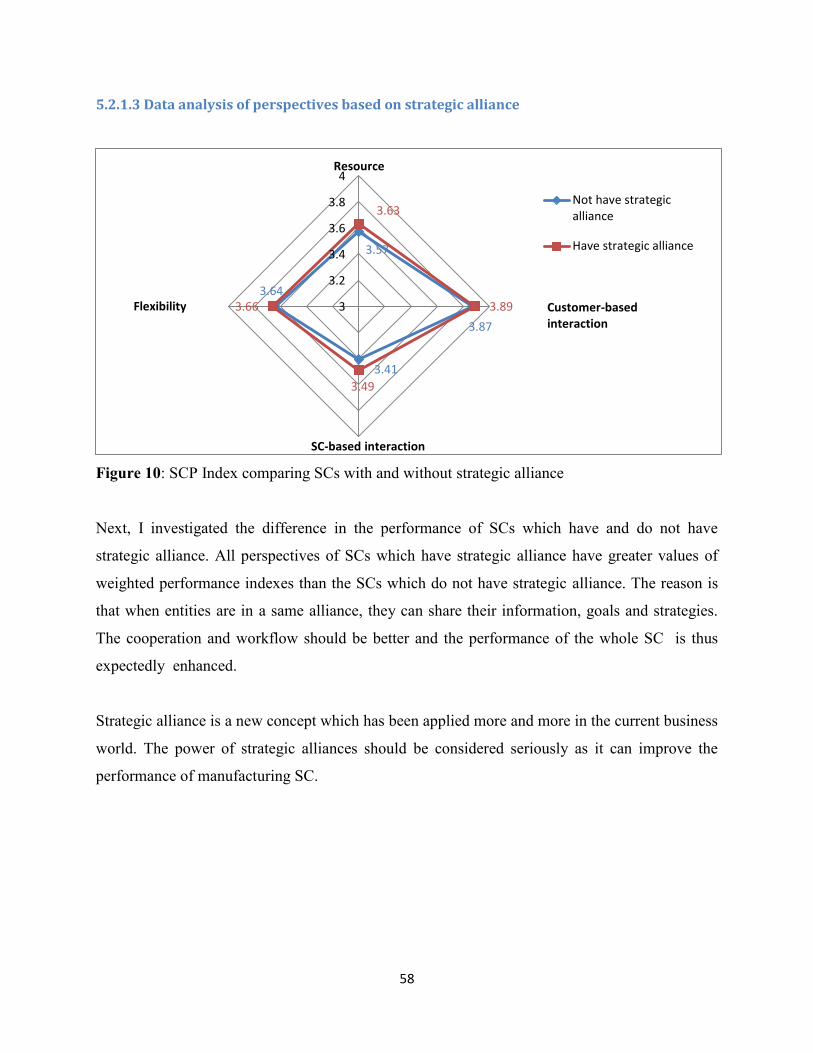
58
5.2.1.3 Data analysis of perspectives based on strategic alliance
Figure 10: SCP Index comparing SCs with and without strategic alliance
Next, I investigated the difference in the performance of SCs which have and do not have
strategic alliance. All perspectives of SCs which have strategic alliance have greater values of
weighted performance indexes than the SCs which do not have strategic alliance. The reason is
that when entities are in a same alliance, they can share their information, goals and strategies.
The cooperation and workflow should be better and the performance of the whole SC is thus
expectedly enhanced.
Strategic alliance is a new concept which has been applied more and more in the current business
world. The power of strategic alliances should be considered seriously as it can improve the
performance of manufacturing SC.
3.57
3.87
3.41
3.64
3.63
3.89
3.49
3.66 3
3.2
3.4
3.6
3.8
4
Not have strategicalliance
Have strategic alliance
Customer-based interaction
SC-based interaction
Resource
Flexibility
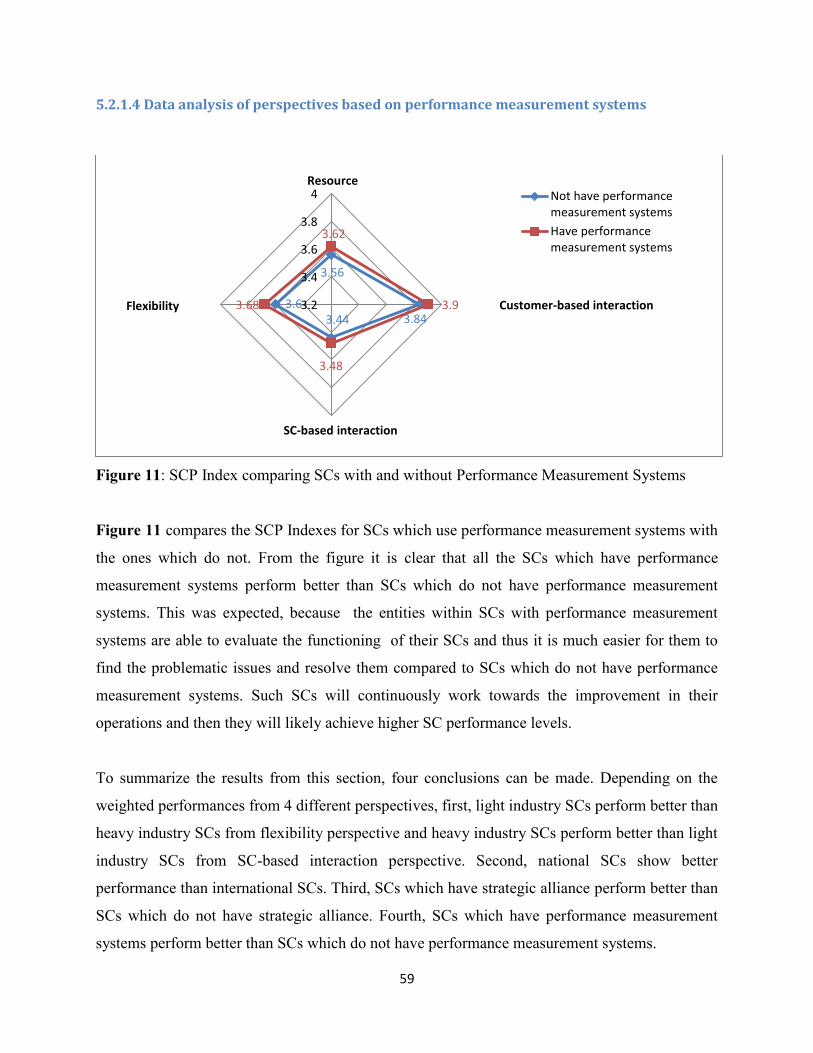
59
5.2.1.4 Data analysis of perspectives based on performance measurement systems
Figure 11: SCP Index comparing SCs with and without Performance Measurement Systems
Figure 11 compares the SCP Indexes for SCs which use performance measurement systems with
the ones which do not. From the figure it is clear that all the SCs which have performance
measurement systems perform better than SCs which do not have performance measurement
systems. This was expected, because the entities within SCs with performance measurement
systems are able to evaluate the functioning of their SCs and thus it is much easier for them to
find the problematic issues and resolve them compared to SCs which do not have performance
measurement systems. Such SCs will continuously work towards the improvement in their
operations and then they will likely achieve higher SC performance levels.
To summarize the results from this section, four conclusions can be made. Depending on the
weighted performances from 4 different perspectives, first, light industry SCs perform better than
heavy industry SCs from flexibility perspective and heavy industry SCs perform better than light
industry SCs from SC-based interaction perspective. Second, national SCs show better
performance than international SCs. Third, SCs which have strategic alliance perform better than
SCs which do not have strategic alliance. Fourth, SCs which have performance measurement
systems perform better than SCs which do not have performance measurement systems.
3.56
3.84 3.44 3.6
3.62
3.9
3.48
3.68 3.2
3.4
3.6
3.8
4 Not have performancemeasurement systems
Have performancemeasurement systems
Resource
Customer-based interaction
SC-based interaction
Flexibility
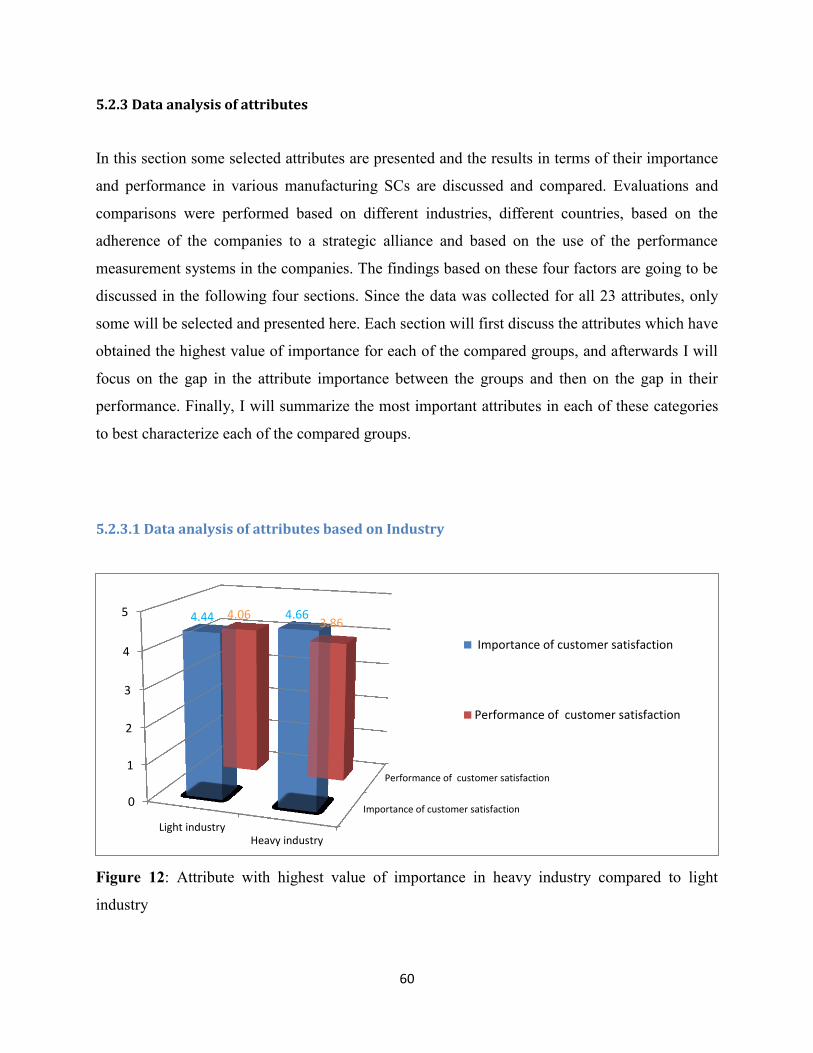
60
5.2.3 Data analysis of attributes
In this section some selected attributes are presented and the results in terms of their importance
and performance in various manufacturing SCs are discussed and compared. Evaluations and
comparisons were performed based on different industries, different countries, based on the
adherence of the companies to a strategic alliance and based on the use of the performance
measurement systems in the companies. The findings based on these four factors are going to be
discussed in the following four sections. Since the data was collected for all 23 attributes, only
some will be selected and presented here. Each section will first discuss the attributes which have
obtained the highest value of importance for each of the compared groups, and afterwards I will
focus on the gap in the attribute importance between the groups and then on the gap in their
performance. Finally, I will summarize the most important attributes in each of these categories
to best characterize each of the compared groups.
5.2.3.1 Data analysis of attributes based on Industry
Figure 12: Attribute with highest value of importance in heavy industry compared to light
industry
Importance of customer satisfaction
Performance of customer satisfaction
0
1
2
3
4
5
Light industryHeavy industry
4.44 4.66 4.06 3.86
Importance of customer satisfaction
Performance of customer satisfaction
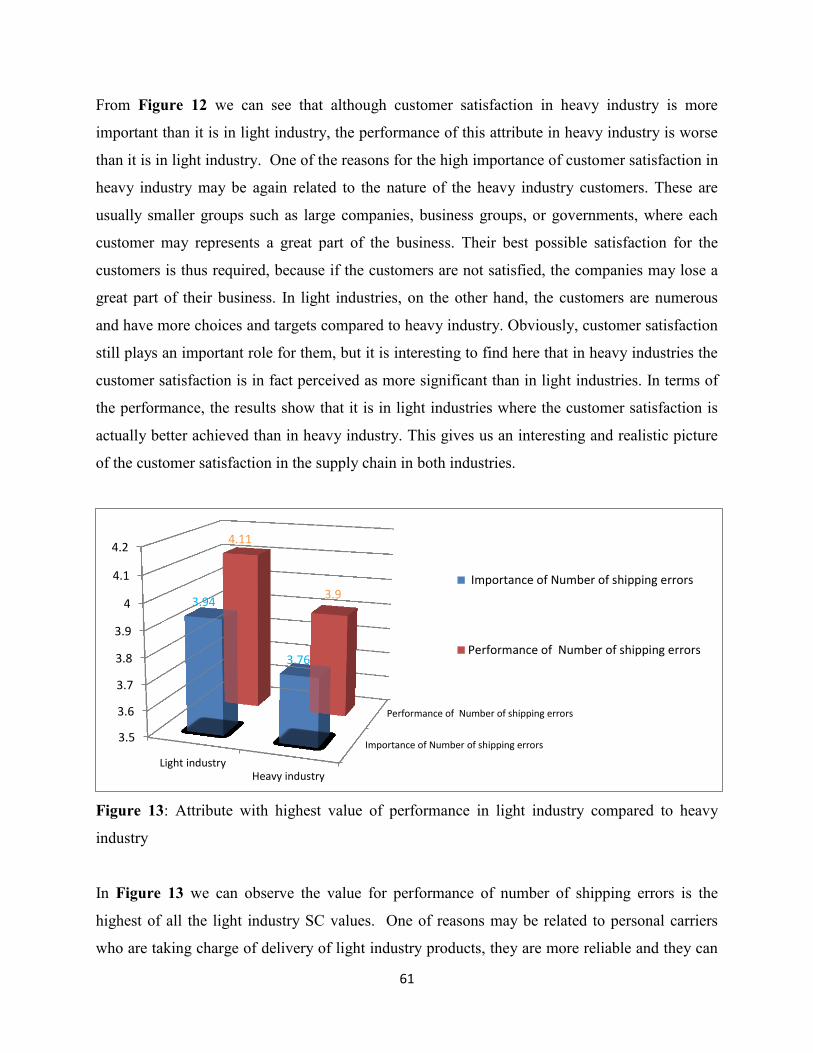
61
From Figure 12 we can see that although customer satisfaction in heavy industry is more
important than it is in light industry, the performance of this attribute in heavy industry is worse
than it is in light industry. One of the reasons for the high importance of customer satisfaction in
heavy industry may be again related to the nature of the heavy industry customers. These are
usually smaller groups such as large companies, business groups, or governments, where each
customer may represents a great part of the business. Their best possible satisfaction for the
customers is thus required, because if the customers are not satisfied, the companies may lose a
great part of their business. In light industries, on the other hand, the customers are numerous
and have more choices and targets compared to heavy industry. Obviously, customer satisfaction
still plays an important role for them, but it is interesting to find here that in heavy industries the
customer satisfaction is in fact perceived as more significant than in light industries. In terms of
the performance, the results show that it is in light industries where the customer satisfaction is
actually better achieved than in heavy industry. This gives us an interesting and realistic picture
of the customer satisfaction in the supply chain in both industries.
Figure 13: Attribute with highest value of performance in light industry compared to heavy
industry
In Figure 13 we can observe the value for performance of number of shipping errors is the
highest of all the light industry SC values. One of reasons may be related to personal carriers
who are taking charge of delivery of light industry products, they are more reliable and they can
Importance of Number of shipping errors
Performance of Number of shipping errors
3.5
3.6
3.7
3.8
3.9
4
4.1
4.2
Light industryHeavy industry
3.94
3.76
4.11
3.9 Importance of Number of shipping errors
Performance of Number of shipping errors
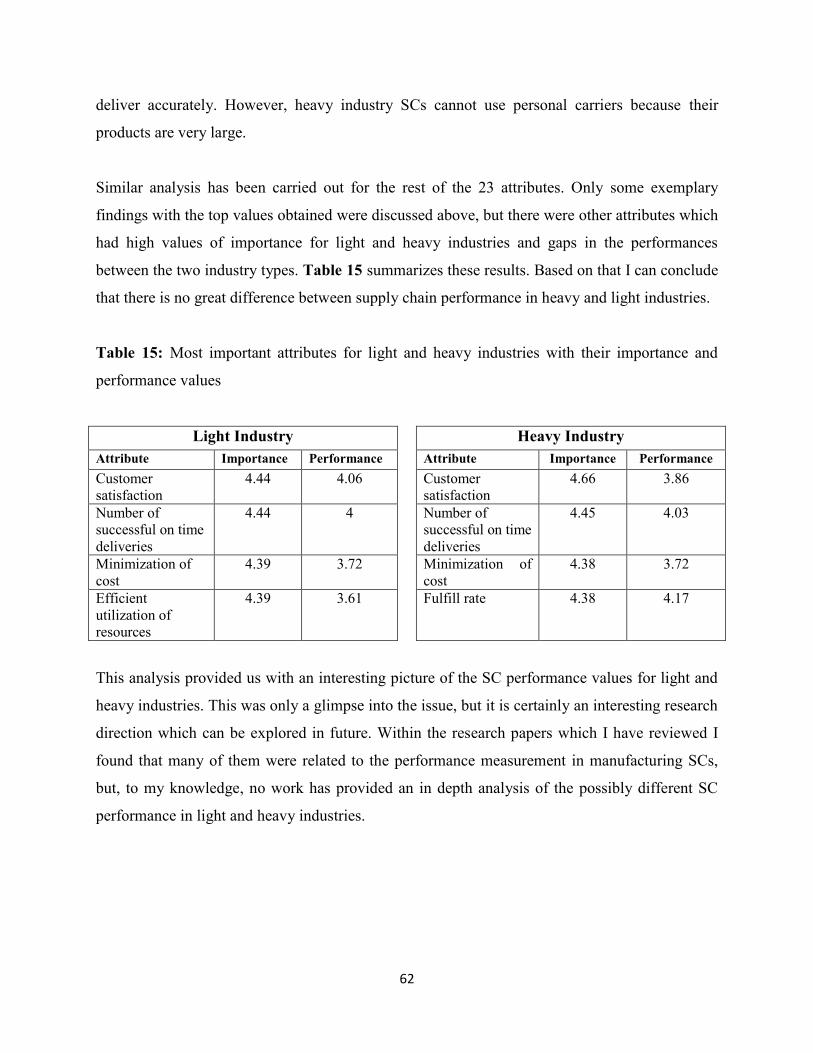
62
deliver accurately. However, heavy industry SCs cannot use personal carriers because their
products are very large.
Similar analysis has been carried out for the rest of the 23 attributes. Only some exemplary
findings with the top values obtained were discussed above, but there were other attributes which
had high values of importance for light and heavy industries and gaps in the performances
between the two industry types. Table 15 summarizes these results. Based on that I can conclude
that there is no great difference between supply chain performance in heavy and light industries.
Table 15: Most important attributes for light and heavy industries with their importance and
performance values
Light Industry Heavy Industry
Attribute Importance Performance Attribute Importance Performance
Customer
satisfaction
4.44 4.06 Customer
satisfaction
4.66 3.86
Number of
successful on time
deliveries
4.44 4 Number of
successful on time
deliveries
4.45 4.03
Minimization of
cost
4.39 3.72 Minimization of
cost
4.38 3.72
Efficient
utilization of
resources
4.39 3.61 Fulfill rate 4.38 4.17
This analysis provided us with an interesting picture of the SC performance values for light and
heavy industries. This was only a glimpse into the issue, but it is certainly an interesting research
direction which can be explored in future. Within the research papers which I have reviewed I
found that many of them were related to the performance measurement in manufacturing SCs,
but, to my knowledge, no work has provided an in depth analysis of the possibly different SC
performance in light and heavy industries.
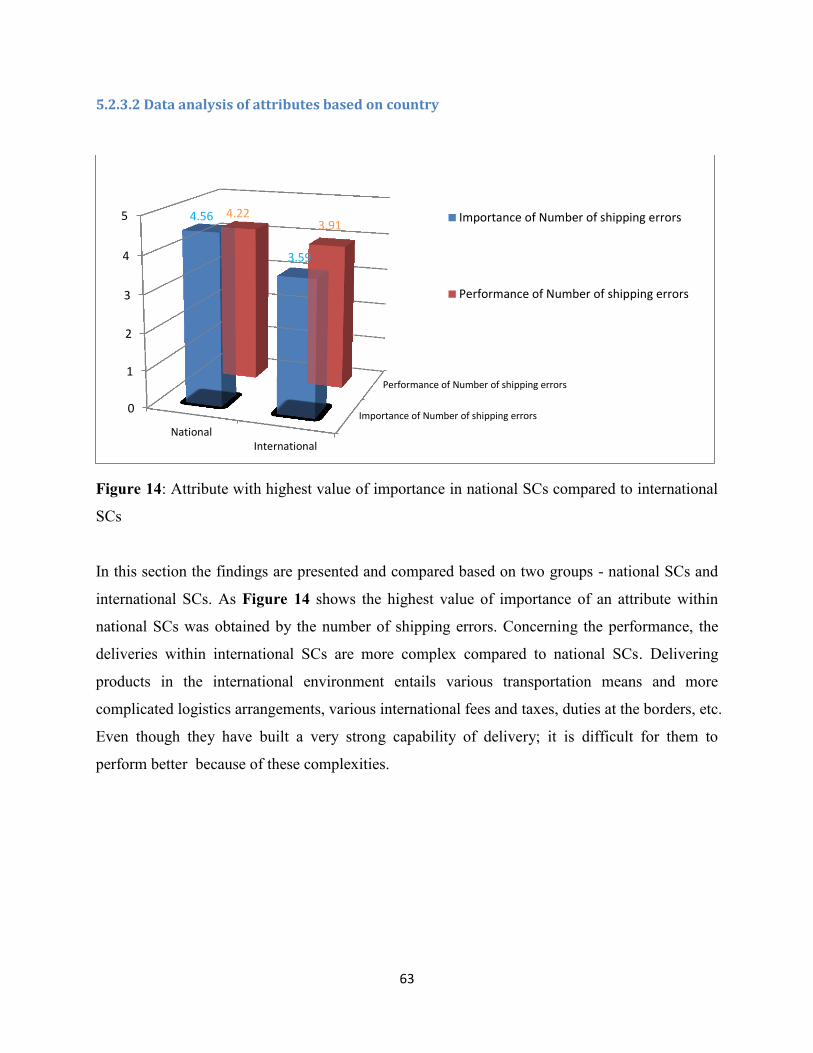
63
5.2.3.2 Data analysis of attributes based on country
Figure 14: Attribute with highest value of importance in national SCs compared to international
SCs
In this section the findings are presented and compared based on two groups - national SCs and
international SCs. As Figure 14 shows the highest value of importance of an attribute within
national SCs was obtained by the number of shipping errors. Concerning the performance, the
deliveries within international SCs are more complex compared to national SCs. Delivering
products in the international environment entails various transportation means and more
complicated logistics arrangements, various international fees and taxes, duties at the borders, etc.
Even though they have built a very strong capability of delivery; it is difficult for them to
perform better because of these complexities.
Importance of Number of shipping errors
Performance of Number of shipping errors
0
1
2
3
4
5
NationalInternational
4.56
3.59
4.22 3.91
Importance of Number of shipping errors
Performance of Number of shipping errors
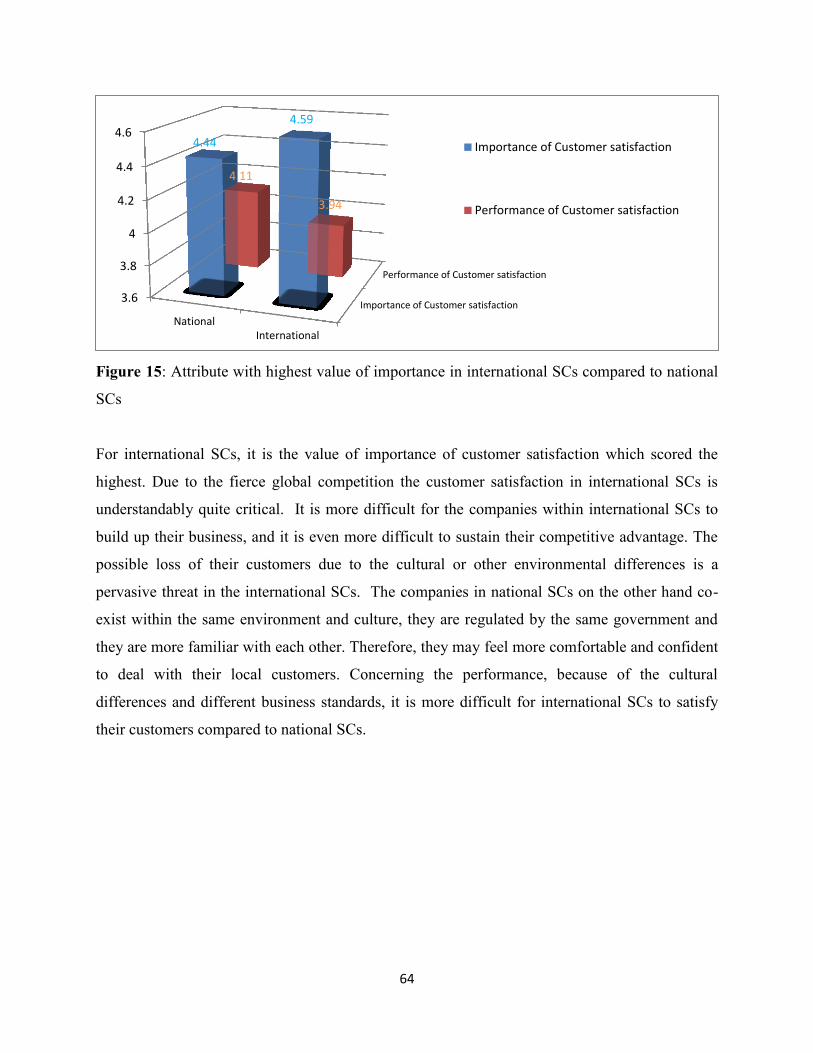
64
Figure 15: Attribute with highest value of importance in international SCs compared to national
SCs
For international SCs, it is the value of importance of customer satisfaction which scored the
highest. Due to the fierce global competition the customer satisfaction in international SCs is
understandably quite critical. It is more difficult for the companies within international SCs to
build up their business, and it is even more difficult to sustain their competitive advantage. The
possible loss of their customers due to the cultural or other environmental differences is a
pervasive threat in the international SCs. The companies in national SCs on the other hand co-
exist within the same environment and culture, they are regulated by the same government and
they are more familiar with each other. Therefore, they may feel more comfortable and confident
to deal with their local customers. Concerning the performance, because of the cultural
differences and different business standards, it is more difficult for international SCs to satisfy
their customers compared to national SCs.
Importance of Customer satisfaction
Performance of Customer satisfaction
3.6
3.8
4
4.2
4.4
4.6
NationalInternational
4.44
4.59
4.11
3.94
Importance of Customer satisfaction
Performance of Customer satisfaction
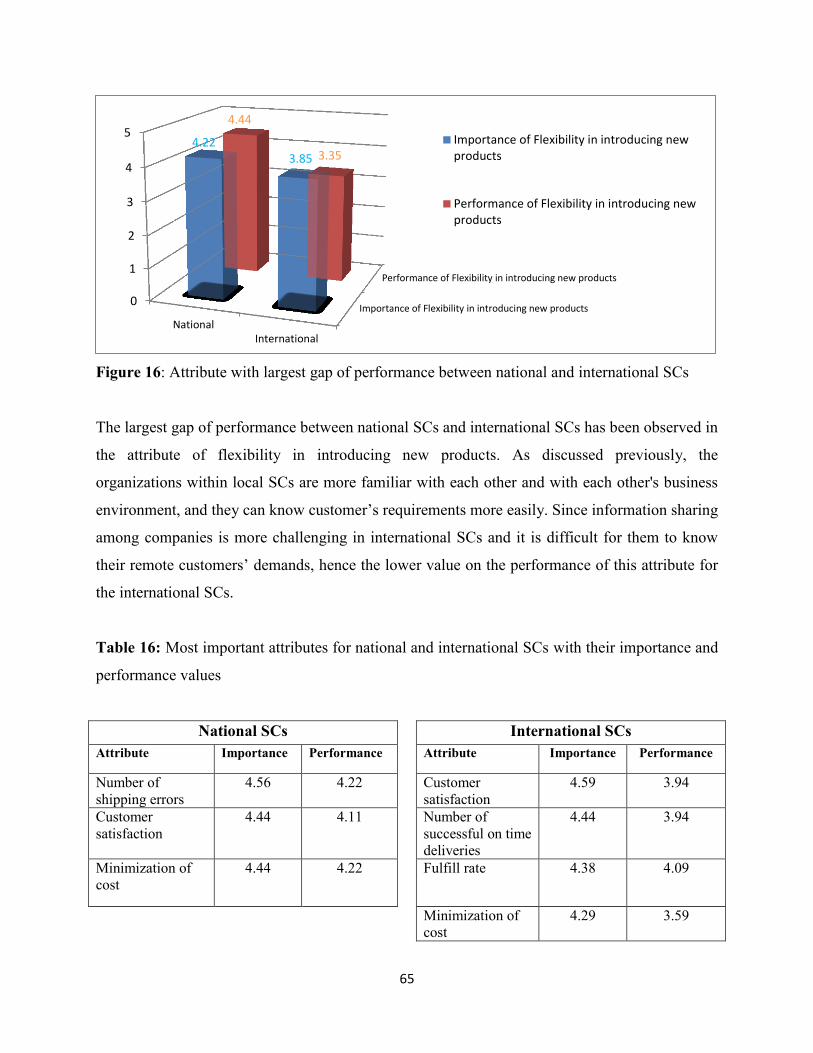
65
Figure 16: Attribute with largest gap of performance between national and international SCs
The largest gap of performance between national SCs and international SCs has been observed in
the attribute of flexibility in introducing new products. As discussed previously, the
organizations within local SCs are more familiar with each other and with each other's business
environment, and they can know customer’s requirements more easily. Since information sharing
among companies is more challenging in international SCs and it is difficult for them to know
their remote customers’ demands, hence the lower value on the performance of this attribute for
the international SCs.
Table 16: Most important attributes for national and international SCs with their importance and
performance values
National SCs International SCs
Attribute Importance Performance Attribute Importance Performance
Number of
shipping errors
4.56 4.22 Customer
satisfaction
4.59 3.94
Customer
satisfaction
4.44 4.11 Number of
successful on time
deliveries
4.44 3.94
Minimization of
cost
4.44 4.22 Fulfill rate 4.38 4.09
Minimization of
cost
4.29 3.59
Importance of Flexibility in introducing new products
Performance of Flexibility in introducing new products
0
1
2
3
4
5
NationalInternational
4.22 3.85
4.44
3.35 Importance of Flexibility in introducing newproducts
Performance of Flexibility in introducing newproducts
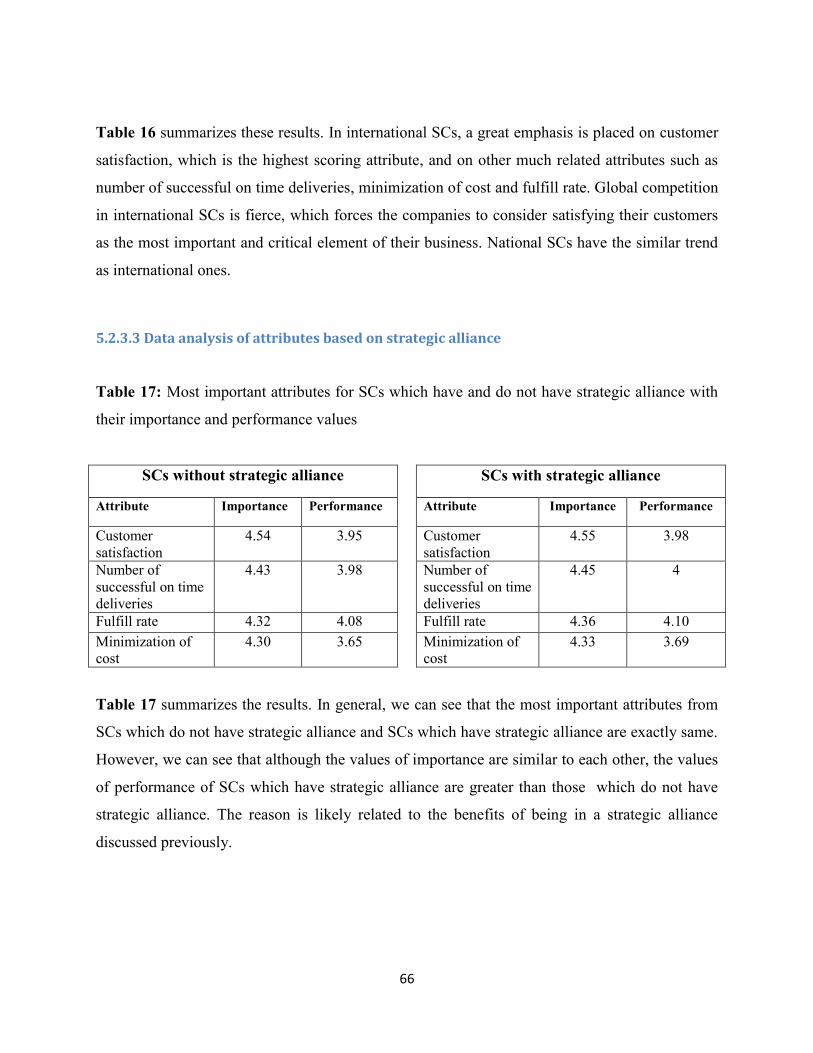
66
Table 16 summarizes these results. In international SCs, a great emphasis is placed on customer
satisfaction, which is the highest scoring attribute, and on other much related attributes such as
number of successful on time deliveries, minimization of cost and fulfill rate. Global competition
in international SCs is fierce, which forces the companies to consider satisfying their customers
as the most important and critical element of their business. National SCs have the similar trend
as international ones.
5.2.3.3 Data analysis of attributes based on strategic alliance
Table 17: Most important attributes for SCs which have and do not have strategic alliance with
their importance and performance values
SCs without strategic alliance SCs with strategic alliance
Attribute Importance Performance Attribute Importance Performance
Customer
satisfaction
4.54 3.95 Customer
satisfaction
4.55 3.98
Number of
successful on time
deliveries
4.43 3.98 Number of
successful on time
deliveries
4.45 4
Fulfill rate 4.32 4.08 Fulfill rate 4.36 4.10
Minimization of
cost
4.30 3.65 Minimization of
cost
4.33 3.69
Table 17 summarizes the results. In general, we can see that the most important attributes from
SCs which do not have strategic alliance and SCs which have strategic alliance are exactly same.
However, we can see that although the values of importance are similar to each other, the values
of performance of SCs which have strategic alliance are greater than those which do not have
strategic alliance. The reason is likely related to the benefits of being in a strategic alliance
discussed previously.
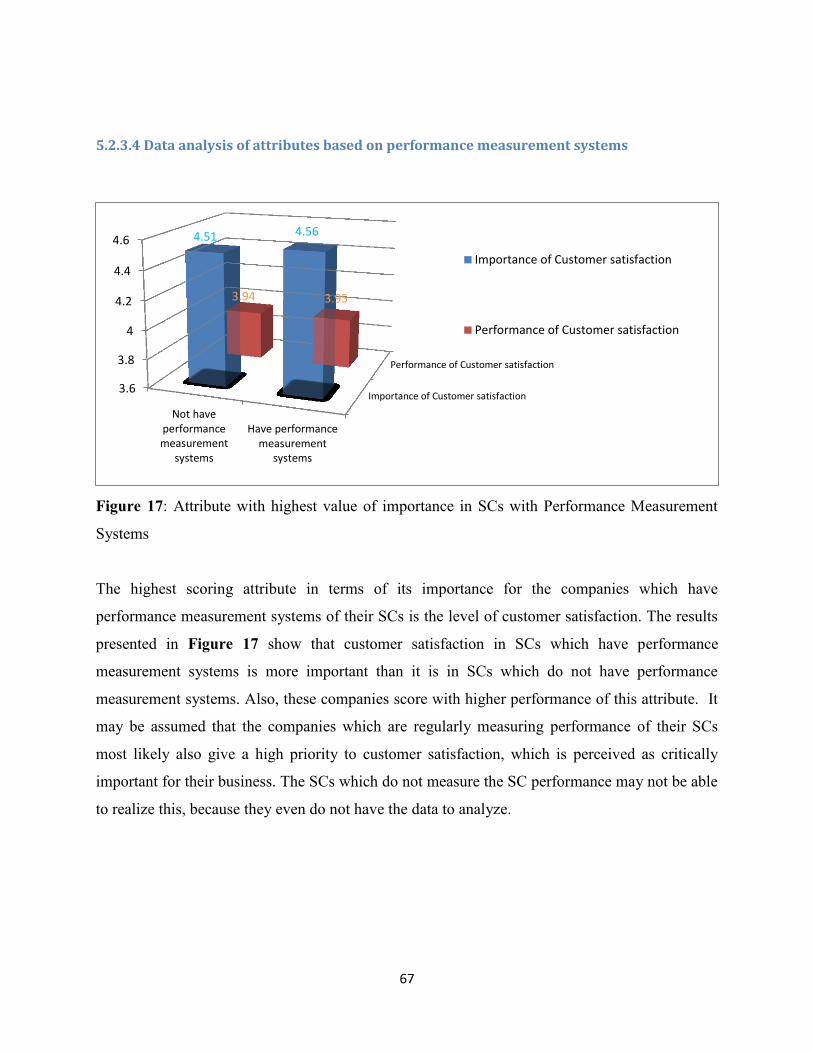
67
5.2.3.4 Data analysis of attributes based on performance measurement systems
Figure 17: Attribute with highest value of importance in SCs with Performance Measurement
Systems
The highest scoring attribute in terms of its importance for the companies which have
performance measurement systems of their SCs is the level of customer satisfaction. The results
presented in Figure 17 show that customer satisfaction in SCs which have performance
measurement systems is more important than it is in SCs which do not have performance
measurement systems. Also, these companies score with higher performance of this attribute. It
may be assumed that the companies which are regularly measuring performance of their SCs
most likely also give a high priority to customer satisfaction, which is perceived as critically
important for their business. The SCs which do not measure the SC performance may not be able
to realize this, because they even do not have the data to analyze.
Importance of Customer satisfaction
Performance of Customer satisfaction
3.6
3.8
4
4.2
4.4
4.6
Not haveperformancemeasurement
systems
Have performancemeasurement
systems
4.51 4.56
3.94 3.95
Importance of Customer satisfaction
Performance of Customer satisfaction
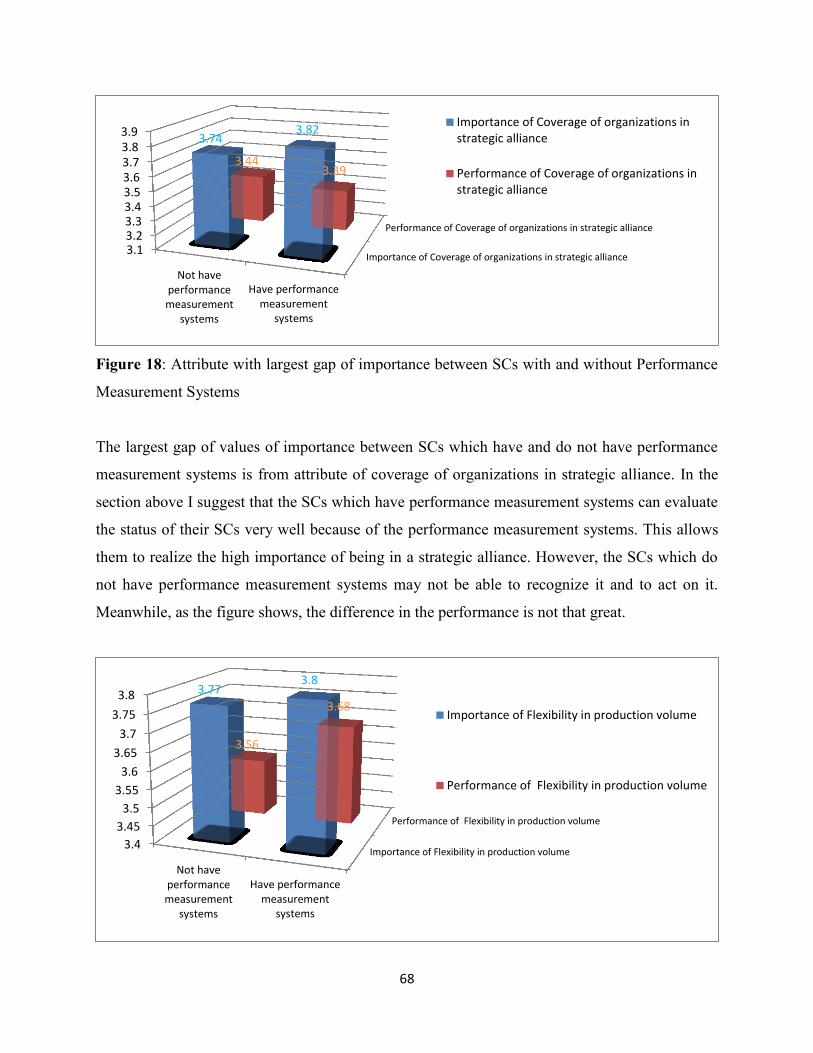
68
Figure 18: Attribute with largest gap of importance between SCs with and without Performance
Measurement Systems
The largest gap of values of importance between SCs which have and do not have performance
measurement systems is from attribute of coverage of organizations in strategic alliance. In the
section above I suggest that the SCs which have performance measurement systems can evaluate
the status of their SCs very well because of the performance measurement systems. This allows
them to realize the high importance of being in a strategic alliance. However, the SCs which do
not have performance measurement systems may not be able to recognize it and to act on it.
Meanwhile, as the figure shows, the difference in the performance is not that great.
Importance of Coverage of organizations in strategic alliance
Performance of Coverage of organizations in strategic alliance
3.13.23.33.43.53.63.73.83.9
Not haveperformancemeasurement
systems
Have performancemeasurement
systems
3.74 3.82
3.44 3.39
Importance of Coverage of organizations instrategic alliance
Performance of Coverage of organizations instrategic alliance
Importance of Flexibility in production volume
Performance of Flexibility in production volume
3.4
3.45
3.5
3.55
3.6
3.65
3.7
3.75
3.8
Not haveperformancemeasurement
systems
Have performancemeasurement
systems
3.77 3.8
3.56
3.68 Importance of Flexibility in production volume
Performance of Flexibility in production volume
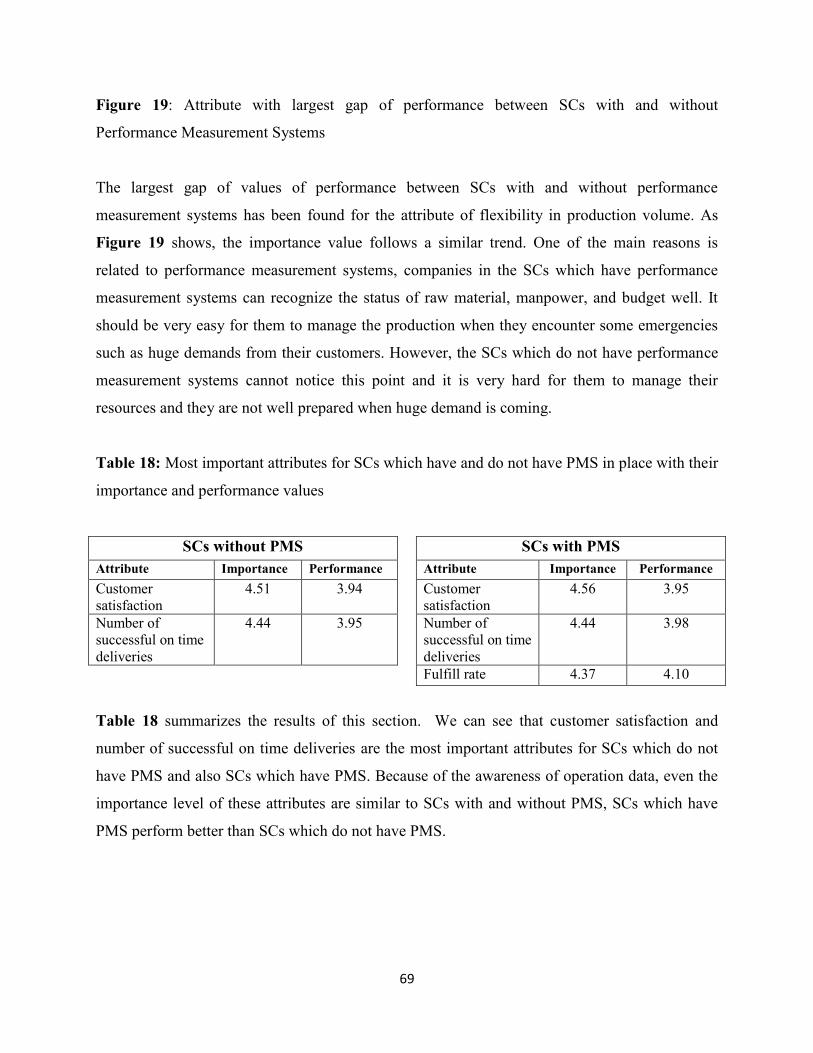
69
Figure 19: Attribute with largest gap of performance between SCs with and without
Performance Measurement Systems
The largest gap of values of performance between SCs with and without performance
measurement systems has been found for the attribute of flexibility in production volume. As
Figure 19 shows, the importance value follows a similar trend. One of the main reasons is
related to performance measurement systems, companies in the SCs which have performance
measurement systems can recognize the status of raw material, manpower, and budget well. It
should be very easy for them to manage the production when they encounter some emergencies
such as huge demands from their customers. However, the SCs which do not have performance
measurement systems cannot notice this point and it is very hard for them to manage their
resources and they are not well prepared when huge demand is coming.
Table 18: Most important attributes for SCs which have and do not have PMS in place with their
importance and performance values
SCs without PMS SCs with PMS
Attribute Importance Performance Attribute Importance Performance
Customer
satisfaction
4.51 3.94 Customer
satisfaction
4.56 3.95
Number of
successful on time
deliveries
4.44 3.95 Number of
successful on time
deliveries
4.44 3.98
Fulfill rate 4.37 4.10
Table 18 summarizes the results of this section. We can see that customer satisfaction and
number of successful on time deliveries are the most important attributes for SCs which do not
have PMS and also SCs which have PMS. Because of the awareness of operation data, even the
importance level of these attributes are similar to SCs with and without PMS, SCs which have
PMS perform better than SCs which do not have PMS.
70
6. Summary and conclusions
In this thesis I have developed a tool for measuring performance of manufacturing SC. Even
though there are some techniques and methods already existing, there are several factors which
make this tool stand out. First, the tool is very simple and practical, and thus can be easily used
for the performance measurement in manufacturing SC of any size. Second, the tool is generic,
which makes it possible to be used by any company in any industrial manufacturing sector. Third,
the developed tool involves weights given to the attributes, which makes the performance
evaluation more accurate. I sincerely hope that the tools will be adopted in the real life
manufacturing SCs.
In the second part of the thesis I have used the tool as a questionnaire in order to evaluate
manufacturing SC performance and carry out a comparative analysis of existing SCs. First, I
analyzed the general status of performance measurement of manufacturing SCs based on the
globally collected data from various SCs in various countries and industries. There are several
findings which I would like to highlight:
Many manufacturing SCs still do not have any strategic alliance
Performance measurement in the whole SC is considered by many to be very important
Many SCs have not implemented any kind of performance measurement systems; the reason
is mainly because of time, manpower and lack of management commitment
The most commonly implemented performance measurement systems are BSC,SCOR and
TQM
Cost and reliability are the most important aspects which need to be measured
The different perspectives and attributes’ performance can be measured at a high level by
applying the tool developed in this thesis
Second, I developed an index for the assessment of the SC performance and used it to evaluate
weighted performances of manufacturing SCs based on 4 factors: Evaluations and comparisons
were performed based on different industries, different countries, based on the adherence of the
companies to a strategic alliance and based on the use of the performance measurement systems
71
in the companies. The findings show that all weighted performances from national SCs are better
than those from international SCs. Moreover, I observed that all perspectives of SCs which have
strategic alliance have greater values of weighted performance indexes than the SCs which do
not have strategic alliance. Finally, SCs which have performance measurement systems perform
better than SCs which do have the performance measurement systems.
Finally, I have focused on the individual attributes and highlighted the ones which obtained the
highest importance values. Based on this analysis I conclude that there is a small difference
between supply chain performance in heavy and light industries. In both SCs, a great emphasis is
placed on customer satisfaction, which is the highest scoring attribute, and on other much related
attributes such as number of successful on time deliveries and minimization of cost.
In SCs which have strategic alliance, I found that a great emphasis is given to attributes which
are customer oriented, emphasizing thereby the need to keep the good relationships within the
alliance.
For the SCs which have managed to build their own performance measurement systems it is
customer satisfaction, the number of successful on time deliveries and fulfill rate which became
the most important attributes.
7. Contributions
The main value of this work stems from several points discussed below:
This thesis focuses on the whole manufacturing SC concept. There are only a few research
studies which address the whole manufacturing SC, because most of the research is only
focused on single company’s supply chain
There are only a few related research works which carry out research in different countries
and different industries. Most of the research focuses only on one specific country or one
72
specific industry. Another uniqueness of this work is thus that it manages to cover the global
scope from a variety of countries and industries
I consider this work as a pioneer research which developed a methodology and a tool while
using a general approach which enables the investigation of all types of manufacturing SC
performance
A 6 months survey was undertaken which allowed a collection of much valuable information
concerning manufacturing SCs from different companies, industries, countries. The analysis
based on the responses provided some characterization of several aspects of various supply
chain and highlighted some improvements that can be done in order to optimize SC
performance based on different perspectives and attributes
The work is tightly connected with industries. A summary report will be created and sent to
the interested participant in order to get them informed about the importance of performance
measurement of manufacturing SC
8. Limitations
There are also some limitations for this research:
we cannot gain the raw data concerning SCs to do further research based on detailed level
Attributes for particular manufacturing SCs are not discussed
Because of the duration of this research, we cannot see the efficiencies and effectives of this
tool to help industries to improve their performance measurement capability on their SCM
73
The methodology and tool which have been developed are not integrated with current real
applications of performance measurement systems, e.g. SAP SCPM and PeopleSoft
Enterprise SCM
9. Future works
Some future works will be according to the limitations of this research:
Future research can be undertaken at a more detailed level to performance measurement
systems of manufacturing SCs with cooperation with companies
The methodology and tool could be implemented on industries and investigated consistently
Attributes for particular manufacturing SCs could be developed
The tool which has been developed could be integrated with IT application implementations
in industries such as SAP SCPM and PeopleSoft Enterprise SC
74
Bibliography Adrien Chia, M. G.-H. (1999). Performance measurement in supply chain entities: balanced scorecard
perspective. Benchmarking: An International Journal, 605-620.
Ambuj Khare, A. S. (2012). Supply Chain Performance Measures for gaining Competitive Advantage: A
Review. Journal of Management and Strategy, Vol. 3, No. 2, p25-32.
Barbara Bigliardi, E. B. (2010). Performance measurement in the food supply chain: a balanced scorecard
approach. Facilities, Vol. 28 Iss: 5 pp. 249 - 260.
Basnet, C. C. (2003). Benchmarking supply chain management practice in New Zealand. Supply Chain
Management: An International Journal, Vol. 8 No. 1, pp. 57-64.
Beamon, B. (1996). Performance measures in supply chain management. New York: Rensselaer
Polytechnic Institute
Beamon, B. (1998). Supply chain design and analysis: models and methods. International Journal of
Production Economics, Vol. 55, pp. 281-94.
Beamon, B. (1999). Measuring supply chain performance. International Journal of Operations and
Production Management, Vol. 19 Nos 3-4, pp. 275-92.
Beamon, B. a. (2001). Performance analysis of conjoined supply chains. International Journal of
Production Research, Vol. 39 No. 14, pp. 3195-218.
Benton, W. a. (2005). The influence of power driven buyer/seller relationships on supply chain
satisfaction. Journal of Operations Management, Vol. 23, No. 1, pp. 1–22.
Besterfield-Sacre. (2003). Total Quality Management. Upper Saddle River: NJ: Person Education,Inc
Bierbusse, P. a. (1997). Measures that matter. Journal of Strategic Performance Measurement, Vol. 1 No.
2, pp. 6-11.
Bititci, U. C. (2005). Implementation of performance measurement systems: private and public sectors.
Production Planning and Control, Vol. 16, No. 2, pp. 99-100.
Bourne, M. M. (1999). Performance measurement system design: testing a process approach in
manufacturing companies. International Journal of Business Performance Measurement, Vol. 1
No. 2, pp. 154-70.
Bourne, M. M. (2000). Designing, implementing and updating performance measurement systems.
International Journal of Operations and Production Management, Vol. 20 No. 7, pp. 754-71.
Bourne, M. N. (2002). The success and failure of performance measurement initiatives: perceptions of
participating managers. International Journal of Operations and Production Management, Vol.
22 No. 11, pp. 1288-310.

75
Boyer, K. a. (2002). Competitive priorities: investigating the need for trade-offs in operations strategy.
Journal of Operations Management, Vol. 11, No. 1, pp. 9–20.
Brewer, P. S. (2000). Using the balanced scorecard to measure supply chain performance. Journal of
Business Logistics, Vol. 21, No. 1, pp. 75–94.
BS4778, B. S. (1987). Quality Vocabulary. London
Camp, R. (1989). Benchmarking ± The Search for Industry Best Practices that Lead to Superior
Performance. Milwaukee: ASQS Quality Press
Caprice, C. S. (1994). A review and evaluation of logistics metrics. International Journal of Logistics
Management, Vol. 5, No. 2, pp. 11–28.
Caprice, C. S. (1995). A review and evaluation of logistics performance measurement systems.
International Journal of Logistics Management, Vol. 6, No.1, pp. 61–74.
Chan, F. (2003). Performance measurement in a supply chain. International Journal of Advanced
Manufacturing Technology, Vol. 21, pp. 534-48.
Chan, F. T. (2003). An innovative performance measurement method for supply chain management.
Supply Chain Management: An International Journal, 8(3–4), 209–223.
Chen, I. a. (2004). Understanding supply chain management: critical research and a theoretical
framework. International Journal of Production Research, Vol. 42 No. 1, pp. 131-63.
Chen, S. J. (2007). A systematic approach for supply chain improvement using design structure matrix.
Journal of Intelligent Manufacturing, 18, 285–299.
Chou, C.-F. (2004). Development of a Comprehensive Supply Chain Performance Measurement System: A
Case Stduty in the Grocery Retail Industry. MIT
Christopher. (2000). The Agile Supply Chain: Competing in Volatile Markets. Industrial Marketing
Management, 29(1): 37–44.
Christopher, M. a. (2001). An integrated model for the design of agile supply chains. International
Journal of Physical Distribution and Logistic Management, Vol. 31, pp. 235–246.
Clegg, C. W. (2002). An international survey of the use and effectiveness of modern manufacturing
practices. In Human Factors & Ergonomics in Manufacturing pp. 12, 171–191.
Cooper, R. a. (1988). Measure costs right: make the right decisions. Harvard Business Review, Vol. 66 No.
5, p. 96.
De Toni, A. a. (2001). Performance measurement systems: models, characteristics and measures.
International Journal of Operations and Production Management, Vol. 21 Nos 1/2, pp. 46-70.
76
Dixon, J. R. (1990). The new performance challenge-measuring operations for world class
competition. IL: Dow Jones-Irwin. Homewood.
Ellinger, A. E. (2000). Improving marketing/logistics cross functional collaboration in the supply chain. In
Industrial Marketing Management pp. 29, 85–96.
Ellram, L. (1999). The supplier selection decision in strategic partnerships. International Journal of
Purchasing and Materials Management, Vol. 26, No. 4, pp. 8–14.
Ferdows, K. a. (1990). Lasting improvements in manufacturing performance: in search of the new theory.
Journal of Operations Management, Vol. 9, pp. 168–184.
Fergueson, B. R. (2000). Implementing supply chain management. Production and Inventory
Management Journal, 64–67.
Flynn, B. a. (2004). An exploratory study of the nature of cumulative capabilities. Journal of Operations
Management, Vol. 22, pp. 439–457.
Flynn, B. a. (2005). Synergies between supply chain management and quality management: emerging
implications. International Journal of Production Research, Vol. 43 No. 16, pp. 3421-36.
Fynes, B. d. (2005). Supply chain relationship quality: the competitive environment and performance.
International Journal of Production Research, Vol. 43 No. 16, pp. 3303-20.
Garvin, D. A. (1988). Managing Quality: the strategic and Competitive Edge. New York: Free Press;
London: Collier Macmillan,c1988
Globerson, S. (1985). Issues in developing a performance criteria system for an organization.
International Journal of Production Research, 23(4), 639–646.
Goulden, C. a. (1995). A hybrid model for process quality costing. International Journal of Quality and
Reliability Management, Vol. 12 No. 8, p. 32.
Gunasekaran A., K. B. (2007). Performance measures and metrics in logistics and supply chain
management: A review of recent literature (1995–2004) for research and applications. Journal
of Production Research, 45(12): 2819–2840.
Gunasekaran, A. P. (2001). Performance measures and metrics in a supply chain environment.
International Journal of Operations and Production Management, Vol. 21 Nos 1-2, pp. 71-87.
Gunasekaran, A. P. (2001). Performance measures and metrics in a supply chain environment.
International Journal of Operations & Production Management, 21(1/2),71–87.
Gunasekaran, A. P. (2004). A framework for supply chain performance measurement. International
Journal of Production Economics, Vol. 87 No. 3, pp. 333-47.
77
Gunter, C. S. (2006). Measuring supply chain performance: current research and future directions.
International Journal of Productivity and Performance Management, Vol. 55 No. 3/4, pp. 242–
258.
Hacker, M. a. (1998). Designing and installing effective performance measurement systems. IIIE Solutions
Handfield, R. B. (1999). Introduction to supply chain management. New Jersey: Prentice Hall
Hans-Jörg Bullinger, M. K. (2002). Analysing supply chain performance using a balanced measurement
method. International Journal of Production Research, 40:15, 3533-3543.
Hieber, R. (2002). Supply Chain Management: A Collaborative Performance Measurement Approach.
Zurich
Huang, S. S. (2004). A review and analysis of supply chain operations reference (SCOR) model. Supply
Chain Management: An International Journal, Vol. 9 No. 1, pp. 23-9.
Huang, S. S. (2005). Computer assisted supply chain configuration based on supply chain operations
reference (SCOR) model. Computers and Industrial Engineering, Vol. 48 No. 2, pp. 377-94.
Hudson, M. L. (2001). Improving control through effective performance measurement in SMEs.
Production Planning and Control
Hudson, M. S. (2001). Theory and practice in SME performance measurement systems. International
Journal of Operations & Production Management, Vol. 21 No. 8, pp. 1095-115.
Ing-Long Wu, C.-H. C. (2012). Using the balanced scorecard in assessing the performance of e-SCM
diffusion:A multi-stage perspective. Decision Support Systems, 52,474–485.
Ing-Long Wu, C.-H. C. (2012). Using the balanced scorecard in assessing the performance of e-SCM
diffusion:A multi-stage perspective. Decision Support Systems, 52, 474–485.
Kannan, V. a. (2005). Just in time, total quality management, and supply chain management:
understanding their linkages and impact on business performance. Omega, Vol. 33, pp. 153 –
162.
Kaplan R.S., N. D. (1996). Linking the balanced scorecard to strategy. California management review, (1):
53–79.
Kaplan, R. a. (1996, January/February). Using the balanced scorecard as a strategic management system.
Harvard Business Review, pp. 75-85.
Kaplan, R. S. (1992). The balanced scorecard: measures that drive performance. Harvard Business
Review, 70(1), 71–9.
Keegan, D. P. (1989). Are your performance measures obsolete? In Management Accounting pp. 134–
147.
78
Kennerley, M. &. (2002). A framework of the factors affecting the evolution of performance
measurement systems. International Journal of Operations & Production Management, 22(11),
1222–1245.
Kennerley, M. &. (2003). Measuring performance in a changing business environment. International
Journal of Operations & Production Management, 23(2), 213–229.
Kuo-Pin Chang, G. G. (2010). E-Business Strategy for Supply Chain Integration:The Balanced Scorecard
Perspectives. 2010 International Symposium on Computer, Communication, Control and
Automation, pp. 480-483.
Li, S. S.-N.-N. (2005b). Development and validation of a measurement instrument for studying supply
chain management practices. Journal of Operations Management, 23, 618–641.
Lockamy, A. &. (2004). Linking SCOR planning practices to supply chain performance: An exploratory
study. International Journal of Operations & Production Management, 24(11–12), 1192–1218.
Lohman C., F. L. (2004). Designing a performance measurement system: A case study. European Journal
of Operational Research, 156(2): 267–286.
Malmi, T. (2001). Balanced scorecards in Finnish companies: A research note. Management Accounting
Research, 12, 207–220.
McCunn, P. (1998). The balanced scorecard: the eleventh commandment. Management Accounting
Mee, L. a. (1998). The ten commandments of balanced scorecard implementation. Management Control
and Accounting
Meekings, A. (1995, October-December). Unlocking the potential of performance measurement: a guide
to practical implementation. ublic Money & Management, pp. pp. 1-8.
Milind Kumar Sharma, R. B. (2007). An integrated BSC-AHP approach for supply chain management
evaluation. MEASURING BUSINESS EXCELLENCE, VOL. 11 NO. 3.
Morgan, C. (2004). Structure, speed and salience: performance measurement in the supply chain.
Business Process Management Journal, 10(5), 522–536.
Neely A., M. J. (1994). Realizing strategy through measurement. International Journal of Operations &
Production Management, 14(3): 140–152.
Neely, A. G. (1995). Performance measurement systems design: a literature review and research agenda.
International Journal of Operations & Production Management, 15(4), 80–116.
Norreklit, H. J. (2008). Pitfalls in using the balanced scorecard. Journal of Corporate Accounting &
Finance, Vol. 19 No. 6, pp. 65-8.
79
Nudurupati, S. a. (2005). Implementation and impact of IT-supported performance measurement
systems. Production Planning and Control, Vol. 16 No. 2, pp. 152-62.
Rajat Bhagwat a, M. K. (2007). Performance measurement of supply chain management: A balanced
scorecard approach
Schneiderman, A. (1999). Why balanced scorecards fail. Journal of Strategic Performance Measurement,
pp. 6-11.
Scho n̈sleben, P. (2004). Integral Logistics Management: Planning and Control of Comprehensive Supply
Chains. St Lucie Press
Shepherd, C. a. (2006). Measuring supply chain performance: current research and future directions.
International Journal of Productivity and Performance Management, Vol. 55, No. 3/4, p. 242.
Sillanpää. (2010). Supply chain performance measurement in the manufacturingindustry. A single case
study research to develop a supply chain performance measurement framework. University of
Oulu. Acta Univ. Oul. C, 374, 2010.
Stephens, S. (2001). Supply chain operations reference model version 5.0: a new tool to improve supply
chain efficiency and achieve best practice. Information Systems Frontiers, 3(4), 471–476.
Thomas, J. (1999). Why your supply chain doesn’t work. Logistics Management and Distribution Report
Waal, D. (2003). Behavioral factors important for the successful implementation and use of performance
management systems (Vols. 41(8): 688–697). Management Decision
Waggoner, D. B. (1999). The forces that shape organisational performance measurement systems: An
interdisciplinary review. International Journal of Production Economics, 60/61, 53–60.
Webster, M. (2002). Supply system structure, management and performance: a conceptual model.
International Journal of Management Reviews, 4(4), 353–369.
Wood, S. J. (2004). Revisiting the use and effectiveness of modern manufacturing practices. Human
Factors & Ergonomics in Manufacturing, 14(4),415–32.
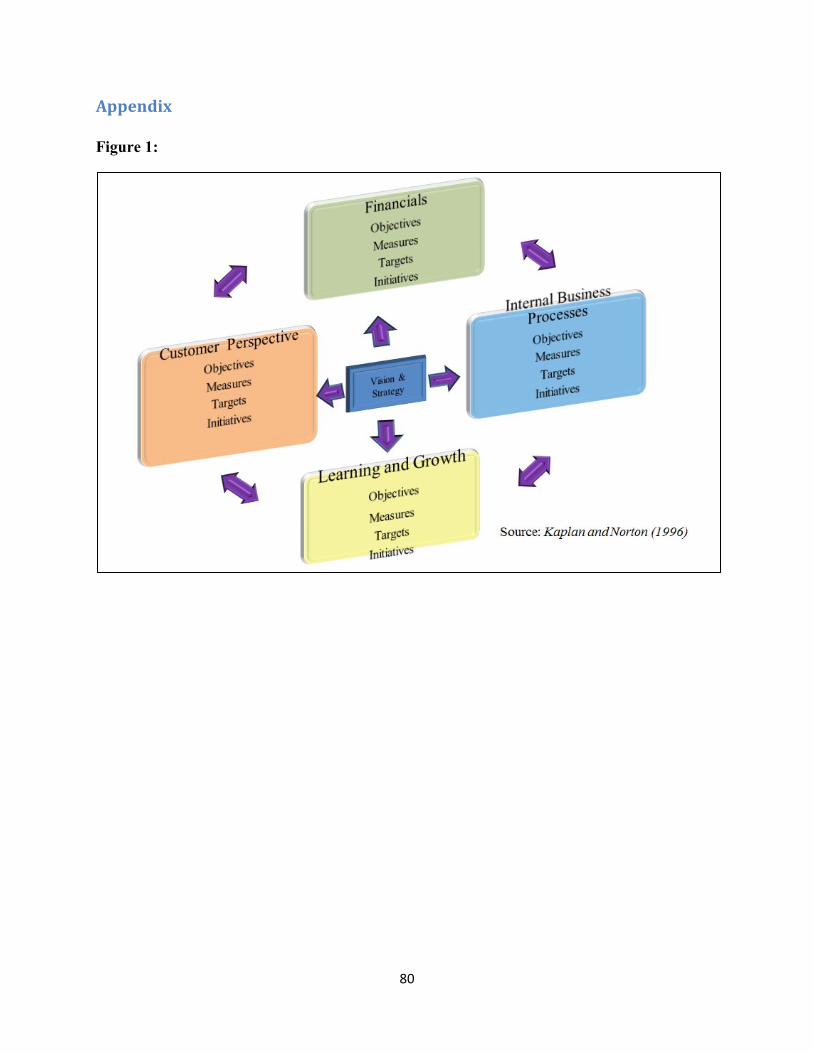
80
Appendix
Figure 1:
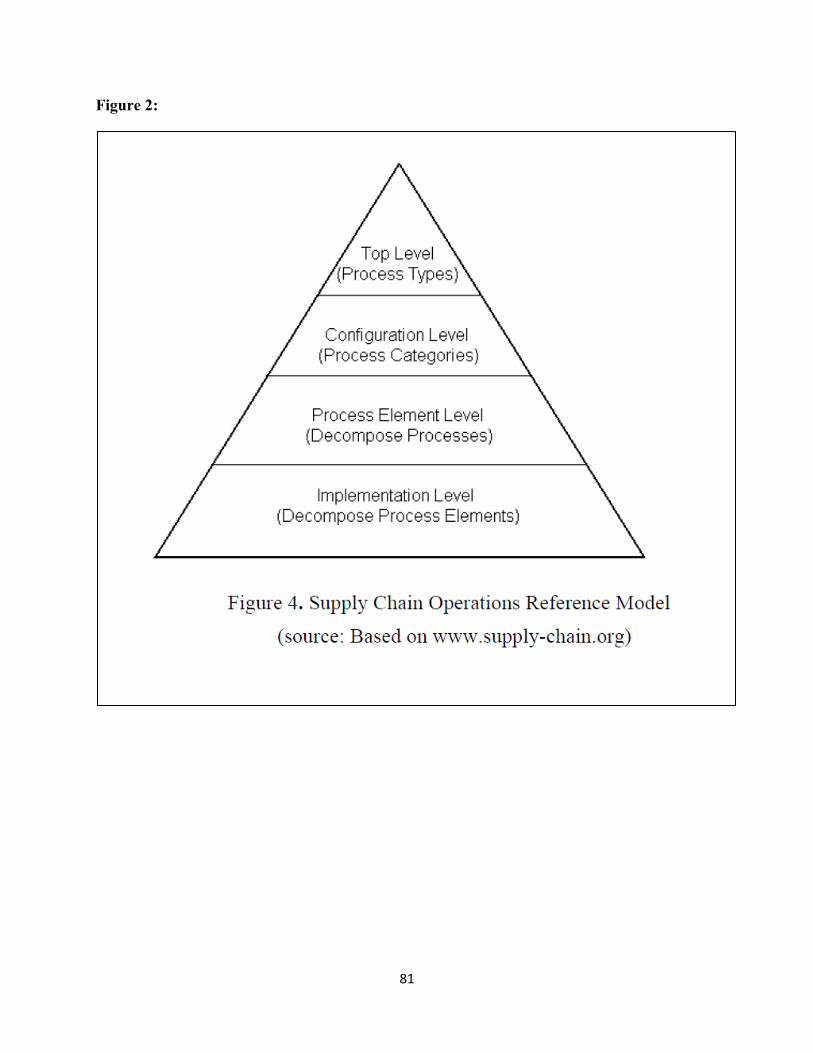
81
Figure 2:
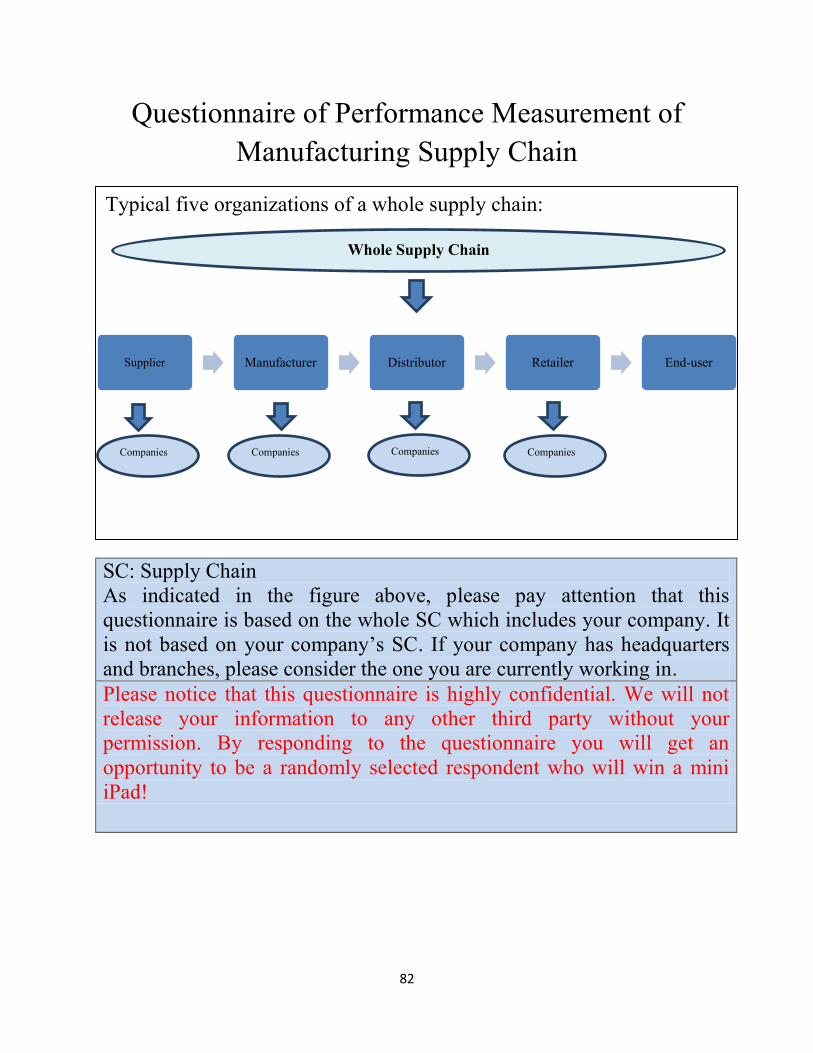
82
Questionnaire of Performance Measurement of
Manufacturing Supply Chain
SC: Supply Chain
As indicated in the figure above, please pay attention that this
questionnaire is based on the whole SC which includes your company. It
is not based on your company’s SC. If your company has headquarters
and branches, please consider the one you are currently working in.
Please notice that this questionnaire is highly confidential. We will not
release your information to any other third party without your
permission. By responding to the questionnaire you will get an
opportunity to be a randomly selected respondent who will win a mini
iPad!
Supplier Manufacturer Distributor Retailer End-user
Typical five organizations of a whole supply chain:
Whole Supply Chain
Companies Companies Companies Companies
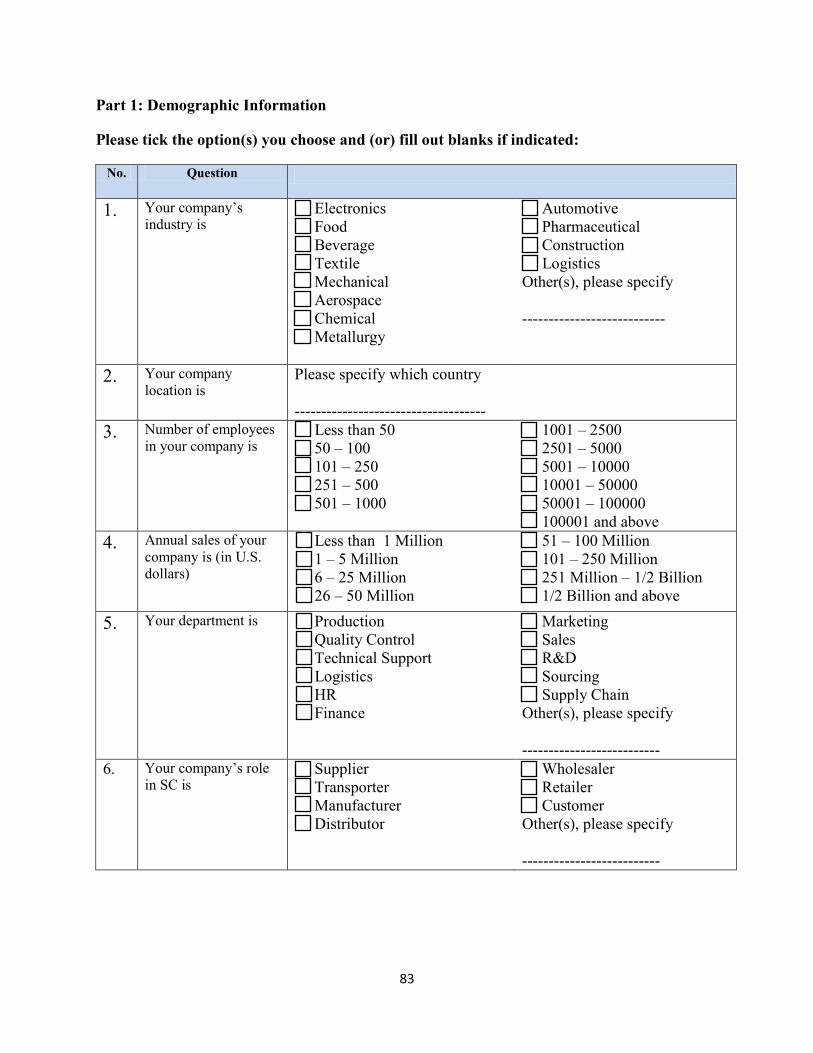
83
Part 1: Demographic Information
Please tick the option(s) you choose and (or) fill out blanks if indicated:
No. Question
1. Your company’s
industry is Electronics
Food
Beverage
Textile
Mechanical
Aerospace
Chemical
Metallurgy
Automotive
Pharmaceutical
Construction
Logistics
Other(s), please specify
---------------------------
2. Your company
location is
Please specify which country
------------------------------------
3. Number of employees
in your company is Less than 50
50 – 100
101 – 250
251 – 500
501 – 1000
1001 – 2500
2501 – 5000
5001 – 10000
10001 – 50000
50001 – 100000
100001 and above
4. Annual sales of your
company is (in U.S.
dollars)
Less than 1 Million
1 – 5 Million
6 – 25 Million
26 – 50 Million
51 – 100 Million
101 – 250 Million
251 Million – 1/2 Billion
1/2 Billion and above
5. Your department is Production
Quality Control
Technical Support
Logistics
HR
Finance
Marketing
Sales
R&D
Sourcing
Supply Chain
Other(s), please specify
--------------------------
6. Your company’s role
in SC is Supplier
Transporter
Manufacturer
Distributor
Wholesaler
Retailer
Customer
Other(s), please specify
--------------------------
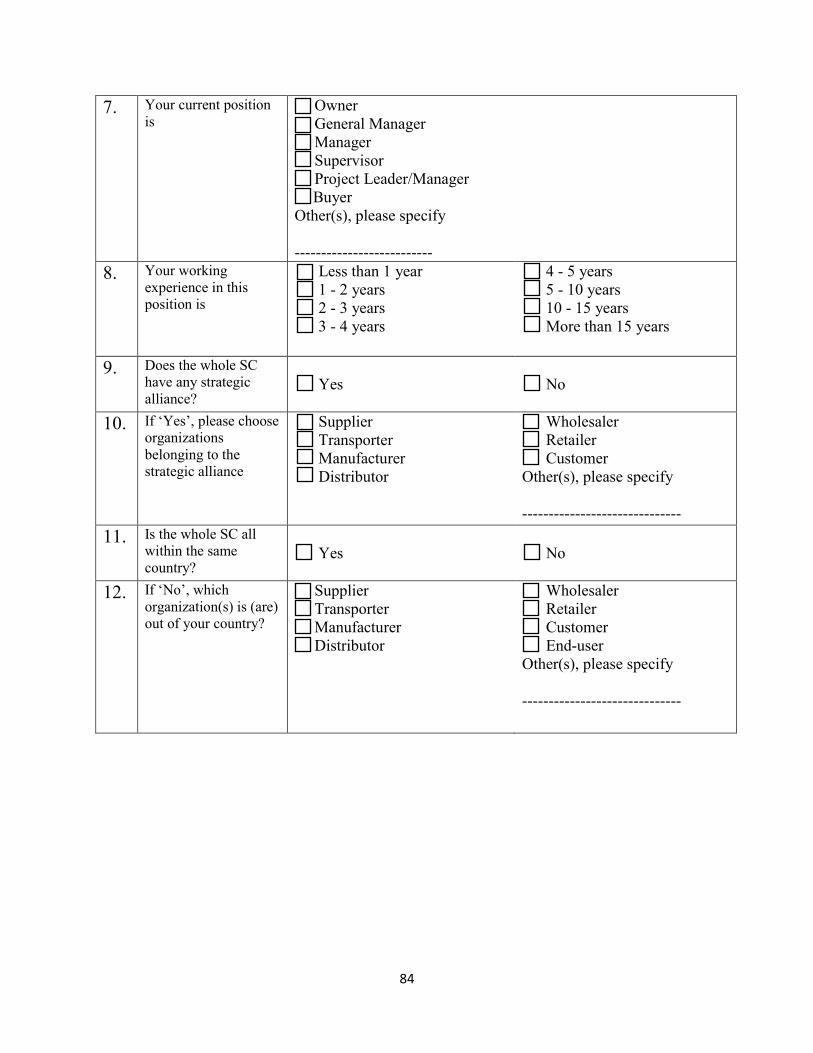
84
7. Your current position
is Owner
General Manager
Manager
Supervisor
Project Leader/Manager
Buyer Other(s), please specify
--------------------------
8. Your working
experience in this
position is
Less than 1 year
1 - 2 years
2 - 3 years
3 - 4 years
4 - 5 years
5 - 10 years
10 - 15 years
More than 15 years
9. Does the whole SC
have any strategic
alliance?
Yes
No
10. If ‘Yes’, please choose
organizations
belonging to the
strategic alliance
Supplier
Transporter
Manufacturer
Distributor
Wholesaler
Retailer
Customer
Other(s), please specify
------------------------------
11. Is the whole SC all
within the same
country?
Yes
No
12. If ‘No’, which
organization(s) is (are)
out of your country?
Supplier
Transporter
Manufacturer
Distributor
Wholesaler
Retailer
Customer
End-user
Other(s), please specify
------------------------------
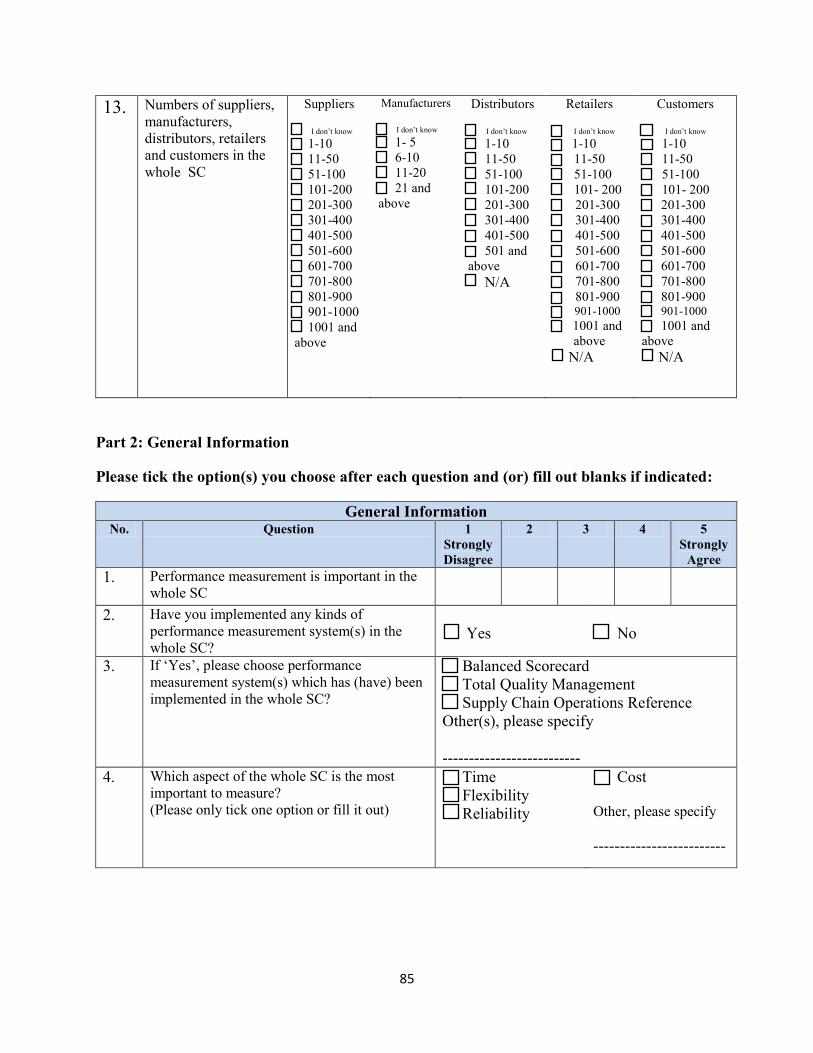
85
13. Numbers of suppliers,
manufacturers,
distributors, retailers
and customers in the
whole SC
Suppliers
I don’t know
1-10
11-50
51-100
101-200
201-300
301-400
401-500
501-600
601-700
701-800
801-900
901-1000
1001 and
above
Manufacturers
I don’t know
1- 5
6-10
11-20
21 and
above
Distributors
I don’t know
1-10
11-50
51-100
101-200
201-300
301-400
401-500
501 and
above
N/A
Retailers
I don’t know
1-10
11-50
51-100
101- 200
201-300
301-400
401-500
501-600
601-700
701-800
801-900 901-1000
1001 and
above
N/A
Customers
I don’t know
1-10
11-50
51-100
101- 200
201-300
301-400
401-500
501-600
601-700
701-800
801-900 901-1000
1001 and
above
N/A
Part 2: General Information
Please tick the option(s) you choose after each question and (or) fill out blanks if indicated:
General Information No. Question 1
Strongly
Disagree
2 3 4 5
Strongly
Agree
1. Performance measurement is important in the
whole SC
2. Have you implemented any kinds of
performance measurement system(s) in the
whole SC?
Yes
No
3. If ‘Yes’, please choose performance
measurement system(s) which has (have) been
implemented in the whole SC?
Balanced Scorecard
Total Quality Management
Supply Chain Operations Reference
Other(s), please specify
--------------------------
4. Which aspect of the whole SC is the most
important to measure?
(Please only tick one option or fill it out)
Time
Flexibility
Reliability
Cost
Other, please specify
-------------------------
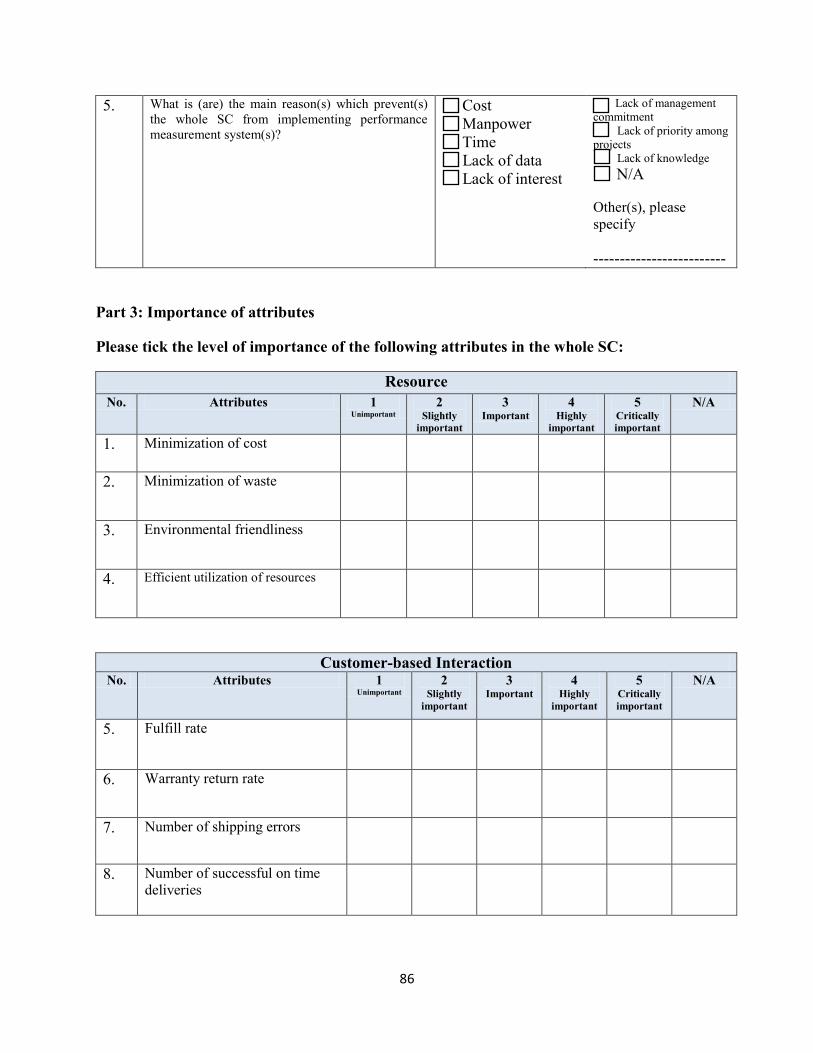
86
5. What is (are) the main reason(s) which prevent(s)
the whole SC from implementing performance
measurement system(s)?
Cost
Manpower
Time
Lack of data
Lack of interest
Lack of management
commitment Lack of priority among
projects
Lack of knowledge N/A
Other(s), please
specify
-------------------------
Part 3: Importance of attributes
Please tick the level of importance of the following attributes in the whole SC:
Resource
No. Attributes 1 Unimportant
2 Slightly
important
3 Important
4 Highly
important
5 Critically
important
N/A
1. Minimization of cost
2. Minimization of waste
3. Environmental friendliness
4. Efficient utilization of resources
Customer-based Interaction No. Attributes 1
Unimportant
2 Slightly
important
3 Important
4 Highly
important
5 Critically
important
N/A
5. Fulfill rate
6. Warranty return rate
7. Number of shipping errors
8. Number of successful on time
deliveries
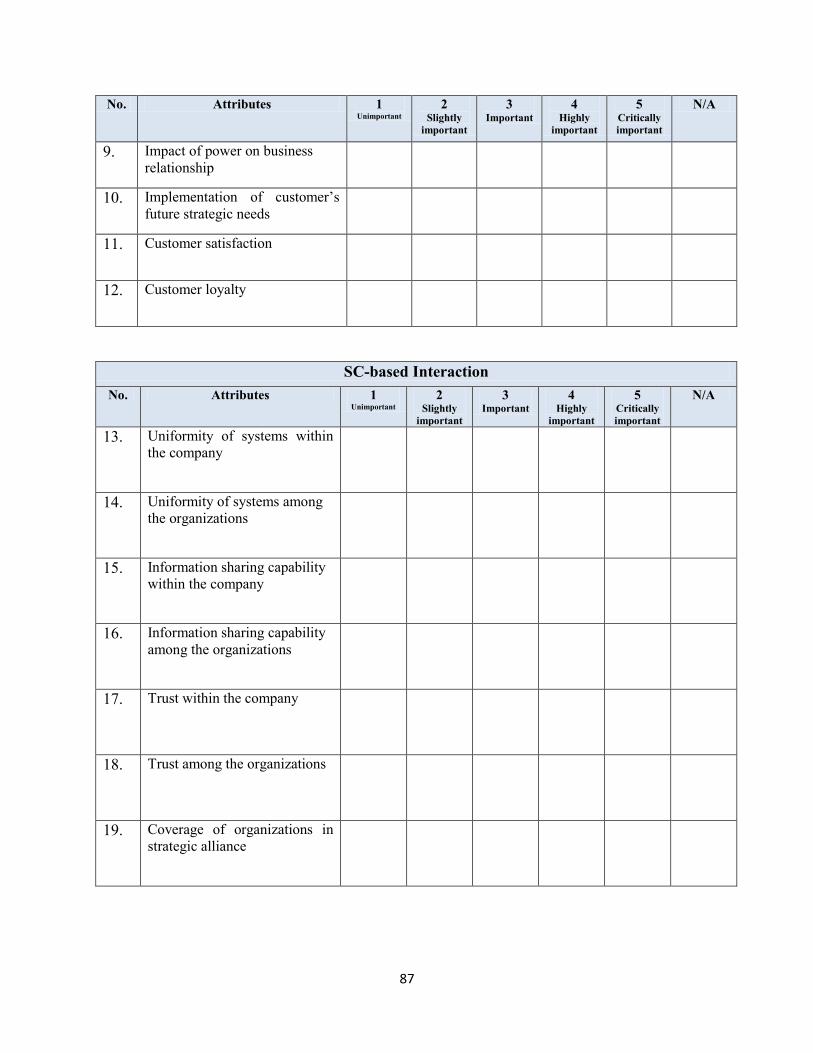
87
No. Attributes 1 Unimportant
2 Slightly
important
3 Important
4 Highly
important
5 Critically
important
N/A
9. Impact of power on business
relationship
10. Implementation of customer’s
future strategic needs
11. Customer satisfaction
12. Customer loyalty
SC-based Interaction
No. Attributes 1 Unimportant
2 Slightly
important
3 Important
4 Highly
important
5 Critically
important
N/A
13. Uniformity of systems within
the company
14. Uniformity of systems among
the organizations
15. Information sharing capability
within the company
16. Information sharing capability
among the organizations
17. Trust within the company
18. Trust among the organizations
19. Coverage of organizations in
strategic alliance
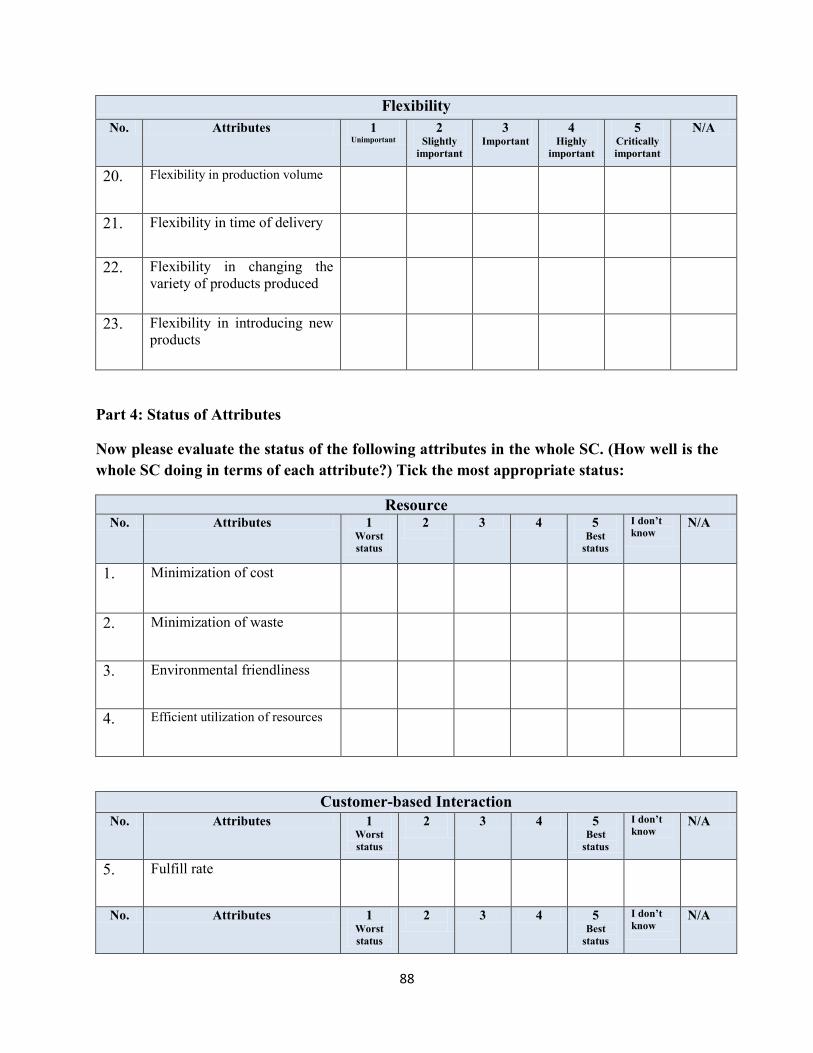
88
Flexibility
No. Attributes 1 Unimportant
2 Slightly
important
3 Important
4 Highly
important
5 Critically
important
N/A
20. Flexibility in production volume
21. Flexibility in time of delivery
22. Flexibility in changing the
variety of products produced
23. Flexibility in introducing new
products
Part 4: Status of Attributes
Now please evaluate the status of the following attributes in the whole SC. (How well is the
whole SC doing in terms of each attribute?) Tick the most appropriate status:
Resource No. Attributes 1
Worst
status
2
3 4 5 Best
status
I don’t
know
N/A
1. Minimization of cost
2. Minimization of waste
3. Environmental friendliness
4. Efficient utilization of resources
Customer-based Interaction
No. Attributes 1 Worst
status
2
3 4 5 Best
status
I don’t
know
N/A
5. Fulfill rate
No. Attributes 1 Worst
status
2
3 4 5 Best
status
I don’t
know
N/A
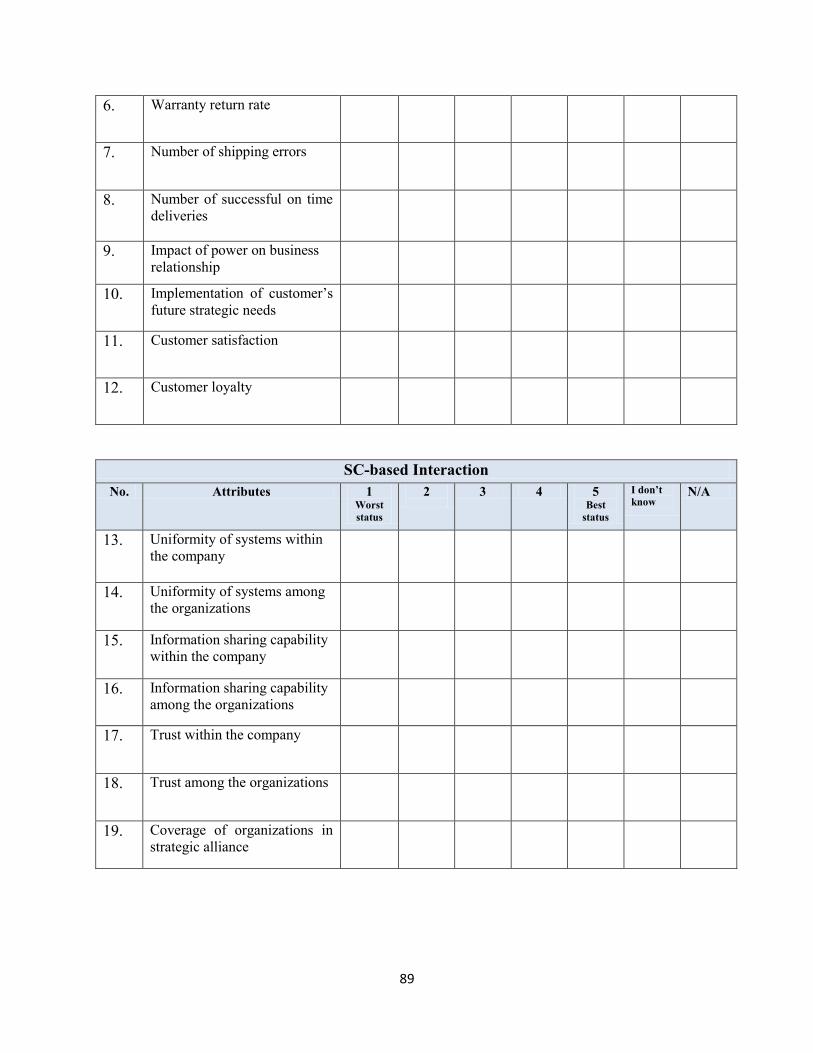
89
6. Warranty return rate
7. Number of shipping errors
8. Number of successful on time
deliveries
9. Impact of power on business
relationship
10. Implementation of customer’s
future strategic needs
11. Customer satisfaction
12. Customer loyalty
SC-based Interaction
No. Attributes 1 Worst
status
2
3 4 5 Best
status
I don’t
know
N/A
13. Uniformity of systems within
the company
14. Uniformity of systems among
the organizations
15. Information sharing capability
within the company
16. Information sharing capability
among the organizations
17. Trust within the company
18. Trust among the organizations
19. Coverage of organizations in
strategic alliance
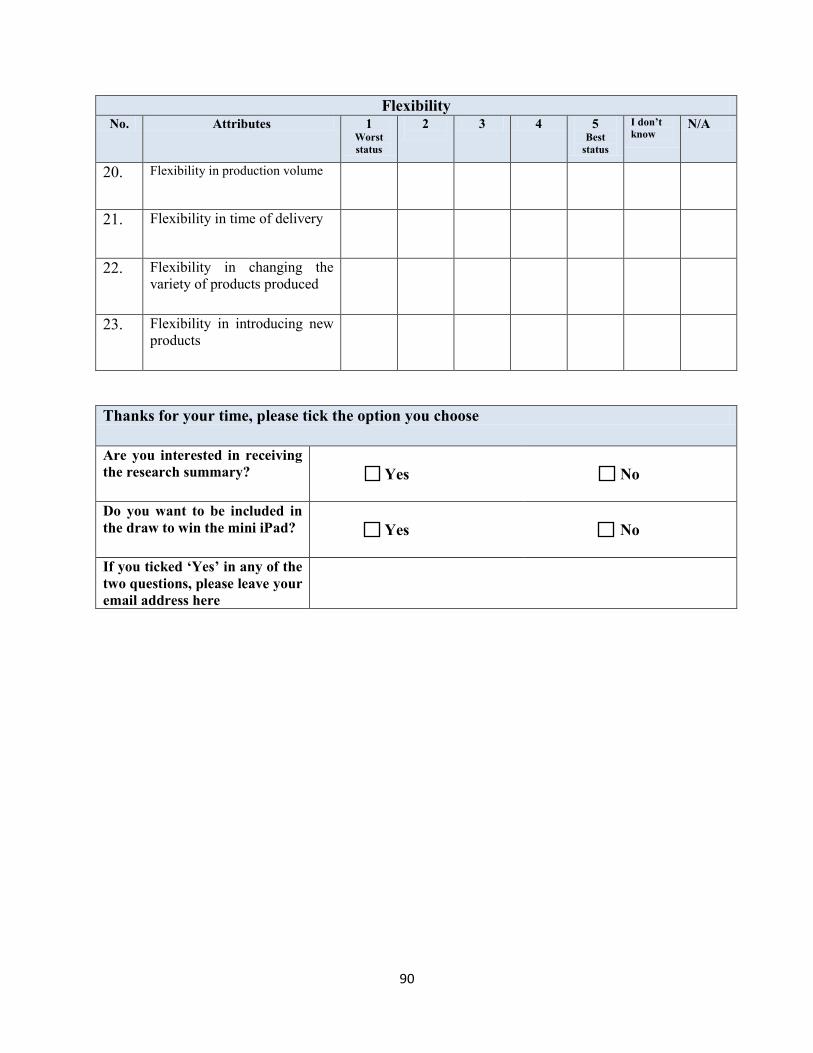
90
Flexibility No. Attributes 1
Worst
status
2
3 4 5 Best
status
I don’t
know
N/A
20. Flexibility in production volume
21. Flexibility in time of delivery
22. Flexibility in changing the
variety of products produced
23. Flexibility in introducing new
products
Thanks for your time, please tick the option you choose
Are you interested in receiving
the research summary?
Yes
No
Do you want to be included in
the draw to win the mini iPad?
Yes
No
If you ticked ‘Yes’ in any of the
two questions, please leave your
email address here