performance measurement and analysis. 2 objectives understand the ways in which computer performance...
TRANSCRIPT

Performance Measurement and
Analysis

2
Objectives
• Understand the ways in which computer
performance is measured.
• Be able to describe common benchmarks and their
limitations.
• Become familiar with factors that contribute to
improvements in CPU and disk performance.

3
10.1 Introduction
• The ideas presented in this chapter will help you to understand various measurements of computer performance.
• You will be able to use these ideas when you are purchasing a large system, or trying to improve the performance of an existing system.
• We will discuss a number of factors that affect system performance, including some tips that you can use to improve the performance of programs.

4
The Basic Computer Performance Equation
• The basic computer performance equation has been useful in our discussions of RISC versus CISC:
• To achieve better performance, RISC machines reduce the number of cycles per instruction, and CISC machines reduce the number of instructions per program.

5
The Basic Computer Performance Equation
• We have also learned that CPU efficiency is not the sole factor in overall system performance. Memory and I/O performance are also important.
• Amdahl’s Law tells us that the system performance gain realized from the speedup of one component depends not only on the speedup of the component itself, but also on the fraction of work done by the component:

6
The Basic Computer Performance Equation
• In short, Amdahl’s Law tells us to make the common case fast.
• So if our system is CPU bound, we want to make the CPU faster.
• A memory bound system calls for improvements in memory management.
• The performance of an I/O bound system will improve with an upgrade to the I/O system.Of course, fixing a performance problem in one part of the system can expose a weakness in another part of the system!

7
Mathematical Preliminaries
• Measures of system performance depend upon one’s point of view.– A computer user is most often concerned with response
time: How long does it take the system to carry out a task?
– System administrators are usually more concerned with throughput: How many concurrent tasks can the system handle before response time is adversely affected?
• These two ideas are related: If a system carries out a task in k seconds, then its throughput is 1/k of these tasks per second.

8
Mathematical Preliminaries
• In comparing the performance of two systems, we measure the time that it takes for each system to do the same amount of work.
• Specifically, if System A and System B run the same program, System A is n times as fast as System B if:
• System A is x% faster than System B if:
9
Mathematical Preliminaries
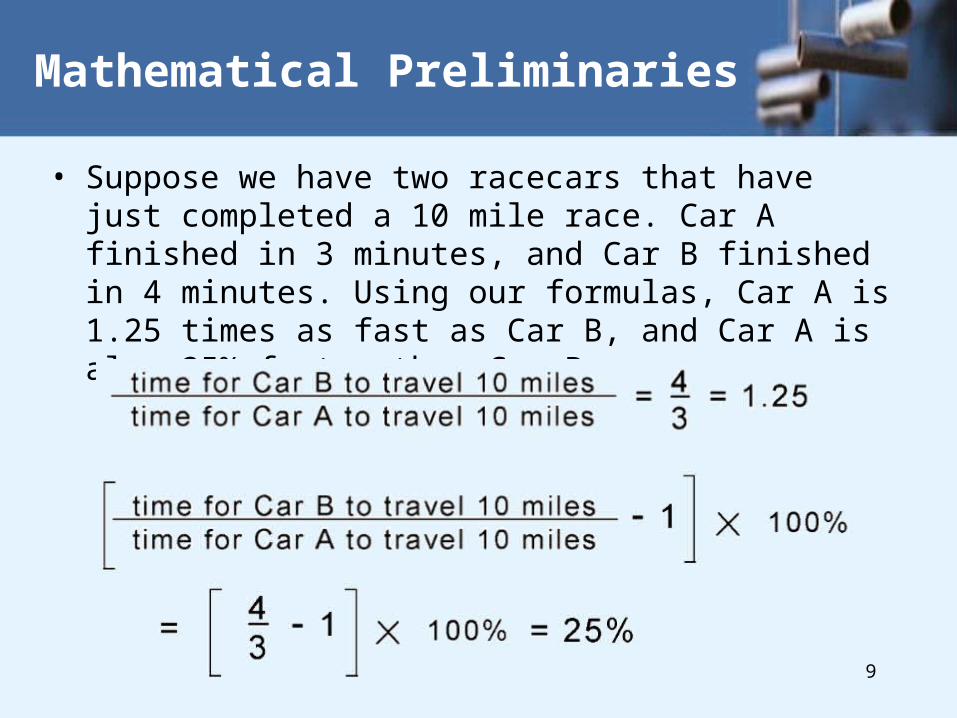
• Suppose we have two racecars that have just completed a 10 mile race. Car A finished in 3 minutes, and Car B finished in 4 minutes. Using our formulas, Car A is 1.25 times as fast as Car B, and Car A is also 25% faster than Car B:

10
Mathematical Preliminaries
• When we are evaluating system performance we are most interested in its expected performance under a given workload.
• We use statistical tools that are measures of central tendency.
• The one with which everyone is most familiar is the arithmetic mean (or average), given by:

11
Mathematical Preliminaries
• The arithmetic mean can be misleading if the data are skewed or scattered.– Consider the execution times given in the table below. The
performance differences are hidden by the simple average.

12
Mathematical Preliminaries
• If execution frequencies (expected workloads) are known, a weighted average can be revealing.– The weighted average for System A is: 50 0.5 + 200 0.3 + 250 0.1 + 400 0.05 + 5000 0.05 =
380.

13
Mathematical Preliminaries
• However, workloads can change over time.– A system optimized for one workload may perform poorly
when the workload changes, as illustrated below.

14
Mathematical Preliminaries
• When comparing the relative performance of two or more systems, the geometric mean is the preferred measure of central tendency.
– It is the nth root of the product of n measurements.
• Unlike the arithmetic means, the geometric mean does not give us a real expectation of system performance. It serves only as a tool for comparison.

15
Mathematical Preliminaries
• The geometric mean is often uses normalized ratios between a system under test and a reference machine.– We have performed the calculation in the table below.
16
Mathematical Preliminaries
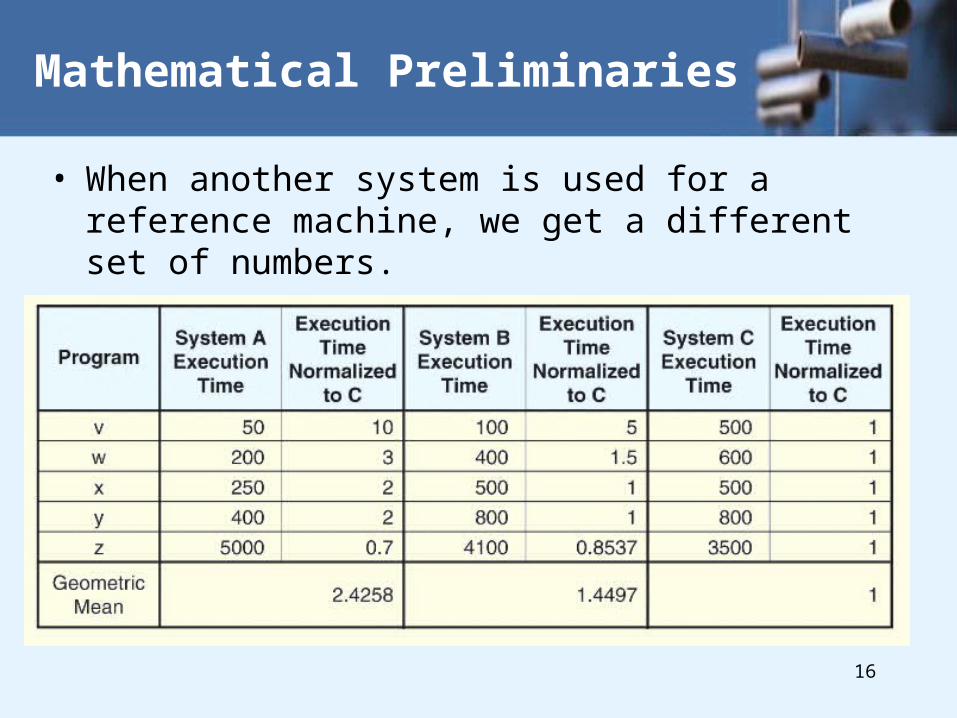
• When another system is used for a reference machine, we get a different set of numbers.

17
Mathematical Preliminaries
• The real usefulness of the normalized geometric mean is that no matter which system us used as a reference, the ratio of the geometric means is consistent.
• This is to say that the ratio of the geometric means for System A to System B, System B to System C, and System A to System C is the same no matter which machine is the reference machine.

18
Mathematical Preliminaries
• The results that we got when using System B and System C as reference machines are given below.
• We find that 1.6733/1 = 2.4258/1.4497.

19
Mathematical Preliminaries
• The inherent problem with using the geometric mean to demonstrate machine performance is that all execution times contribute equally to the result.
• So shortening the execution time of a small program by 10% has the same effect as shortening the execution time of a large program by 10%.– Shorter programs are generally easier to optimize, but in the
real world, we want to shorten the execution time of longer programs.
• Also, if the geometric mean is not proportionate. A system giving a geometric mean 50% smaller than another is not necessarily twice as fast!

20
Mathematical Preliminaries
• The harmonic mean provides us with the means to compare execution times that are expressed as a rate.
• The harmonic mean allows us to form a mathematical expectation of throughput, and to compare the relative throughput of systems and system components.
• To find the harmonic mean, we add the reciprocals of the rates and divide them into the number of rates:
H = n (1/x1+1/x2+1/x3+ . . . + 1/xn)

21
Mathematical Preliminaries
• The harmonic mean holds two advantages over the geometric mean.
• First, it is a suitable predictor of machine behavior.– So it is useful for more than simply comparing performance.
• Second, the slowest rates have the greater influence on the result, so improving the slowest performance-- usually what we want to do-- results in better performance.
• The main disadvantage is that the geometric mean is sensitive to the choice of a reference machine.

22
Mathematical Preliminaries
• The chart below summarizes when the use of each of the performance means is appropriate.

23
Mathematical Preliminaries
• The objective assessment of computer performance is most critical when deciding which one to buy.– For enterprise-level systems, this process is complicated, and
the consequences of a bad decision are grave.
• Unfortunately, computer sales are as much dependent on good marketing as on good performance.
• The wary buyer will understand how objective performance data can be slanted to the advantage of anyone giving a sales pitch.

24
Mathematical Preliminaries
• The most common deceptive practices include:– Selective statistics: Citing only favorable results while omitting others.
– Citing only peak performance numbers while ignoring the average case.
– Vagueness in the use of words like “almost,” “nearly,” “more,” and “less,” in comparing performance data.
– The use of inappropriate statistics or “comparing apples to oranges.”
– Implying that you should buy a particular system because “everyone” is buying similar systems.
Many examples can be found in business and trade journal ads.

25
Benchmarking
• Performance benchmarking is the science of making objective assessments concerning the performance of one system over another.
• Price-performance ratios can be derived from standard benchmarks.
• The troublesome issue is that there is no definitive benchmark that can tell you which system will run your applications the fastest (using the least wall clock time) for the least amount of money.

26
Benchmarking
• Many people erroneously equate CPU speed with performance.
• Measures of CPU speed include cycle time (MHz, and GHz) and millions of instructions per second (MIPS).
• Saying that System A is faster than System B because System A runs at 1.4GHz and System B runs at 900MHz is valid only when the ISAs of Systems A and B are identical.– With different ISAs, it is possible that both of these
systems could obtain identical results within the same amount of wall clock time.

27
Benchmarking
• In an effort to describe performance independent of clock speed and ISAs, a number of synthetic benchmarks have been attempted over the years.
• Synthetic benchmarks are programs that serve no purpose except to produce performance numbers.
• The earliest synthetic benchmarks, Whetstone, Dhrystone, and Linpack (to name only a few) were relatively small programs that were easy to optimize.– This fact limited their usefulness from the outset.
• These programs are much too small to be useful in evaluating the performance of today’s systems.

28
Benchmarking
• In 1988 the Standard Performance Evaluation Corporation (SPEC) was formed to address the need for objective benchmarks.
• SPEC produces benchmark suites for various classes of computers and computer applications.
• Their most widely known benchmark suite is the SPEC CPU benchmark.
• The SPEC2000 benchmark consists of two parts, CINT2000, which measures integer arithmetic operations, and CFP2000, which measures floating-point processing.

29
Benchmarking
• The SPEC benchmarks consist of a collection of kernel programs.
• These are programs that carry out the core processes involved in solving a particular problem. – Activities that do not contribute to solving the problem, such as I/O
are removed.
• CINT2000 consists of 12 applications (11 written in C and one in C++); CFP2000 consists of 14 applications (6 FORTRAN 77, 4 FORTRAN 90, and 4 C).
A list of these programs can be found in Table 10.7 on Pages 467 - 468.

30
Benchmarking
• On most systems, more than two 24 hour days are required to run the SPEC CPU2000 benchmark suite.
• Upon completion, the execution time for each kernel (as reported by the benchmark suite) is divided by the run time for the same kernel on a Sun Ultra 10.
• The final result is the geometric mean of all of the run times.
• Manufacturers may report two sets of numbers: The peak and base numbers are the results with and without compiler optimization flags, respectively.

31
Benchmarking
• The SPEC CPU benchmark evaluates only CPU performance.
• When the performance of the entire system under high transaction loads is a greater concern, the Transaction Performance Council (TPC) benchmarks are more suitable.
• The current version of this suite is the TPC-C benchmark.
• TPC-C models the transactions typical of a warehousing business using terminal emulation software.

32
Benchmarking
• The TPC-C metric is the number of new warehouse order transactions per minute (tpmC), while a mix of other transactions is concurrently running on the system.
• The tpmC result is divided by the total cost of the configuration tested to give a price-performance ratio.
• The price of the system includes all hardware, software, and maintenance fees that the customer would expect to pay.

33
Benchmarking
• The Transaction Performance Council has also devised benchmarks for decision support systems (used for applications such as data mining) and for Web-based e-commerce systems.
• For all of its benchmarks, the systems tested must be available for general sale at the time of the test and at the prices cited in a full disclosure report.
• Results of the tests are audited by an independent auditing firm that has been certified by the TPC.

34
Benchmarking
• TPC benchmarks are a kind of simulation tool.
• They can be used to optimize system performance under varying conditions that occur rarely under normal conditions.
• Other kinds of simulation tools can be devised to assess performance of an existing system, or to model the performance of systems that do not yet exist.
• One of the greatest challenges in creation of a system simulation tool is in coming up with a realistic workload.

35
Benchmarking
• To determine the workload for a particular system component, system traces are sometimes used.
• Traces are gathered by using hardware or software probes that collect detailed information concerning the activity of a component of interest.
• Because of the enormous amount of detailed information collected by probes, they are usually engaged for a few seconds.
• Several trace runs may be required to obtain statistically useful system information.
36
Benchmarking
• Devising a good simulator requires that one keep a clear focus as to the purpose of the simulator
• A model that is too detailed is costly and time-consuming to write.
• Conversely, it is of little use to create a simulator that is so simplistic that it ignores important details of the system being modeled.
• A simulator should be validated to show that it is achieving the goal that it set out to do: A simple simulator is easier to validate than a complex one.

37
CPU Performance Optimization
• CPU optimization includes many of the topics that have been covered in preceding chapters.– CPU optimization includes topics such as pipelining,
parallel execution units, and integrated floating-point units.
• We have not yet explored two important CPU optimization topics: Branch optimization and user code optimization.
• Both of these can affect performance in dramatic ways.

38
CPU Performance Optimization
• We know that pipelines offer significant execution speedup when the pipeline is kept full.
• Conditional branch instructions are a type of pipeline hazard that can result in flushing the pipeline.– Other hazards are include resource conflicts, data dependencies, and
memory access delays.
• Delayed branching offers one way of dealing with branch hazards.
• With delayed branching, one or more instructions following a conditional branch are sent down the pipeline regardless of the outcome of the statement.

39
Time period
1 2 3 4 5 6
Add F D E
Branch F D E
Div F
Mult F D E
Delayed Branching
Add R1, R2, R3Branch LoopDiv R4, R5, R6Loop: Mult ….
The net effect is that the instruction following the branch is executed before
the branch takes effect
The compiler must perform a data dependency analysis

40
Time slots
1 2 3 4 5 6
Branch F D E
Add F D E
Mult F D E
Delayed Branching
Add R1, R2, R3Branch LoopDiv R4, R5, R6Loop: Mult ….
Reverse the execution sequence of the branch instruction and another instruction that will be executed
The compiler must perform a data dependency analysis

41
CPU Performance Optimization
• Branch prediction is another approach to minimizing branch penalties.
• Branch prediction tries to avoid pipeline stalls by guessing the next instruction in the instruction stream.– This is called speculative execution.
• Branch prediction techniques vary according to the type of branching. If/then/else, loop control, and subroutine branching all have different execution profiles.

42
Branch Prediction
There are various ways in which a prediction can be made:
• Fixed predictions do not change over time, the prediction is always the same.
• True predictions result in the branch being always taken or never taken.
• Dynamic prediction uses historical information about the branch and its outcomes in the past.
• Static prediction does not use any history.
43
Fixed Prediction
• When fixed prediction assumes that a branch is not taken, the normal sequential path of the program is taken.
• However, processing is done in parallel in case the branch occurs.
• If the prediction is correct, the preprocessing information is deleted.
• If the prediction is incorrect, the speculative processing is deleted and the preprocessing information is used to continue on the correct path.

44
Fixed Prediction
• When fixed prediction assumes that a branch is always taken, state information is saved before the speculative processing begins.
• If the prediction is correct, the saved information is deleted.
• If the prediction is incorrect, the speculative processing is deleted and the saved information is restored allowing execution to continue on the correct path.

45
Dynamic Prediction
• Dynamic prediction employs a high-speed branch prediction buffer to combine an instruction with its history.
• The buffer is indexed by the lower portion of the address of the branch instruction that also contains extra bits indicating whether the branch was recently taken.
– One-bit dynamic prediction uses a single bit to indicate whether the last occurrence of the branch was taken.
– Two-bit branch prediction retains the history of the previous to occurrences of the branch along with a probability of the branch being taken.

46
Branch Prediction
• The earliest branch prediction implementations used static branch prediction.
• Most newer processors (including the Pentium, PowerPC, UltraSparc, and Motorola 68060) use two-bit dynamic branch prediction.
• Some superscalar architectures include branch prediction as a user option.
• Many systems implement branch prediction in specialized circuits for maximum throughput.

47
CPU Performance Optimization
• The best hardware and compilers will never equal the abilities of a human being who has mastered the science of effective algorithm and coding design.
• People can see an algorithm in the context of the machine it will run on.
• We end this section by offering some tips to help you achieve optimal program performance.

48
CPU Performance Optimization
• Operation counting can enhance program performance.
• With this method, you count the number of instruction types executed in a loop then determine the number of machine cycles for each instruction.
• The idea is to provide the best mix of instruction types for a particular architecture.
• Nested loops provide a number of interesting optimization opportunities.

49
CPU Performance Optimization
• Loop unrolling is the process of expanding a loop so that each new iteration contains several of the original operations, thus performing more computations per loop iteration. For example:
becomes
for (i = 1; i <= 30; i+=3) { a[i] = a[i] + b[i] * c; a[i+1] = a[i+1] + b[i+1] * c; a[i+2] = a[i+2] + b[i+2] * c; }
for (i = 1; i <= 30; i++)a[i] = a[i] + b[i] * c;
Less data dependencies
50
CPU Performance Optimization
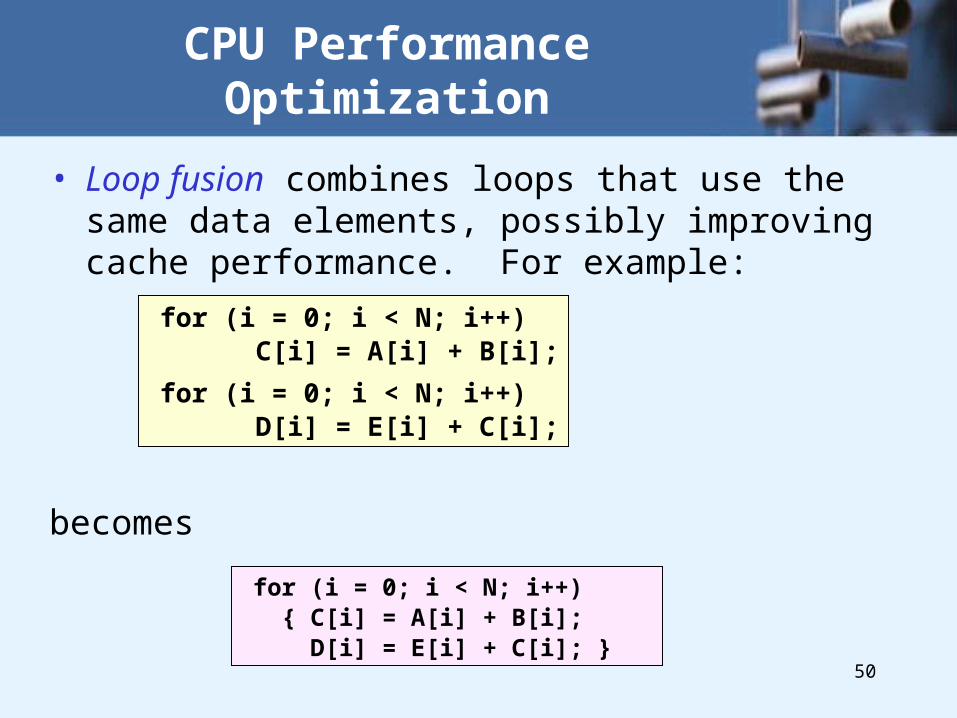
• Loop fusion combines loops that use the same data elements, possibly improving cache performance. For example:
becomes
for (i = 0; i < N; i++)C[i] = A[i] + B[i];
for (i = 0; i < N; i++)D[i] = E[i] + C[i];
for (i = 0; i < N; i++) { C[i] = A[i] + B[i]; D[i] = E[i] + C[i]; }

51
CPU Performance Optimization
• Loop fission splits large loops into smaller ones to reduce data dependencies and resource conflicts.
• A loop fission technique known as loop peeling removes the beginning and ending loop statements. For example:
A[1] = 0;for (i = 2; i < N; i++) A[i] = A[i] + 8;A[N] = N;
for (i = 1; i < N+1; i++){ if (i==1)
A[i] = 0;else if (i == N)
A[i] = N;else A[i] = A[i] +
8; }
becomes

52
CPU Performance Optimization
• The text lists a number of rules of thumb for getting the most out of program performance.
• Optimization efforts pay the biggest dividends when they are applied to code segments that are executed the most frequently.
• In short, try to make the common cases fast.

53
• Loop interchange, the process of rearranging loops so that memory is accessed more closely to the way in which the data is stored– In most language, loops are stored in a row-major order,
accessing data in a row-major versus column-major order
• Loop optimization– Tool for improving program performance– Exemplifies how you can use your knowledge of
computer organization and architecture to write superior programs

54
Exercises
• Table 1 shows an execution mix and run times for the two computer, System A and System C. In this example System C is 83% faster than system A. Table 2 shows run times for System A with a different Execution mix. Using the execution mix in Table 2, calculate the percentage by which System C would be faster than System A. Using the original statistics from Table , by how much the performance of System A degraded under the new execution mix?

55
• Computer performance assessment relies upon measures of central tendency that include the arithmetic mean, weighted arithmetic mean, the geometric mean, and the harmonic mean.
• Each of these is applicable under different circumstances.
• Benchmark suites have been designed to provide objective performance assessment. The most well respected of these are the SPEC and TPC benchmarks.
Conclusion

56
• CPU performance depends upon many factors.
• These include pipelining, parallel execution units, integrated floating-point units, and effective branch prediction.
• User code optimization affords the greatest opportunity for performance improvement.
• Code optimization methods include loop manipulation and good algorithm design.
Conclusion