small business endpoint protection performance benchmarks protection 2011... · small business...
TRANSCRIPT
Small Business Endpoint Protection
Performance Benchmarks
Windows 7
September 2010
Document: Small Business Endpoint Protection Performance Benchmarks Authors: K. Lai, D. Wren, T. Rowling Company: PassMark Software Date: 5 October 2010 Report: 1
Endpoint Protection Small Business PassMark Software
Performance Benchmark Page 2 of 23 Report 1 12 October 2010
Executive Summary PassMark Software® conducted objective performance testing on five, publically available small business
endpoint protection security software products on Windows 7 Ultimate Edition in September 2010.
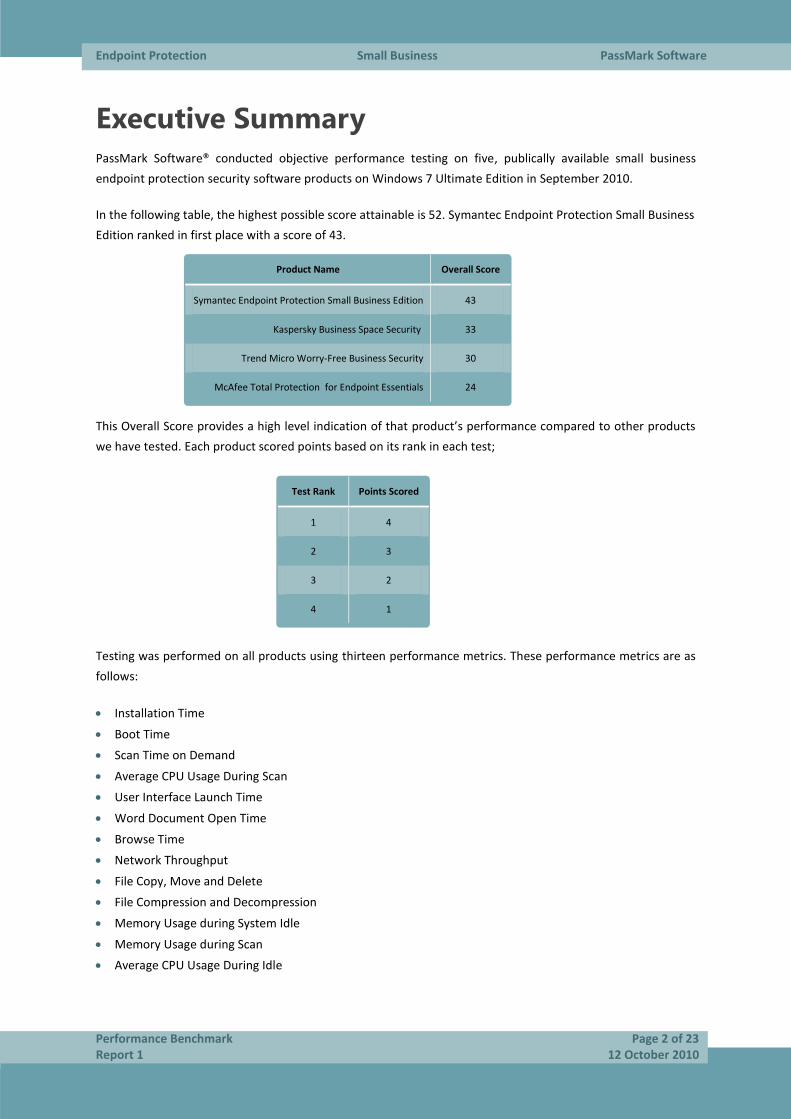
In the following table, the highest possible score attainable is 52. Symantec Endpoint Protection Small Business
Edition ranked in first place with a score of 43.
Product Name Overall Score
Symantec Endpoint Protection Small Business Edition 43
Kaspersky Business Space Security 33
Trend Micro Worry-Free Business Security 30
McAfee Total Protection for Endpoint Essentials 24
This Overall Score provides a high level indication of that product’s performance compared to other products
we have tested. Each product scored points based on its rank in each test;
Testing was performed on all products using thirteen performance metrics. These performance metrics are as
follows:
Installation Time
Boot Time
Scan Time on Demand
Average CPU Usage During Scan
User Interface Launch Time
Word Document Open Time
Browse Time
Network Throughput
File Copy, Move and Delete
File Compression and Decompression
Memory Usage during System Idle
Memory Usage during Scan
Average CPU Usage During Idle
Test Rank Points Scored
1 4
2 3
3 2
4 1
Endpoint Protection Small Business PassMark Software
Performance Benchmark Page 3 of 23 Report 1 12 October 2010
Table of Contents
EXECUTIVE SUMMARY ...................................................................................................................................... 2
TABLE OF CONTENTS ......................................................................................................................................... 3
REVISION HISTORY ............................................................................................................................................ 4
PRODUCTS AND VERSIONS ............................................................................................................................... 5
PERFORMANCE METRICS SUMMARY ................................................................................................................ 6
TEST RESULTS ................................................................................................................................................... 9
BENCHMARK 1 – INSTALLATION TIME (SECONDS) .......................................................................................................... 9
BENCHMARK 2 – BOOT TIME (SECONDS) ..................................................................................................................... 9
BENCHMARK 3 – SCAN TIME ON DEMAND (SECONDS) .................................................................................................. 10
BENCHMARK 4 –CPU USAGE DURING SCAN (PERCENT) ................................................................................................ 10
BENCHMARK 5 – USER INTERFACE LAUNCH TIME (MILLISECONDS) .................................................................................. 11
BENCHMARK 6 – WORD DOCUMENT LAUNCH TIME (MILLISECONDS) .............................................................................. 11
BENCHMARK 7 – BROWSE TIME (SECONDS) ................................................................................................................ 12
BENCHMARK 8 – NETWORK THROUGHPUT (SECONDS) ................................................................................................. 12
BENCHMARK 9 – FILE COPY, MOVE AND DELETE (SECONDS) .......................................................................................... 13
BENCHMARK 10 – FILE COMPRESSION AND DECOMPRESSION (SECONDS) ......................................................................... 13
BENCHMARK 11 – MEMORY USAGE DURING SYSTEM IDLE (MEGABYTES) ......................................................................... 14
BENCHMARK 12 – MEMORY USAGE DURING SCAN (MEGABYTES) ................................................................................... 14
BENCHMARK 13 – CPU USAGE DURING IDLE (PERCENT) ............................................................................................... 15
DISCLAIMER AND DISCLOSURE ....................................................................................................................... 16
CONTACT DETAILS .......................................................................................................................................... 16
APPENDIX 1 – TEST ENVIRONMENT ................................................................................................................ 17
WINDOWS 7 (64-BIT) ENDPOINT SYSTEM ................................................................................................................. 17
WEB AND FILE SERVER............................................................................................................................................ 17
ACTIVE DIRECTORY SERVER ...................................................................................................................................... 17
AV MANAGEMENT CONSOLE SERVER ........................................................................................................................ 17
APPENDIX 2 – METHODOLOGY DESCRIPTION ................................................................................................. 18
Endpoint Protection Small Business PassMark Software
Performance Benchmark Page 4 of 23 Report 1 12 October 2010
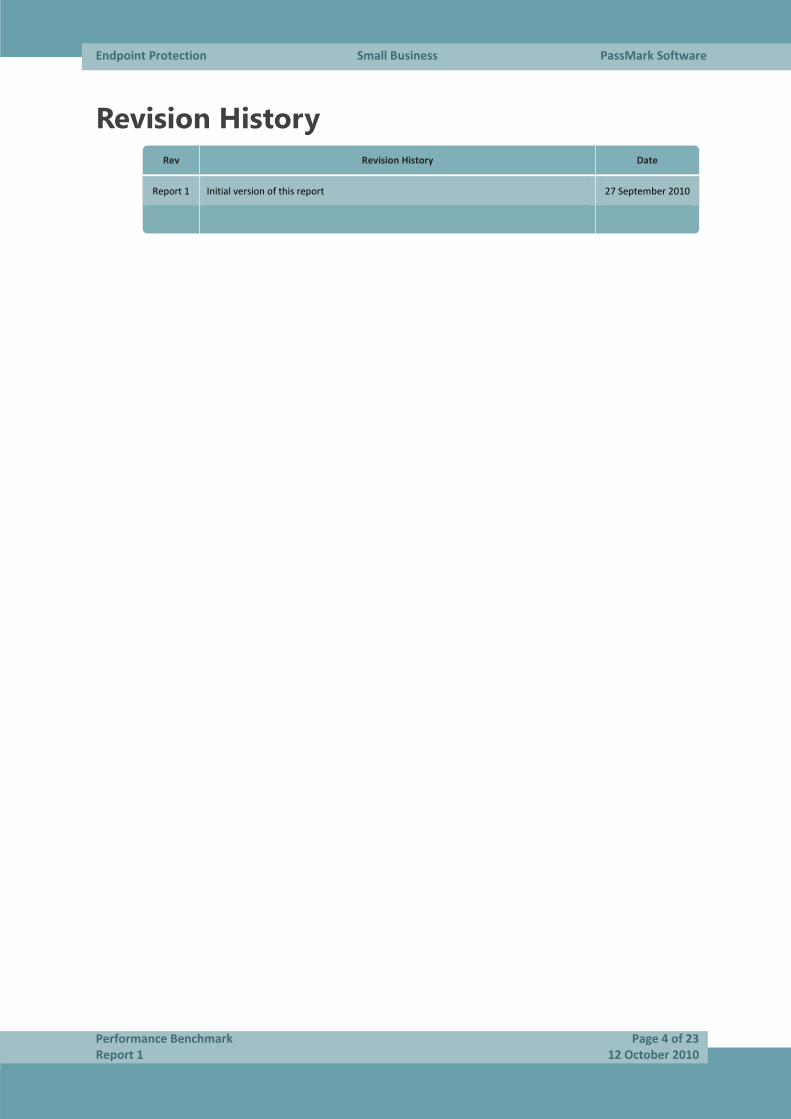
Revision History
Rev Revision History Date
Report 1 Initial version of this report 27 September 2010
Endpoint Protection Small Business PassMark Software
Performance Benchmark Page 5 of 23 Report 1 12 October 2010
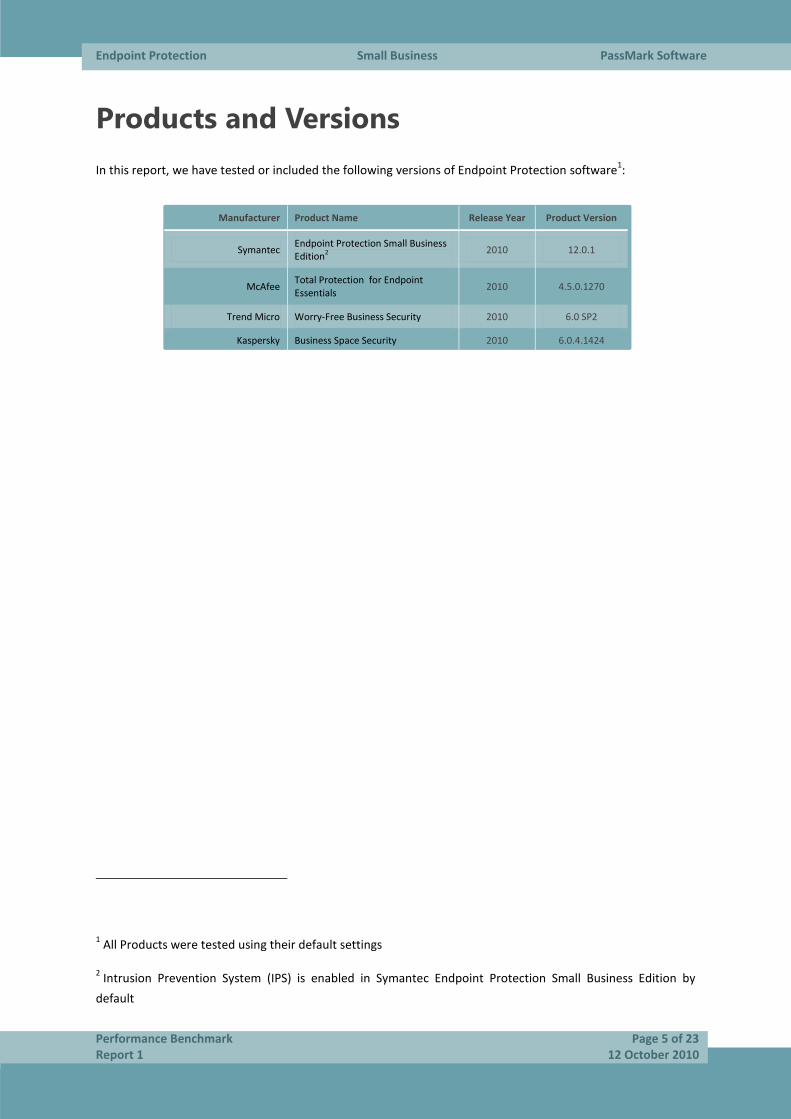
Products and Versions
In this report, we have tested or included the following versions of Endpoint Protection software1:
Manufacturer Product Name Release Year Product Version
Symantec Endpoint Protection Small Business Edition2
2010 12.0.1
McAfee Total Protection for Endpoint Essentials
2010 4.5.0.1270
Trend Micro Worry-Free Business Security 2010 6.0 SP2
Kaspersky Business Space Security 2010 6.0.4.1424
1 All Products were tested using their default settings
2 Intrusion Prevention System (IPS) is enabled in Symantec Endpoint Protection Small Business Edition by
default
Endpoint Protection Small Business PassMark Software
Performance Benchmark Page 6 of 23 Report 1 12 October 2010
Performance Metrics Summary
We have selected a set of objective metrics which provide a comprehensive and realistic indication of the
areas in which endpoint protection products may impact system performance for end users. Our metrics test
the impact of the software on common tasks that end-users would perform on a daily basis.
All of PassMark Software’s test methods can be replicated by third parties using the same environment to
obtain similar benchmark results. Detailed descriptions of the methodologies used in our tests are available as
“Appendix 2 – Methodology Description” of this report.
Benchmark 1 – Installation Time
This test measures the minimum installation time required by the endpoint protection software to be fully
functional and ready for use by the end user. Lower installation times represent products which are quicker for
a user to install.
Benchmark 2 – Boot Time
This metric measures the amount of time taken for the machine to boot into the operating system. Security
software is generally launched at Windows startup, adding an additional amount of time and delaying the
startup of the operating system. Shorter boot times indicate that the application has had less impact on the
normal operation of the machine.
Benchmark 3 – Scan Time on Demand
All endpoint protection solutions have functionality designed to detect viruses and various other forms of
malware by scanning files on the system. This metric measured the amount of time required to scan a set of
clean files. Our sample file set comprised a total file size of 5.42 GB and was made up of files that would
typically be found on end-user machines, such as media files, system files and Microsoft Office documents.
Benchmark 4 – Average CPU Usage during Scan
This metric measures the amount of CPU used when performing a scan.
Benchmark 5 – User Interface Launch Time
This metric provides an objective indication as to how responsive a security product appears to the user, by
measuring the amount of time it takes for the user interface of the endpoint protection software to launch
from Windows. To allow for caching effects by the operating system, both the initial launch time and the
subsequent launch times were measured. Our final result is an average of these two measurements.
Benchmark 6 – Word Document Open Time
The average launch time of Word interface was taken using AppTimer. This includes the time to launch the
Word 2007 application and open a 10MB document. This test was practically identical to the User Interface
launch time test. For each product tested, we obtained a total of fifteen samples from five sets of three Word
launches, with a reboot before each set to clear caching effects by the operating system. When compiling the
Endpoint Protection Small Business PassMark Software
Performance Benchmark Page 7 of 23 Report 1 12 October 2010
results the first of each set was separated out so that there was a set of values for the initial launch after
reboot and a set for subsequent launches.
We have averaged the subsequent launch times to obtain an average subsequent launch time. Our final result
for this test is an average of the subsequent launch average and the initial launch time.
Benchmark 7 – Browse Time
It is common behavior for security products to scan data for malware as it is downloaded from the internet or
intranet. This behavior may negatively impact browsing speed as products scan web content for malware. This
metric measures the time taken to browse a set of popular internet sites to consecutively load from a local
server in a user’s browser window.
Benchmark 8 - Network Throughput
The metric measures the amount of time taken to download a variety of files from a local server using the
Hypertext Transfer Protocol (HTTP), which is the main protocol used on the web for browsing, linking and data
transfer. Files used in this test include file formats that users would typically download from the web, such as
images, archives, music files and movie files.
Benchmark 9 – File Copy, Move and Delete
This metric measures the amount of time taken to move, copy and delete a sample set of files. The sample file
set contains several types of file formats that a Windows user would encounter in daily use. These formats
include documents (e.g. Microsoft Office documents, Adobe PDF, Zip files, etc), media formats (e.g. images,
movies and music) and system files (e.g. executables, libraries, etc).
Benchmark 10 – File Compression and Decompression
This metric measures the amount of time taken to compress and decompress different types of files. Files
formats used in this test included documents, movies and images.
Benchmark 11 – Memory Usage during System Idle
This metric measures the amount of memory (RAM) used by the product while the machine and endpoint
protection software are in an idle state. The total memory usage was calculated by identifying all endpoint
protection software processes and the amount of memory used by each process.
The amount of memory used while the machine is idle provides a good indication of the amount of system
resources being consumed by the endpoint protection software on a permanent basis. Better performing
products occupy less memory while the machine is idle.
Benchmark 12 – Memory Usage during Scan
This metric measures the amount of memory (RAM) used by the product while the endpoint software is
performing a system scan. The total memory usage was calculated by identifying all the endpoint protection
software processes and the amount of memory used by each process.
The amount of memory used while the machine is idle provides a good indication of the amount of system
resources being consumed by the endpoint protection software during an active scan.
Endpoint Protection Small Business PassMark Software
Performance Benchmark Page 8 of 23 Report 1 12 October 2010
Benchmark 13 – Average CPU Usage during Idle
This metric measures the amount of CPU used when the system and product are idle.
Endpoint Protection Small Business PassMark Software
Performance Benchmark Page 9 of 23 Report 1 12 October 2010
Test Results
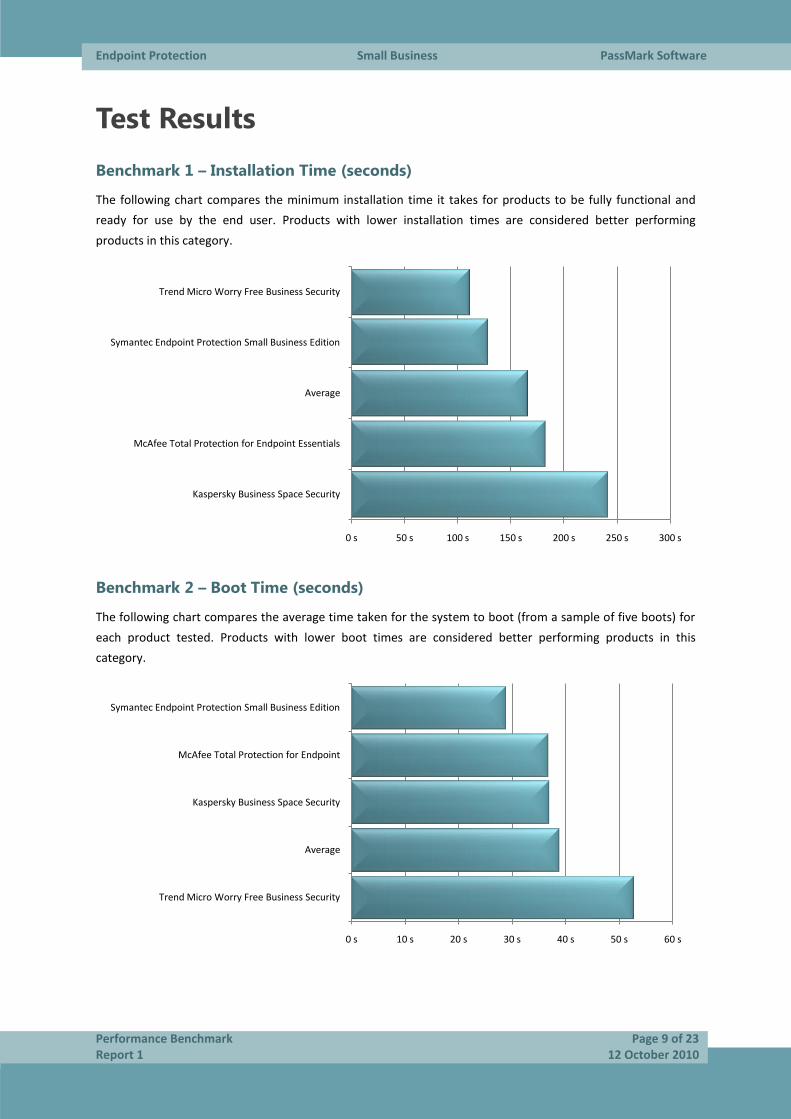
Benchmark 1 – Installation Time (seconds)
The following chart compares the minimum installation time it takes for products to be fully functional and
ready for use by the end user. Products with lower installation times are considered better performing
products in this category.
Benchmark 2 – Boot Time (seconds)
The following chart compares the average time taken for the system to boot (from a sample of five boots) for
each product tested. Products with lower boot times are considered better performing products in this
category.
0 s 50 s 100 s 150 s 200 s 250 s 300 s
Kaspersky Business Space Security
McAfee Total Protection for Endpoint Essentials
Average
Symantec Endpoint Protection Small Business Edition
Trend Micro Worry Free Business Security
0 s 10 s 20 s 30 s 40 s 50 s 60 s
Trend Micro Worry Free Business Security
Average
Kaspersky Business Space Security
McAfee Total Protection for Endpoint
Symantec Endpoint Protection Small Business Edition
Endpoint Protection Small Business PassMark Software
Performance Benchmark Page 10 of 23 Report 1 12 October 2010
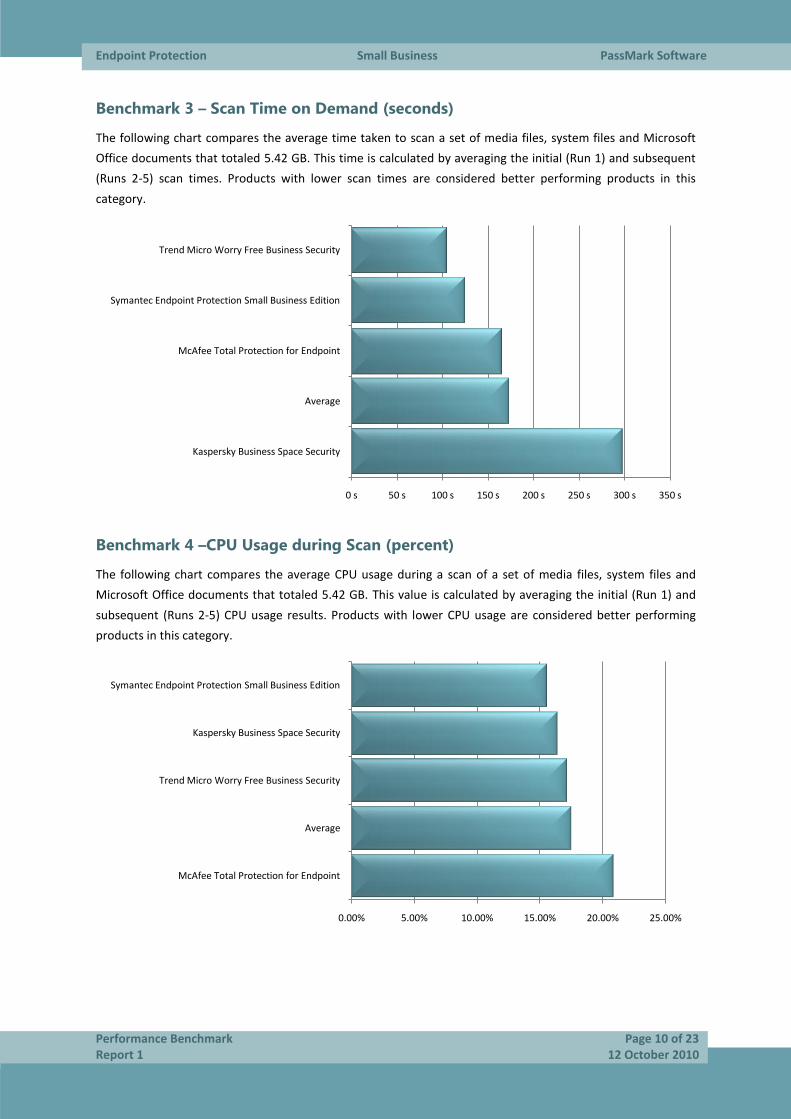
Benchmark 3 – Scan Time on Demand (seconds)
The following chart compares the average time taken to scan a set of media files, system files and Microsoft
Office documents that totaled 5.42 GB. This time is calculated by averaging the initial (Run 1) and subsequent
(Runs 2-5) scan times. Products with lower scan times are considered better performing products in this
category.
Benchmark 4 –CPU Usage during Scan (percent)
The following chart compares the average CPU usage during a scan of a set of media files, system files and
Microsoft Office documents that totaled 5.42 GB. This value is calculated by averaging the initial (Run 1) and
subsequent (Runs 2-5) CPU usage results. Products with lower CPU usage are considered better performing
products in this category.
0 s 50 s 100 s 150 s 200 s 250 s 300 s 350 s
Kaspersky Business Space Security
Average
McAfee Total Protection for Endpoint
Symantec Endpoint Protection Small Business Edition
Trend Micro Worry Free Business Security
0.00% 5.00% 10.00% 15.00% 20.00% 25.00%
McAfee Total Protection for Endpoint
Average
Trend Micro Worry Free Business Security
Kaspersky Business Space Security
Symantec Endpoint Protection Small Business Edition
Endpoint Protection Small Business PassMark Software
Performance Benchmark Page 11 of 23 Report 1 12 October 2010
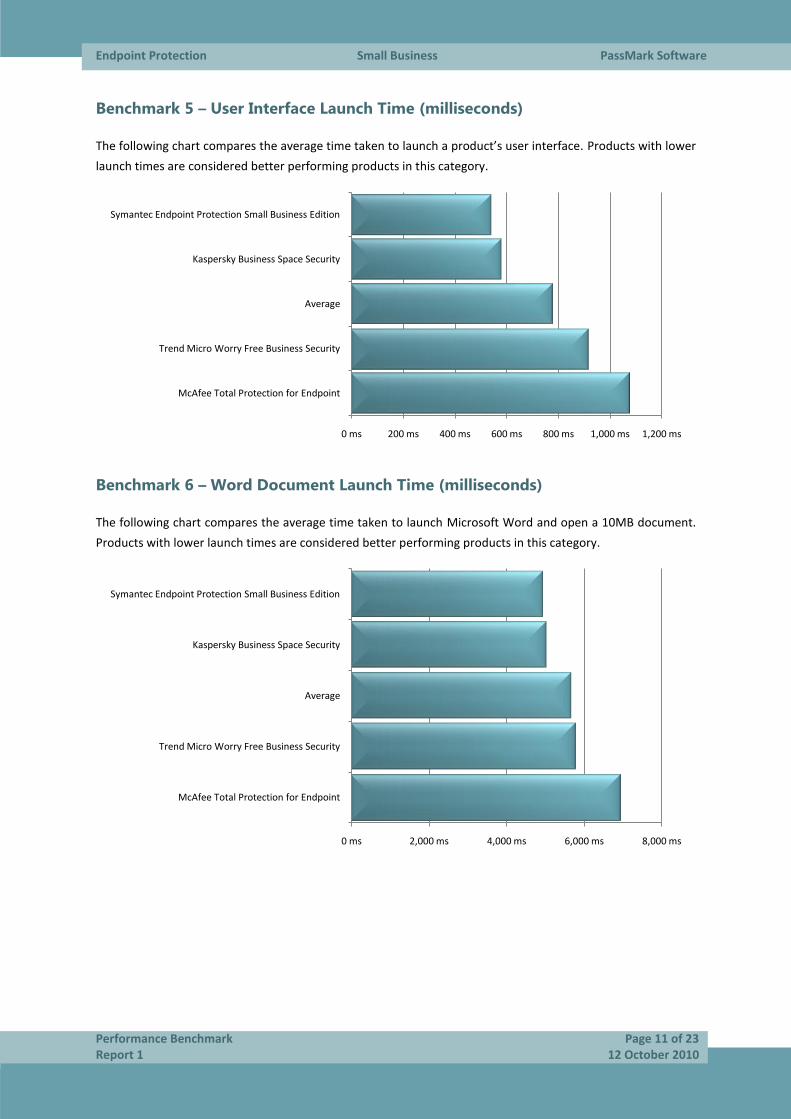
Benchmark 5 – User Interface Launch Time (milliseconds)
The following chart compares the average time taken to launch a product’s user interface. Products with lower
launch times are considered better performing products in this category.
Benchmark 6 – Word Document Launch Time (milliseconds)
The following chart compares the average time taken to launch Microsoft Word and open a 10MB document.
Products with lower launch times are considered better performing products in this category.
0 ms 200 ms 400 ms 600 ms 800 ms 1,000 ms 1,200 ms
McAfee Total Protection for Endpoint
Trend Micro Worry Free Business Security
Average
Kaspersky Business Space Security
Symantec Endpoint Protection Small Business Edition
0 ms 2,000 ms 4,000 ms 6,000 ms 8,000 ms
McAfee Total Protection for Endpoint
Trend Micro Worry Free Business Security
Average
Kaspersky Business Space Security
Symantec Endpoint Protection Small Business Edition
Endpoint Protection Small Business PassMark Software
Performance Benchmark Page 12 of 23 Report 1 12 October 2010
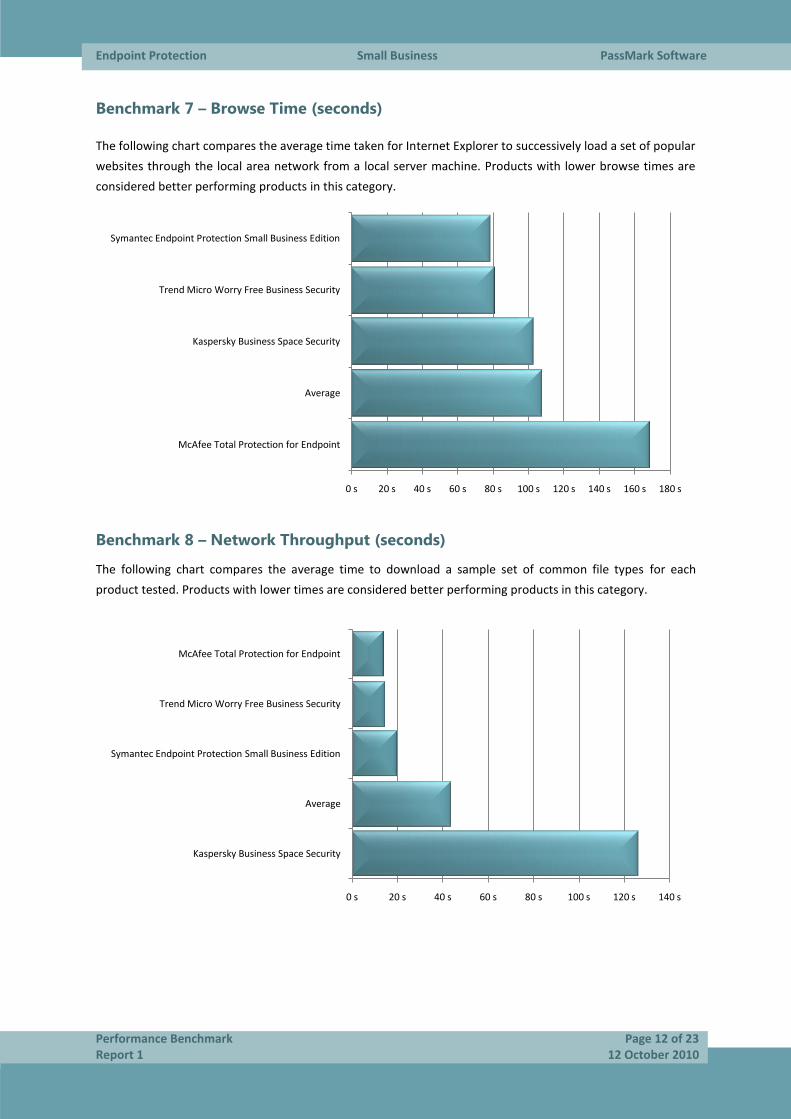
Benchmark 7 – Browse Time (seconds)
The following chart compares the average time taken for Internet Explorer to successively load a set of popular
websites through the local area network from a local server machine. Products with lower browse times are
considered better performing products in this category.
Benchmark 8 – Network Throughput (seconds)
The following chart compares the average time to download a sample set of common file types for each
product tested. Products with lower times are considered better performing products in this category.
0 s 20 s 40 s 60 s 80 s 100 s 120 s 140 s 160 s 180 s
McAfee Total Protection for Endpoint
Average
Kaspersky Business Space Security
Trend Micro Worry Free Business Security
Symantec Endpoint Protection Small Business Edition
0 s 20 s 40 s 60 s 80 s 100 s 120 s 140 s
Kaspersky Business Space Security
Average
Symantec Endpoint Protection Small Business Edition
Trend Micro Worry Free Business Security
McAfee Total Protection for Endpoint
Endpoint Protection Small Business PassMark Software
Performance Benchmark Page 13 of 23 Report 1 12 October 2010
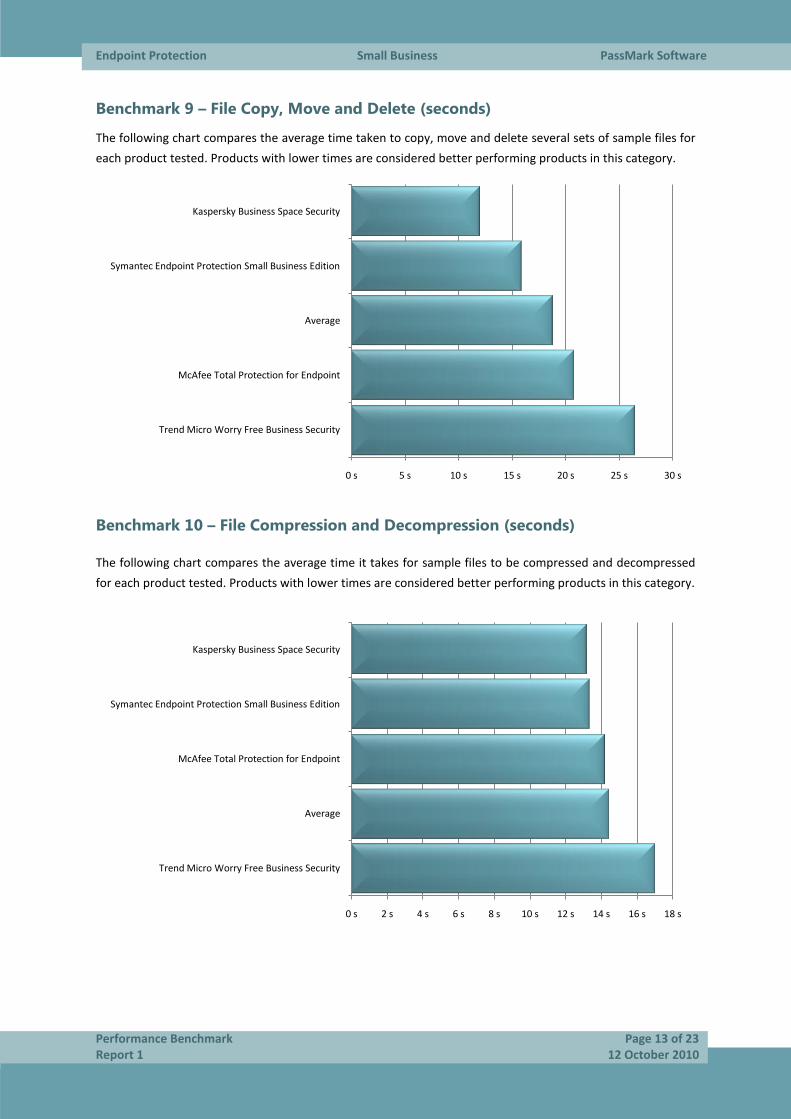
Benchmark 9 – File Copy, Move and Delete (seconds)
The following chart compares the average time taken to copy, move and delete several sets of sample files for
each product tested. Products with lower times are considered better performing products in this category.
Benchmark 10 – File Compression and Decompression (seconds)
The following chart compares the average time it takes for sample files to be compressed and decompressed
for each product tested. Products with lower times are considered better performing products in this category.
0 s 5 s 10 s 15 s 20 s 25 s 30 s
Trend Micro Worry Free Business Security
McAfee Total Protection for Endpoint
Average
Symantec Endpoint Protection Small Business Edition
Kaspersky Business Space Security
0 s 2 s 4 s 6 s 8 s 10 s 12 s 14 s 16 s 18 s
Trend Micro Worry Free Business Security
Average
McAfee Total Protection for Endpoint
Symantec Endpoint Protection Small Business Edition
Kaspersky Business Space Security
Endpoint Protection Small Business PassMark Software
Performance Benchmark Page 14 of 23 Report 1 12 October 2010
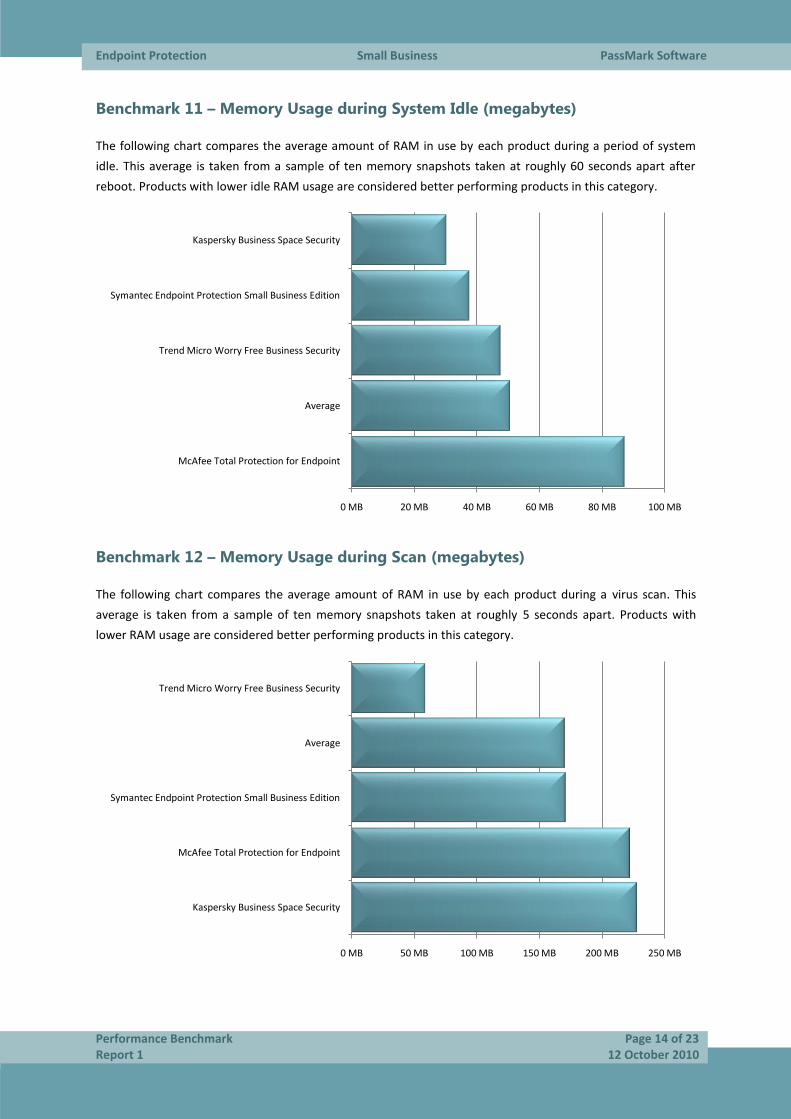
Benchmark 11 – Memory Usage during System Idle (megabytes)
The following chart compares the average amount of RAM in use by each product during a period of system
idle. This average is taken from a sample of ten memory snapshots taken at roughly 60 seconds apart after
reboot. Products with lower idle RAM usage are considered better performing products in this category.
Benchmark 12 – Memory Usage during Scan (megabytes)
The following chart compares the average amount of RAM in use by each product during a virus scan. This
average is taken from a sample of ten memory snapshots taken at roughly 5 seconds apart. Products with
lower RAM usage are considered better performing products in this category.
0 MB 20 MB 40 MB 60 MB 80 MB 100 MB
McAfee Total Protection for Endpoint
Average
Trend Micro Worry Free Business Security
Symantec Endpoint Protection Small Business Edition
Kaspersky Business Space Security
0 MB 50 MB 100 MB 150 MB 200 MB 250 MB
Kaspersky Business Space Security
McAfee Total Protection for Endpoint
Symantec Endpoint Protection Small Business Edition
Average
Trend Micro Worry Free Business Security
Endpoint Protection Small Business PassMark Software
Performance Benchmark Page 15 of 23 Report 1 12 October 2010
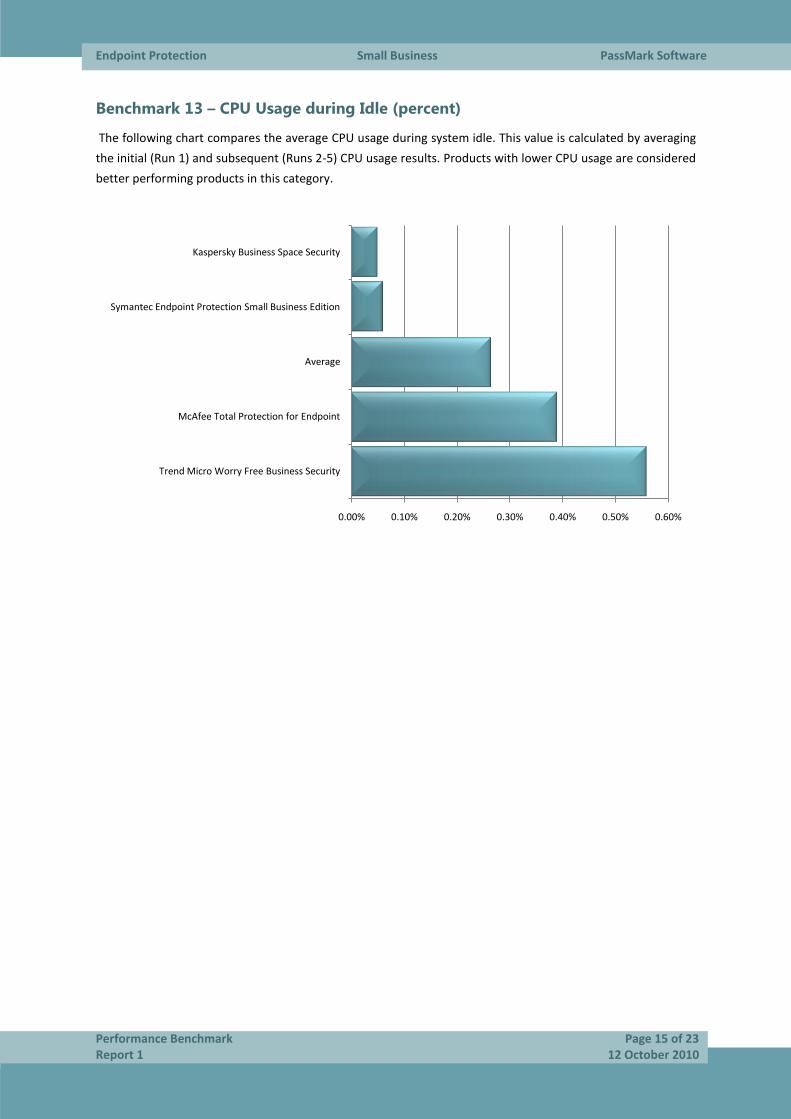
Benchmark 13 – CPU Usage during Idle (percent)
The following chart compares the average CPU usage during system idle. This value is calculated by averaging
the initial (Run 1) and subsequent (Runs 2-5) CPU usage results. Products with lower CPU usage are considered
better performing products in this category.
0.00% 0.10% 0.20% 0.30% 0.40% 0.50% 0.60%
Trend Micro Worry Free Business Security
McAfee Total Protection for Endpoint
Average
Symantec Endpoint Protection Small Business Edition
Kaspersky Business Space Security
Endpoint Protection Small Business PassMark Software
Performance Benchmark Page 16 of 23 Report 1 12 October 2010
Disclaimer and Disclosure
This report only covers versions of products that were available at the time of testing. The tested versions are
as noted in the “Products and Versions” section of this report. The products we have tested are not an
exhaustive list of all products available in these very competitive product categories.
Disclaimer of Liability
While every effort has been made to ensure that the information presented in this report is accurate,
PassMark Software Pty Ltd assumes no responsibility for errors, omissions, or out-of-date information and
shall not be liable in any manner whatsoever for direct, indirect, incidental, consequential, or punitive
damages resulting from the availability of, use of, access of, or inability to use this information.
Disclosure
Symantec Corporation funded the production of this report and supplied some of the test scripts used for the
tests.
Trademarks
All trademarks are the property of their respective owners.
Contact Details
PassMark Software Pty Ltd
Suite 202, Level 2
35 Buckingham St.
Surry Hills, 2010
Sydney, Australia
Phone + 61 (2) 9690 0444
Fax + 61 (2) 9690 0445
Web www.passmark.com
Download Location
An electronic copy of this report can be found at the following location:
http://www.passmark.com/ftp/Endpoint protection 2011 - performance testing - SMB.pdf
Endpoint Protection Small Business PassMark Software
Performance Benchmark Page 17 of 23 Report 1 12 October 2010
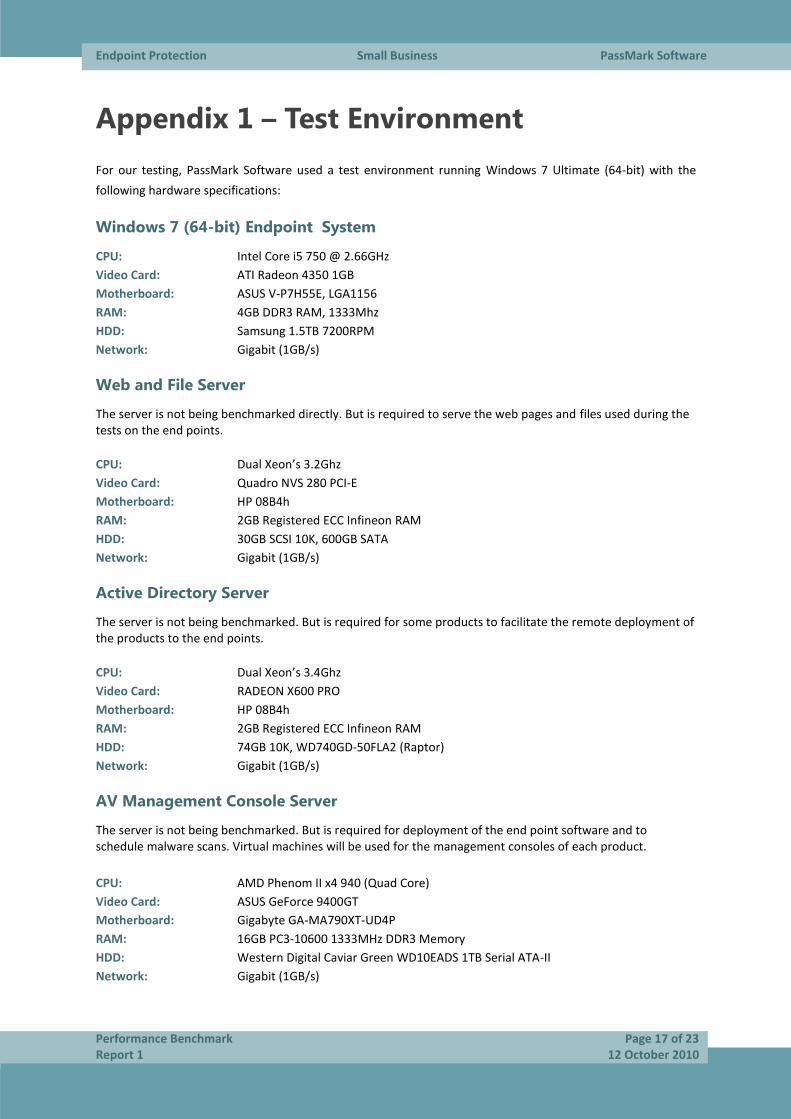
Appendix 1 – Test Environment
For our testing, PassMark Software used a test environment running Windows 7 Ultimate (64-bit) with the
following hardware specifications:
Windows 7 (64-bit) Endpoint System
CPU: Intel Core i5 750 @ 2.66GHz
Video Card: ATI Radeon 4350 1GB
Motherboard: ASUS V-P7H55E, LGA1156
RAM: 4GB DDR3 RAM, 1333Mhz
HDD: Samsung 1.5TB 7200RPM
Network: Gigabit (1GB/s)
Web and File Server
The server is not being benchmarked directly. But is required to serve the web pages and files used during the tests on the end points.
CPU: Dual Xeon’s 3.2Ghz
Video Card: Quadro NVS 280 PCI-E
Motherboard: HP 08B4h
RAM: 2GB Registered ECC Infineon RAM
HDD: 30GB SCSI 10K, 600GB SATA
Network: Gigabit (1GB/s)
Active Directory Server
The server is not being benchmarked. But is required for some products to facilitate the remote deployment of the products to the end points.
CPU: Dual Xeon’s 3.4Ghz
Video Card: RADEON X600 PRO
Motherboard: HP 08B4h
RAM: 2GB Registered ECC Infineon RAM
HDD: 74GB 10K, WD740GD-50FLA2 (Raptor)
Network: Gigabit (1GB/s)
AV Management Console Server
The server is not being benchmarked. But is required for deployment of the end point software and to schedule malware scans. Virtual machines will be used for the management consoles of each product.
CPU: AMD Phenom II x4 940 (Quad Core)
Video Card: ASUS GeForce 9400GT
Motherboard: Gigabyte GA-MA790XT-UD4P
RAM: 16GB PC3-10600 1333MHz DDR3 Memory
HDD: Western Digital Caviar Green WD10EADS 1TB Serial ATA-II
Network: Gigabit (1GB/s)

Endpoint Protection Small Business PassMark Software
Performance Benchmark Page 18 of 23 Report 1 12 October 2010
Appendix 2 – Methodology Description
Windows 7 Image Creation
As with testing on Windows Vista, Norton Ghost was used to create a “clean” baseline image prior to testing.
Our aim is to create a baseline image with the smallest possible footprint and reduce the possibility of
variation caused by external operating system factors.
The baseline image was restored prior to testing of each different product. This process ensures that we install
and test all products on the same, “clean” machine.
The steps taken to create the base Windows 7 image are as follows:
1. Installation and activation of Windows 7 Ultimate Edition.
2. Disabled Automatic Updates.
3. Changed User Account Control settings to “Never Notify”.
4. Disable Windows Defender automatic scans to avoid unexpected background activity.
5. Disable the Windows firewall to avoid interference with security software.
6. Installed Norton Ghost for imaging purposes.
7. Disabled Superfetch to ensure consistent results.
8. Installed HTTP Watch for Browse Time testing.
9. Installed Windows Performance Toolkit x64 for Boot Time testing.
10. Installed Active Perl for interpretation of some test scripts.
11. Disabled updates, accelerators and compatibility view updates in Internet Explorer 8.
12. Created a baseline image using Norton Ghost.
Benchmark 1 – Installation Time
This test measures the minimum Installation Time a product requires to be fully functional and ready for use
by the end user. Installation time can usually be divided in three major phases:
The Extraction and Setup phase consists of file extraction, the EULA prompt, product activation and user
configurable options for installation.
The File Copy phase occurs when the product is being installed; usually this phase is indicated by a progress
bar.
The Post-Installation phase is any part of the installation that occurs after the File Copy phase. This phase
varies widely between products; the time recorded in this phase may include a required reboot to finalize
the installation or include the time the program takes to become idle in the system tray.
To reduce the impact of disk drive variables, each product was copied to the Desktop before initializing
installation. Each step of the installation process was manually timed with a stopwatch and recorded in as
much detail as possible. Where input was required by the end user, the stopwatch was paused and the input
noted in the raw results in parenthesis after the phase description.
Where possible, all requests by products to pre-scan or post-install scan were declined or skipped. Where it
was not possible to skip a scan, the time to scan was included as part of the installation time. Where an

Endpoint Protection Small Business PassMark Software
Performance Benchmark Page 19 of 23 Report 1 12 October 2010
optional component of the installation formed a reasonable part of the functionality of the software, it was
also installed (e.g. website link checking software as part of an Endpoint Security Product).
Installation time includes the time taken by the product installer to download components required in the
installation. This may include mandatory updates or the delivery of the application itself from a download. We
have noted in our results where a product has downloaded components for product installation.
We have excluded product activation times due to network variability in contacting vendor servers or time
taken in account creation.
Benchmark 2 – Boot Time
PassMark Software uses tools available from the Windows Performance Toolkit version 4.6 (as part of the
Microsoft Windows 7 SDK obtainable from the Microsoft Website) with a view to obtaining more precise and
consistent boot time results on the Windows 7 platform.
The boot process is first optimized with xbootmgr.exe using the command “xbootmgr.exe -trace boot –
prepSystem” which prepares the system for the test over six optimization boots. The boot traces obtained
from the optimization process are discarded.
After boot optimization, the benchmark is conducted using the command "xbootmgr.exe -trace boot -numruns
5”. This command boots the system five times in succession, taking detailed boot traces for each boot cycle.
Finally, a post-processing tool was used to parse the boot traces and obtain the BootTimeViaPostBoot value.
This value reflects the amount of time it takes the system to complete all (and only) boot time processes. Our
final result is an average of five boot traces.
Benchmark 3 – Scan Time on Demand
Scan Time is the time it took for each product to scan a set of sample files. The sample used was identical in all
cases and contained a mixture of system files and Office files. In total there were 8502 files whose combined
size was 5.42 GB. Most of these files come from the Windows system folders. As the file types can influence
scanning speed, the breakdown of the main file types, file numbers and total sizes of the files in the sample set
is given here.
.avi 247 1024MB
.dll 773 25MB
.exe 730 198MB
.gif 681 63MB
.doc 160 60MB
.docx 267 81MB
.jpg 2904 318MB
.mp3 333 2048MB
.png 451 27MB
.ppt 97 148MB
.sys 501 80MB
.wav 430 260MB
.wma 585 925MB
.xls 329 126MB
.zip 14 177MB
Where possible this scan was run without launching the product’s user interface, by right-clicking the test folder
and choosing the “Scan Now” option, though some products required entering the UI to scan a folder. To record
the scan time, we have used product’s built-in scan timer or reporting system. Where this was not possible, scan
times were taken manually with a stopwatch.
For each product, five samples were taken with the machine rebooted before each sample to clear any caching
effects by the operating systems.
Endpoint Protection Small Business PassMark Software
Performance Benchmarks Page 20 of 23 Edition 1 12 October 2010
As a result of this mechanism, we have averaged the four subsequent scan times to obtain an average
subsequent scan time. Our final result for this test is an average of the subsequent scan average and the initial
scan time.
Benchmark 4 – CPU Average during Scan
The CPUAvg tool is used for this metric. The system is clean booted and waits for idle (approximately 5 minutes
after booting). A Virus Scan is run on a pre-defined set of files while CPUAvg is run for the duration of the scan.
Benchmark 5 – User Interface Launch Time
The launch time of a product’s user interface was taken using AppTimer (v1.0.1008). For each product tested, we
obtained a total of fifteen samples from five sets of three UI launches, with a reboot before each set to clear
caching effects by the operating system. When compiling the results the first of each set was separated out so
that there was a set of values for the initial launch after reboot and a set for subsequent launches.
We have averaged the subsequent launch times to obtain an average subsequent launch time. Our final result
for this test is an average of the subsequent launch average and the initial launch time.
AppTimer is publically available from the PassMark Website.
Benchmark 6 – Word Document Open Time
The average launch time of Word interface was taken using AppTimer. This includes the time to launch the Word
2007 application and open a 10MB document. This test was practically identical to the User Interface launch
time test. For each product tested, we obtained a total of fifteen samples from five sets of three Word launches,
with a reboot before each set to clear caching effects by the operating system. When compiling the results the
first of each set was separated out so that there was a set of values for the initial launch after reboot and a set
for subsequent launches.
We have averaged the subsequent launch times to obtain an average subsequent launch time. Our final result
for this test is an average of the subsequent launch average and the initial launch time.
Benchmark 7 – Browse Time
We used a script in conjunction with HTTPWatch (Basic Edition, version 6.1) to record the amount of time it
takes for a set of 106 ‘popular’ websites to load consecutively from a local server. This script feeds a list of URLs
into HTTPWatch, which instructs the browser to load pages in sequence and monitors the amount of time it
takes for the browser to load all items on one page.
For this test, we have used Internet Explorer 8 (Version 8.0.6001.18783) as our browser.
The set of websites used in this test include front pages of high traffic pages. This includes shopping, social,
news, finance and reference websites.
The Browse Time test is executed five times and our final result is an average of these five samples. The local
server is restarted between different products and one initial ‘test’ run is conducted prior to testing to install
Adobe Flash Player, an add-on which is used by many popular websites.
Endpoint Protection Small Business PassMark Software
Performance Benchmarks Page 21 of 23 Edition 1 12 October 2010
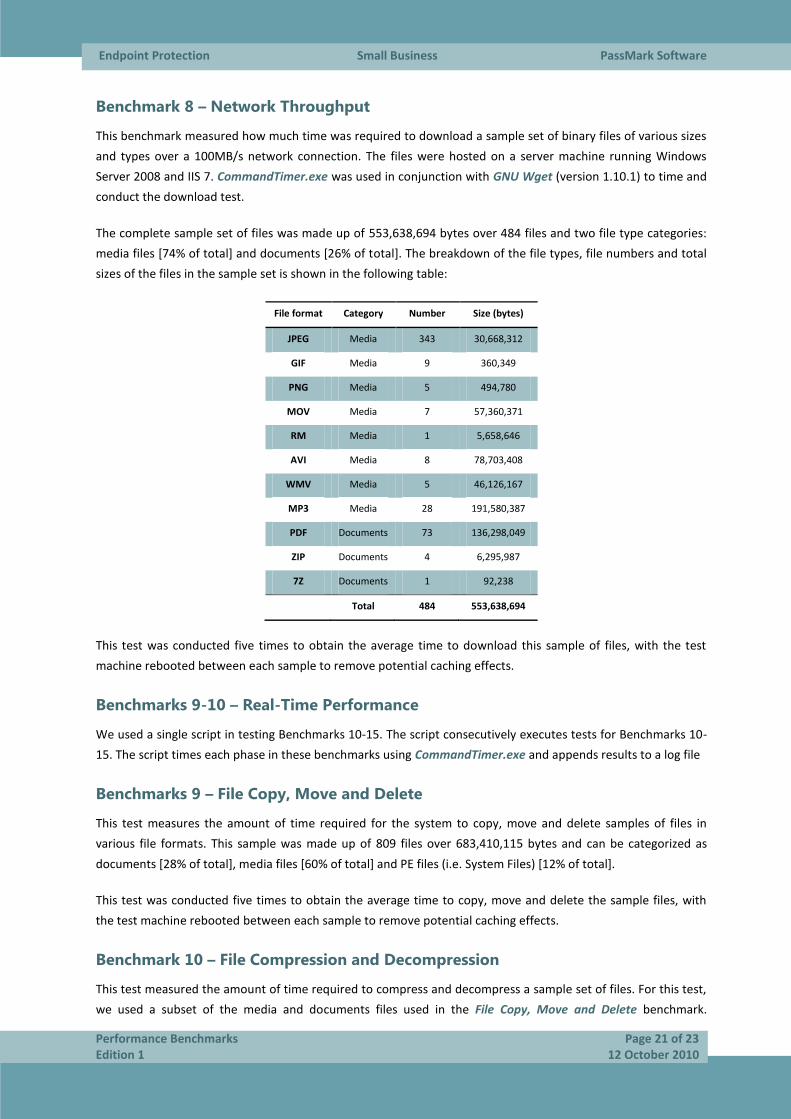
Benchmark 8 – Network Throughput
This benchmark measured how much time was required to download a sample set of binary files of various sizes
and types over a 100MB/s network connection. The files were hosted on a server machine running Windows
Server 2008 and IIS 7. CommandTimer.exe was used in conjunction with GNU Wget (version 1.10.1) to time and
conduct the download test.
The complete sample set of files was made up of 553,638,694 bytes over 484 files and two file type categories:
media files [74% of total] and documents [26% of total]. The breakdown of the file types, file numbers and total
sizes of the files in the sample set is shown in the following table:
File format Category Number Size (bytes)
JPEG Media 343 30,668,312
GIF Media 9 360,349
PNG Media 5 494,780
MOV Media 7 57,360,371
RM Media 1 5,658,646
AVI Media 8 78,703,408
WMV Media 5 46,126,167
MP3 Media 28 191,580,387
PDF Documents 73 136,298,049
ZIP Documents 4 6,295,987
7Z Documents 1 92,238
Total 484 553,638,694
This test was conducted five times to obtain the average time to download this sample of files, with the test
machine rebooted between each sample to remove potential caching effects.
Benchmarks 9-10 – Real-Time Performance
We used a single script in testing Benchmarks 10-15. The script consecutively executes tests for Benchmarks 10-
15. The script times each phase in these benchmarks using CommandTimer.exe and appends results to a log file
Benchmarks 9 – File Copy, Move and Delete
This test measures the amount of time required for the system to copy, move and delete samples of files in
various file formats. This sample was made up of 809 files over 683,410,115 bytes and can be categorized as
documents [28% of total], media files [60% of total] and PE files (i.e. System Files) [12% of total].
This test was conducted five times to obtain the average time to copy, move and delete the sample files, with
the test machine rebooted between each sample to remove potential caching effects.
Benchmark 10 – File Compression and Decompression
This test measured the amount of time required to compress and decompress a sample set of files. For this test,
we used a subset of the media and documents files used in the File Copy, Move and Delete benchmark.

Endpoint Protection Small Business PassMark Software
Performance Benchmarks Page 22 of 23 Edition 1 12 October 2010
CommandTimer.exe recorded the amount of time required for 7zip.exe to compress the files into a *.zip and
subsequently decompress the created *.zip file.
This subset comprised 404 files over 280475493 277,346,661 bytes. The breakdown of the file types, file
numbers and total sizes of the files in the sample set is shown in the following table:
File format Category Number Size (bytes)
DOC Documents 12 30,450,176
DOCX Documents 4 13,522,409
PPT Documents 3 5,769,216
PPTX Documents 3 4,146,421
XLS Documents 4 2,660,352
XLSX Documents 4 1,426,054
JPG Media 343 30,668,312
GIF Media 9 360,349
PNG Media 5 494,780
MOV Media 7 57,360,371
RM Media 1 5,658,646
AVI Media 8 78,703,408
WMV Media 5 46,126,167
Total 404 277,346,661
This test was conducted five times to obtain the average file compression and decompression speed, with the
test machine rebooted between each sample to remove potential caching effects.
Benchmark 11 – Memory Usage during System Idle
The Perflog++ utility was used to record process memory usage on the system at boot, and then every minute
for another fifteen minutes after. This was done only once per product and resulted in a total of 15 samples. The
first sample taken at boot is discarded.
The PerfLog++ utility records memory usage of all processes, not just those of the anti-malware product. As a
result of this, an anti-malware product’s processes needed to be isolated from all other running system
processes. To isolate relevant process, we used a program called Process Explorer which was run immediately
upon the completion of memory usage logging by PerfLog++. Process Explorer is a Microsoft Windows
Sysinternals software tool which shows a list of all DLL processes currently loaded on the system.
Benchmark 12 – Memory Usage during Scan
PerfLog++ will be used to record memory usage on the system while a scan is in progress, see Memory usage
during system idle above for the description of PerfLog++ and how the processes used by the products are
identified.
Endpoint Protection Small Business PassMark Software
Performance Benchmarks Page 23 of 23 Edition 1 12 October 2010
Benchmark 13 – CPU Average during Idle
The CPUAvg tool is used for this. The system is clean booted and waits for idle (approximately 5 minutes after
booting), CPUAvg is then run for 5 minutes while the system is in an idle state.
.