performance benchmarks for electricity distribution ...pdf.usaid.gov/pdf_docs/pnadd964.pdf ·...
TRANSCRIPT
CONCEPT PAPER Performance Benchmarks for Electricity Distribution Companies in South Asia November 2004
Prepared by
Contract No. 386-C-00-03-00135-00
Prepared for USAID SARI/Energy Program www.sari-energy.org
00465.000
CONCEPT PAPER Performance Benchmarks for Electricity Distribution Companies in South Asia November 2004
Prepared by
Contract No. 386-C-00-03-00135-00
00465.000
Prepared for USAID SARl/Energy Program www.sari-energy.org

Acknowledgements Geoffrey Smith of Nexenergy and Brian Wood of Nexant prepared this report, under the guidance anddirection of Nexant’s management team in Delhi and Washington, DC. The authors gratefully acknowledgethe assistance of representatives from South Asian electric distribution companies (DISCOMs) andregulatory agencies, and the managers of SARI/Energy regional offices (in Bangladesh, India, Nepal, andSri Lanka) towards preparing this Concept Paper. These individuals provided valuable insight into theselection of performance benchmarks, consideration of data issues, and potential participation of specificelectricity distribution companies in a pilot project. While the specific individuals requested anonymity, wewould like to recognize that representatives from North Delhi Power, Lanka Electric, Nepal ElectricityAuthority, and Dhaka Electric Supply, and from the Energy Regulatory Commissions of the states of Delhi,Gujarat, and Rajasthan in India, have also provided inputs to this report
Contents Section Page
Executive Summary………………………………………………………………….. iii
1 Introduction and Approach……………………………………………………… 1-1 1.1 What is Benchmarking?……………………………………………………….. 1-1 1.2 Why is Distribution Benchmarking Important to South Asia?………………… 1-1
1.2.1 Benchmarking in the Context of the SARI/Energy Project……………… 1-2 1.3 Purpose of Distribution Benchmarking Assessment…………………………… 1-2 1.4 Benefits and Beneficiaries……………………………………………………… 1-3 1.5 Approach to the Benchmarking Concept Paper………………………………… 1-3 1.6 Target Outputs of the Distribution Benchmarking Effort………………………. 1-4
2 Background: International Experience with Benchmarking…………………… 2-1 2.1 United States Experience………………………………………………………… 2-1 2.2 Other Country Experience………………………………………………………. 2-3
2.2.1 Developed Countries………………………………………………………. 2-3 2.2.2 Developing Countries……………………………………………………… 2-5
2.3 Usefulness of International Experience to South Asia DISCOMs………………… 2-7
3 Proposed Functional Areas and Metrics for Benchmarking……………………. 3-1 3.1 Proposed Functional Areas……………………………………………………… 3-1 3.2 Data Considerations…………………………………………………………….. 3-1
3.2.1 Requisite Characteristics………………………………………………….. 3-2 3.2.2 Potential Sources of Data…………………………………………………. 3-2 3.2.3 Challenges of Rural DISCOMs for Benchmarking…………………………. 3-3
3.3 Proposed Metrics by Functional Area…………………………………………… 3-4 3.3.1 Operational Performance………………………………………………….. 3-4 3.3.1.1 Objectives and Challenges……………………………………….. 3-4
3.3.1.2 Measures of the Quality of Power Delivery……………………… 3-4 3.3.1.3 Measures of Distribution Operating Efficiency………………….. 3-6 3.3.1.4 Measures of Repair and Maintenance Performance……………… 3-8
3.3.2 Customer Service…………………………………………………………. 3-10 3.3.2.1 Objectives and Challenges……………………………………….. 3-10 3.3.2.2 Measures of Performance in Connection Services………………. 3-12 3.3.2.3 Measures of Complaint Handling……………………………….. 3-14 3.3.2.4 Other Measures of Customer Service…………………………… 3-15 3.3.3 Metering, Billing and Collection…………………………………………. 3-17 3.3.3.1 Objectives and Challenges……………………………………….. 3-17 3.3.3.2 Measures of Metering Effectiveness……………………………… 3-17 3.3.3.3 Measures of Billing Effectiveness………………………………… 3-19 3.3.3.4 Measures of Collection Effectiveness…………………………….. 3-21 3.3.4 Financial Performance……………………………………………………. 3-22 3.3.4.1 Objectives and Challenges………………………………………. 3-22
Concept Paper: Performance Benchmarks i for Electricity Distribution Companies in South Asia
Contents
Section Page 3.3.4.2 Indicators of Profitability and Capital Sustainability…………… 3-22 3.3.4.3 Measures of Competitiveness………………………………….. 3-23 3.3.5 Operational Cost Control………………………………………………... 3-24 3.3.5.1 Objectives and Challenges………………………………………. 3-24 3.3.5.2 Measures of Distribution Cost and Personnel Management……. 3-25
4 Recommendations for Benchmarking Metrics………………………………… 4-1 4.1 Selection of Metrics for the Pilot Project……………………………………… 4-1 4.2 Recommended Benchmark Metrics…………………………………………… 4-1
5 Recommended Pilot Benchmarking Activity…………………………………… 5-1 5.1 Scope and Objectives…………………………………………………………… 5-1
5.1.1 Target Audience………………………………………………………….. 5-1 5.1.2 Major Challenges and Issues…………………………………………….. 5-2
5.2 Approach………………………………………………………………………. 5-2 5.3 Outcomes and Products of the Pilot Project……………………………………. 5-4
Tables Page Table ES-1 Recommended Benchmark Metrics for the pilot project………………….. v Table 1-1 Sample Output Table……………………………………………………… 1-5 Table 4-1 Recommended Benchmark Metrics for the pilot project…………………. 4-2
Appendix A Evaluation Tools to Develop Benchmarking Approach……………….. A-1 Appendix B SGS Distribution Reliability Benchmarking Study…………………….. B-1 Appendix C Electric Utility Benchmarking Association Annual Roundtable…….. C-1 Appendix D Asian Development Bank-funded Technical Assistance for Performance Benchmarking for Pacific Power and Water Utilities….. D-1
Concept Paper: Performance Benchmarks ii for Electricity Distribution Companies in South Asia
Executive Summary Objective The purpose of this task was to: 1) examine the feasibility of developing an initial set of electrical distribution company (DISCOM) benchmark metrics that would be applicable across South Asia; 2) assess the likely availability and quality of the data to develop meaningful DISCOM performance indices; 3) assess the level of regional stakeholder and donor interests in establishing a pilot benchmark program and 4) provide follow-on suggestions, if merited.
The biggest challenge was to define a set of “meaningful” DISCOM metrics for which quality DISCOM data would be available. Within the urban DISCOM scenario this appeared possible but it became obvious that data would typically be incomplete when dealing with the rural DISCOM scenario. The approach started with international level DISCOM metrics that were slowly reduced in number and refined for the South Asia situation. These were then subsequently vetted with regional discoms and regulatory bodies, resulting in further refinement. In this process it was concluded that regional stakeholders did have an interest and desire in a follow-on effort. The result would be a set of performance indices that enables a distribution utility managers or regulators in South Asia to assess an individual distribution company’s performance on a common comparative basis. Thus, the development of this concept paper and follow-on pilot project are described in the following report, for USAID’s review and consideration.
What Is Benchmarking? Benchmarking is a process that develops performance indices for specific entities and compares them to industry norms for the purpose of measuring entity performance, and identifying areas needing improvement. This benchmarking process can reveal potential areas where a particular DISCOM’s performance is lacking and point to directions for further detailed examination to identify any underlying contributing causes or mitigating factors to the performance gap. Having a clear assessment of its strengths and weaknesses, a DISCOM can formulate a better corporate strategy to improve its competitive position in the marketplace.
Why Is Distribution Benchmarking Important To South Asia? Performance evaluation is vital to establishing and sustaining the quality of electricity service throughout the developed world. While the forms of performance benchmarking vary, their use is commonplace in the United States, Europe, Japan, and other developed countries. Utility managers use quantitative measures to compare operational performance among their distribution units to assure that they provide a uniform quality of service, anticipate problems, guide capital expenditures, and increasingly to monitor their competitiveness. Electric utilities subscribe to or invest in proprietary benchmarking services to enable comparison with both competitors and peers. Regulators rely on cross-utility studies of service quality and cost of service for a wide variety of functions every time they consider a utility’s application to increase consumer tariffs. Investors, bond rating agencies, and others in the financial community also track each utility’s performance against benchmark indices to evaluate management performance, company risk, and other factors that determine cost of capital. In these contexts, the usefulness of performance benchmarks is evident as a means to attract capital, to direct operating expenditures, and to recognize both strengths and
Concept Paper: Performance Benchmarks iii for Electricity Distribution Companies in South Asia
Executive Summary
weaknesses in an effort for continuous improvement in utility services. The managers of electricity distribution companies (DISCOMs) in South Asia are no different from their developed country counterparts in their desire to direct and realize performance improvement in their companies. The lack of performance benchmarks or any reliable database of performance indicators in South Asia is a major handicap for DISCOM managers and for interested investors in the banking and international development communities. At present, they have no region-based standard by which to target improvement efforts, monitor progress, or to make comparisons within the region. Throughout the region, DISCOM managers recognize that they lack this important management tool.
Furthermore, the countries of the South Asia region are at crossroads in their need to develop electric power infrastructure to support national goals of high economic growth. For most of the countries, the limitations of the present electricity infrastructure are critical constraints on economic expansion, poverty alleviation, and the ability to provide basic services to the population. The development of performance benchmarks—realistic standards of current performance and achievable goals for future performance—is a key building block toward attracting investment capital and making progress in providing commercial services.
Benefits And Beneficiaries The benchmarks aim to facilitate improvements in electricity distribution operations and service provision, by providing performance measures that will (1) help DISCOM managers to better understand their company’s strengths and weaknesses and direct improvement efforts, and (2) help public officials, investors, lending institutions, and donor organizations to develop capital expenditure and technical assistance programs for South Asian DISCOMs that are linked to performance. The principal beneficiaries of the benchmarking activity include:
Distribution company (DISCOM) managers: The benchmarks and database will provide South Asia-specific performance standards for key function areas, and the method to apply them to any given DISCOM. The benchmarks are intended to assist managers to compare their operations with peer DISCOMs, set performance targets, evaluate costs, allocate resources, develop capital expenditure requirements, and monitor performance.
Government, MLB funding agencies, and donor organizations: The benchmarks and database will facilitate evaluation of DISCOM performance, identification of investment needs, and development of improvement initiatives by external organizations concerned with power distribution sector reform and development. Moreover, as externally funded assistance becomes more focused on output, the benchmarks will provide a consistent set of performance metrics for the region.
Investors and lending institutions: The benchmarks are expected to provide critical data that will facilitate privatization and corporatization programs as government officials and investors are able to compare targeted DISCOMs with industry norms.
Consumers and DISCOM Employees: The benchmarks will provide a means for improvements in distribution services to consumers and in the safety of working conditions for DISCOM employees.
Concept Paper: Performance Benchmarks iv for Electricity Distribution Companies in South Asia
Executive Summary
Concept Development and Proposed Performance Metrics During the course of preparing this concept paper, benchmarking was discussed with several South Asian DISCOMs. These discussions included the solicitation of feedback on appropriate benchmarking metrics, and other issues such as related experience and implementation approach. The concept was also discussed with several regulatory bodies in the region, which subsequently provided additional inputs on appropriate benchmarking metrics and their general views on the benchmarking approach. These vetting discussions were helpful in determining interest, which was unanimously supportive, and in narrowing down the preliminary list of benchmarking metrics to those most appropriate to a pilot project initiative.
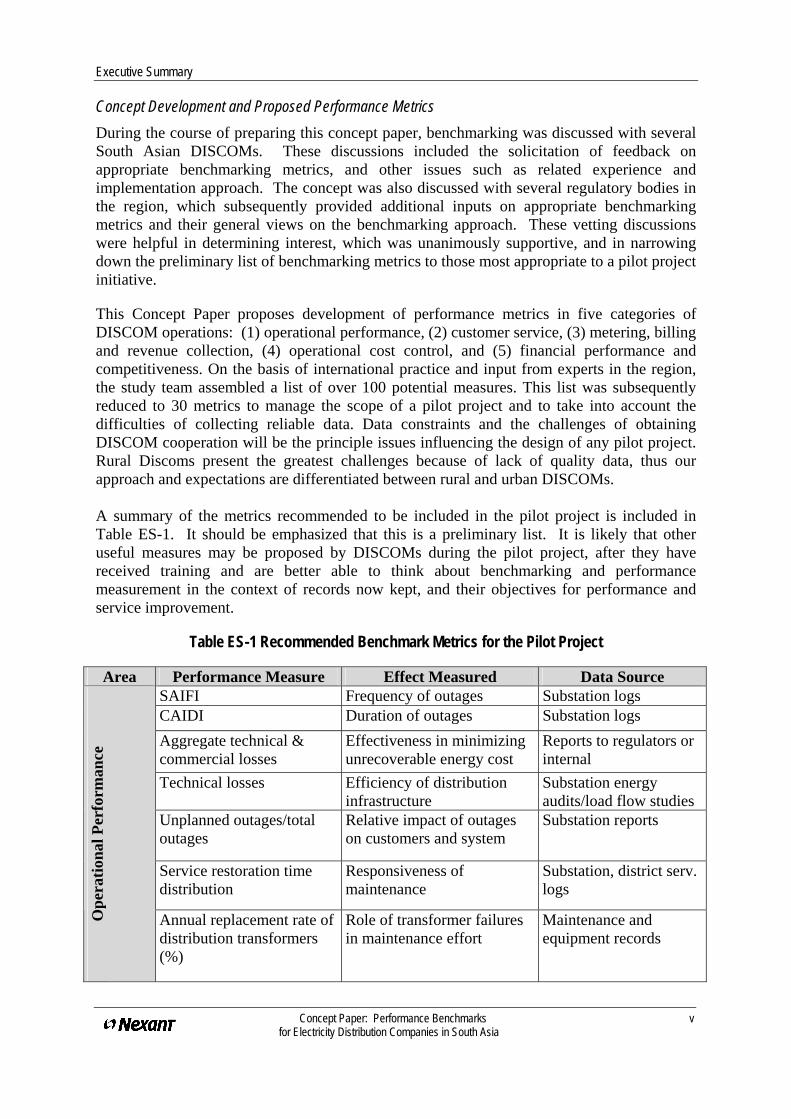
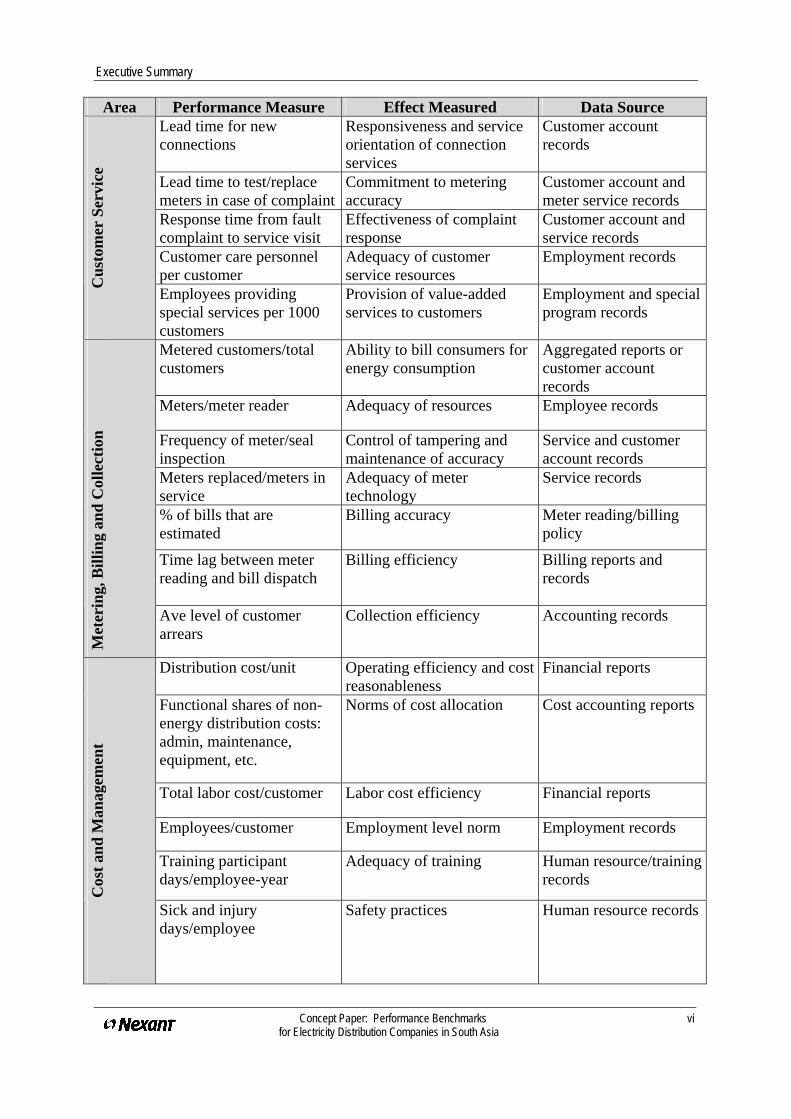
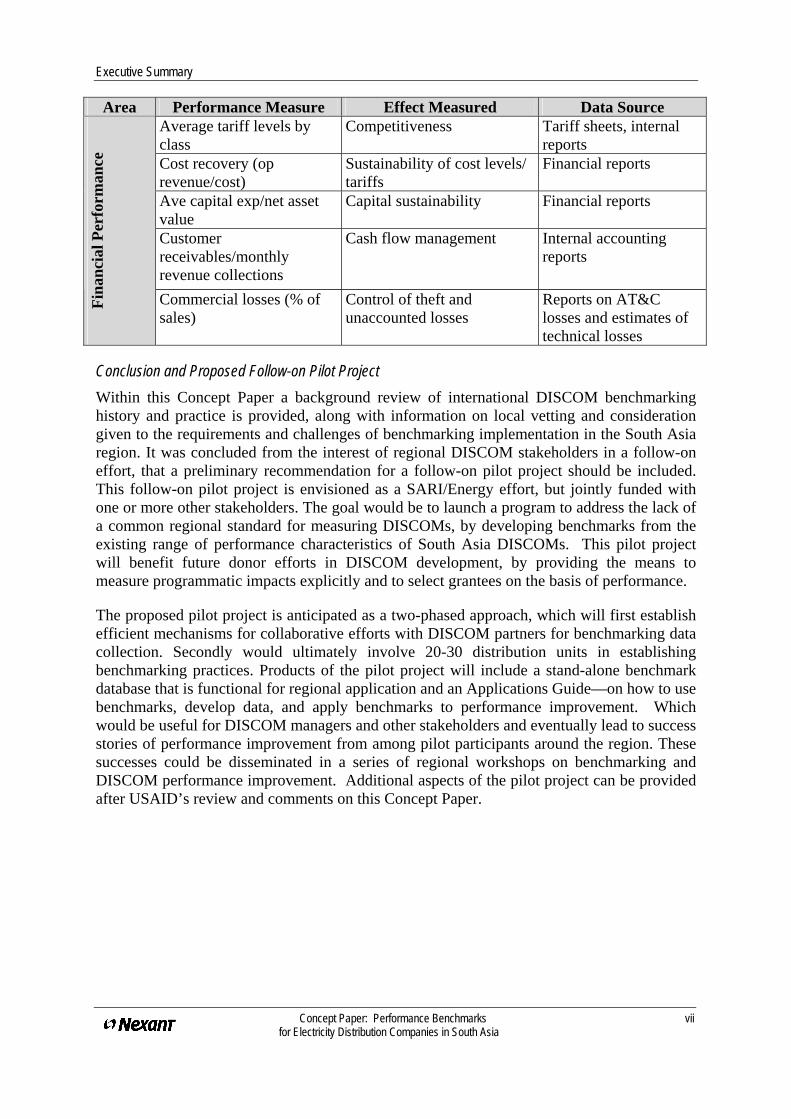
This Concept Paper proposes development of performance metrics in five categories of DISCOM operations: (1) operational performance, (2) customer service, (3) metering, billing and revenue collection, (4) operational cost control, and (5) financial performance and competitiveness. On the basis of international practice and input from experts in the region, the study team assembled a list of over 100 potential measures. This list was subsequently reduced to 30 metrics to manage the scope of a pilot project and to take into account the difficulties of collecting reliable data. Data constraints and the challenges of obtaining DISCOM cooperation will be the principle issues influencing the design of any pilot project. Rural Discoms present the greatest challenges because of lack of quality data, thus our approach and expectations are differentiated between rural and urban DISCOMs. A summary of the metrics recommended to be included in the pilot project is included in Table ES-1. It should be emphasized that this is a preliminary list. It is likely that other useful measures may be proposed by DISCOMs during the pilot project, after they have received training and are better able to think about benchmarking and performance measurement in the context of records now kept, and their objectives for performance and service improvement.
Table ES-1 Recommended Benchmark Metrics for the Pilot Project
Area Performance Measure Effect Measured Data Source SAIFI Frequency of outages Substation logs CAIDI Duration of outages Substation logs Aggregate technical & commercial losses
Effectiveness in minimizing unrecoverable energy cost
Reports to regulators or internal
Technical losses Efficiency of distribution infrastructure
Substation energy audits/load flow studies
Unplanned outages/total outages
Relative impact of outages on customers and system
Substation reports
Service restoration time distribution
Responsiveness of maintenance
Substation, district serv. logs
Ope
ratio
nal P
erfo
rman
ce
Annual replacement rate of distribution transformers (%)
Role of transformer failures in maintenance effort
Maintenance and equipment records
Concept Paper: Performance Benchmarks v for Electricity Distribution Companies in South Asia
Executive Summary
Concept Paper: Performance Benchmarks vi for Electricity Distribution Companies in South Asia
Area Performance Measure Effect Measured Data Source Lead time for new connections
Responsiveness and service orientation of connection services
Customer account records
Lead time to test/replace meters in case of complaint
Commitment to metering accuracy
Customer account and meter service records
Response time from fault complaint to service visit
Effectiveness of complaint response
Customer account and service records
Customer care personnel per customer
Adequacy of customer service resources
Employment records
Cus
tom
er S
ervi
ce
Employees providing special services per 1000 customers
Provision of value-added services to customers
Employment and special program records
Metered customers/total customers
Ability to bill consumers for energy consumption
Aggregated reports or customer account records
Meters/meter reader Adequacy of resources Employee records
Frequency of meter/seal inspection
Control of tampering and maintenance of accuracy
Service and customer account records
Meters replaced/meters in service
Adequacy of meter technology
Service records
% of bills that are estimated
Billing accuracy Meter reading/billing policy
Time lag between meter reading and bill dispatch
Billing efficiency Billing reports and records
Met
erin
g, B
illin
g an
d C
olle
ctio
n
Ave level of customer arrears
Collection efficiency Accounting records
Distribution cost/unit Operating efficiency and cost reasonableness
Financial reports
Functional shares of non-energy distribution costs: admin, maintenance, equipment, etc.
Norms of cost allocation Cost accounting reports
Total labor cost/customer Labor cost efficiency Financial reports
Employees/customer Employment level norm Employment records
Training participant days/employee-year
Adequacy of training Human resource/training records
Cos
t and
Man
agem
ent
Sick and injury days/employee
Safety practices Human resource records
Executive Summary
Concept Paper: Performance Benchmarks vii for Electricity Distribution Companies in South Asia
Area Performance Measure Effect Measured Data Source Average tariff levels by class
Competitiveness Tariff sheets, internal reports
Cost recovery (op revenue/cost)
Sustainability of cost levels/ tariffs
Financial reports
Ave capital exp/net asset value
Capital sustainability Financial reports
Customer receivables/monthly revenue collections
Cash flow management Internal accounting reports
Fina
ncia
l Per
form
ance
Commercial losses (% of sales)
Control of theft and unaccounted losses
Reports on AT&C losses and estimates of technical losses
Conclusion and Proposed Follow-on Pilot Project Within this Concept Paper a background review of international DISCOM benchmarking history and practice is provided, along with information on local vetting and consideration given to the requirements and challenges of benchmarking implementation in the South Asia region. It was concluded from the interest of regional DISCOM stakeholders in a follow-on effort, that a preliminary recommendation for a follow-on pilot project should be included. This follow-on pilot project is envisioned as a SARI/Energy effort, but jointly funded with one or more other stakeholders. The goal would be to launch a program to address the lack of a common regional standard for measuring DISCOMs, by developing benchmarks from the existing range of performance characteristics of South Asia DISCOMs. This pilot project will benefit future donor efforts in DISCOM development, by providing the means to measure programmatic impacts explicitly and to select grantees on the basis of performance.
The proposed pilot project is anticipated as a two-phased approach, which will first establish efficient mechanisms for collaborative efforts with DISCOM partners for benchmarking data collection. Secondly would ultimately involve 20-30 distribution units in establishing benchmarking practices. Products of the pilot project will include a stand-alone benchmark database that is functional for regional application and an Applications Guide—on how to use benchmarks, develop data, and apply benchmarks to performance improvement. Which would be useful for DISCOM managers and other stakeholders and eventually lead to success stories of performance improvement from among pilot participants around the region. These successes could be disseminated in a series of regional workshops on benchmarking and DISCOM performance improvement. Additional aspects of the pilot project can be provided after USAID’s review and comments on this Concept Paper.
Concept Paper: Performance Benchmarks 1-1 for Electricity Distribution Companies in South Asia
Section 1 Introduction and Approach 1.1 What Is Benchmarking? Benchmarking is a process that develops performance indices for specific entities and compares them to industry norms for the purpose of measuring entity performance, and identifying areas needing improvement. This benchmarking process can reveal potential areas where a particular DISCOM’s performance is lacking and point to directions for further detailed examination to identify any underlying contributing causes or mitigating factors to the performance gap. Having a clear assessment of its strengths and weaknesses, a DISCOM can formulate a better corporate strategy to improve its competitive position in the marketplace.
1.2 Why Is Distribution Benchmarking Important To South Asia? Performance evaluation is vital to establishing and sustaining the quality of electricity service throughout the developed world. While the forms of performance benchmarking vary, their use is commonplace in the United States, Europe, Japan, and other developed countries. Utility managers use quantitative measures to compare operational performance among their distribution units to assure that they provide a uniform quality of service, anticipate problems, guide capital expenditures, and increasingly to monitor their competitiveness. Electric utilities subscribe to or invest in proprietary benchmarking services to enable comparison with both competitors and peers. Regulators rely on cross-utility studies of service quality and cost of service for a wide variety of functions every time they consider a utility’s application to increase consumer tariffs. Investors, bond rating agencies, and others in the financial community also track each utility’s performance against benchmark indices to evaluate management performance, company risk, and other factors that determine cost of capital. In these contexts, the usefulness of performance benchmarks is evident as a means to attract capital, to direct operating expenditures, and to recognize both strengths and weaknesses in an effort for continuous improvement in utility services.
The managers of electricity distribution companies (DISCOMs) in South Asia are no different from their developed country counterparts in their desire to direct and realize performance improvement in their companies. The lack of performance benchmarks or any reliable database of performance indicators in South Asia is a major handicap for DISCOM managers and for interested investors in the banking and international development communities. At present, they have no region-based standard by which to target improvement efforts, monitor progress, or to make comparisons within the region. Throughout the region, DISCOM managers recognize that they lack this important management tool.
Furthermore, the countries of the South Asia region are at crossroads in their need to develop electric power infrastructure to support national goals of high economic growth. For most of the countries, the limitations of the present electricity infrastructure are critical constraints on economic expansion, poverty alleviation, and the ability to provide basic services to the population. The development of performance benchmarks—realistic standards of current performance and achievable goals for future performance—is a key building block toward attracting investment capital and making progress in providing commercial services
Section 1 Introduction and Approach
1.2.1 Benchmarking in the Context of the SARI/Energy Project There are two broad, compelling reasons to provide substantive support to the proposed pilot benchmarking project under SARI/Energy. The first reason is that the establishment of performance benchmarks for South Asia DISCOMs will provide a fundamental building block for regional improvements in energy security and distribution reform, two of the four SARI/Energy focus areas. Poor performance in distribution operations is rife throughout the region, and threatens both economic growth and public support for reforms. Benchmarks and training in their application will provide the means to direct reform and improvement efforts. Hence, performance benchmarking addresses the SARI/Energy mission in fundamental ways.
The second reason is that significant synergies are obtained by launching a benchmarking pilot at the regional level, rather than at the country level. To be effective, performance benchmarks must be established in the context of numerous DISCOM participants. This establishes both best practice targets and the effective range of performance in the industry. Both aspects are necessary for DISCOM managers to direct their performance improvement efforts, and for investors and regulators to evaluate the status of a company. A benchmarking activity launched in Nepal, Sri Lanka, or Bangladesh alone would not obtain sufficient numbers of participants, and the cost to launch such a limited coverage pilot may not produce sufficient benefits. A regional approach assures both rich variety and numbers, while the essential similarities in context and performance of DISCOMs in the region’s countries provide for useful comparisons. A regional approach also introduces the DISCOMs in each country to the unique success stories in distribution performance of its neighbors.
A third reason may also be put forward, which is perhaps as vital as the preceding two. There has been a substantial level of donor support provided to the region’s power sector, and substantial donor resources will continue to support the development of distribution operations in particular. Yet there is scant ability to measure outputs or the effectiveness of these efforts. The proposed benchmarking project will provide the means for output-oriented development support in the future.
1.3 Purpose Of Distribution Benchmarking Assessment The purpose of this initial task is to develop a concept paper outlining an initial set of metrics and approach for developing a database benchmarking selected electricity distribution functions appropriate for South Asia. This concept paper also proposes a pilot project towards establishing benchmarks on the basis of data from selected DISCOMs in the South Asia region, providing the level and type of resources likely required for the effort.
Currently, there is a lack of integrated and consistent information for DISCOMs in developing countries in South Asia and worldwide such that important policy, operational, pricing and investment considerations are made without reference to fundamental industry norms. A set of reliable and viable distribution metrics will provide a critical baseline for DISCOM managers and power sector entities to make more effective decisions in a broad range of areas, including: cost recovery programs, investment in rural electrification, rate setting, O&M costs and scheduling, billing and collections procedures, appropriate technology investment, and staffing levels for specific job functions. With such norms in place, governments and DISCOM operators will have transparent benchmarks against which they can design programs to improve performance, lower costs and increase the range of distribution to currently under-serviced areas.
Concept Paper: Performance Benchmarks 1-2 for Electricity Distribution Companies in South Asia
Section 1 Introduction and Approach
1.4 Benefits And Beneficiaries The benchmarks aim to facilitate improvements in electricity distribution operations and service provision, by providing performance measures that will (1) help DISCOM managers to understand their company’s strengths and weaknesses and to direct improvement efforts, and (2) help public officials, investors, lending institutions, and donor organizations to develop capital expenditure and technical assistance programs for South Asian DISCOMs. The principal beneficiaries of the benchmarking activity include:
Distribution company (DISCOM) managers: The benchmarks and database will provide South Asia-specific performance standards for key function areas, and the method to apply them to any given DISCOM. The benchmarks are intended to assist managers to compare their operations with peer DISCOMs, set performance targets, evaluate costs, allocate resources, develop capital expenditure requirements, and monitor performance.
Government, MLB funding agencies, and donor organizations: The benchmarks and database will facilitate evaluation of DISCOM performance, identification of investment needs, and development of improvement initiatives by external organizations concerned with power distribution sector reform and development. Moreover, as externally funded assistance becomes more focused on output, the benchmarks will provide a consistent set of performance metrics for the region.
Investors and lending institutions: The benchmarks are expected to provide critical data that will facilitate privatization and corporatization programs as government officials and investors are able to compare targeted DISCOMs with industry norms.
Consumers and DISCOM Employees: The benchmarks will provide a means for improvements in distribution services to consumers and in the safety of working conditions for DISCOM employees.
1.5 Approach To The Benchmarking Concept Paper Nexant/SARI Energy initiated the Benchmarking Assessment with a review of past distribution benchmarking and related activities both within the region and elsewhere. This review was focused and not exhaustive, considering that the Concept Paper format is an undertaking of limited scope—strictly a “bench study” undertaken without consultant-visits to the region—intended to assist USAID toward deciding whether and how to proceed with a much larger scale trial as in a pilot project. Nevertheless, the review considered results from benchmarking efforts at two private Indian distribution companies, another quasi-public East Asian DISCOM, summaries of selected benchmark indices taken from US and UK utilities, benchmarking guidelines and results compiled by the American Public Power Association, a sample from the Edison Electric Institute’s subscription-only database, and reports and testimony on the use of benchmarking from US regulatory proceedings in several states.
In parallel to the literature review, the study team considered past experience with distribution companies in the region, and direct, informal contacts with DISCOM managers, to develop a preliminary list of performance-related parameters. The review of documents from the literature review then added to this list. Quickly, the study team found convergence on the proposed performance parameters and it was apparent that further review would have
Concept Paper: Performance Benchmarks 1-3 for Electricity Distribution Companies in South Asia
Section 1 Introduction and Approach
diminishing returns. At this stage, it was more important to obtain direct feedback within the region about critical issues on data availability, reliability, and access.
The study team prepared a list of proposed benchmarks with questions about their perceived usefulness and issues concerning the data requirements. This instrument is included in Appendix A. The study team distributed this instrument and a summary of the Benchmarking Assessment task and objectives, to members of the Nexant/SARI Energy team throughout the region. Individual team members in Bangladesh, India, Nepal, and Sri Lanka responded to this “evaluation matrix” instrument, and the list of issues, based on their own experience, and then contacted local DISCOM professionals on an informal basis to obtain their feedback. The proposed benchmarking activity and performance metrics were developed on the basis of the earlier review and this vetting process.
The study team also designed the proposed Benchmarking Pilot activity on the basis of the feedback that emerged from this vetting process.
1.6 Target Outputs Of The Distribution Benchmarking Effort The pilot project aims to establish sustainable benchmarking practices and to facilitate performance improvement among DISCOMs in South Asia. Specific outcomes include the following, and products are noted further below:
South Asia region-specific performance benchmarks for electricity distribution services, and a proven model for further development of benchmark data and practices, and their application for performance improvement.
Cross-border learning among DISCOMs in the region about distribution performance norms and the means of enhancing performance.
20-30 DISCOM participants with direct experience in developing performance data and awareness of their performance levels compared to their peers in the region.
Awareness and recognition of region-specific standards of distribution performance among vital stakeholders (government, regulators, financial community, consumers).
The specific products of the project are described in Section 5, Recommended Pilot Benchmarking Activity. They include the benchmark database developed from data of the participating DISCOMs, an Applications Guide that describes data collection techniques and application of benchmarks to performance improvement, success stories of performance improvement in regional DISCOMs, workshops on benchmarking and DISCOM performance improvement using benchmark targets, the lessons learned in application of the SARI/Energy benchmark product in two DISCOMs, as well as project reports. The project will also develop materials on benchmarking for the SARI/Energy Resource Center and products will be posted on the SARI/Energy website.
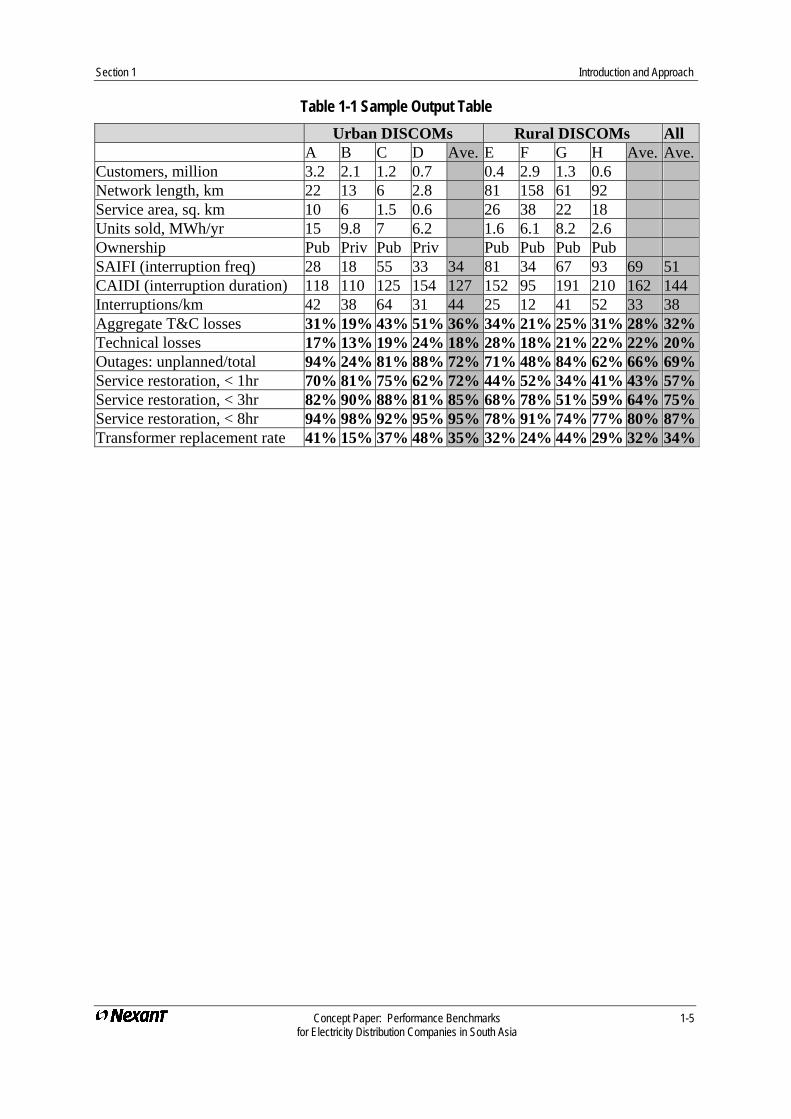
The output form of the performance benchmarks will be developed during the pilot project in response to the needs of stakeholders and the confidentiality conditions agreed upon with participants. We expect they will take the form of tabular data by functional area (as in Table 1-1) and selectively augmented by scatter plots or other graphical presentation of normalized data to facilitate comparisons.
Concept Paper: Performance Benchmarks 1-4 for Electricity Distribution Companies in South Asia
Section 1 Introduction and Approach
Table 1-1 Sample Output Table Urban DISCOMs Rural DISCOMs All A B C D Ave. E F G H Ave. Ave.Customers, million 3.2 2.1 1.2 0.7 0.4 2.9 1.3 0.6 Network length, km 22 13 6 2.8 81 158 61 92 Service area, sq. km 10 6 1.5 0.6 26 38 22 18 Units sold, MWh/yr 15 9.8 7 6.2 1.6 6.1 8.2 2.6 Ownership Pub Priv Pub Priv Pub Pub Pub Pub SAIFI (interruption freq) 28 18 55 33 34 81 34 67 93 69 51 CAIDI (interruption duration) 118 110 125 154 127 152 95 191 210 162 144 Interruptions/km 42 38 64 31 44 25 12 41 52 33 38 Aggregate T&C losses 31% 19% 43% 51% 36% 34% 21% 25% 31% 28% 32%Technical losses 17% 13% 19% 24% 18% 28% 18% 21% 22% 22% 20%Outages: unplanned/total 94% 24% 81% 88% 72% 71% 48% 84% 62% 66% 69%Service restoration, < 1hr 70% 81% 75% 62% 72% 44% 52% 34% 41% 43% 57%Service restoration, < 3hr 82% 90% 88% 81% 85% 68% 78% 51% 59% 64% 75%Service restoration, < 8hr 94% 98% 92% 95% 95% 78% 91% 74% 77% 80% 87%Transformer replacement rate 41% 15% 37% 48% 35% 32% 24% 44% 29% 32% 34%
Concept Paper: Performance Benchmarks 1-5 for Electricity Distribution Companies in South Asia
Section 2 Background: International Experience with Benchmarking
2.1 United States Experience Electric utility benchmarking has been practiced in various forms in the United States for decades as a means to improve performance and as a regulatory tool to ensure that customers are not overcharged due to the inefficient production and distribution of electricity. As the electric utility industry has been largely transformed during the recent period of industry restructuring, the number of players involved in benchmarking has further evolved and increased. Apart from the utilities and regulatory bodies themselves, the types of organizations now involved include consulting firms serving both the utilities and regulators, specialized organizations that collect, analyze and report benchmarking data for large groupings of U.S. electric utilities, and industry associations such as the Edison Electric Institute and the American Public Power Association that promote increases in technical, operational, organizational and management efficiency in electric utility systems.
Examples of earlier industry efforts to promote more efficient utility operation and management are provided in several guides published by the American Public Power Association focused on business planning, performance measurement, and achieving a competitive edge.123 These documents address the entire spectrum of utility operations and management. They include recommendations on an overall approach to achieve improvements as well as suggested performance indicators in different key areas such as technical performance, financial performance, customer relations, and so on.
As benchmarking in the U.S. has become more widespread and developed, more recent and current initiatives directed at utilities include:
Solicitations to U.S. utilities to participate in group projects where a number of utilities participate and submit benchmarking data. These data are analyzed and reported on back to the utilities so they can assess their own performance against the other utility participants. The data is treated and reported such that the performance of each individual utility is kept confidential and available only to that utility. Group data can be analyzed so that each utility can compare itself primarily to others with similar characteristics e.g. size, geography, voltage levels, customer types, etc. e.g. a recent project of this type focusing on electric power distribution systems is the SGS Distribution Reliability Benchmarking Study that provided project participants with an in-depth comparative assessment of reliability performance. It also provided both relative and absolute comparisons by system and voltage class against the study average, quartiles, geographic systems, self-selected peers, and between systems. A more detailed description of this project is provided in Appendix B.
1 “Performance Measurement for Public Power Systems”, August 1991, American Public Power Association 2 “Business Planning and Performance Measurement”, October 1993, American Public Power Association 3 “The Competitive Edge – A Guide to Management Issues and Resources”, 1996, American Public Power Association
Concept Paper: Performance Benchmarks 2-1 for Electricity Distribution Companies in South Asia
Section 2 Background: International Experience with Electric Utility Benchmarking
Roundtables and conferences addressing electric utility and distribution systems benchmarking, e.g., the recent Electric Utility Benchmarking Association Annual Roundtable on June 10-11, 2004 was designed to bring process managers, analysts, and overall benchmarking coordination staff together to learn from each other about efforts in benchmarking and how they lead to organizational change. A more detailed description of this roundtable is provided in Appendix C.
Firms specializing in collecting, analyzing and reporting financial data for specific industries including electric utilities. These data are analyzed and presented for both selected individual electric utilities and as averages for a large number of electric utilities. A section on financial benchmarks is typically included to compare the individual utility under study with the averages for the larger utility group.
U.S. consulting firms currently conducts a whole range of benchmarking studies. They can be designed to accomplish a variety of objectives such as:
Helping utilities in their quest to match or exceed industry performance norms via utility-specific studies
Conducting annually-updated multi-utility benchmarking programs to ensure that utility clients have a measurable basis for responding to the pressures of increased competition and changes in utility regulation
Helping utilities in analyzing and benchmarking their performance data, and presenting this data for the utilities purposes in regulatory proceedings
Developing utility management incentive programs based on utility performance
Assisting regulatory agencies in developing and fine tuning their benchmarking methodologies
Reliability has always been one of the key measures of a utility’s performance in the U.S. It has been long recognized that power outages have a very high associated cost of unserved energy resulting from loss of industrial production and commercial business activity, as well as other significant effects to the economy such as industries and businesses actually locating elsewhere where power is more reliable. More recently, with the increased activity levels in the high tech industries, there has been even more emphasis placed on high power quality and reliability for e.g. the Electric Power Research Institute (EPRI) in the U.S. has significantly increased it’s emphasis on power quality and reliability by increasing it’s program activities in these areas and by forming the EPRI-PEAC organization, now one of the leading U.S. firms in power system quality and reliability.456
Although many U.S. distribution system benchmarking studies focus on one aspect or another of distribution system performance such as reliability, power quality or financial performance as discussed above, the metrics addressed in comprehensive assessments should
4 “Distribution Reliabilty Benchmarking”, presentation by Dr. Arshad Mansoor, Dr. Arindam Maitra, and Tom Short, EPRI
PEAC Corporation, 2003 IEEE T&D Conference September 9, 2003, Dallas 5 “About Global Power Quality Issues and Solutions”, EPRI Website http://www.epri.com/6 “Evaluation of Web-Based Cost-Effective Power Quality Monitoring System”. EPRI Website http://www.epri.com/
Concept Paper: Performance Benchmarks 2-2 for Electricity Distribution Companies in South Asia
Section 2 Background: International Experience with Electric Utility Benchmarking
include all areas of relevance currently considered, including cost of service, reliability, quality, losses, financial, employee productivity, safety, and customer satisfaction.
These and other metrics are discussed in more detail in Section 3 below.
2.2 Other Country Experience Experience in benchmarking in other developed economies parallels that of the United States in that it has been practiced for many years in one form or another, but has been given added impetus and taken on a new shape now that waves of utility restructuring and privatization have swept through these economies. Developing economies on the other hand offer mixed situation assessments on the status of their utility sector reform, the degrees of privatization achieved and the application of benchmarking methods.
2.2.1 Developed Countries Prominent among the developed economies in restructuring and privatization as well as the application of benchmarking are countries such as the United Kingdom, the Scandinavian countries, and Australia. For example, in the United Kingdom, where the electricity supply industries are now “deregulated”, “price cap” regulation is applied including incentives for the companies to retain efficiency savings. These “price controls” generally take the form of an assessment of required income with a continuing requirement for efficiency gains that act as a proxy for competition. Benchmarking is used as a way of assessing the expenditures and performance of each distribution company. In the UK, regulatory reviews are carried out at five-year intervals by the British electricity regulator, Ofgem, when allowable distribution charges are determined. However, the distribution charges are permitted to vary each year according to the formula “RPI-X”, where RPI is the retail prices index (inflation index) and X is an efficiency factor. To date, this form of price control has led to significant price reductions as well as quality improvements for customers.7 With there being 14 distribution companies in Great Britain, there are good opportunities for benchmarking costs and performance between them.
Similarly, the Scandinavian countries have undergone significant recent regulatory and structural changes. Although the nomenclature appears to be different, the current systems are similar to those in the U.K. For example, the “regulation of the Finnish Electricity Market” began in 1995 when the Electricity Market Act (1018/1995) was passed.8 The purpose of the law was to create a competitive market for electricity production and sales. The network operations were to remain as a so-called natural monopoly. The distribution companies (primarily 100 or so privately owned companies) must continue to meet their obligations to provide service and maintain reasonable pricing. The Finnish Energy Market Authority is responsible for ensuring these responsibilities are met and for supervising the operational efficiency of these companies. They now use a Data Envelopment Analysis (DEA) model for distribution company efficiency benchmarking. Efficiency scores are developed that factor into the determination of the allowable rates for power and the
7 “Application of Benchmarking to Distribution Companies 10 Billion Dollar Investment Plans”, D. I. Bailey, J.
A. K. Douglas, F. Castro Sayas, and C. H. Morris, PB Power Ltd., United Kingdom. 8 “Analysis of the Benchmarking Results of the Electricity Distribution Companies in Finland”, Jukka Lassila,
Sato Viljainen, and Jarmo Partanen, Paper BPPCo2-G-10, IEEE Postgraduate Conference, Budapest, Hungary, August 11-14, 2002.
Concept Paper: Performance Benchmarks 2-3 for Electricity Distribution Companies in South Asia
Section 2 Background: International Experience with Electric Utility Benchmarking
distribution company profit. DEA models are commonly used for this purpose by other regulatory bodies around the world. They typically consider a lesser number of top level inputs than the more detailed benchmarking analysis conducted by the utilities themselves. In the Finnish DEA model, the inputs to determining the efficiency scores are limited to five9 as follows:
1) operational costs 2) power quality (interruption time) 3) distributed energy 4) network length 5) number of customers
Further information on the efficient operation and management of Nordic distribution systems including benchmarking was addressed recently at the NORDAC 2004 Conference on 23-24 August 2004 in Espoo, Finland in association with the International Conference & Exhibition on Electricity Distribution (CIRED). CIRED is one of the leading international Electricity Distribution Forums holding major conferences on distribution system technology, operation and management issues every two years at different locations in Europe.
Australia is another example of successful electric utility industry restructuring, in spite of initial setbacks and difficulties. Deregulation of Australia’s electricity industry during the 1990s has ultimately delivered lower bulk electricity costs to businesses. In the power distribution area, distribution businesses (DB’s) are typically evaluated as to their performance when new price controls are set, before the onset of each new price control period. For example, in Victoria, the Office of the Regulator General (ORG) periodically considers evaluations of each DB’s performance for this purpose. Regulatory benchmarking, similar to that discussed above, is used to assist in this evaluation. Of course, as in the U.S., benchmarking is performed not only by the regulatory body and its consultants, but also by the distribution companies and their consultants, in order to improve their company’s performance in advance of regulatory pressures and to further their purposes in regulatory proceedings e.g. Nexant recently reviewed a study by another U.S. consulting firm for an Australian distribution company that was commissioned for this purpose. This study evaluated the performance of the Victorian DB against the performance of a number of U.S. investor-owned utilities. This benchmarking exercise took a different approach by developing a model that used and manipulated the data for the U.S. utilities to produce predicted performance results for the Victoria DB based on comparable efficiency levels but with the results adjusted to consider the actual business and other conditions faced by the Victoria DB. Areas evaluated in this study included cost performance, productivity, and reliability performance.
Certain restructuring and benchmarking activities are also underway in some newly industrialized countries (NIC’s) in the Asia Pacific region e.g. Nexant recently conducted a project for a confidential client in the Asia Pacific region to compile a database of U.S. utility
9 “Investments in the Benchmarking of the Distribution Companies”. J. Lassila, S. Viljainen, S. Honkapuro, and J. Partanen,
Lappeenranta University of Technology, Finland.
Concept Paper: Performance Benchmarks 2-4 for Electricity Distribution Companies in South Asia
Section 2 Background: International Experience with Electric Utility Benchmarking
financial and technical performance indicators to help in establishing benchmarks for improving the performance of two local utilities.10
Other developed countries with a history of restructuring, privatization and benchmarking include New Zealand and the Netherlands,
2.2.2 Developing Countries The progress and application of benchmarking in developing countries is typically tied to the status of their electric utility sector reform initiatives. Hence, we have included below a brief summary of the status of reform initiatives in the developing world.
The driving forces behind electric sector reform in developed and developing countries have been different. In developed countries, the main aim of the reforms has been to improve the performance of relatively efficient systems. In developing and transition countries, the main impetus for reform has generally been that the existing low levels of technical, economic and financial performance are simply no longer viable or acceptable if these countries are to move forward in their economic development. The typical steps in developing country electricity sector reform are to 1) restructure the sector, 2) establish regulatory authorities, 3) organize markets for generation, 4) regulate transmission and distribution networks, 5) privatize existing assets and promote new investments, and 6) allow for cost-reflective electricity tariffs.11
Private sector participation is arguably the most important element of electricity sector reforms. Private ownership together with competition (and incentive-regulated transmission and distribution networks) is expected to result in improved cost efficiency, lower prices, reduced system losses, and improved revenue collection. Between 1990 and 1999, private sector participation took place in the electricity sectors of 75 developing countries. However, the distribution of private investments in electricity sectors across different activity areas and regions of the world has been rather uneven. Two thirds of the investment for projects with private participation has been in pure generation facilities, whereas distribution-only investment has been limited to 16% of the total during this 1990-1999 period. The investment patterns also reveal notable differences among the main regions of the world. The Latin American and Caribbean (LAC) and East Asian and Pacific (EAP) countries accounted for 40% and 35% of total private investments, respectively, while only 12% of total private investments took place in South Asia (SA) countries. The remaining 13% of private investments has taken place in Eastern Europe and Central Asia (ECA), the Middle East and North Africa (MENA), and Africa. LAC countries exhibit the highest level of investments in distribution-only and transmission systems. At the same time, there has been a notable absence of distribution-only investments in South Asia and MENA countries. Almost all the new private investment in South Asia has been in generation-only facilities.10
10 “2002 Comparative Power Industry Database for Performance Evaluation of (Confidential) Electric Utilities”, Nexant
report, September 2002. 11 “Reform and Regulation of the Electricity Sectors in Developing Countries”, Tooraj Jamasb, The Cambridge-
MIT Institute, MIT Center for Energy and Environmental Policy Research, DEA Working Paper WP 0226, August 2002.
Concept Paper: Performance Benchmarks 2-5 for Electricity Distribution Companies in South Asia
Section 2 Background: International Experience with Electric Utility Benchmarking
Although privatization and new private investment in the South Asia distribution-only area has been very low, some progress has been made towards developing the necessary reform steps for distribution assets divestiture and privatization. In 1999 it was estimated that the percentage progress towards developing all the key reform steps in the distribution sector in the various developing country regions was EAP - 11%, ECA – 30%, LAC – 44%, MEA – 13%, SA – 20%, and Africa – 4%.12 However, the fact remains that in South Asia, until recently, private investors have simply not been interested in investing in distribution-only assets compared to generation-only assets. Since the late 1990’s, this situation is improving somewhat, primarily in India and to some extent in Pakistan, with new initiatives completed or underway to privatize certain distribution assets.
Needless to say, based on the above summary, it should be expected that most of the experience in the developing world in distribution system reform and privatization over the last ten years or so, as well as accompanying benchmarking activities to improve performance, is to be found in the LAC countries. The leading LAC countries are Chile, where the privatization of major electric utilities began in the late 1980’s, Argentina, which followed Chile’s example in 1992, and shortly thereafter Bolivia, Columbia and Peru. During the second half of the 1990’s, Panama, El Salvador, Guatemala, Nicaragua, and Brazil also adopted reforms. More recently Costa Rica, Ecuador, Mexico and Venezuela have taken actions towards restructuring. A recent study compares the relative performance of public and privatized Latin American electric distribution utilities for the years 1994 to 2001, and concludes that the privatized firms are more labor efficient than their public counterparts, but reserves judgment for subsequent studies on the subject of operational and technical efficiencies.13 Another recent report states that both technical and non-technical energy losses are being reduced under private ownership of distribution companies. Metering, billing and collection have improved, illegal connections have been reduced, and line maintenance has received much needed attention.14
Incentive-based regulation of distribution companies in LAC countries including the incorporation of benchmarking appears to be the most common approach. For example, an international survey on regulatory benchmarking for distribution companies found that Chile, Columbia and Brazil were all employing benchmarking with DEA analysis being the most popular approach.15 While information on LAC distribution company-funded benchmarking studies was not as readily available, it is logical to assume that such studies are being conducted to help these private firms improve their performance and to help them respond to performance-based regulatory pressures.
Projects have been funded by the development banks to foster performance improvement and benchmarking activities in the utility sector for e.g. the Asian Development Bank-funded project “Technical Assistance for Performance Benchmarking for Pacific Power and Water Utilities” that was scheduled for completion in 2001 (see Appendix D). This project included 1) initial surveys of all facets of utility operations, including population served,
12 “A Scorecard for Energy Reform in Developing Countries”. Robert Bacon, Public Policy for the Private Sector, Note No.
175, The World Bank Group, Finance, Private Sector, and Infrastructure Network, April 1999. 13 “Ownership and Efficiency: Evidence from Latin American Electric Utilities”, Martin A. Rossi, Department of
Economics, University of Oxford. 14 “Energy Markets in Transition: The Latin America and Caribbean Experience”, World Energy Council, June 2001. 15 “Benchmarking and Regulation of Electricity Transmission and Distribution Utilities: Lessons from International
Experience”, Tooraj Jamasb, Michael Pollitt, University of Cambridge, December 2000.
Concept Paper: Performance Benchmarks 2-6 for Electricity Distribution Companies in South Asia
Section 2 Background: International Experience with Electric Utility Benchmarking
consumption, production and generation, demand, supply constraints, system losses, tariffs, demand management measures, financial data, and human resources data, 2) consultations and workshops with utilities to identify key strategic and results areas for framing performance evaluation criteria and appropriate utility performance benchmarks, and to develop performance improvement action plans, and 3) documentation of the workshop findings and action plan outlines to serve as blueprints for the adoption and implementation of the evaluation criteria, benchmarking and action plan recommendations.
2.3 Usefulness Of International Experience To South Asia DISCOMs A review of the status of electric sector reform in South Asia countries shows mostly mixed and unimpressive initiatives and relatively low levels of accomplishments towards privatization and efficiency improvement, particularly in the distribution area. There are some important exceptions—and those achievements need to be made more accessible and more useful to other DISCOMs—but in general there is much remaining to be done. Earlier references in this paper attest that there has been little or very minor progress in the distribution area in South Asia through the early 2000’s.
Each of the region’s countries has individual success stories. In India, the privatization of New Delhi’s distribution services in 2002 into three private DISCOMs is slowly showing positive results, particularly in improvements to customer services. At least one of those DISCOMs, North Delhi Power Limited (NDPL), has begun to develop preliminary benchmarking data to gauge its efficiency levels in areas such as reliability, financial indicators, and customer satisfaction. Likewise, some of the more progressive of the recently-formed regulatory bodies—such as in Delhi, Maharashtra, Andhra Pradesh, Gujarat and others—are using cross-utility comparisons as inputs to tariff setting and performance evaluation, and are developing regulations and standards for performance.16
India’s private DISCOMs, and public DISCOMs that are in the process of structural reform, offer many success stories in performance enhancement. The Andhra Pradesh Central Power Distribution Company Limited, a recently unbundled public DISCOM, has made substantial progress towards improving performance in service delivery and customer care. Mumbai has been served by private DISCOMs for decades, and enjoys international standards of reliability and low technical losses. Noida PCL, privatized in 1994, launched rural service improvement projects in 2003 that may become valuable precedents for rural DISCOM reform. Rajasthan state’s recently unbundled DISCOMs in Jaipur, Jodhpur and Ajmer are slowly but assuredly making progress in organizational reform, though tangible benefits for consumers are still difficult to measure or identify. There is progress in other DISCOMs and states also: Ahmedabad Electricity Company, Calcutta Electric Supply, the states of Orissa, Kerala, Karnataka and Maharashtra, and elsewhere. However, the specifics of these achievements are not well known, particularly in terms of measurable impacts, nor have their methods been made accessible to other Indian DISCOMs.
16 The Delhi Electricity Regulatory Commission has recently prepared draft performance standard regulations that cover
areas of new connections, existing connections, billing, metering, disconnection and reconnection, energy pilferage, penalty/compensation for delays in providing services, complaint handling, meter testing, and other areas. Other regulators are considering or have issued regulations. In principle, tariff orders establish standards for performance, particularly regarding expenditure and staffing levels and financial performance, which are reassessed periodically. Regional benchmarks can be particularly useful to the development of tariff orders, as they provide perspective on local performance that is valuable both to the DISCOMs and their regulators. DISCOMs also have a need for benchmarks developed independently from regulatory processes.
Concept Paper: Performance Benchmarks 2-7 for Electricity Distribution Companies in South Asia
Section 2 Background: International Experience with Electric Utility Benchmarking
The other countries of the region also have their highlights of accomplishment. Lanka Electric Supply stands ahead of its peer DISCOMs of the Ceylon Electricity Board in Sri Lanka, setting high standards for the region in technical practices and customer service delivery. The rural cooperatives of Bangladesh have pioneered good practices for provision of rural power services (which SARI/Energy has disseminated throughout the region), and Dhaka Electric Supply leads the country in urban services. Nepal Electricity Authority has recently designed a limited set of technical and financial benchmarks to provide incentives and improve the performance of distribution zones and other power service units. WAPDA in Pakistan has upgraded selected distribution units for sale and privatization, e.g., the Faisalabad Electricity Supply Company (FESCO). There are other success stories, as well as major programmatic initiatives at the government level,17 but again, their impacts on service delivery are generally not adequately measured or made meaningful to the vast majority of under-performing DISCOMs in the region, where the average quality of service is generally accepted as static or even declining, despite prodigious international donor efforts and local initiatives to guide improvement.
The experience with benchmarking in countries outside the region, both in the regulatory context and proactively by DISCOMs to improve their performance, has generally been quite positive. Companies in many other industries also use benchmarking as a way to improve their performance and profitability. It seems quite logical to consider the application of benchmarking in parallel and in concert with other reform, restructuring and privatization initiatives in the South Asia utility sector. A paper presented recently in India refers to the new power sector initiatives in the power sector and the need for assessing and improving distribution company performance. It also proposes that benchmarking be employed for this purpose.18 It cautions however, that since each country, utility and distribution unit is somewhat and in some cases substantially unique, that care be taken to make sure the right parameters are being compared and analyzed. It should be emphasized in response to this concern that care is typically taken in benchmarking to make sure that systems are only compared to comparable systems and that only appropriate performance measures are employed in the assessments. To ensure these considerations are addressed it is recommended that any South Asia distribution systems benchmarking project include workshops where the methodologies and indicators are vetted, discussed and agreed upon in advance with the distribution entity participants.
In summary, benchmarking is considered to be an appropriate methodology to employ in South Asia in parallel and concert with other restructuring, privatization and regulatory initiatives. Further along in this paper we have outlined a pilot benchmarking program to be conducted under SARI/Energy that could make a significant contribution towards moving South Asian distribution companies along this path.
17 There are promising programmatic initiatives that may soon begin to bear fruit. In India, they include the Electricity Act
of 2003 that opens generation, transmission, and distribution activities to private investors and directs improvement in customer services, the GOI’s Accelerated Power Development and Reform Programme (APDRP), and the GOI/USAID distribution reform (DRUM) program. NEA’s recent efforts to incentivize performance improvement in power operating units (including distribution units) are promising. Other programs are in progress or under consideration in other countries. Yet these initiatives also need a means of impact assessment and a means of disseminating experiences with performance improvement in a tangible manner, such as through the benchmarking activities described in this report.
18 “Benchmarking of the Electricity Distribution Companies in India”, Dr. P. K. Kaira, Vipin Prakash Singh, and Yogesh K. Bichpuriya, Indian Institute of Technology, Kanpur, India, Distribution India Conference, April 15-16, 2004, Delhi, India.
Concept Paper: Performance Benchmarks 2-8 for Electricity Distribution Companies in South Asia
Section 3 Proposed Functional Areas and Metrics for Benchmarking
3.1 Proposed Functional Areas Performance benchmarks focus on the aspects of distribution functions where performance can be quantified. There are many functional areas and many potential indicators of performance within each one of them. In the context of the developing and/or reforming distribution systems of the South Asia region, the benchmarking activity intends to focus on functional areas that are particularly critical to the establishment of reliable and sustainable power distribution services. The metrics for these functional areas are necessarily developed in consideration of the ability to conduct comparative analyses of DISCOMs (within a country and among different countries in the region), and in consideration of the availability of reliable, consistent, and replicable data.
The functional areas for performance benchmarking are proposed as follows:
Operational Performance: The availability, reliability, and quality of power delivered to consumers, provision of maintenance and repair services, and level of technical and commercial losses.
Customer Service: Provision of key customer services such as connection services, handling of complaints, consumer education activities, testing services, DSM programs.
Metering, Billing and Collection: Extent and accuracy of metering, billing practices, collection efficiency, arrears on receivables.
Financial Performance and Competitiveness: Cost recovery, profitability, level of capital investment (and reinvestment), and comparative tariff levels.
Operational Cost Control: Total cost of distribution services, staffing levels and labor costs, other operating and capital costs, inventory management.
For each of these five function areas, the study team identified activities where performance measurement would be valuable, and developed a short list of proposed, quantifiable parameters or indices. These were prepared on the basis of a literature review and experience with distribution companies both within and outside the region. The preliminary benchmark parameters were put into a survey form (see Appendix A). This provided a basis to explore data considerations in discussions with selected South Asian DISCOM personnel and Nexant/SARI Energy staff.
3.2 Data Considerations The challenges of data collection and data quality were recognized from the outset of this task, as evident in the work scope approved by USAID: “The difficulty in obtaining reliable data for this project cannot be understated. Without participation from key stakeholders in the region, the methodological framework will remain conceptual with little real-world value or regional specificity.”
Concept Paper: Performance Benchmarks 3-1 for Electricity Distribution Companies in South Asia
Section 3 Proposed Functional Areas and Metrics for Benchmarking
Consideration of data collection issues was a defining theme of this Concept Paper toward assessing the feasibility of establishing DISCOM performance benchmarks for the region.
3.2.1 Requisite Characteristics The study team considered that, for a benchmarking database to be truly valuable and commercially worthwhile, the input data should have the following characteristics:
Accessibility: It must be possible to access the data for multiple DISCOMs within the resource constraints of the project
Reliability: The data must be good quality and based on confirmable facts, with a reasonable level of assurance that it has not been fabricated or misrepresented.
Consistency: Definitions of the metrics being reported must be consistent across sources and across DISCOMs to assure that the data are comparable.
Replicability: Data sources and the means of acquisition should be standardized to support periodic updates that indicate changes in benchmark metrics over time.
3.2.2 Potential Sources of Data The study team considered the relative merits of both public and private (proprietary) data sources toward developing a benchmarking database. The following are assessments based on discussions and brainstorming sessions:
Publicly available sources: DISCOM annual reports: In South Asia, most DISCOMs are not listed
companies. Most of the private DISCOMs are units of industrial conglomerates and neither operating data nor financial data for the DISCOMs are separated out of the consolidated financial statements. Hence, annual reports do not show standardized data, although company websites do provide limited descriptive data on operations. The data available from annual reports of government entities needs to be investigated on a case-by-case basis.
Government statistics: Government agencies report data on utility generation and some data on distribution operations, but there is no consistency from government to government (country to country or, in India, state to state). One must expect limitations in what is recorded, and that quality may not be verified, but data may be collected on a regular basis.
Regulatory agencies: Much data is available, and increasingly so as the regulatory reform process provides regulatory agencies with more authority. In India, several states are issuing regulations dealing with performance standards similar to some of the metrics proposed in this report. However, cross-DISCOM data is not compiled except within a state. There may be confidentiality issues that need to be addressed, and access will require an approval process. In principle, this should be public data, and ultimately should be available, but regulatory data generally is very time consuming to obtain and compile. In South Asia, regulation is in its infancy, so the value of this source varies considerably within the region. However, regulators should have strong interest in the results of a benchmarking study, so may be willing partners.
Concept Paper: Performance Benchmarks 3-2 for Electricity Distribution Companies in South Asia
Section 3 Proposed Functional Areas and Metrics for Benchmarking
Trade publications: If articles can be found, trade journals can be good sources of comparative data, even if they are one-off efforts (i.e., not compiled on a regular basis). Journalists may also provide good referrals to promising data sources.
Proprietary sources: DISCOMs: Direct contact with DISCOMs to acquire data is time consuming,
and the level of cooperation is expected to be highly variable, but this approach has the best potential for obtaining high quality data. Confidentiality is a priority, and data generally cannot be identified publicly with the DISCOM name. Assurance of confidentiality and value of the results will affect the level of cooperation. Both confidentiality and value will increase proportionally with the number of DISCOMs represented in the study, because as the numbers increase, the benchmark results become richer, and an individual DISCOM’s contribution becomes more anonymous and difficult to infer.
Management consultancies: In-country management consultancies (McKinsey, KPMG, and the like) may have conducted multi-client studies that include performance measures. Such studies are generally very costly to participants and are not available to non-participants.
Trade Associations: Some trade associations collect data and publish reports, with reprints available to non-members for a price. This source may be explored further during the pilot project.
NGOs: In some cases, where NGOs participate in the regulatory process as public interest advocates, they compile data that may be available at cost. This may be a source for selected types of consumer or DISCOM performance data.
The study team’s conclusion from this brief assessment was that the DISCOMs are the best source of data and that the priority of the benchmarking effort must be to develop a benchmarking product that delivers sufficient value to induce their participation. Regulatory agencies were considered as another valuable resource. Potentially, regulators could direct DISCOMs to disclose data that was not available directly. But the study team considered that the use of this regulatory authority, if it were indeed available, would be a two-edged sword that could easily backfire and undermine efforts to recruit DISCOMs as willing partner/ participants in the benchmarking endeavor.
3.2.3 Challenges of Rural DISCOMs for Benchmarking We must acknowledge that the region’s rural DISCOMs pose particularly thorny issues for benchmarking development, in comparison to urban DISCOMs. The quality and availability of both substation and customer data are considerably poorer in the rural DISCOMs. Their infrastructure is more strained and management resources are less developed. As indicated above, there are some success stories among rural DISCOMs that present opportunities for collecting data and establishing performance standards. Yet we must reasonably expect that it will be more difficult to establish benchmarking practices for the rural sector. In the short term, benchmarking may offer more tangible benefits for the region’s urban DISCOMs. Yet the proposed benchmarking project will make major inroads in characterizing rural services
Concept Paper: Performance Benchmarks 3-3 for Electricity Distribution Companies in South Asia
Section 3 Proposed Functional Areas and Metrics for Benchmarking
and in describing the parameters of service improvement among the region’s better performing rural DISCOMs.
3.3 Proposed Metrics By Functional Area 3.3.1 Operational Performance 3.3.1.1 Objectives and Challenges Operational performance benchmarks should measure and establish standards for the reliability of service, power quality, and ability to serve demand. There are a number of industry indices that are well established as benchmarks for service reliability in the industry. Many DISCOMs in the region track these measures in some form for internal purposes, and some state regulatory commissions in India have recently drafted or issued regulations that establish performance standards.
However, few distribution companies or even distribution circles in South Asia are equipped with SCADA systems that automate the data recording process and assure data accuracy. In most DISCOMs, the availability of measurement instruments is spotty; hence there may be good data in some distribution zones, zero data in unequipped zones, and a wide variation in record keeping or reporting among the distribution zones according to the level of management attention. These challenges may be addressed by DISCOM-specific sampling efforts, as described below.
The study team proposed benchmarks in three areas, as follows: (1) measures of the quality of power delivery, (2) measures of distribution operating efficiency, and (3) measures of repair and maintenance performance. These measures are presented below.
3.3.1.2 Measures of the Quality of Power Delivery Proposed Measures Measures of power quality focus on the frequency and duration of interruptions. Four of the proposed benchmarks are indices that are used commonly in the industry. Performance data on these indices from DISCOMs in western countries are available and useful for target setting by South Asian DISCOMs (some distribution companies in the region use them as targets now). The measures include:
SAIFI (system average interruption frequency index): This measures the average number of interruptions (outages) that a customer experiences in a year. It is a ratio of the number of customer-interruptions in a year to the total number of customers. Customer-interruptions are determined from estimates of the number of customers affected by each interruption.
SAIDI (system average interruption duration index): This measures the average duration of interruptions, as the sum of the durations of the customer-interruptions used for SAIFI, divided by total customers.
CAIDI (consumer average interruption duration index): This measures the average amount of time in a year that a customer’s power service is interrupted, as the sum of the customer-interruption durations as in SAIDI, divided by the number of customer-interruptions (as in SAIFI).
Concept Paper: Performance Benchmarks 3-4 for Electricity Distribution Companies in South Asia
Section 3 Proposed Functional Areas and Metrics for Benchmarking
ASAI (average service availability index): This measures the average amount of time that electricity service is available to customers, and is derived from SAIFI.
Interruptions per 100 km of distribution line: This is another measure of interruption frequency, but a simpler measure than SAIFI because it does not require estimates of the number of customers affected by each interruption.
Frequency of voltage fluctuation events: This measures the average frequency of voltage fluctuations, outside of an acceptable bandwidth around the nominal voltage of supply. Similar measures of power quality could be measured in principle for frequency fluctuation and even harmonic disturbances.
Data Considerations All of the proposed measures would be useful to have as benchmarks, but data quality poses a constraint for most of them. All DISCOMs record data on service interruptions, particularly as they apply to service restoration and equipment replacement work orders. The data may not be compiled for company-wide performance measurement; hence release of the data and processing of the data into a useful form would be resource-intensive in many cases. The following are specific assessments:
SAIFI: For many DISCOMs, interruptions are recorded throughout the system, particularly in metered substations. Most distribution companies have not reached 100% meter coverage in substations; manual recording in unmetered substations is thorough and accurate in some distribution zones, but this practice depends on the priority accorded by management. Yet few DISCOMs would record the number of customers affected by a given interruption. The feeders affected by an interruption may be identified and recorded, and the number of customers served by each feeder is also known, but these data points may be linked only with difficulty if not done so already. Most DISCOMs would have an interest in being able to track this performance measure, but may require assistance. Sampling of interruption data, on a random basis, would be an effective approach to estimating SAIFI with reasonable accuracy and reliability.
SAIDI: Electronic meters and several types of recording mechanical meters, employed at substations, record the duration of interruptions (i.e., time of interruption and time of service restoration). Distribution zones also maintain records of the time an interruption is reported and the time that service is restored. Hence duration data, particularly on a sampling basis, may be obtained in principle with the cooperation of the DISCOM, as for SAIFI.
CAIDI: This index uses data inputs to SAIFI and SAIDI, and hence poses no further issues than do those measures.
ASAI: This index is derived from SAIFI, so poses no further considerations.
Interruptions per 100 km of distribution lines: This measure may be developed more readily from substation data for most DISCOMs, and may be available with reasonable accuracy from internal DISCOM reports.
Voltage fluctuation: Frequency and variation level of voltage fluctuations are important measures of power quality, but further investigation is needed to know how the data is reported. DISCOMs would certainly measure these and other power quality measures on a
Concept Paper: Performance Benchmarks 3-5 for Electricity Distribution Companies in South Asia
Section 3 Proposed Functional Areas and Metrics for Benchmarking
continuous basis at metered substations (subject to metering coverage and capacity), and maintain the data, but it is not clear how useful this voluminous data would be or how it appears in internal DISCOM reports. Application and use of sampled data would be important issues, as for interruption data. This may be available only from primary substations for power incoming to the DISCOM. It must also be noted that power quality at the substation is only a rough indication of the quality of delivered power, particularly in rural systems where voltage drops to customers are excessive. Customer surveys as completed in the earlier SARI/Energy studies of power quality would be a source of data, but not a realistic one for benchmarking purposes.
In all cases, cooperation from the DISCOM is required to obtain reliability in estimating these measures. Interruption data may be available from other sources, but considering that the sampling method would not be known or verifiable in the data, the quality of the measures would not be reliable.
In obtaining data for these measures from DISCOMs, assistance in sampling and analysis of sampled data would be essential. It is likely that poor sampling practice and data processing issues are the principle sources of inaccuracies in reporting performance measures, rather than the quality of data available.
Recommended Approach to Data Collection It appears that accurate and reliable data may be available for these measures at most DISCOMs for at least portions of their distribution network. Hence data collection requires a sampling approach. All of the benchmark measures would require close collaboration directly with the DISCOM to assure reliability and accuracy in the data. The data collection process would require some training and direct assistance in the use of sampling methods that may be initially supervised and verified but primarily carried out by the DISCOM.
3.3.1.3 Measures of Distribution Operating Efficiency Proposed Measures In the context of operational performance, the measures of distribution operating efficiency are considered to focus on distribution losses. Clearly there are many other aspects to operating efficiency, such as labor productivity, but these are addressed in other functional areas such as cost management. Distribution losses are an important indication of the state of a DISCOM’s infrastructure, and of its metering and collection functions. In India, distribution losses are considered one of the most important indications of a DISCOM’s performance. The proposed measures include:
Technical and commercial losses in distribution: This aggregate measure compares energy supplied to the DISCOM with energy sold to customers. The difference between these figures is the energy lost in distribution due to technical reasons (e.g., resistive losses) and commercial reasons (e.g., theft and unaccounted or unmetered sales).
Technical losses in distribution: This measure estimates technical losses; generally on the basis of load flow analysis and modeling.
Substation metering coverage and prevalence of energy audits: This measure indicates the percentage of substations (separately at the primary and secondary
Concept Paper: Performance Benchmarks 3-6 for Electricity Distribution Companies in South Asia
Section 3 Proposed Functional Areas and Metrics for Benchmarking
voltage levels) that are functionally metered and have a practice of annual energy audits.
Data Considerations Aggregate Technical and Commercial Losses: Many DISCOMs must report their aggregate technical and commercial (AT&C) losses to regulators or state-level authorities. The data components are readily available for most DISCOMs, from records of energy purchases and transfers from generating companies or the transmission grid, and records of energy sales to consumers. The problem comes in estimating actual energy delivered to customers that are not metered, which is particularly common in rural areas. Energy purchased by unmetered customers can be estimated from the consumption of comparable, metered customers, or from substation metered data. But substation metering may be spotty in rural areas, and many unknowns complicate estimation: high voltage drops, line tapping (theft), unauthorized loading (manipulating single phase supply for three-phase loads), and inaccurate DISCOM records of customer loads. Despite these difficulties, this measure is an important one in the developing country context, and should not be omitted. Rather, the benchmarking approach should consider the methods of estimation and, in recording a DISCOM’s performance on this measure, indicate a confidence band around the estimate. Some Indian DISCOMs are now trying to estimate AT&C losses at the distribution zone level, rather than in aggregate, based on sampling data. Sampling techniques should also be considered in working with DISCOMs to develop benchmark data.
Technical Losses: Technical loss must be estimated based on sampling of the system where both power supplied to the substation/feeder and consumer sales are metered. Technical losses are also estimated through load flow analysis and system modeling, although few South Asia DISCOMs have done this. DISCOMs vary in their application of internal energy audits that reveal technical losses, but most would develop this figure as a performance measure at least to some degree.
Substation metering: This measure provides an indication of a DISCOM’s ability to assess and track its operational performance. Most DISCOMs would have records of substation energy audits, and would be readily able to identify which substations were equipped with functional meters and which were not. This benchmark would be useful if the data is disaggregated by voltage level, and not very useful if provided only in aggregate. This data could be obtained in the process of developing data on power quality and losses for other measures, which is also done at the substation level.
Recommended Approach to Data Collection The study team’s inquiries among South Asian DISCOMs indicated that a benchmarking assessment should have good access to data for these measures. However, the study team also considers that the pilot project should investigate and report on estimation techniques used by the DISCOMs toward developing confidence bands around the reported measures. This would require working closely with DISCOM personnel, and would require an understanding of confidentiality, considering that the level of commercial losses is a sensitive area for most DISCOMs. In many cases, DISCOMs may obscure or misrepresent data deliberately in this area if they report these measures to regulators or government authorities, to avoid detection of high levels of theft or unreasonable levels of technical losses. Yet, DISCOM management would like to know reasonable benchmarks for the region and how they compare.
Concept Paper: Performance Benchmarks 3-7 for Electricity Distribution Companies in South Asia
Section 3 Proposed Functional Areas and Metrics for Benchmarking
This means that, from the perspective of the pilot project, the DISCOM’s genuine interest in true disclosure of data is more important than the data collection process itself. Hence, the key is in the selection of DISCOMs for the pilot, and then in working with their staff to obtain cooperation at all levels during data collection.
In developing useful data for this area, it is important to consider that there are urban DISCOMs in the region that have low levels of technical losses, comparable to international standards. There are also rural distribution companies that are known to have low levels of commercial losses, and though they may have relatively high levels of technical losses, they may provide important points of comparison for the level of technical losses that is reasonable for rural DISCOMs in the region. The pilot study should consider these factors in the selection of DISCOM participants.
3.3.1.4 Measures of Repair and Maintenance Performance Proposed Measures Maintenance and repair are critical functions that influence the overall quality of distribution service. In many parts of the South Asia region, load shedding is frequent. This often reflects generation supply or transmission deficiencies that are beyond the control of the DISCOM. The measures of repair and maintenance performance need to focus as much as possible on outages that are caused by the distribution system and on the DISCOM’s performance in responding to unplanned outages. Measures of repair performance in developed countries generally focus on the DISCOM’s response time and the time required to restore service to customers affected by a disruption; in many cases, outages due to major events beyond the DISCOM’s control (e.g., storms) are not included in the measure. This is also an appropriate measure for South Asian DISCOMs.
Regulatory proceedings in developed countries also devote considerable attention to staffing levels and costs associated with emergency response, such as in response to outages caused by storms, to make sure that DISCOMs maintain adequate capabilities, and to make sure that the distribution system minimizes its vulnerability to outages by maintaining the quality of plant. This aspect of maintenance is more difficult to translate to the South Asia region due to lack of cost parity in labor and materials. Some proxy measures are proposed below, toward establishing benchmarks for the adequacy of maintenance services.
The proposed measures include the following:
Service restoration time: This is the time elapsed from when a disturbance occurs until service is restored to customers. This measure is more usefully expressed as a distribution than as a simple average. The distribution captures data on the service restoration time of each disturbance, divided into intervals to show, for example, the percentage of service restorations that occur within 3 hours of power loss, the percentage occurring within 8 hours of power loss, and the percentage occurring within 18 hours of power loss.
% Unplanned outages/total outages: The level of unplanned outages is an indicator of the quality of the distribution infrastructure and maintenance performance. However, both load shedding that occurs due to insufficient supply, and power interruptions sourced outside of the DISCOM, represents outages that
Concept Paper: Performance Benchmarks 3-8 for Electricity Distribution Companies in South Asia
Section 3 Proposed Functional Areas and Metrics for Benchmarking
do not reflect on maintenance performance. They need to be excluded for the measure of maintenance performance.
Frequency of transformer replacement: This measure is determined by the ratio of the number of distribution transformers replaced annually to the total number of distribution transformers in service. This measure is another indicator of maintenance performance and infrastructure quality. Distribution transformers in many South Asian DISCOMs have a very short service life—due to poor quality of equipment, lack of protection gear, and/or excessive fluctuations in power quality—and this measure would provide a valuable yardstick for comparison to their peers and a basis to justify changes in DISCOM practices.
Maintenance personnel/100 customers: This benchmark provides an indicator of the size of the maintenance labor pool as a function of the number of customers. The size of the maintenance labor pool should correlate with other measures of maintenance performance. Particularly for urban DISCOMs, this measure provides a means of comparison among DISCOMs of different sizes, although economies of scale in maintenance operations may be expected.
Maintenance personnel/100 km of distribution line: This benchmark provides an alternative measure of the maintenance labor pool, expressed as a function of the total length of distribution lines. This is a more appropriate measure for rural DISCOMs.
Data Considerations Feedback from DISCOM personnel in the region indicated that the data required for the proposed measures should be readily accessible. Efforts would be required to compile and manipulate the data into the required forms from existing reports, but DISCOM staff could manage this provided that they are cooperative.
In collecting the data for these measures from DISCOM reports, some issues will emerge that require judgment, as in which outages should be omitted as being extreme events, which outages are beyond the control of the DISCOM, how to handle outsourcing of some maintenance functions to contractors in compiling maintenance personnel data, and how to handle gaps in the data on service restoration time. The benchmarking study team must develop a procedures manual, vetted by DISCOM personnel, that anticipates as many of these issues as possible to provide guidance in data collection. The pilot project will also confront these issues and further develop and organize future data collection efforts.
Recommended Approach to Data Collection Most of the data required to develop these measures should be available from existing DISCOM reports with some effort for compilation, analysis, and presentation in benchmarking form. The key to collecting this data is obtaining the cooperation of the DISCOM, as has been detailed earlier.
It must be recognized that even within a functional area, such as repair and maintenance, the data required to develop the measures may require sourcing from or coordination among several different organizational departments within the DISCOM that may not normally communicate well together. This has posed challenges at times in the experience of the
Concept Paper: Performance Benchmarks 3-9 for Electricity Distribution Companies in South Asia
Section 3 Proposed Functional Areas and Metrics for Benchmarking
authors of this report. Such issues must be handled through clear directives from the top level of the DISCOM, and in working with the different DISCOM departments, the benchmarking consultant team must exercise sensitivity to the potentially conflicting departmental objectives. Throughout the data collection process, the benchmarking consultant team and the DISCOM task force assigned to work with it must together have a clear vision of the objectives of the effort and the values to be obtained, towards overcoming organizational obstacles confronted in developing the data.
It must also be recognized that, when a DISCOM compares its own performance against benchmarks that are developed, some of these proposed metrics might be interpreted in multiple ways. For example, a high level of unplanned outages may be an indication of poor distribution infrastructure, or it may be the result of an upsurge in demand growth outstripping the capacity of the network. Consideration of ‘apples and oranges’ comparison issues is part of the process of using performance benchmarks. These issues must be discussed with the DISCOM during the data collection process.
3.3.2 Customer Service 3.3.2.1 Objectives and Challenges Customer service benchmarks should measure the quality and effectiveness of the DISCOM’s interaction with customers. The principal points of interaction occur when a customer (1) applies for new connection or a change of service, (2) receives his monthly bill and provides payment, or other communication related to billing, (3) contacts the DISCOM to obtain information, review his bill, request that his meter be checked, or make a complaint, and (4) receives or participates in a service provided by the DISCOM, apart from power supply (e.g., energy audit, DSM program, informational material, on-site testing, financing or installment payment program). Apart from billing and collections, these aspects of customer service are addressed by the benchmarks proposed in this section.
The quality of customer service is difficult to measure quantitatively, although this area has become one of the most important functional areas and highest priorities in developed country DISCOMs. This change began decades ago as increasing tariffs put a greater strain on public relations; now in many places, customer service may be a DISCOM’s principal means to establish competitive advantage. Yet it remains difficult to measure, and few standard benchmarks have been established. In the regulatory environment, many DISCOMs and regulatory bodies rely on a combination of customer satisfaction surveys and registered customer complaints as aggregate indicators of a DISCOM’s effectiveness in customer service. That is, these are the means used by regulators to assess whether a DISCOM’s expenditures on customer services are adequate, excessive, or too little. This performance measurement approach works in comparing a DISCOM’s progress in customer service from one year to the next, but is not an effective means to compare different DISCOMs.
Some DISCOMs have strong, performance-oriented incentives to induce improvements in customer service, which also suggest a basis for benchmarking. Their regulatory agencies have established penalties for missing customer service targets. The penalties are provided directly to the affected consumer as a credit against his bill. Examples of these targets include the following:
Advance notification of planned outages (e.g., within 3 working days)
Concept Paper: Performance Benchmarks 3-10 for Electricity Distribution Companies in South Asia
Section 3 Proposed Functional Areas and Metrics for Benchmarking
Response time to request for emergency service investigation/repairs (e.g., within 2 hours of request)
Keeping appointments set with a customer during contact calls or for inspections for supply applications (e.g., within 2 hours of scheduled time)
Time to activate new supply after satisfactory installation inspection (e.g., within 24 hours)
Reconnection after settlement of unpaid bills (e.g., within 24 hours of bill payment)
Time to resolve complaints (e.g., customer notification within 5 working days)
Response to service disruptions (e.g., restore service or inform customer when service restoration is expected, within 4 hours)
Restoration guarantee (e.g., service will be restored within 24 hours)
Achievement rates on these targets may not be reported to the regulatory agency, because they are self-policing provided that customers are informed of the targets and the credits due them if the DISCOM misses a target.
There are challenges in developing customer service benchmarks of this type for South Asian DISCOMs. Principally, most DISCOMs in the region are state entities operating in an unregulated or newly regulated environment: their business culture is supply-oriented and they are inexperienced with the demand-oriented, customer care orientation common among firms operating in competitive markets. Very few DISCOMs in the region have explicit performance targets for customers like those listed above.19 Hence, many would not have the data or internal reporting procedures required to develop the foregoing list of performance targets.
There are enough DISCOMs in the region with dedicated customer service functions that could provide a basis for benchmarks. Regulatory authorities have in some cases issued standards for connection services and complaint handling.20 Most DISCOMs at least maintain records of customer interactions that they could use to establish their standing against targets. In this case, the challenge is in identifying a set of performance targets that are appropriate for DISCOMs in the region today, which may be a brief list that can be broadened as the capability and standards of customer service improve over time.
The study team proposed benchmarks in three areas, as follows: (1) measures of performance in connection services, (2) measures of performance in complaint handling, and (3) other measures of customer service. These measures are presented below.
19 Some DISCOMs do, notably some of the privatized/unbundled DISCOMs in India and Sri Lanka. 20 The Delhi Electricity Regulatory Commission has recently issued draft regulations and standards that cover new
conections, existing connections, billing, metering, disconnection and reconnection, handling of meter complaints, meter testing, energy pilferage and other issues. They include penalties for excessive delay in providing new connections, for example. Other regulatory authorities are considering similar measures, or may have issued them already. Such initiatives are useful inputs to regional benchmark development. Yet as different regulatory bodies adopt their own standards, considering local DISCOMs and operating conditions, their disparate efforts underscore the need for regional benchmarks.
Concept Paper: Performance Benchmarks 3-11 for Electricity Distribution Companies in South Asia
Section 3 Proposed Functional Areas and Metrics for Benchmarking
3.3.2.2 Measures Of Performance In Connection Services Proposed Measures Performance measures for connection services generally focus on the amount of time required for a customer to obtain a new connection or other type of service related to his connection. From a customer’s perspective, this is a vital aspect of DISCOM service, whether in developed or developing countries. In some poorly served areas, it may require months to obtain service for a new building, while in well-served areas a new connection may be obtained within 24 hours, depending on the type of service. Alongside billing and repair issues, connection services are a significant source of customer complaints and hence a focus area for DISCOMs’ efforts at performance improvement.
The proposed performance measures focus on service response times. As described in the preceding section, several of the performance benchmarks in developed country markets go a step beyond service response time, tracking other measures such as keeping appointments for inspections. This level of detail is not expected in South Asian DISCOM records. The following list focuses on measures that many DISCOMs are expected to track in some form:
Lead-time to provide new connection: This is the time required to obtain power supply from the time that the customer submits the application to the DISCOM. From the DISCOM’s perspective, it is important to recognize that this should not include time lost if the customer’s application is not complete according to the DISCOM’s published requirements. Hence, the starting point is when the application is recognized as complete. The lead-time may need to be differentiated by the service type, because three-phase (i.e., commercial, industrial) connections typically have a longer lead-time than do single phase connections, and generally require a site inspection. But alternatively, the time may be considered from when an inspection results in approval.
Lead time to provide service upgrades or other changes to service: Changes to service include changes from single- to three-phase, voltage supply upgrades, increase in allowed peak demand, and the like, all of which require applications to the DISCOM. In most areas, the number of applications for changes to service exceeds the number of applications for new service. Hence from a customer perspective, this measure may be more important than the preceding one.
Lead time to restore connection upon payment following disconnection: This is an important measure in developed countries, where DISCOMs are readily able to disconnect service when a customer fails to pay his bills, particularly because it affects primarily the DISCOM’s service to the poor. The measure tracks the time required to restore power following the customer’s settlement of his account with the DISCOM.
Lead time to test or replace meters in case of request/complaint: This measure is not a typical benchmark, but is relevant in South Asia where many customers complain that meter readings are faulty and in fact many meters require recalibration or replacement. The DISCOM’s performance on this measure reflects on its commitment to accurate metering and ability to improve collections, as well as on its customer service.
Concept Paper: Performance Benchmarks 3-12 for Electricity Distribution Companies in South Asia
Section 3 Proposed Functional Areas and Metrics for Benchmarking
Backlog of service applications: This measure tracks the number of service applications in process, and may be normalized by the DISCOM’s total number of customers. It is an alternative measure to lead time, in case DISCOM data on lead-time is not available.
Data Considerations Generally, DISCOMs have responded that the data are available in their records, but may not be compiled in reports. This may imply that the measures would need to be developed from individual customer applications and account records. Towards developing the benchmark, the number of individual applications in a year would be too numerous for a census approach in DISCOMs that do not already compile the data for internal reports. For these DISCOMs, a sampling approach would be required until they have an established reporting procedure, with assistance in data collection from DISCOM staff.
DISCOMs may differ in their requirements for service applications, and in how they define when an application is sufficiently complete to initiate a service connection. This may affect comparisons of DISCOMs on connection lead-time. In practice, it is likely not feasible to differentiate DISCOM policies on service connection requirements in the context of benchmark studies. In most cases, different offices within a single DISCOM may apply or enforce their requirements for service applications somewhat differently. It may be appropriate to use a macro view of lead time, considering that incomplete applications are also at least partly function of inadequate communication to customers about DISCOM requirements.
Regarding the lead time to test or replace meters, this is a worthwhile measure, but DISCOMs in the region would differ considerably in both their reporting and response practice regarding customer requests for meter checks. It may be more feasible to approach this indicator by considering the number of field inspections of meters, and the number of replacements, whether they are initiated by a customer request or not (see the measures proposed under metering, in Section 3.3.3.2). In this case, the field inspection must be defined as including a calibration check, and not simply an inspection of the seal to assess whether tampering has occurred. In this case, the number of inspections or replacements should be normalized against the number of customers.
The backlog of service applications, meaning the number of applications in process at a given time, may be better expressed as a ratio between the number of applications completed to the number of applications in process.
Recommended Approach to Data Collection We may assume that for most DISCOMs, the data is not currently compiled in reports and therefore must be developed for a benchmarking project. DISCOMs will also differ in the extent and structure of their computerized customer databases. Whereas essentially all DISCOMs have computerized billing, for many, the customer billing database does not store all the customer account data, such as the data about initiating or changing service. Much of this data may be stored in paper files at district or distribution zone offices.
This implies a labor-intensive data collection process. However, the labor required is less than may first appear, due to the application of sampling and due to the ability to address a
Concept Paper: Performance Benchmarks 3-13 for Electricity Distribution Companies in South Asia
Section 3 Proposed Functional Areas and Metrics for Benchmarking
number of different benchmarking measures simultaneously when reviewing customer records. For the measures of service connection lead time, for example, under a random sampling process, fewer than one hundred data observations would suffice for a DISCOM, using statistical analysis of results. Obtaining access to the detailed customer data in local offices may be more challenging than the labor requirement for data collection.
It is recommended that for the pilot project, the benchmarking consultant team include a local survey research firm, to manage the costs of data collection and facilitate the DISCOM’s participation. With each participating DISCOM, following execution of the agreement for participation, the consultant team must meet with DISCOM managers to plan the data collection effort, including identification of data that requires review of paper records, and identification of a limited number of offices where that will occur.
3.3.2.3 Measures Of Complaint Handling Proposed Measures Complaint handling is an important function of customer service and is a key indicator of service quality for many regulatory commissions in developed countries. Yet many South Asian DISCOMs effectively have no formal mechanism to record, process, or respond to complaints. In India, the Electricity Act of 2003 includes a specific provision that orders states to create a forum for consumers to express their grievances—an indicator that many Indian DISCOMs have insufficient means of complaint expression. Nevertheless, some DISCOMs in the region—particularly the private DISCOMs, but also some public DISCOM entities—have developed formal processes of customer care and dedicated centers to field and process complaints. Hence, the range of performance in the region is quite broad.
The following measures were proposed:
Complaint response time: Taking the consumer’s perspective, this is the time from submission of the fault complaint to an action by the DISCOM toward resolving the complaint (such as the arrival of service personnel to address the issue, rescheduling of a service call, and satisfactory clarification of a payment dispute).
Complaints handled annually/100 customers: This measure provides the volume of customer complaints, normalized by the number of customers. The measure is better characterized as an indicator of customer satisfaction rather than effectiveness of handling complaints.
Litigation cases initiated per year: In this case, the litigation cases must be differentiated to focus on those relating to customer service and DISCOM services.
Customer care staffing level/100 customer: This is an indicator of the effort and resources devoted by the DISCOM to customer service, which must be carefully differentiated from other services such as maintenance and repair.
Data Considerations Many DISCOMs have no formal tracking mechanism for complaints or response. Having such a system, in it-self, is an indication of customer service commitment. The following comments apply to specific measures.
Concept Paper: Performance Benchmarks 3-14 for Electricity Distribution Companies in South Asia
Section 3 Proposed Functional Areas and Metrics for Benchmarking
Complaint response time: Much variation is expected in response time, and it is likely that relatively few DISCOMs could provide the associated data. Nevertheless, data from these DISCOMs would provide useful reference points for others that do not yet track their performance or that are now in the early stages of developing their customer care capabilities. Some DISCOMs with well-regarded customer complaint handling infrastructure include Lanka Electric, North Delhi Power, Andhra Pradesh Central Power, Tata Electric (Mumbai), and others.
Complaints handled: Wide variation in reporting practice is expected for this measure. There may be definitional differences in characterizing what is a complaint, considering varying differentiation between billing inquiries, contested bills, fault notices, spurious complaints, faulty meter reports, information requests, and other types of customer contacts. This must be more closely examined with participating DISCOMs. It may be necessary to reclassify this from complaints to a broader definition, such as to customer contacts excluding only bill payments.
Litigation cases: Data access may be poor for this. Differences in legal processes among entities and countries may also complicate comparisons.
Level of customer care staffing: This data is expected to be available. However, one needs to define what is a ‘customer care person’ such as whether this includes people working at the counter of a payment center, who may also be responsible for handling billing complaints. One reviewer was concerned about difficulties in segregating customer care staff from field staff.
Recommended Approach to Data Collection The principal approach must be to work with the senior management of each participating DISCOM to define the scope of customer service functions, the departments where they are managed, and field locations of customer service functions. This would be followed by consultation with department managers to identify logging procedures of customer contacts, internal reporting, and the extent of data available that may not be compiled into reports. We expect there will be little primary data, except among DISCOMs with developed customer care facilities. These may provide best practice benchmarks. However, many DISCOMs could identify employees who have responsibilities for customer contact and handling of customer complaints, toward establishing performance benchmarks on the level of customer care staffing.
3.3.2.4 Other Measures Of Customer Service Proposed Measures The proposed measures for connection services and complaint handling of complaints do not necessarily cover all-important facets of a DISCOM’s customer service performance. Many regulators and DISCOMs are interested in broad measures of customer satisfaction as an indicator of service performance. In some American states, this survey-derived benchmark is one of the most important indicators of service performance.
Other measures consider levels of DISCOM resources offered to customers via services other than connections and complaint handling. Many DISCOMs now provide a broad array of services that may include product promotions, training or consumer education programs, energy audits and DSM programs, power factor correction services, diagnostic fault testing
Concept Paper: Performance Benchmarks 3-15 for Electricity Distribution Companies in South Asia
Section 3 Proposed Functional Areas and Metrics for Benchmarking
services, technical assistance in lighting system design, pump testing, and so on. These services have become increasingly important as DISCOMs compete for customers.
Given these considerations, following are measures proposed for South Asia during this study:
Customer access to services: This measure considers ease of access to the DISCOM as an indicator of customer service. It may be measured as the number of access points normalized by number of customers.
DISCOM staff resources providing special services (energy audits, DSM, on-site testing): Personnel staffing levels devoted to these activities are the indicator for these activities, considering that output-oriented benchmarks may be difficult to standardize.
Standardized customer satisfaction index: This measure would be based on a standardized market survey that may incorporate consumer responses to a number of service-related questions.
Data Considerations Customer access points: For most DISCOMs, customer access points are principally
the district offices, perhaps distinct payment centers, and call-in centers, while some also provide web-based services. It may be challenging to enumerate these, and possibly better to indicate the range of types of access points.
Special services: This is a good measure, and the benchmark should list the services that are offered. Relatively little DSM is expected as yet from most South Asian DISCOMs, but there may be on-site testing or other services in some DISCOMs, and it would be informative to disseminate examples of these customer services. Perhaps the benchmark could simply indicate the presence of various types of services, as in checks against a matrix.
Customer satisfaction index: There is considerable agreement about the value of survey-based techniques to measure overall customer satisfaction. However, it is difficult to implement this approach as a benchmark, because this would imply a common, coordinated market research effort in geographically dispersed DISCOMs. In practice, individual DISCOMs have different ideas of what they want to ask customers toward assessing customer satisfaction, and have differing approaches to survey research.
Recommended Approach to Data Collection Difficulties are not expected in collecting this data for the first two of these measures, once cooperative links are established with the DISCOM, as the data should be readily available. It may be useful to note whether DISCOMs employ formal market survey approaches to measure overall customer satisfaction. This latter aspect may be explored further during the pilot phase.
Concept Paper: Performance Benchmarks 3-16 for Electricity Distribution Companies in South Asia
Section 3 Proposed Functional Areas and Metrics for Benchmarking
3.3.3 Metering, Billing and Collection 3.3.3.1 Objectives and Challenges This area is known to have many examples of deficiencies in the region, and the benchmarks clearly must establish both targets for improvement and expectations for reasonable performance. The objective of the measures is to establish standards for performance throughout the revenue collection process. That includes benchmarks for measuring consumption accurately, transmitting meter data to the DISCOM billing department, bill processing and dispatch, revenue collection and payment processing. Although some of the proposed measures may expose problems over which management has little control, in most cases there is scope for improvement both through investment in facilities and changes to work processes.
The study team proposed benchmarks in three areas, as follows: (1) metering effectiveness, (2) billing effectiveness, and (3) collection effectiveness. They are presented below.
3.3.3.2 Measures Of Metering Effectiveness Proposed Measures The customer meter is a critical resource for DISCOMs, as it enables both internal accounting of losses on the distribution system and proper accounting of sales to customers. Metering deficiencies are common throughout the region, as in most developing economies, and in contrast to developed country power systems. Consumption is typically not metered for large numbers of customers (particularly rural customers), who may pay a highly subsidized flat-rate tariff based on the rated capacity of the connection. Installation of meters at all customer sites is a basic prerequisite for effective tariff reform and progress toward financial sustainability for these DISCOMs. Malfunctioning and tampered meters are also common problems that cause inaccurate sales recognition and insufficient revenue collection. This and the prevalence of visible line tapping indicate a lack of accountability among meter readers that is broadly a symptom of poor metering effectiveness.
The proposed measures are intended to evaluate issues of metering accuracy, precision, and the extent that meters are used to measure electricity consumption (i.e., the extent that tariffs are consumption-based). These are considered to be principle issues relevant to the effectiveness of revenue collection for South Asian DISCOMs. The proposed measures include:
Meter coverage: The measure is expressed as the portion of all customer accounts for which electricity consumption is metered.
Adequacy of meter reader staff: This benchmark is expressed as the number of meter readers normalized by the number of customers (meter readers per customer).
Average age of meters: This measure is intended as an approximate indicator of meter accuracy. In this context, it may be expressed as the average period of time in service between service overhauls or recalibration, if the data are available. This matter may be considered further during the pilot phase.
Meter replacement rate: This measure may be expressed as a turnover rate, as the number of meters replaced in a year as a portion of the total meters in service.
Concept Paper: Performance Benchmarks 3-17 for Electricity Distribution Companies in South Asia
Section 3 Proposed Functional Areas and Metrics for Benchmarking
Frequency of meter and seal inspection: This measure may be developed from the number of inspections as a portion of the total meters in service, or estimated by the average number of meters inspected per person-day multiplied by the number of inspectors.
Frequency of meter calibration: This may be measured as the number of calibrations performed in a year divided by the number of meters in service.
Service inspection frequency: To assure accurate metering and billing, and to detect unauthorized connections, customer connections should be inspected periodically.
None of the proposed metrics measures meter accuracy directly. They infer the quality of metering practice on the basis of indicators, and provide benchmarks for good meter maintenance practice. Direct measurement of metering accuracy would be beyond the scope of benchmarks, though would be a valuable study for individual DISCOMs to undertake.
Data Considerations Most of the proposed measures are clearly defined and the data should be available from DISCOMs given cooperation from the operating departments. The following are measure-specific considerations.
Meter coverage: In most cases, only specific customer classes allow connections without meters (most typically agricultural and certain household or exterior lighting accounts). Data on the number of these customer accounts will be readily available. However, it must be noted that this figure will understate actual meter coverage in DISCOMs where unauthorized connections (line taps, theft) are prevalent. In some DISCOMs, theft accounts for a significant share of consumption, most of it on unmetered connections or on connections with tampered meters. Expansion of meter coverage is an important means to allow improved internal energy auditing, by which the DISCOM is able to track energy flows from substations to customers and detect theft. On this point, it should be mentioned that while this measure focuses on meter coverage of customer accounts, meter coverage at substation and feeder levels is also important. This is a distinct measure, and should specify working meters rather than meters in place, as in many cases the meters are present but either out of calibration or nonfunctional.
Meter reader adequacy: This benchmark may be misleading as several factors affect the required meter reader staffing level. For example, in rural areas with high meter coverage, readers cannot cover as many customers as in urban areas with high customer density. Readers equipped with automated tools, as some DISCOMs in the region now have, are more productive and can cover more customers. In some areas, the number of meter readers is defined by an agreement between the DISCOM and the workers union; DISCOM management may have little influence on the staffing level in these cases.
Average age: While many DISCOMs may keep a serialized record of meter installations linked to customer accounts, this data would likely be difficult to access to estimate an aggregate average age of meters in service. DISCOM participants may instead provide estimates based on field experience, which would have no assurance
Concept Paper: Performance Benchmarks 3-18 for Electricity Distribution Companies in South Asia
Section 3 Proposed Functional Areas and Metrics for Benchmarking
of accuracy. A more reasonable estimate may be derived from the number of meters in service divided by the average annual number of meters replaced (averaged over a period of three to five years). The number of meter replacements should be available from repair or meter stores departments of the DISCOM.
Frequency of inspections (meter, meter seal, service) and calibration: Inspections are an important means to assure meter accuracy and detect theft. However, many DISCOMs assign this task to meter readers, and they may claim that inspections of meters and seals, for example, thus occur on every site visit. In many cases, this belies the prevalence of line taps, broken seals and tampered meters. These measures should focus on inspections by personnel independent of meter reading. Or they should focus instead on remedial actions (e.g., seals replaced, faulty meters replaced or recalibrated). It is important to note a best practice in the region regarding meter reading, in which meter readers in Bangladesh rural cooperatives are shifted periodically so that they maintain their objectivity and are never assigned to a route long enough to develop theft-complicit relationships with customers. The success of this practice also underscores the importance of independence in service inspections.
Recommended Approach to Data Collection As indicated, most of the proposed measures should not present data collection challenges, except for the data on inspection frequency, which may require judgment. Cooperative participation of DISCOM personnel from operating departments—meter repair, meter stores, for example—is important. Most of the data should be available in aggregate form from internal DISCOM reports.
3.3.3.3 Measures Of Billing Effectiveness Proposed Measures The elements of an effective billing process include: (a) accurate transmission of meter data and application of charge (tariff) components, (b) short processing time, (c) reliable delivery, and (d) understandable bills (from the customer’s perspective). Of these, performance benchmarks can most readily address processing time and billing accuracy, while data sources toward evaluating delivery effectiveness may be investigated at the early stage of the proposed pilot benchmarking activity. The proposed measures include the following:
Frequency of provisional billing: Many DISCOMs do not read customer meters every billing cycle, but estimate consumption from historical patterns and bill accordingly. Errors that result from this practice are self-correcting once the meter is read, but the practice causes temporary inaccuracies and disturbs customers. The measure may be expressed as the portion of estimated bills or as the average number of billing cycles that are estimated.
Frequency of billing errors: The rate of errors may be measured as a percentage of bills processed. The billing department should detect the majority of billing errors internally before a bill is issued (e.g., based on a consumption reading that does not follow a customer’s billing history), but also may be reported by customers.
Bill processing time: This measure is the average number of days that transpire from the meter read date until bill issuance or delivery.
Concept Paper: Performance Benchmarks 3-19 for Electricity Distribution Companies in South Asia
Section 3 Proposed Functional Areas and Metrics for Benchmarking
Frequency of bill delivery errors: In some DISCOMs, bill delivery is problematic, particularly in zones where power theft is prevalent. In some areas of Delhi, for example, customers complain that they do not receive bills regularly, although the DISCOMs claim that all bills are issued on a monthly cycle.
Data Considerations Most DISCOMs have practices in place to reduce billing errors and manage the bill processing cycle. They may have policies or targets for error rates and processing time, but may not measure performance against the targets or may do so infrequently. These observations suggest some difficulties in collecting data that must be overcome. The following are measure-specific data considerations.
Provisional billing: This may be a well-defined practice for some DISCOMs, where for specific customer classes, for example, meters are read every second month and bills are estimated for the in-between months. In other cases, bills are estimated because the reader was unable to gain access to the meter during his site visit. If this becomes a common practice and not rectified where meter access is chronically unavailable, this is a problem. Yet it is a common problem in some areas, affecting a relatively large portion of customers. It is more difficult to collect data on this second type of bill estimating practice. The meter reader log books must be consulted to determine how many readings were made over a given period on an account-specific basis; even this approach would not work if the reader records his own estimates and does not note that he was unable to read the meter. This estimation approach could be accomplished on the basis of an account sample, but needs evaluation in consultation with DISCOMs during the pilot phase.
Billing errors: It is expected that in most DISCOMs, there is a process to screen bills and identify billing errors (whether automated or by inspection). These processes exist at a minimum to prevent the most obvious errors, such as a meter reading that indicates negative consumption compared to the previous reading, or a bill that is orders of magnitude greater than previous bills. However, most DISCOMs probably correct identified errors on the spot without keeping a record of them or their frequency. The study team recommends that this benchmark be discussed with DISCOMs during the pilot phase toward establishing a feasible data collection approach or an alternative measure.
Bill processing time: DISCOM billing departments keep records of the meter reading date and the bill issue date for each customer account. Hence the raw data would be available, but may not be stored in a way that supports easy and systematic access to determine bill processing time. If not, then the customer account data may be sampled to estimate total bill processing time.
Recommended Approach to Data Collection Both the frequency of provisional billing and the duration of bill processing are performance benchmarks that are clearly defined, are relatively easy to measure from existing data, and are actionable (toward performance improvement) by DISCOM managers. These measures are recommended to be developed from existing customer accounts data and billing department reports, on a sample basis if required for the measure of average bill processing time.
Concept Paper: Performance Benchmarks 3-20 for Electricity Distribution Companies in South Asia
Section 3 Proposed Functional Areas and Metrics for Benchmarking
While the rate of billing errors gets at the root of the problem of billing effectiveness, it is expected to be more difficult to establish procedures for consistent reporting of errors by participating DISCOMs, and hence more difficult to use this as a benchmark. However, this may be investigated further in the proposed pilot project.
3.3.3.4 Measures Of Collection Effectiveness Proposed Measures Collection effectiveness refers to the DISCOM’s ability to collect payment in a timely manner against the bills it issues. Performance is complicated in the region by DISCOMs’ restricted recourse for nonpayment or delayed payment: limited legal recourse to recover unpaid bills, inability to write-down bad customer debts or negotiate payments, effective inability to disconnect non-paying customers (e.g., for political reasons). These difficulties can be most problematic with the DISCOM’s supply to government facilities. For this reason—the existence of ‘problem’ customer classes in contrast to collections from most customers—it may be advisable to segment performance among customer types so that it focuses on processes that the DISCOM management can control or influence.
Apart from these challenges, the measures should also reflect best practices toward streamlining the collections process. For example, the traditional approach to revenue collection was that the DISCOM issues a bill and waits for the customer to pay in person at the nearest district office. Many DISCOMs have made bill payment much easier for customers in an effort to reduce the collection period, such as by accepting payment at other locations such as bank branches, at ATMs, at selected merchants, by credit card over the internet or telephone, and by pre-pay card.
The proposed measures include the following:
Average level of customer arrears: This measure, expressed in days, would be more useful to DISCOM managers if the customer distribution were segmented into groups, such as quartiles, and the average arrears reported for each segment.
Collection efficiency: This measure tracks chronic shortfalls in collections, expressed as the DISCOM’s average monthly revenue collected divided by average monthly billings.
Number of payment processing points/100 customers: This measure aims to express the DISCOM’s efforts or resources employed to facilitate payment and reduce the collection time.
Data Considerations Arrears: Average arrears may be estimated, and is appropriate as a source of a
benchmark. For a DISCOM’s internal purposes, a distribution of arrears is a better measure, but this is difficult to use in benchmarking because participating DISCOMs often develop differing targets for arrears reduction among customer groups and hence have differing measurement needs. Nevertheless, a DISCOM’s IT system offers a powerful tool toward reducing customer arrears and detecting theft. For example, with suitable software modifications, customer arrears could be segmented by customer class or by geographic distribution zone toward developing theft prevention strategies.
Concept Paper: Performance Benchmarks 3-21 for Electricity Distribution Companies in South Asia
Section 3 Proposed Functional Areas and Metrics for Benchmarking
Collection efficiency: This measure focuses on current collection efficiency, whereas arrears may also reflect customer debt balances that are gradually being paid off. In principle, this measure of collection efficiency is easily determined from recorded revenues (cash and checks received) and current accounts receivable (billings).
Payment processing points: This may be difficult to enumerate if there are many modes of payment possible.
Recommended Approach to Data Collection Initially, for many DISCOMs, this data may be collected manually from existing reports. The process would be far more efficient if DISCOM accounting software were modified to report the performance measures directly. In time, participating DISCOMs may see the value of this capability as they use the benchmarks to improve their operating performance.
3.3.4 Financial Performance 3.3.4.1 Objectives and Challenges Difficulties exist in the accuracy and comparability of financial data, given the differences in financial structures, and government involvement. Many DISCOMs are still being integrated financially with transmission and generating units, and many assets are not properly valued, etc. Also, financial data may not be reliable (e.g., antiquated valuation methods), unavailable (because they cannot be separated from consolidated financial statements that incorporate non-DISCOM units), or meaningful (due to differences in accounting practices).
3.3.4.2 Indicators Of Profitability and Capital Sustainability Proposed Measures The financial performance parameters that investors and creditors require toward assessing risk and expected returns are well established. The study team was informed that one of the Indian credit rating agencies has already made an initial study toward financial benchmarking in the electric utility industry. However, most DISCOMs in the region are public entities that do not raise capital in financial markets, and do not prepare financial reports that can readily be used to produce standard benchmark indices under conventional definitions. For this reason, the proposed metrics include both standard financial ratios used to indicate profitability and alternative measures that indicate relative capital sustainability. The proposed measures include the following:
Cost recovery index: This benchmark measures the DISCOM’s ability to recover its total long-run costs via operating revenues. It is the ratio of total operating revenues to total costs including capital costs.
Capital reinvestment rate: This measure, expressed as the ratio of average annual capital expenditures to net book value of distribution assets, aims to obtain an indicator of capital sustainability. It may be more consistent with the social objectives of government-owned DISCOMs than the typical financial parameters indicated below, and is intended to measure financial performance in terms of maintaining the value of distribution infrastructure. While data should be available but subject to definitional differences in financial reporting.
Concept Paper: Performance Benchmarks 3-22 for Electricity Distribution Companies in South Asia
Section 3 Proposed Functional Areas and Metrics for Benchmarking
Commercial losses: This measure may be expressed as the ratio of estimated commercial losses to total sales. Commercial loss estimation is discussed in Section 3.3.1.3.
Customer receivables/monthly revenue collections
Return on assets
Cost of capital
Debt service ratio
Data Considerations Much of this data may be available for many companies, though it will be difficult to compare private companies to public ones. There are challenges in separating out data to distribution functions only, both for public and private firms. Public company data may not be accounted or organized in a manner oriented to private market conventions, and it may require too much effort to make the data meaningful (that would be a job beyond the scope of a benchmarking project, and more suited to a financing project).
Recommended Approach to Data Collection A benchmarking project should not undertake a task that requires extensive normalization of participants’ financial reports to meet international accounting standards as a means to develop useful financial benchmarks. This process would be both expensive and excessively time-consuming. Hence the study team recommends focusing on three measures for which data are expected to be available with least degree of definitional conflicts. The measures include a cost recovery index, an indicator of capital sustainability (i.e., annual capital expenditures compared to value of assets), and an indicator of revenue realization (customer receivables compared to actual collections). For most DISCOMs, the data required for these measures are readily available (once the DISCOM is a confirmed participant and disclosure or confidentiality issues are resolved).
The second measure is the most likely to present a challenge, in the approach required to value existing assets toward assessing capital sustainability. Throughout the region, and indeed throughout the world, distribution assets tend to be significantly undervalued on the books, due to their long life and changes in construction costs over their lifetime. During the initial phase of the pilot project, when the benchmarks are being vetted further with DISCOMs, this measure and alternative approaches to asset valuation should be considered further. The selected approach should emphasize simplicity, such as by estimating replacement value of distribution assets using standard construction cost estimators that are used in the region, or by simplifying the measure further by dividing average annual capital expenditures by the length of the distribution network. These and other approaches may be considered in consultation with the DISCOMs.
3.3.4.3 Measures Of Competitiveness Proposed Measures DISCOM customers are generally not mobile and have no other supplier available to provide power at a lower price. However, many parts of the region face chronic problems with power reliability and availability, particularly in rural areas, and these factors lead some customers
Concept Paper: Performance Benchmarks 3-23 for Electricity Distribution Companies in South Asia
Section 3 Proposed Functional Areas and Metrics for Benchmarking
to develop their own generating capacity. Tariff rates are certainly important to most customers as they compare self-generation costs to the benefits of more reliable power supply.
While DISCOM managers generally have no influence over tariff levels, it is important for them to be aware of the competitiveness of their tariffs. The following metrics have been proposed toward measuring competitiveness:
Average retail tariff: This value, evaluated across customer classes, may be developed from overall sales revenue and energy sales.
Average tariff levels for industrial, commercial, domestic, and agricultural customer classes: These should be expressed in terms of total sales revenue per unit, so that all aspects of charges are encompassed into an equivalent energy charge.
Energy and non-energy shares of average tariff levels.
Cost of self-generation: This measure aims to express a reference value or range of values for a competing cost of electricity service available to some customers.
Data Considerations Data on tariffs are readily available from official tariff orders that are kept by the DISCOM, regulatory agency, and power ministry. The data required to transform the multiple components of tariffs into single values for each customer class will require assistance from the DISCOM to assemble aggregate revenue and sales data for each customer group. However, these data should also be readily available from DISCOM reports.
Developing a cost of self-generation would be problematic for many reasons in the context of benchmarking. The cost of self-generation depends on many factors that are specific to a location and customer conditions. Critical factors include the type of primary fuel and its delivered cost and heat content, the self generation technology, the generation unit’s capacity, the customer’s operating regime or duty cycle, whether the unit provides other energy benefits that affect its net generating cost (e.g., as in cogeneration), whether capital or other subsidies are available, and so on. The variability of these factors makes it extremely difficult to provide a useful cost range that is relevant for a benchmark that applies to an entire region, like South Asia, although individual DISCOMs may develop useful ranges given the constraints inherent in their area.
Recommended Approach to Data Collection With the cooperation of participating DISCOMs, the equivalent average energy tariffs may be developed for each of the major customer classes and for customers in aggregate. These figures may be compared to the energy component of customer tariffs as well.
3.3.5 Operational Cost Control 3.3.5.1 Objectives and Challenges Most DISCOMs have little data on their peers by which to measure their performance on operational costs or reasonableness of staffing levels. The proposed measures aim to focus on factors where management can exercise some control—for example in staffing levels,
Concept Paper: Performance Benchmarks 3-24 for Electricity Distribution Companies in South Asia
Section 3 Proposed Functional Areas and Metrics for Benchmarking
training, procurement and stores inventory practices, etc.—and to provide information about norms in other areas that managers may influence only over the long term.
The collection and presentation of this data pose challenges due to (a) confidentiality concerns and (b) interpretation of existing accounting and reporting practices. Confidentiality concerns are addressed in the approach to the pilot project described in Section 5. Individual measures may pose interpretation issues as participants try to ‘fit’ DISCOM data to benchmark data requirements.
3.3.5.2 Measures Of Distribution Cost and Personnel Management Proposed Measures Cost and personnel management are vast subjects that can easily become intricate in the details. From the perspective of an initial benchmarking effort, managers need broad indicators that illuminate key concerns about overall distribution cost, relative importance of key cost components, the adequacy of the overall labor force, and practices related to human resources development and maintenance cost management. Many other parameters could be developed at a more detailed level, but these may be best addressed within individual DISCOMs, or in post-pilot phases of benchmarking development.
The following measures have been proposed:
Distribution cost per unit (excluding cost of purchased energy)
Functional shares of non-energy distribution costs
Total employment level/customer
Total labor cost/customer
Maintenance expense/capital expenditures
Maintenance expense/book value of distribution assets
Training participation per 1,000 employees
Sick and injury days per 1,000 employees
Data Considerations Individual companies allocate costs differently, and this complicates the development of cost-related benchmarks from many DISCOMs. For this reason, particularly at the pilot stage, cost data need to be collected at aggregate levels, as indicated for total distribution cost and total labor cost.
Some cost trends are likely to become apparent as the benchmarks are developed, suggesting approaches to disaggregate the benchmarks into groups to make them more useful to DISCOM participants. For example, unit labor costs are typically lower in rural than in urban areas. Equipment costs will be less where they are manufactured locally in large volumes. Several categories of distribution costs may be relatively high in areas prone to extreme weather or other local conditions. These considerations must be considered in the selection of participant DISCOMs for a pilot project and in the presentation of benchmarking results.
Cost comparisons among DISCOMs from different countries also must contend with differences in currencies, labor market conditions, import restrictions that may affect costs,
Concept Paper: Performance Benchmarks 3-25 for Electricity Distribution Companies in South Asia
Section 3 Proposed Functional Areas and Metrics for Benchmarking
and other factors. At this stage, it is not clear to what degree these factors will complicate comparisons or benchmark development, and this issue is left to the pilot project for further discussion.
It was apparent during the vetting process for this Concept Paper that benchmarks for distribution cost components represent a new and interesting subject, and one that the respondents were not prepared to consider in detail. It is recommended that, during the initial preparations of the pilot project, distribution managers of several DISCOMs be engaged to explore further their objectives and recommendations for additional performance measures.
Recommended Approach to Data Collection The measures selected for developments in the pilot project emphasize aggregate-level cost categories rather than detailed cost components. This approach minimizes interpretive differences and makes the benchmarking effort more manageable. This data should be readily available from participating DISCOMs. It will be important during the pilot project, particularly during the proposed Phase 1 to work closely with DISCOM cost accounting managers and explore the potential for developing more detailed cost management measures. This may result in a larger array of cost management benchmarks developed during Phase 2 of the pilot project.
Concept Paper: Performance Benchmarks 3-26 for Electricity Distribution Companies in South Asia
Section 4 Recommendations for Benchmarking Metrics
4.1 Selection Of Metrics For The Pilot Project The study team proposed the metrics described in Section 3 on the basis of industry practice, findings from a literature review, professional judgment, and inputs of DISCOM representatives in the region. A list of proposed metrics was distributed during a vetting cycle, to Nexant SARI/Energy office managers and others who met informally with DISCOM personnel in Bangladesh, India, Nepal, and Sri Lanka to obtain direct feedback on the list, or commented on the basis of their own experience. 21 This feedback was the basis for the selection proposed below.
It should be noted that, in reviewing the proposed list of metrics, respondents were somewhat overwhelmed by their scope. There is very limited experience with performance benchmarking of this type in the region, and this makes it difficult for managers to prioritize or comment on some of the proposed measures, save to indicate data availability issues.
A more formal approach to benchmark vetting is proposed in the lead-up to a pilot project for this reason, in a workshop setting where issues may be discussed in detail and we may provide more context about how benchmarks should be used. In this respect, the list of measures that are developed in the pilot project may differ from that presented below.
4.2 Recommended Benchmark Metrics During the preparation of this report—in background review and discussions with DISCOM personnel—more than 100 prospective metrics were considered to address performance measurement in the five functional areas that were assigned. From the outset, this effort has recognized the difficulties in collecting the data required to develop performance benchmarks for DISCOMs in the South Asia region, as well as the need to address aspects of distribution operations that are unique to the region. We also recognize that a pilot project must limit the scope of measures, considering the risk in its first-of-a-kind effort for the region, and that its value is largely in proving an effective process so that future efforts may expand its reach. Hence, we have reduced the scope to the thirty benchmark metrics shown in Table 4-1.
It is likely that other useful measures may be proposed by DISCOMs during the pilot project, after they have received training and are better able to think about benchmarking and performance measurement in the context of records now kept, and their objectives for performance and service improvement. The pilot program described in Section 5, through its introductory training events and its structure in two phases, provides a means to refine both the scope of metrics and data collection approaches.
21 The survey form is provided in Appendix A.
Concept Paper: Performance Benchmarks 4-1 for Electricity Distribution Companies in South Asia
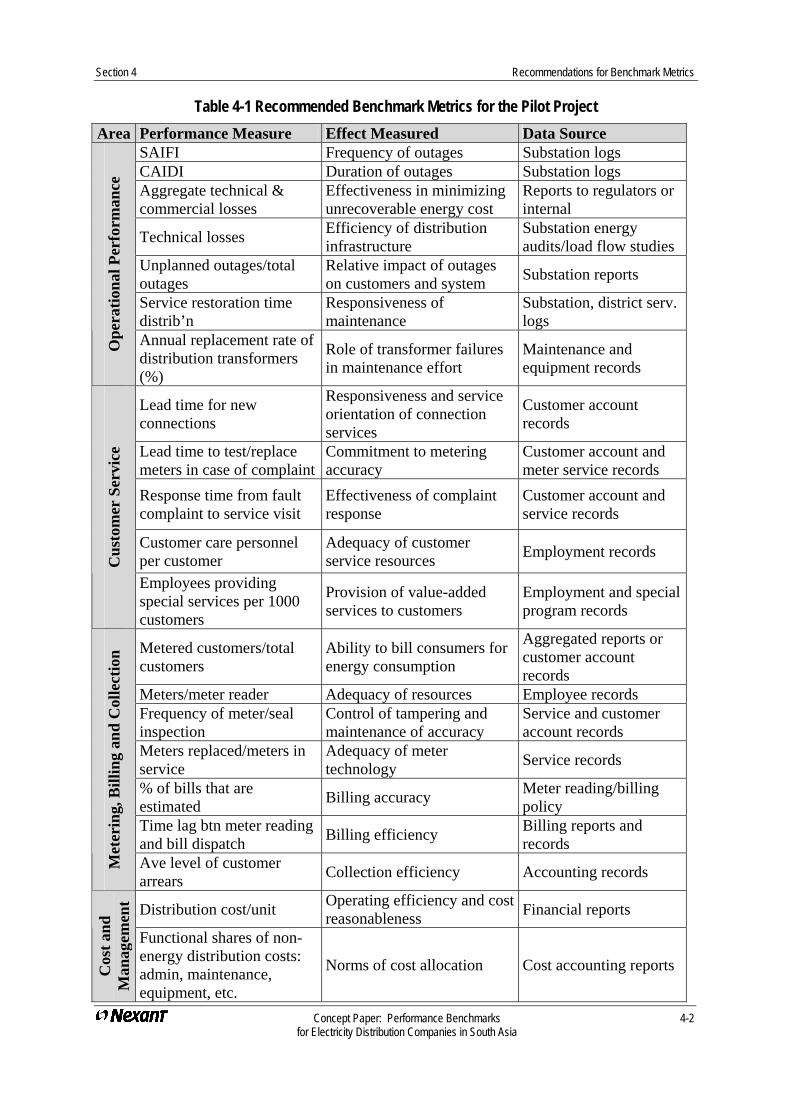
Section 4 Recommendations for Benchmark Metrics
Concept Paper: Performance Benchmarks 4-2 for Electricity Distribution Companies in South Asia
Table 4-1 Recommended Benchmark Metrics for the Pilot Project Area Performance Measure Effect Measured Data Source
SAIFI Frequency of outages Substation logs CAIDI Duration of outages Substation logs Aggregate technical & commercial losses
Effectiveness in minimizing unrecoverable energy cost
Reports to regulators or internal
Technical losses Efficiency of distribution infrastructure
Substation energy audits/load flow studies
Unplanned outages/total outages
Relative impact of outages on customers and system Substation reports
Service restoration time distrib’n
Responsiveness of maintenance
Substation, district serv. logs
Ope
ratio
nal P
erfo
rman
ce
Annual replacement rate of distribution transformers (%)
Role of transformer failures in maintenance effort
Maintenance and equipment records
Lead time for new connections
Responsiveness and service orientation of connection services
Customer account records
Lead time to test/replace meters in case of complaint
Commitment to metering accuracy
Customer account and meter service records
Response time from fault complaint to service visit
Effectiveness of complaint response
Customer account and service records
Customer care personnel per customer
Adequacy of customer service resources Employment records
Cus
tom
er S
ervi
ce
Employees providing special services per 1000 customers
Provision of value-added services to customers
Employment and special program records
Metered customers/total customers
Ability to bill consumers for energy consumption
Aggregated reports or customer account records
Meters/meter reader Adequacy of resources Employee records Frequency of meter/seal inspection
Control of tampering and maintenance of accuracy
Service and customer account records
Meters replaced/meters in service
Adequacy of meter technology Service records
% of bills that are estimated Billing accuracy Meter reading/billing
policy Time lag btn meter reading and bill dispatch Billing efficiency Billing reports and
records
Met
erin
g, B
illin
g an
d C
olle
ctio
n
Ave level of customer arrears Collection efficiency Accounting records
Distribution cost/unit Operating efficiency and cost reasonableness Financial reports
Cos
t and
M
anag
emen
t
Functional shares of non-energy distribution costs: admin, maintenance, equipment, etc.
Norms of cost allocation Cost accounting reports
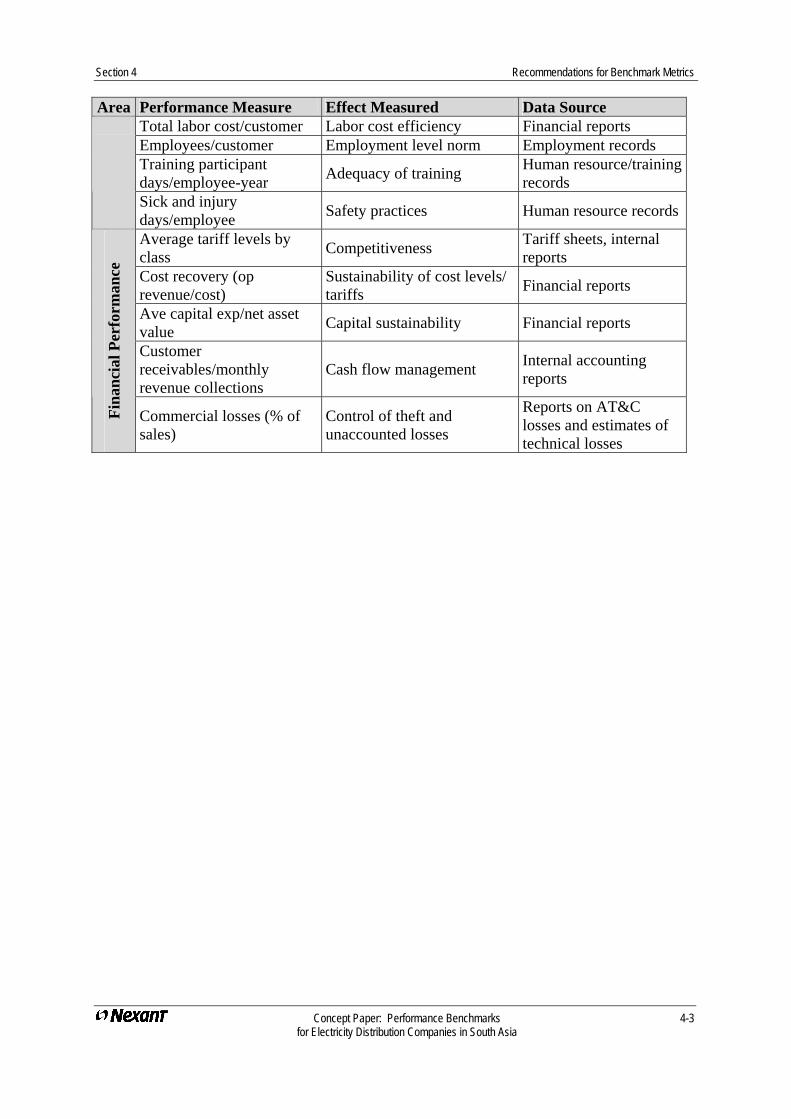
Section 4 Recommendations for Benchmark Metrics
Concept Paper: Performance Benchmarks 4-3 for Electricity Distribution Companies in South Asia
Area Performance Measure Effect Measured Data Source Total labor cost/customer Labor cost efficiency Financial reports Employees/customer Employment level norm Employment records Training participant days/employee-year Adequacy of training Human resource/training
records
Sick and injury days/employee Safety practices Human resource records
Average tariff levels by class Competitiveness Tariff sheets, internal
reports Cost recovery (op revenue/cost)
Sustainability of cost levels/ tariffs Financial reports
Ave capital exp/net asset value Capital sustainability Financial reports
Customer receivables/monthly revenue collections
Cash flow management Internal accounting reports
Fina
ncia
l Per
form
ance
Commercial losses (% of sales)
Control of theft and unaccounted losses
Reports on AT&C losses and estimates of technical losses
Section 5 Recommended Pilot Benchmarking Activity 5.1 Scope And Objectives The recommended pilot effort seeks to develop a South Asia DISCOM benchmarking database and experience in its application, which collectively will lead to demand and support to expansion of this vital management development tool. The database will use parameters from each of the functional areas proposed in the concept paper. The pilot will have three objectives:
Develop a working benchmark product useful to stakeholders in DISCOM development.
Test and refine the approaches to recruitment of participants and to collection and presentation of the benchmarking data.
Develop experience among selected participants in application of the benchmarking database to improve DISCOM performance.
The prospect for future expansion of the database (in terms of participation and/or metrics covered) rests on the value that the benchmarks provide to DISCOM participants, as demonstrated by the pilot’s results. There are two important dimensions to value delivery that the pilot must address. First, the pilot database should include enough DISCOM participants to support analysis and normalization of performance data, providing tangible insights on areas of distribution improvement for participants in the pilot effort and for DISCOMs that consider participating in an expanded effort. Second, the pilot should not stop at the development of performance targets, but must demonstrate the usefulness of those targets and the benchmarking process through application to performance improvement in a few DISCOMs.
In this light, the pilot project should aim to include in the range of 20-25 participants that are either DISCOMs or distribution circles within DISCOMs.22 The sample of participants should be segmented into distinct groupings, such as differentiating urban and rural DISCOMs, and scaling by number of customers. Each grouping will include at least 5 participants. It is understood that in the pilot effort, there may be trade-offs between the number of participants and the scope of benchmark parameters developed in the database. This issue will be explored in the first stage of the pilot program as described in the Approach section below.
5.1.1 Target Audience
22 In some cases, it will be more useful and manageable to focus on distribution circles than on corporate DISCOM entities. The power sector is in the process of restructuring throughout the region. In some areas, distribution operations have not yet been unbundled from generation or transmission functions. In others, recent unbundling has created large distribution companies that are geographically dispersed and include many isolatable urban and rural zones within a single corporate entity. Private, urban DISCOMs also exist. Typically, however, DISCOMs are organized in geographically discrete zones that each have fully functional, and relatively independent capabilities in all or most areas relevant to service delivery and performance measurement. Hence, for some companies, it will be more feasible and more useful to develop benchmarking data at the zone level. This may, for example, focus on a zone whose service territory encompasses the distribution operations of a city and its outskirts.
Concept Paper: Performance Benchmarks 5-1 for Electricity Distribution Companies in South Asia
Section 5 Recommended Pilot Benchmarking Activity
The main participants in the pilot project will be electricity distribution companies in South Asia countries. They will also be the principal sources of data and the principal beneficiaries. The pilot aims to develop a benchmarking tool that meets their demand for performance improvement.
Government agencies, prospective lenders and investors in the power sector (including multilateral banks), regulators, and donor agencies also comprise the target audience, as stakeholders in the evaluation and improvement of distribution performance. The pilot project will engage this latter group of stakeholders also, for their contributions to data collection, and toward assuring that the benchmarking process produces performance measures that are recognized and valued by them. The DISCOMs need the support of these stakeholders to realize the investment and management strategies they develop to obtain new performance goals, using the benchmarks as milestones and indicators of progress. These stakeholders will participate in workshops and consultative meetings throughout the pilot project.
5.1.2 Major Challenges and Issues The principal challenges for the pilot project will be motivational and technical: (1) to recruit effective, committed participation from DISCOM partners at the operating level; (2) to transform disparate forms of performance data (i.e., disparate among the DISCOMs) into common benchmarks that are useful for all DISCOMs and (3) to demonstrate the practical value of benchmarking sufficiently to create a demand among DISCOMs and other stakeholders for a sustainable, commercial benchmarking service.
The major issues are in the data collection process. While the data required for most of the measures exist with the DISCOM, it may be compiled and reported in ways that compromise its reliability. This issue may be addressed by going to primary sources in DISCOM offices, on a sampling basis, but this in turn requires access to DISCOM records and commitment of DISCOM personnel to support data collection. As data recording practices and parameter definitions will differ among DISCOMs, the pilot project benchmarking team must also develop procedures for data transformation that will guide both data collection and application of benchmarks for the benefit of individual DISCOMs.
5.2 Approach The work is proposed in two phases, first to benefit from the learning curve in working with a few DISCOMs, and then apply a winning approach to a larger group. The two phases are described as follows:
Phase 1—Setup and Beta Test with 5 DISCOM Units: The setup activity will include (a) assembly of a core study team of expats and local consultants, (b) preparation of a recruitment/presentation package of useful materials that will attract DISCOM participation, and (c) mailout/announcement of the benchmarking task followed by targeting of DISCOMs for Phase 1 participation. Five DISCOMs will be selected for a beta test of the approach (recruitment process, scope of benchmark metrics, data collection process, analysis and presentation of results). The preliminary list of recommended benchmarking metrics would be further vetted and refined. This beta test will include explicit feedback from the DISCOM participants toward improving the approach process and the content of the database. DISCOMs are expected to require confidentiality in reporting of results, and that database reporting will not link the DISCOM
Concept Paper: Performance Benchmarks 5-2 for Electricity Distribution Companies in South Asia
Section 5 Recommended Pilot Benchmarking Activity
names to the data. Phase 1 will assess the confidentiality issue, and all data issues, in practice.
Phase 2—Participation Expansion and Application Examples: Work will begin with review of lessons learned in Phase 1 and refinement of the approach, including the scope of the database. Phase 1 results and other enhancements will be incorporated into the presentation package. The study team will develop a region-wise recruitment strategy, add local consultants, and launch the participant recruitment drive toward obtaining a further 15-20 DISCOMs in the database. In parallel, at least two of the DISCOM participants from Phase 1 will be selected for technical assistance to develop experience in applying the benchmarks for performance improvement during Phase 2. Their experience will provide case study examples for workshops that promote benchmarking at the end of the pilot project.
Phase 2 will result in a publicly available report and database on the benchmarking results, and distinct reports to each participating DISCOM. The study team will explore how to differentiate a publicly available product from a product provided to participants, as an inducement to stimulate future participation. The study team will prepare a separate report to USAID and other sponsors on the next steps for maintaining and enhancing the benchmarking database.
Key features of the approach are described further below: i.e., data sourcing, participant recruitment approach, participant selection and outreach and promotion.
Data Sourcing While there may be multiple potential sources of data for the benchmarking database, DISCOMs are the preferred source. This is because, in essentially all cases, the DISCOMs are the primary data collectors, even when they are collecting the data to provide to government agencies or regulators. The study team will be better off winning over the DISCOMs as participants, and overcoming their confidentiality concerns, rather than trying to bypass them by using secondary data sources published by government or other agencies. The direct approach with the DISCOMs will, in the end, develop trust and lead to further participation in the program, and will enhance the commercial value of the product.
The study team will also explore other sources of data, obtain feedback and develop interest from other stakeholders, through contacts with government agencies and other entities as appropriate in each SARI/Energy-participating country. This effort may provide a means of corroboration of data reliability and accuracy, get the word out about the benchmarking activity among other important groups, beneficiaries and stakeholders, and may reveal other performance measures that would be of mutual interest to DISCOMs and other stakeholders.
Approach To Participant Recruitment We realize that some progressive DISCOMs will likely be willing to participate from the onset, whereas others may be reluctant for various reasons, including fears associated with exposing inefficiencies, and the political sensitivities associated with excessive staffing levels and the need to cut back on staffing if efficiency is to be increased. We need to clearly
Concept Paper: Performance Benchmarks 5-3 for Electricity Distribution Companies in South Asia
Section 5 Recommended Pilot Benchmarking Activity
demonstrate the advantages of participation in the project to achieve the desired number and level of diversity of DISCOM participants.
In approaching the DISCOMs, the team would show that their participation will do at least two things: (1) demonstrate their achievement in one or more areas of their business as a success story for their own purposes and for public recognition, and (2) develop a unique, practical tool for management and operational improvement (i.e., the benchmarking database). We will prepare a recruitment presentation package (see below) for all participants as well.
Participant Selection The basic philosophy for participant selection is to cast a wide net in the South Asia region, and respond sincerely to all indications of interest that result from the outreach efforts. In Phase 1, the study team will target prospects so that the initial five DISCOMs include different ownership types (private, public unbundled, public integrated, and cooperative), rural as well as urban DISCOMs, different scales in terms of number of customers, and at least two SARI-participating countries. In Phase 2, the study team will develop the recruitment strategy to obtain about five DISCOM units in each of at least four categories.
Outreach and Promotion The success of this project relies on effective collaboration with participating DISCOMs and on the ability to build both value recognition and demand for benchmark-related services among other DISCOMs and external stakeholders in the region.
5.3 Outcomes And Products Of The Pilot Project The pilot project is anticipated to obtain the following outcomes toward establishing sustainable benchmarking practices and facilitating performance improvement among distribution DISCOMs in South Asia:
Cross-border learning among DISCOMs in the region about distribution performance norms and the means of enhancing performance
20-30 DISCOM participants with direct experience in developing performance data and awareness of their performance levels compared to their peers in the region.
Awareness and recognition of region-specific standards of distribution performance among other vital stakeholders (government, regulators, financial community, consumers).
A proven model for further development of benchmark data and practices, and their application for performance improvement.
The pilot will also provide a number of tangible products and will be made generally available to regional DISCOMs and others through SARI/Energy outreach channels. These products include:
Benchmark database that is useful both as a stand-alone product and as the foundation for expansion via more DISCOM participants.
Presentation package developed for recruitment of participants.
Concept Paper: Performance Benchmarks 5-4 for Electricity Distribution Companies in South Asia
Section 5 Recommended Pilot Benchmarking Activity
Applications Guide addressing how to use benchmarks, how to develop data, how to make benchmark data collection an ongoing process, and how to apply benchmarks to performance improvement.
Success stories of performance improvement in distribution functional areas from among the DISCOM participants in the pilot project.
Inter-regional workshops on benchmarking and DISCOM performance improvement.
Final report of the pilot project, including a road map for expansion of the benchmarking effort.
Concept Paper: Performance Benchmarks 5-5 for Electricity Distribution Companies in South Asia
Concept Paper: Performance Benchmarks A-1 for Electricity Distribution Companies in South Asia
Appendix A Evaluation Tools to Develop Benchmarking Approach
Two evaluation tools were used to guide the development of the benchmarking approach:
Evaluation matrix showing proposed parameters, their component data requirements, and a brief series of ratings and questions pertaining to each one;
List of issues to be covered in telephone or in-person discussions.
These materials are attached.
1.1 Development of Benchmarks for Electricity Distribution Performance in South Asia
1.1.1 Purpose Of Distribution Benchmarking Assessment The purpose of this task is to develop a concept paper outlining the initial set of metrics and approach for developing a database benchmarking selected electricity distribution functions in SARI/Energy countries. The concept paper also proposes a pilot project toward establishing benchmarks on the basis of data from selected distribution companies in the South Asia region, providing the level and type of resources likely required for the effort. Currently, there is a lack of integrated and consistent information for distribution utilities in developing countries in South Asia and worldwide such that important policy, operational, pricing and investment considerations are made without reference to fundamental industry norms. A set of reliable and viable distribution metrics will provide a critical baseline for utility distribution managers and power sector entities to make more effective decisions in a broad range of areas, including: cost recovery programs, investment in rural electrification, rate setting, O&M costs and scheduling, billing and collections procedures, appropriate technology investment, and staffing levels for specific job functions. With such norms in place, governments and utility operators will have transparent benchmarks against which they can design programs to improve performance, lower costs and increase the range of distribution to currently under-serviced areas.
1.1.1.1 Benefits and Beneficiaries The benchmarks aim to facilitate improvements in electricity distribution operations and service provision, by providing performance measures that will (1) help utility managers to understand their company’s strengths and weaknesses and to direct improvement efforts, and (2) help public officials, investors, lending institutions, and donor organizations to develop capital expenditure and technical assistance programs for South Asian utilities. The principal beneficiaries of the benchmarking activity include:
Distribution company (DISCOM) managers: The benchmarks and database will provide South Asia-specific performance standards for key function areas, and the method to apply them to any given utility. The benchmarks are intended to assist managers to compare their operations with peer utilities, set performance targets, evaluate costs, allocate resources, develop capital expenditure requirements, and monitor performance.
Appendix A Evaluation Tools to Develop Benchmarking Approach
Concept Paper: Performance Benchmarks A-2 for Electricity Distribution Companies in South Asia
Government, MLB funding agencies, and donor organizations: The benchmarks and database will facilitate evaluation of utility performance, identification of investment needs, and development of improvement initiatives by external organizations concerned with power distribution sector reform and development. Moreover, as externally funded assistance becomes more focused on output, the benchmarks will provide a consistent set of performance metrics for the region.
Investors and lending institutions: The benchmarks are expected to provide critical data that will facilitate privatization and corporatization programs as government officials and investors are able to compare targeted utilities with industry norms.
Consumers and Utility Employees: The benchmarks will provide a means for improvements in distribution services to consumers and in the safety of working conditions for utility employees.
1.1.2 Functional Areas of Distribution Performance Performance benchmarks focus on the aspects of priority distribution functions that can be quantified. There are many functional areas and many potential indicators of performance for each of them. In the context of the developing and/or reforming distribution systems of the South Asia region, the benchmarking activity intends to focus on functional areas that are particularly critical to the establishment of reliable and sustainable power distribution services. The metrics for these functional areas are necessarily developed in consideration of the ability to conduct comparative analyses of utilities (within a country and among different countries in the region), and in consideration of the availability of reliable, consistent, and replicable data. The functional areas for performance benchmarking are proposed as follows:
Operational Performance: The availability, reliability, and quality of power delivered to consumers, provision of maintenance and repair services, and level of technical and commercial losses.
Customer Service: Provision of key customer services such as connection services, handling of complaints, consumer education activities, testing services, DSM programs.
Metering, Billing and Collection: Extent and accuracy of metering, billing practices, collection efficiency, arrears on receivables.
Financial Performance and Competitiveness: Cost recovery, profitability, level of capital investment (and reinvestment), and comparative tariff levels.
Operational Cost Control: Total cost of distribution services, staffing levels and labor costs, other operating and capital costs, inventory management.
1.1.3 Preliminary Performance Metrics by Functional Area
The study team is in the process of collecting information about benchmarking activities both within and outside of the South Asia region. What follows are metrics that have been identified and being considered for application in the benchmarking activities. These metrics will be reviewed for their appropriateness considering their usefulness as a measure of performance, the availability of reliable and consistent data to derive the benchmark across the region, the ability of utility managers and others to apply the benchmarks to their own
Appendix A Evaluation Tools to Develop Benchmarking Approach
Concept Paper: Performance Benchmarks A-3 for Electricity Distribution Companies in South Asia
operations, and other factors. It is expected that as the activity proceeds, the lists will evolve as additional or alternative metrics are proposed. The study team is very keen to receive comments and suggestions. The preliminary performance metrics are provided in the attached tables for evaluation.
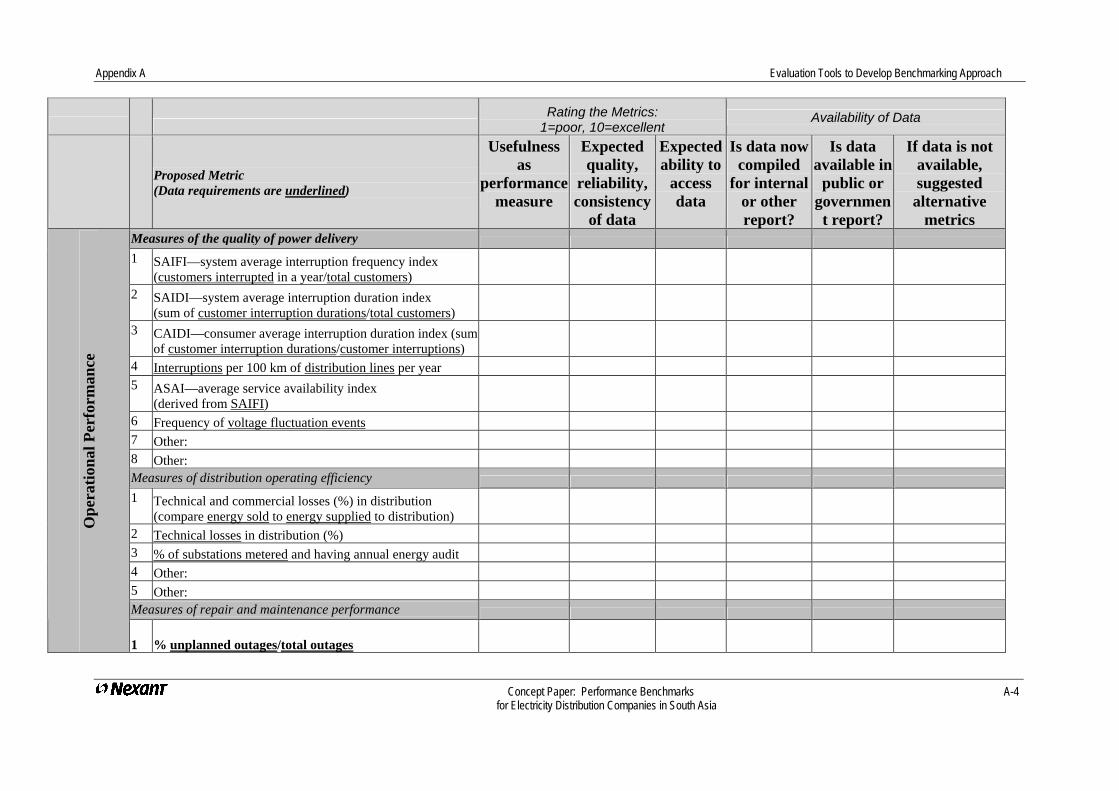
Appendix A Evaluation Tools to Develop Benchmarking Approach
Concept Paper: Performance Benchmarks A-4 for Electricity Distribution Companies in South Asia
Rating the Metrics:
1=poor, 10=excellent Availability of Data
Proposed Metric (Data requirements are underlined)
Usefulness as
performance measure
Expected quality,
reliability, consistency
of data
Expected ability to
access data
Is data now compiled
for internal or other report?
Is data available in
public or government report?
If data is not available, suggested
alternative metrics
Measures of the quality of power delivery 1 SAIFI—system average interruption frequency index
(customers interrupted in a year/total customers) 2 SAIDI—system average interruption duration index
(sum of customer interruption durations/total customers) 3 CAIDI—consumer average interruption duration index (sum
of customer interruption durations/customer interruptions) 4 Interruptions per 100 km of distribution lines per year 5 ASAI—average service availability index
(derived from SAIFI) 6 Frequency of voltage fluctuation events 7 Other: 8 Other: Measures of distribution operating efficiency 1 Technical and commercial losses (%) in distribution
(compare energy sold to energy supplied to distribution) 2 Technical losses in distribution (%) 3 % of substations metered and having annual energy audit 4 Other: 5 Other: Measures of repair and maintenance performance
Ope
ratio
nal P
erfo
rman
ce
1 % unplanned outages/total outages
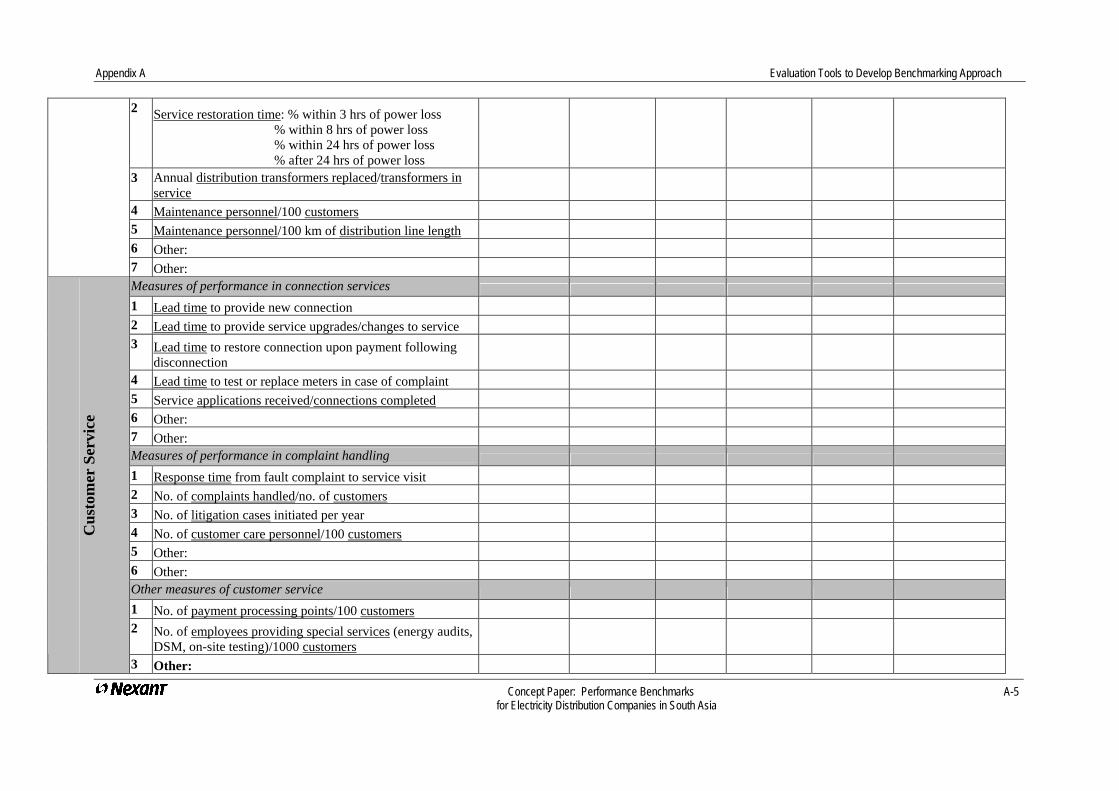
Appendix A Evaluation Tools to Develop Benchmarking Approach
2 Service restoration time: % within 3 hrs of power loss % within 8 hrs of power loss % within 24 hrs of power loss % after 24 hrs of power loss
3 Annual distribution transformers replaced/transformers in service
4 Maintenance personnel/100 customers 5 Maintenance personnel/100 km of distribution line length 6 Other:
7 Other: Measures of performance in connection services 1 Lead time to provide new connection 2 Lead time to provide service upgrades/changes to service 3 Lead time to restore connection upon payment following
disconnection 4 Lead time to test or replace meters in case of complaint 5 Service applications received/connections completed 6 Other: 7 Other: Measures of performance in complaint handling 1 Response time from fault complaint to service visit 2 No. of complaints handled/no. of customers 3 No. of litigation cases initiated per year 4 No. of customer care personnel/100 customers 5 Other: 6 Other: Other measures of customer service 1 No. of payment processing points/100 customers 2 No. of employees providing special services (energy audits,
DSM, on-site testing)/1000 customers
Cus
tom
er S
ervi
ce
3 Other:
Concept Paper: Performance Benchmarks A-5 for Electricity Distribution Companies in South Asia
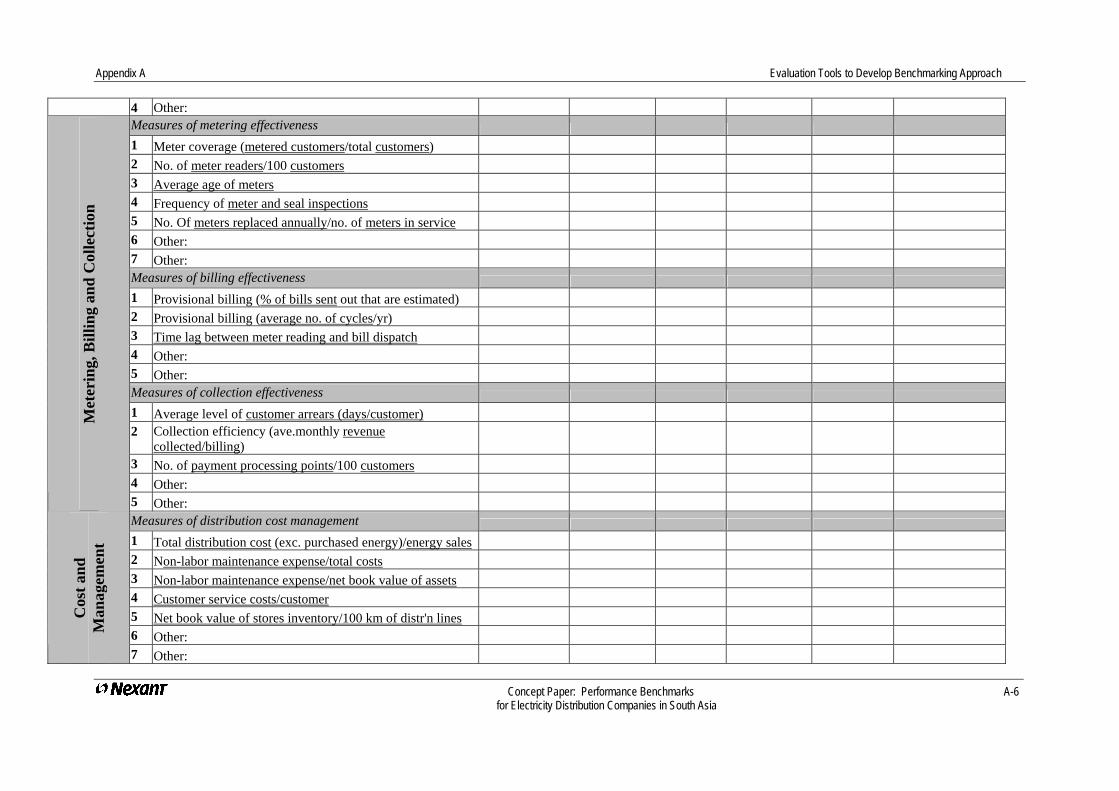
Appendix A Evaluation Tools to Develop Benchmarking Approach
Concept Paper: Performance Benchmarks A-6 for Electricity Distribution Companies in South Asia
4 Other: Measures of metering effectiveness 1 Meter coverage (metered customers/total customers) 2 No. of meter readers/100 customers 3 Average age of meters 4 Frequency of meter and seal inspections 5 No. Of meters replaced annually/no. of meters in service 6 Other: 7 Other: Measures of billing effectiveness 1 Provisional billing (% of bills sent out that are estimated) 2 Provisional billing (average no. of cycles/yr) 3 Time lag between meter reading and bill dispatch 4 Other: 5 Other: Measures of collection effectiveness 1 Average level of customer arrears (days/customer) 2 Collection efficiency (ave.monthly revenue
collected/billing) 3 No. of payment processing points/100 customers 4 Other:
Met
erin
g, B
illin
g an
d C
olle
ctio
n
5 Other: Measures of distribution cost management 1 Total distribution cost (exc. purchased energy)/energy sales 2 Non-labor maintenance expense/total costs 3 Non-labor maintenance expense/net book value of assets 4 Customer service costs/customer 5 Net book value of stores inventory/100 km of distr'n lines 6 Other:
Cos
t and
M
anag
emen
t
7 Other:
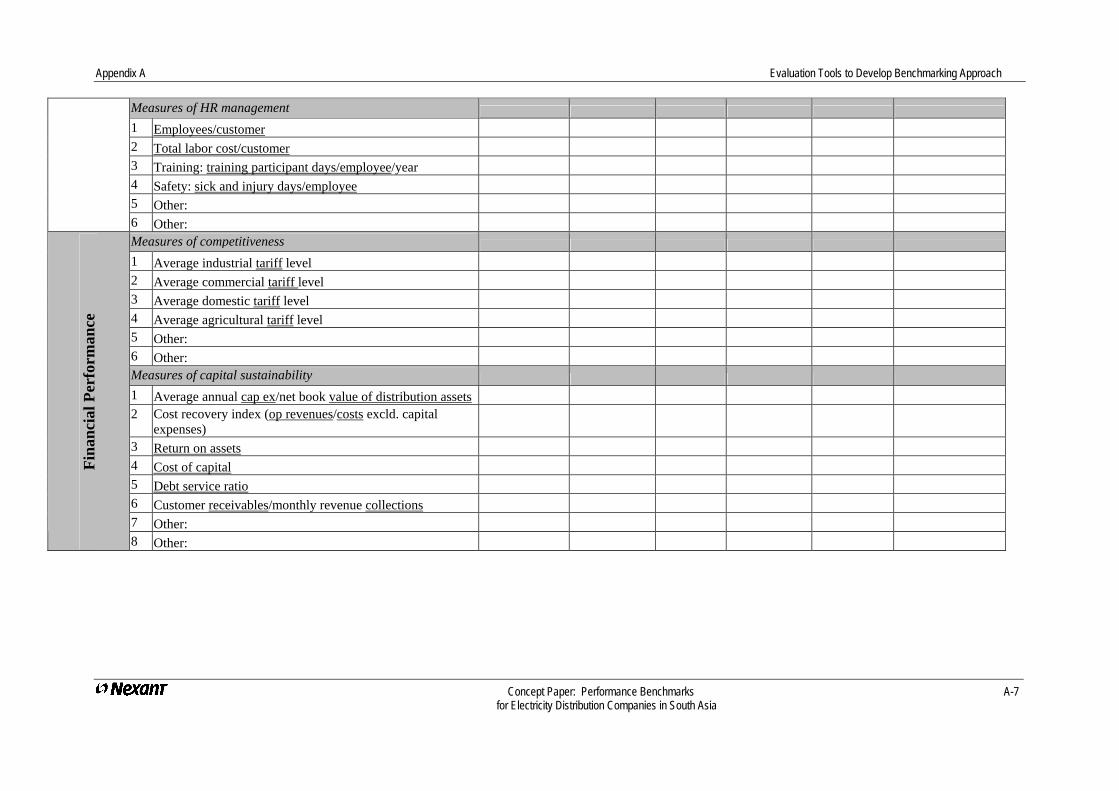
Appendix A Evaluation Tools to Develop Benchmarking Approach
Measures of HR management 1 Employees/customer 2 Total labor cost/customer 3 Training: training participant days/employee/year 4 Safety: sick and injury days/employee 5 Other:
6 Other: Measures of competitiveness 1 Average industrial tariff level 2 Average commercial tariff level 3 Average domestic tariff level 4 Average agricultural tariff level 5 Other: 6 Other: Measures of capital sustainability 1 Average annual cap ex/net book value of distribution assets 2 Cost recovery index (op revenues/costs excld. capital
expenses) 3 Return on assets 4 Cost of capital 5 Debt service ratio 6 Customer receivables/monthly revenue collections 7 Other:
Fina
ncia
l Per
form
ance
8 Other:
Concept Paper: Performance Benchmarks A-7 for Electricity Distribution Companies in South Asia
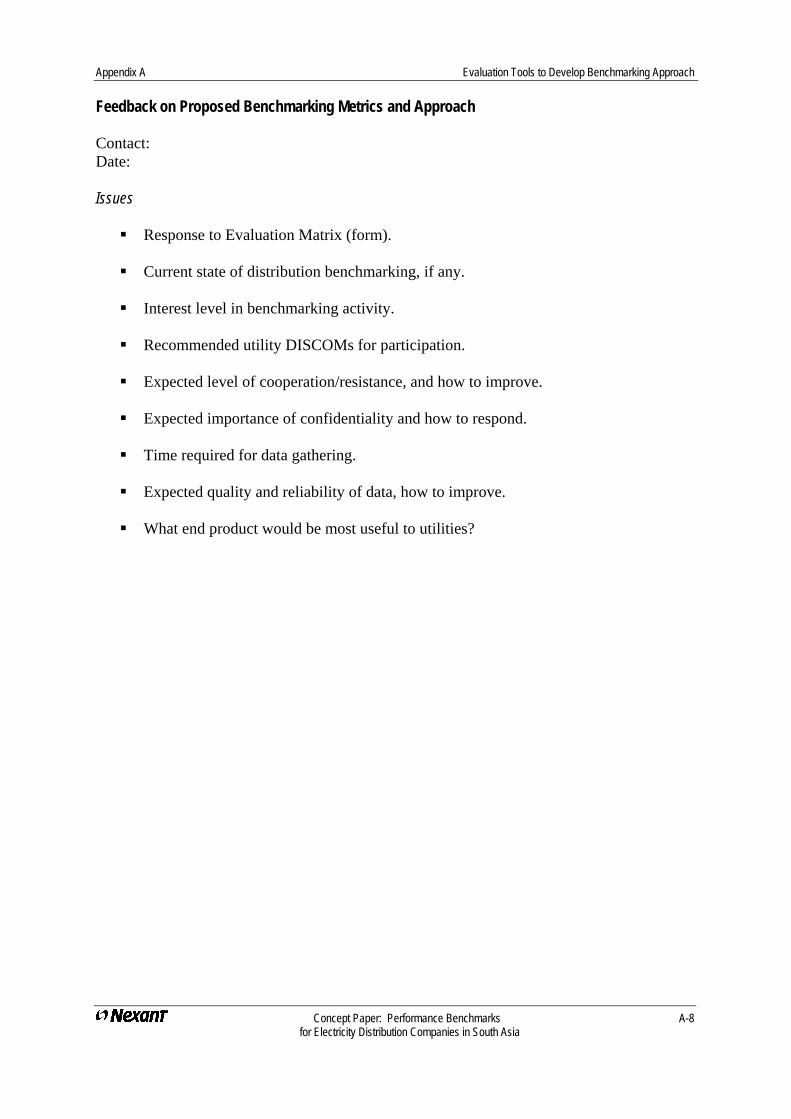
Appendix A Evaluation Tools to Develop Benchmarking Approach
Concept Paper: Performance Benchmarks A-8 for Electricity Distribution Companies in South Asia
Feedback on Proposed Benchmarking Metrics and Approach Contact: Date: Issues Response to Evaluation Matrix (form).
Current state of distribution benchmarking, if any.
Interest level in benchmarking activity.
Recommended utility DISCOMs for participation.
Expected level of cooperation/resistance, and how to improve.
Expected importance of confidentiality and how to respond.
Time required for data gathering.
Expected quality and reliability of data, how to improve.
What end product would be most useful to utilities?
SGS DistributionReliabilityBenchmarking Study
The SGS Distribution Reliability Benchmarking Study furnishes the electric distribution
industry the most complete and in-depth comparative Study of reliability performance
available. It provides both relative and absolute comparisons by system and voltage class
against the Study average, quartiles, geographic regions, self-selected peers and
between individual systems. The Study also supplies innovative circuit-level reliability
measures useful for maintaining or improving system-level SAIDI and SAIFI performance.
Finally, the Study provides multi-year trend analysis and sets statistical thresholds for
reliability performance measures.
The SGS Distribution Study…In response to customer requests, SGS
Statistical Services is pleased to offer theSGS Distribution Reliability BenchmarkingStudy. The SGS Study provides your systemwith solid, third-party reliability benchmarksand actionable information useful to improvesystem-level reliability performance.
For eight years, SGS Statistical Serviceshas provided the industry SGS TransmissionReliability Benchmarking Study. In 2002, 27systems representing about 50% of the USgrid participated. Building upon this successand years of customized distribution reliabilityanalysis, we have developed a uniquebenchmarking product.
Understanding the position of your distri-bution system versus industry norms formsthe basis to improve capital and maintenancedecision support.
The Study consists of a 300 page Reportbinder, customized Executive Summary,extensive electronic output and a 2-dayconference.
Study ScopeThe SGS Study will involve a minimum of
15 or more distribution systems from the US.The basic Study data requirement is fiveyears of raw feeder-level outage data.
From this data, SGS provides system,voltage class and feeder-level reliabilitysummaries. These include the familiar IEEEP1366 measures, plus innovative compositescores.
The Study will commence with the sub-mission of all outage data through June 30,2002 and the report is issued in November,2002.
Why Benchmark Reliability?There are many reliability benchmarks
available… state regulatory agency reports,professional and trade associations andthrough consulting firms. Why is the SGSStudy unique and how does it add value toyour current analysis and benchmarkingpractices?• The SGS Study insures valid "apples vs.
apples" comparisons because it uses rawoutage data and processes it in an identi-cal manner for all participants.
• The level of internal support required forparticipation is considerably less than otherbenchmarking studies, consisting mainly ofraw data transfers. No labor-intensive,complicated questionnaires or summariza-tions are required.
• Performance measures are provided foreach feeder. The measures provide
Appendix B SGS Distribution Reliability Benchmarking Study
Concept Paper: Performance Benchmarks B-1 for Electricity Distribution Companies in South Asia
2002 SGS Distribution Reliability Benchmarking Study Description, page 2© SGS Statistical Services (520) 529-8202
actionable information to identify under-performing feeders to maximize system-level reliability improvements.
• The Study supplies a wide array of com-parison methods… in addition to thefamiliar bar charts of IEEE metrics, theStudy includes trend charts and compari-son of outage causes.
• There are a variety of external normsprovided for comparisons: over-all aver-age, quartiles, geographic regions, a self-selected peer group and anonymously-identified individual systems.
• Statistically-derived distribution reliabilitythresholds are provided for your system tohelp identify trends and provide alterna-tives for arbitrary thresholds used by manyregulatory agencies.
Conduct and Features of the StudyNew participants receive a site visit to the
client's facility. The purpose of this visit is atechnical presentation about the study, datatransfers and the establishment of technicalliaisons during the project.
After a successful data transfer, the nextinvolvement is attending the 2 day resultspresentation held for participants.
The entire project is similar to a processcapability study used in manufacturing qualitycontrol. The study precisely identifies eachcircuit and voltage class on your systemrelative to a large industry sample andbenchmarks it using 5 or more years ofdistribution outage data.
Prior to analysis, SGS runs a series ofData Filters to assess your outage dataintegrity. Data filter results consist of 20+checks used to validate data and oftenhighlight opportunities for improved reporting.
The Study then pools your raw outagedata into a common database. Statisticalscreening methods are equally applied to allparticipants to omit extreme event-days, thusinsuring meaningful comparisons.
The Study provides the full suite of“traditional” IEEE Standard P1366 distribu-
tion outage metrics, reported in tabular andgraphical (bar and trend charts) format.
It also features the innovative DistributionAvailability Composite Score which combineskey circuit-level performance measures:
• Time Between Failures• Outage Duration• Outage Frequency
It is a single-number summary of reliabilityperformance, computed on a circuit andvoltage class basis. It is easy-to-interpret,and is scaled from 0 to 1000.
Voltage classes have several externalreferences provided for comparisons:• A user-defined Peer Group of systems• North American geographic regions• Over-all study averages and quartiles
Study Components & DeliverablesThe study deliverables consist of a cus-
tomized Executive Summary, a compre-hensive Report Binder and electronicoutput, delivered at a 2 day participantconference. The Study insures confidential-ity of all participants using anonymousvoltage class identifiers.
The Executive Summary is a complete,customized high-level summary of yoursystem’s performance. It comes as a 30+page spiral-bound document and as abookmarked Adobe Acrobat® electronicdocument. There is a system-specificsummary of recent performance and trends.Your system’s position amongst all partici-pants is displayed in at-a-glance format for14 reliability measures. Trend charts, barcharts and tables are produced forComposite Scores, IEEE metrics and outagecauses. The graphs explicitly identify yoursystems and also have over-all industryaverages, quartiles, peer group and regionalreferences. Finally, there is a listing of the“worst 50” feeders for attention.
The Report Binder is highly detailedbetween-system comparisons (using anony-
Concept Paper: Performance Benchmarks B-2 for Electricity Distribution Companies in South Asia
Appendix A Evaluation Tools to Develop Benchmarking Approach
Appendix B SGS Distribution Reliability Benchmarking Study
2002 SGS Distribution Reliability Benchmarking Study Description, page 3© SGS Statistical Services (520) 529-8202
mous identifiers) with some proprietary tablesand graphics. It has these key features:1. Discussion and Methods: 100+ pages,written in lay terminology, containing analy-sis, interpretation, output data dictionary,definitions and formulas.2. Composite Scores: Graphical andtabular performance summaries by voltageclass. Included are: components (timebetween failures, outage frequency, duration,momentary and sustained outages, etc.).3. IEEE P1366 Standard Metrics: SAIFI,MAIFI, SAIDI, CAIDI, Percent Availability(ASAI), Outages per 100 Miles, etc., intabular, graphical and electronic form.4. Device-Level Metrics: Comparison ofreliability by device-type (breakers, in-lineand lateral).5. Analysis of Outage Causes: Circuitoutages are classified into ~9 categories(e.g., Line Materials, Terminal Equipment,Supply, Weather, Trees, etc). Within-company percentile “grades” and sums arecomputed for each circuit to help focus rootcause analysis. Voltage class table andgraphical comparisons of outage causesagainst other systems, peers and regions.5. Company-Specific Features:� Evaluation of 20+ feeder-level metrics
useful to maintain or improve system-level reliability.
� Individual circuit-level Composite Scoresand voltage class trend charts (quarterlyand multi-year values).
� “GAP” analysis comparing reliability per-formance with feeder customer count toidentify improvement opportunities.
� Regression analysis of outages vs. circuitlength, to highlight underperformers.
� IEEE metrics (5+ year and annualaverages for system, voltage class andeach circuit).
6. Trend Charting and Analysis:Identifying long-term reliability trends is
essential in a restructured electric utilityindustry. Many types of trend charts andanalyses are included; the charts feature
system trends and comparisons againstindustry norms. Trend charts are producedby system and voltage class for:� Composite Scores� IEEE standard metrics (SAIFI, SAIFI-All,
MAIFI, SAIDI, CAIDI, etc)� Outage Causes7. Electronic Output Data Files:
Most performance summaries are alsoprovided as electronic output data files forfurther internal analysis using spreadsheet ordatabase programs:� Circuit-level Composite Scores (quarterly
and multi-year average, up to 5 years)� Circuit-level IEEE metrics (up to 12 years
and multi-year average)� Voltage Class Composite Scores and
IEEE measures (5 years and multi-yearaverage) for all participants (usinganonymous IDs), regions and peers
� Outage Causes: Circuit and system-level summaries
The Study Presentation is a 2 daymeeting held exclusively for Study partici-pants. The meeting will be in November,2002 at Tucson, AZ. The meeting consistsof results presentation, participant presenta-tions and discussion. An evening dinner andreception on day 1 and lunch on both days isincluded.
Data Management & DefinitionsFive or more years of outage data is
submitted in early Q3-2002 (all high-qualityoutage data submitted from 1990 forwardmay be used, with a five-year minimum).
Distribution feeder circuits are defined asradial (or occasionally networked) lower-voltage circuits intended to serve customerload, beginning in at and with protectionequipment in a substation. We providevoltage class analysis for:
• Under 5 kV• 5 - 15 kV• 15 – 25 kV• Over 25 kV
Concept Paper: Performance Benchmarks B-3 for Electricity Distribution Companies in South Asia
Appendix B SGS Distribution Reliability Benchmarking Study
2002 SGS Distribution Reliability Benchmarking Study Description, page 4© SGS Statistical Services (520) 529-8202
Outage data must be reported on a feederbasis. All outage data should be submittedand include any breaker, recloser or fuseoperation on the circuit. Thus, all lock-outs,tap and transformer outages should besubmitted. Distribution outage data mayinclude stepped restorations. We adjustoutage duration and customer impactaccording to the restoration steps.
The study requires the initiation and resto-ration date/time values of every forcedoutage event in a date/time format (e.g.,ddmmmyy:hh:mm). Each outage event musthave a feeder identification which maps to acircuit definition table. The number ofcustomers affected must be included witheach outage record. Outage data should be"scrubbed" of obsolete or invalid circuit IDs.Outages should carry a cause code mappedto the SGS Study categories.
The circuit definition table is a listing ofall currently valid distribution feeders and issubmitted with the outage data.. Becausecustomer counts are dynamic, there shouldbe one record for each year the feeder hasbeen in service during the period of your datasubmission. Records must contain circuit IDand name, year, customer count, voltage andlength.
Benchmarking and ConfidentialityBenchmarking and Confidentiality are not
mutually exclusive terms. All raw data isplaced in a secure Windows NT environment.Summary information about each company isanonymously identified to other participants(Company X, Y, Z). Confidentiality of datais completely maintained. SGS clients willattest to the level of confidentiality. You arefree to exchange identifiers with half of theparticipants, arranged on a bilateral basis.
The Report Binder is a copyrighted docu-ment and may not be circulated outside ofthe study group under any circumstances.The Executive Summary and all company-specific analyses may be freely circulated.
Project FeesProject fees are determined by system
size (discount available for SGS transmissionclients; additional charges may apply forunusual data conversions):
Total Customers FeeUnder 500,000 $15,000500,000 to 1 million $20,0001 million to 2.5 million $25,000Over 2.5 million $35,000
Technical SupportSGS assists participants after the pres-
entation meeting to interpret and apply thestudy results. This consists of free telephonesupport or limited ad-hoc queries.Customized analysis or consulting areavailable for an extra charge.
2002 SGS Clients:Allegheny Power System, American Transmission Co.,Arizona Public Service, Bonneville Power Administration,CPL: Progress Energy, ComEd: Exelon, ConsumersEnergy, Dominion Virginia Power, Duke ElectricTransmission, Duquesne Light Co., Entergy Services,First Energy, Georgia Transmission Corp., LIPA-Keyspan Energy, Municipal Electric Authority of Georgia,National Grid USA, New York State Electric & Gas,Niagara Mohawk - National Grid, Northeast Utilities,NorthWest Energy, PacifiCorp, PECO Energy: Exelon,Public Service Electric & Gas, Public Service of NewMexico, Salt River Project, San Diego Gas & Electric,South Carolina Electric & Gas, Tennessee ValleyAuthority, Tucson Electric Power, TXU Electric & Gas,Xcel Energy
Listing of clients does not constitute an advertise-ment or endorsement of the study. Clients are listed toprovide an example of the size and type of systemspossible in the 2002 study.
For more Information:Gregg A. SpindlerSGS Statistical Services, LLC5991 N. Placita OleadaTucson, AZ 85750(520) 529-8202e-mail: [email protected]://pages.prodigy.net/sgsstat/
References, the formal project proposaland data requirements documents aresent on request.
Concept Paper: Performance Benchmarks B-4 for Electricity Distribution Companies in South Asia
Appendix B SGS Distribution Reliability Benchmarking Study

Electric Utility Benchmarking Association™Annual Roundtable
June 10-11, 2004New Orleans, Louisiana
FOCUSThe focus of this roundtable is to bring processmanagers, analysts, and overall benchmarkingcoordination staff together to learn from each otherabout efforts in Benchmarking and how they lead toorganization change.
OBJECTIVETo provide an environment for the open exchange ofideas about the Benchmarking efforts and process, whiledeveloping a network of contacts and opportunities forsuccessful Benchmarking exchanges.
WHAT TO EXPECTParticipants should expect to discuss their efforts andlearn from their peers in attendance at the session.Participants should expect a targeted group of attendeesexchanging information for mutual benefit. Participantswill be given a program manual which will be used tocomplete results of surveys of the participants and willinclude a complete contact list of attendees.
WHO SHOULD ATTEND
• Benchmarking Coordinators• Process Owners• Staff involved in Benchmarking
Here is How to RegisterRoundtable Fee: $699 per person
Early Bird Special $599**When application is received 30 days in advance.
Mail: THE BENCHMARKING NETWORK™4606 FM 1960 West, Suite #250Houston, Texas 77069
Fax: (281) 440-6677 (24 hours a day)
Call: (281) 440-5044 (8:00am - 5:00pm CST)
EUBA Members Only
Simply complete and return this application for acceptance
TM
The Electric Utility Benchmarking AssociationThe Electric Utility Benchmarking Association
EUBA
Company Name:______________________________________
Participant Name: ____________________________________
Title: ______________________________________________
Work Area:Transmission & Distribution ❑ Generation ❑ Admin ❑
Address: ____________________________________________
City: ______________________________________________
State: ______________________________________________
Zip: ________________________________________________
Telephone: __________________________________________
Fax: ________________________________________________
E-mail: ____________________________________________
Name on Card: ______________________________________
Card Type: ❑ MasterCard ❑ Visa ❑ Diners Club
❑ American Express
Card Number:________________________________________
Expiration Date: ______________________________________
Billing Address: ______________________________________
__________________________________________________
Signature:______________________________________
Fax to (281) 440-6677, or return this registration form with yourcheck for $699 ($599 for early bird special) to:
THE BENCHMARKING NETWORK, Inc.4606 FM 1960 West, Suite 250
Hous ton , Texas 77069-9949Te l e p h o n e ( 2 8 1 ) 4 4 0 - 5 0 4 4
F a c s i m i l e ( 2 8 1 ) 4 4 0 - 6 6 7 7
THEBENCHMARKING
NETWORK
™
Benchmarking Beginners Welcome!
DISCUSSION AGENDA
June 10 Registration/Reception 5:30 - 6:30pmDinner 6:30pm
June 11 Continental Breakfast 7:45 - 8:15amIntroduction of participants 8:15 - 8:30amSessions 1,2,3 8:30 -11:30am1. The Focus on Benchmarking Efforts in 20042. Conducting Studies and Shortening
The Benchmarking Cycle3. Developing Networking OpportunitiesNetworking Lunch 11:30-1:00pmSessions 4,5,6,7 1:15-3:30pm4. Successfully Implementing Findings
From Benchmarking Studies5. Integrating Six Sigma and Other Process
Management Efforts6. Politics of Performance Improvement7. Training and Developing Benchmarking CapabilitiesClose & Review 3:30-4:00pmAdjourn 4:00pm
Appendix C Electric Utility Benchmarking Association
Annual Roundtable
C-1 for Electricity Distribution Companies in South Asia
Concept Paper: Performance Benchmarks
Concept Paper: Performance Benchmarks D-1 for Electricity Distribution Companies in South Asia
Appendix D Asian Development Bank-funded Technical Assistance for Performance Benchmarking for Pacific Power and Water Utilities
ASIAN DEVELOPMENT BANK TAR: OTH 33496
TECHNICAL ASSISTANCE (Financed from the Japan Special Fund)
FOR
PERFORMANCE BENCHMARKING
FOR
PACIFIC POWER AND WATER UTILITIES
December 1999
Appendix D Asian Development Bank-funded Technical Assitance for Performance Benchmarking for Pacific Power and Water Utilities
Concept Paper: Performance Benchmarks D-2 for Electricity Distribution Companies in South Asia
ABBREVIATIONS
ADB - Asian Development Bank PDMC - Pacific developing member
country PPA - Pacific Power Association PWA - Pacific Water Association SPRM - South Pacific Regional Mission TA - Technical assistance
NOTE
In this report, “$” refers to US dollars
Appendix D Asian Development Bank-funded Technical Assitance for Performance Benchmarking for Pacific Power and Water Utilities
Concept Paper: Performance Benchmarks D-3 for Electricity Distribution Companies in South Asia
I. INTRODUCTION
1. With increasing calls from international assistance agencies for results-focused analysis of institutional performance, the Asian Development Bank’s (ADB) Second Water Utilities Data Book
1 highlights the need for water supply
utilities to adopt appropriate standards of performance for service delivery. Governments are encouraging utilities to adopt appropriate standards for managing natural, human, and financial resources. While appropriate performance evaluation criteria may differ from one utility to another, the Second Water Utilities Data Book suggests an approach to criteria selection. The Second Water Utilities Data Book, together with the Electric Utilities Data Book,
2 presents comparative data from which trends in service provision
can be identified.
2. A regional seminar, held for Pacific water utilities in the Fiji Islands in 1997, identified a need for Pacific power and water utilities to cooperate in adopting performance evaluation criteria, benchmarking, and preparing action plans to improve institutional policies. This regional technical assistance (TA) is based on ADB’s strategy of developing regional cooperation by supporting comparative analysis and exchange of experience, and encouraging participatory and consultative development activities. The TA was endorsed by the Regional Technical Assistance Screening Committee on 1 October 1999. Discussions were held with the Pacific Power Association (PPA) and the Pacific Water Association (PWA); both have indicated their support and assistance for the TA. The TA framework is given in Appendix 1.
3
II. BACKGROUND AND RATIONALE
3. While differing in many ways, ADB’s Pacific developing member countries (PDMCs) share characteristics of smallness, remoteness, and difficulty in developing and retaining capacity for basic service provision. Many of the electric power and water supply utilities have a high degree of dependence on external financial and technical support, and on external energy sources; low levels of cost recovery and demand management; limited resources for maintaining equipment; and customers who expect a high level of service.
4. Anxious to encourage development, electric power and water supply utilities in many PDMCs are facing the combined challenge of diminishing direct external support, and assets and facilities that are in need of replacement or renewal. In the fields of water supply and electric power development ADB is helping the PDMCs improve the service delivery efficiency through institutional and policy adjustments, as well as the improvement of physical assets.
5. However, few utilities in the Pacific region have attempted to define their
service goals, and fewer have attempted to quantify their development needs on the basis of achievements within strategic result areas. The longer-term
Appendix D Asian Development Bank-funded Technical Assitance for Performance Benchmarking for Pacific Power and Water Utilities
Concept Paper: Performance Benchmarks D-4 for Electricity Distribution Companies in South Asia
impacts of their programs have seldom been fully identified. Few have adopted firm benchmarks, based on rational 23performance evaluation criteria, to measure their performance and development progress. Performance targets need to be defined, based on a clearer analysis of expected results; and firm data to measure efficiency and improvement of service delivery needs to be regularly generated and reported. Rationally based strategies and action plans, that set out clear targets for institutional and policy development, as well as improvements to facilities, are required.
6. The need for regional cooperation and exchange of experience was recognized
in the establishment of PPA and PWA. The principal electric power and water supply utilities from each Pacific country are members of one or both of these organizations. PPA and PWA are already fulfilling their roles in disseminating information and sharing experience, but direct contact with member utilities is limited by long travel distances and high travel costs.
7. Electric power and water supply utilities in the Pacific region recognize the
need to adopt rational performance evaluation criteria and performance benchmarking. Electric power utilities have, through PPA, already commenced regional cooperation on this issue. Pacific power and water utilities recognize that, in view of their smallness and remoteness, performance evaluation criteria and benchmarking systems need to be tailored to their specific needs. They have, through PPA and PWA, indicated a high level of commitment to the TA.
8. ADB is currently financing several projects to improve the efficiency of the
delivery of electric power, water supply, and sanitation services in PDMCs. There are ongoing projects in the water supply and power sectors in Kiribati, the Marshall Islands, the Federated States of Micronesia, and Vanuatu. Feasibility studies are being carried out in Cook Islands, Fiji Islands, and Papua New Guinea. Future project financing is programmed for Samoa. The establishment of rational performance benchmarks for use in these relatively small countries will enable the refinement of frameworks to measure medium- and long-term impacts, and will help determine the need for further assistance to the sectors. The TA will enhance the dissemination of information between PDMCs, and will help focus assistance to the special needs of these small, relatively isolated, communities.
23 Asian Development Bank, Manila, 1997SecondWater Utilities Data Book, edited by Arthur C. McIntosh and Cesar E. Yniguez. Asian Development Bank, Manila, 1997 Electric Utilities Data Book. The TA first appeared in ADB Business Opportunitiesin December 199923.
Appendix D Asian Development Bank-funded Technical Assitance for Performance Benchmarking for Pacific Power and Water Utilities
Concept Paper: Performance Benchmarks D-5 for Electricity Distribution Companies in South Asia
III. THE TECHNICAL ASSISTANCE
A. Objectives
9. The objectives of the TA are to assist in (i) improving the delivery of electric power, water supply, and sanitation services through the establishment and adoption of appropriate operational, institutional, and financial performance evaluation criteria and benchmarks within utility organizations; and (ii) developing appropriate regulatory, managerial, and technical practices through consultations between power and water utilities within the Pacific region.
B. Scope
10. The TA will use a participatory approach involving electric power and water supply utilities within the Pacific region. PWA and PPA will be the focal points for discussion, dissemination, and exchange of information. Emphasis will be placed on a participatory workshop in which performance evaluation criteria will be discussed, and utilities will decide on appropriate performance benchmarks. Participants will also draft preliminary action plans to improve the efficiency of service provision; these plan will be refined later. The TA will be implemented in three phases.
11. Phase 1 – Initial Surveys Indicative outputs of utility deliverables, as
presented in the ADB’s Second Water Utilities Data Book and Electric Utilities Data Book, will be developed, updated, and expanded to cover all ADB member countries in the Pacific region. Utilities, which may be water and power utilities, authorities, or government departments, depending on the country concerned will carry out internal surveys of their operations. They will also carry out customer surveys of their operations. Under the auspices of PPA and PWA, the survey may be expanded to cover all of their members. The surveys will cover all facets of utility operations, including population served, consumption, production and generation, demand, supply constraints, system losses, tariffs, demand management measures, financial data, and availability of human resources with appropriate skills to staff the utilities. The PDMCs will provide information on the performance of the water, sanitation, and electric power sectors, and on present policies, and institutional and fiscal arrangements.
12. Phase 2 – Consultations with Pacific Power and Water Supply Utilities A
participatory workshop, will be held at a regional center in the Pacific. Participants will include representatives from governments, power and water supply utilities, and regulatory agencies in the Pacific region. Participants will identify key strategic and results areas for framing performance evaluation criteria, and will determine appropriate performance benchmarks for their utilities. Specific reference will be made to issues of common interest to utilities in the Pacific region. Participants will also discuss the technical standards used by their respective utilities, and methods of adopting and promulgating appropriate technical standards.
Appendix D Asian Development Bank-funded Technical Assitance for Performance Benchmarking for Pacific Power and Water Utilities
Concept Paper: Performance Benchmarks D-6 for Electricity Distribution Companies in South Asia
13. Working papers, including discussion documents, will be prepared and circulated to participants in advance. During the workshop, participants will introduce the results of the surveys carried out in Phase 1 for their respective utilities. Resource persons will prepare papers on specialized subjects of interest to Pacific power and water supply utilities. Selected participants will present case studies based on the experience of their utilities. All participants will draw on the operating experience of their utilities in deciding on appropriate criteria and benchmarks. Participants will formulate outline action plans for improving the performance of their own utilities. Methods of formulating, adopting, and promulgating of appropriate technical standards will also be addressed by the workshop.
14. Phase 3 – Adoption of Evaluation Criteria, Benchmarking, and
Preparation of Action Plans The consultants will prepare a publication that sets out the findings of the workshop, results of the surveys, recommended performance evaluation criteria, methods of applying the performance evaluation criteria to provide benchmarks for assessing utilities’ performance, and methods of promulgating appropriate technical standards. Workshop participants, on returning to their organizations, will develop their outline action plans and incorporate the use of evaluation criteria in their internal and public reporting procedures. Action plans will be forwarded to ADB.
15. PPA and PWA will hold copies of the action plans and public reports for
dissemination, and periodic updating of information and data. In cooperation with PPA and PWA, and through direct contact with utilities that are implementing ADB-financed projects, ADB will monitor the progress of utilities in adopting benchmarking systems and in the implementing action plans.
C. Cost Estimates and Financing Plan
16. The TA is estimated to cost at $250,000. The TA will be financed by ADB on a grant basis from the Japan Special Fund, funded by the Government of Japan. The detailed cost estimates are presented in Appendix 2.
Appendix D Asian Development Bank-funded Technical Assistance for Performance Benchmarking for Pacific Power and Water Utilities
Concept Paper: Performance Benchmarks D-7 for Electricity Distribution Companies in South Asia
D. Implementation Arrangements
17. The TA will be implemented by ADB’s South Pacific Regional Mission. During implementation, ADB will continue to cooperate with electric power and water supply utilities in the Pacific region, through PPA and PWA. In Phase 1, PPA and PWA will coordinate implementation of the initial surveys, and the collection of the survey results. In Phase 2, PPA and PWA will help organize the participatory workshop. Other agencies, including the World Bank and the Economic and Social Commission for Asia and the Pacific, will also attend. At the conclusion of the TA, PPA and PWA will become central agencies for collecting, updating, and disseminating information and data. They will hold data banks and libraries of action plans and public reports on the operating performance of electric power and water supply utilities in the Pacific region. ADB financing will include the costs of workshop attendance of participants from the PDMCs.
18. An international consultant, a specialist in water supply and electric power
management (required for 3.5 person-months), will be based at SPRM, and will facilitate TA implementation. The consultant will prepare questionnaires and information material, and coordinate closely with PPA and PWA to guide the initial surveys. The consultant will coordinate with PPA and PWA to collect and analyze the survey results, prepare working papers for the participatory workshop, and organize and conduct the workshop. The consultant will coordinate with ADB, PPA and PWA in selecting resource persons and lead speakers for the workshop; they will have experience with operation and management of power and water supply systems of particular relevance to the Pacific.
19. Specific issues to be addressed in the resource and participants’ papers will be
identified during Phase 2, and are likely to include utilities management, regulation, and private sector participation. The consultant will be selected as an individual consultant, in accordance with ADB’s Guidelines on the Use of Consultants. Outline terms of reference for the consultant are given in Appendix 3.
20. The TA will be implemented over 15 months. Phase 1 activities will be completed
over 3 months. Phase 2 activities, which will include preparatory work for the participatory workshop, and the workshop itself, will take 6 months. Phase 3 activities, including the preparation, editing, and publication of final reports will be completed in 6 months. The TA will commence in February 2000, and be completed in April 2001.
21. Reports and documents prepared during TA implementation include the collation and
analysis of data from the Phase 1 surveys, and working papers for the participatory workshop in Phase 2. The consultant and the resource persons will prepare the working papers. The TA findings will be summarized in a publication that will include the results of the Phase 1 surveys, recommended performance evaluation criteria, systems of performance benchmarking, methods for reporting utilities’ performance in key results areas, and methods of promulgating appropriate technical standards. A separate report will summarize the utilities’ outline action plans.
Appendix D Asian Development Bank-funded Technical Assistance for Performance Benchmarking for Pacific Power and Water Utilities
Concept Paper: Performance Benchmarks D-8 for Electricity Distribution Companies in South Asia
IV. THE PRESIDENT’S DECISION
22. The President, acting under the authority delegated by the Board, has approved the provision of technical assistance on a grant basis, in an amount not exceeding the equivalent of $250,000 for the purpose of Performance Benchmarking for Pacific Power and Water Utilities and hereby reports such action to the Board.
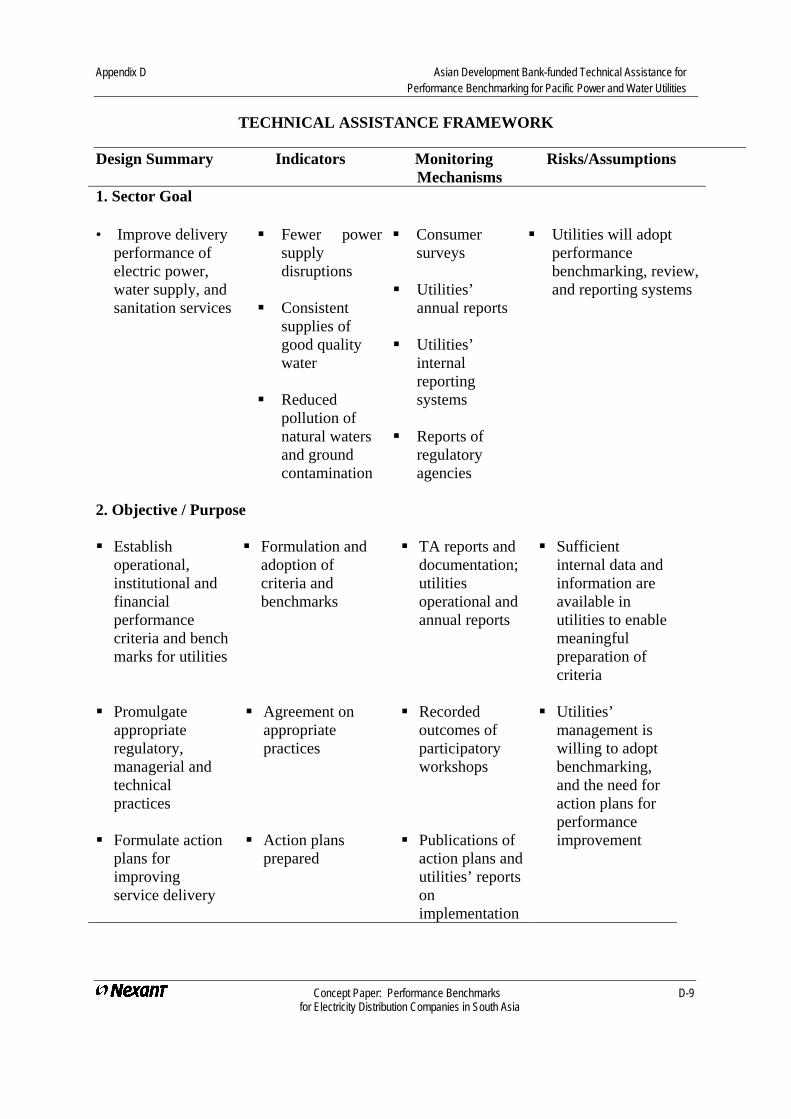
Appendix D Asian Development Bank-funded Technical Assistance for Performance Benchmarking for Pacific Power and Water Utilities
Concept Paper: Performance Benchmarks D-9 for Electricity Distribution Companies in South Asia
TECHNICAL ASSISTANCE FRAMEWORK
Design Summary Indicators Monitoring Risks/Assumptions Mechanisms
1. Sector Goal
• Improve delivery performance of electric power, water supply, and sanitation services
Fewer power supply disruptions
Consistent
supplies of good quality water
Reduced
pollution of natural waters and ground contamination
Consumer surveys
Utilities’
annual reports Utilities’
internal reporting systems
Reports of
regulatory agencies
Utilities will adopt performance benchmarking, review, and reporting systems
2. Objective / Purpose Establish
operational, institutional and financial performance criteria and bench marks for utilities
Promulgate
appropriate regulatory, managerial and technical practices
Formulate action
plans for improving service delivery
Formulation and adoption of criteria and benchmarks
Agreement on
appropriate practices
Action plans
prepared
TA reports and documentation; utilities operational and annual reports
Recorded
outcomes of participatory workshops
Publications of
action plans and utilities’ reports on implementation
Sufficient internal data and information are available in utilities to enable meaningful preparation of criteria
Utilities’
management is willing to adopt benchmarking, and the need for action plans for performance improvement
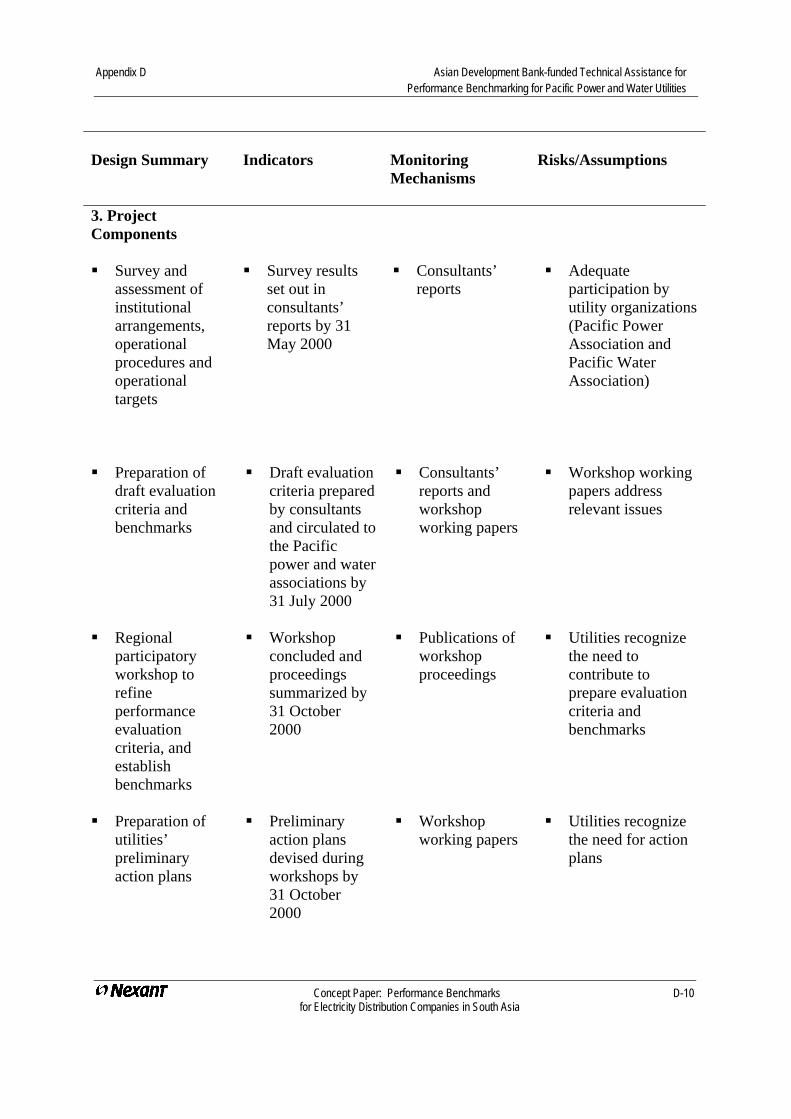
Appendix D Asian Development Bank-funded Technical Assistance for Performance Benchmarking for Pacific Power and Water Utilities
Concept Paper: Performance Benchmarks D-10 for Electricity Distribution Companies in South Asia
Design Summary
Indicators
Monitoring Mechanisms
Risks/Assumptions
3. Project Components
Survey and assessment of institutional arrangements, operational procedures and operational targets
Preparation of
draft evaluation criteria and benchmarks
Regional
participatory workshop to refine performance evaluation criteria, and establish benchmarks
Preparation of utilities’ preliminary action plans
Survey results set out in consultants’ reports by 31 May 2000
Draft evaluation
criteria prepared by consultants and circulated to the Pacific power and water associations by 31 July 2000
Workshop
concluded and proceedings summarized by 31 October 2000
Preliminary
action plans devised during workshops by 31 October 2000
Consultants’ reports
Consultants’
reports and workshop working papers
Publications of
workshop proceedings
Workshop
working papers
Adequate participation by utility organizations (Pacific Power Association and Pacific Water Association)
Workshop working papers address relevant issues
Utilities recognize the need to contribute to prepare evaluation criteria and benchmarks
Utilities recognize the need for action plans
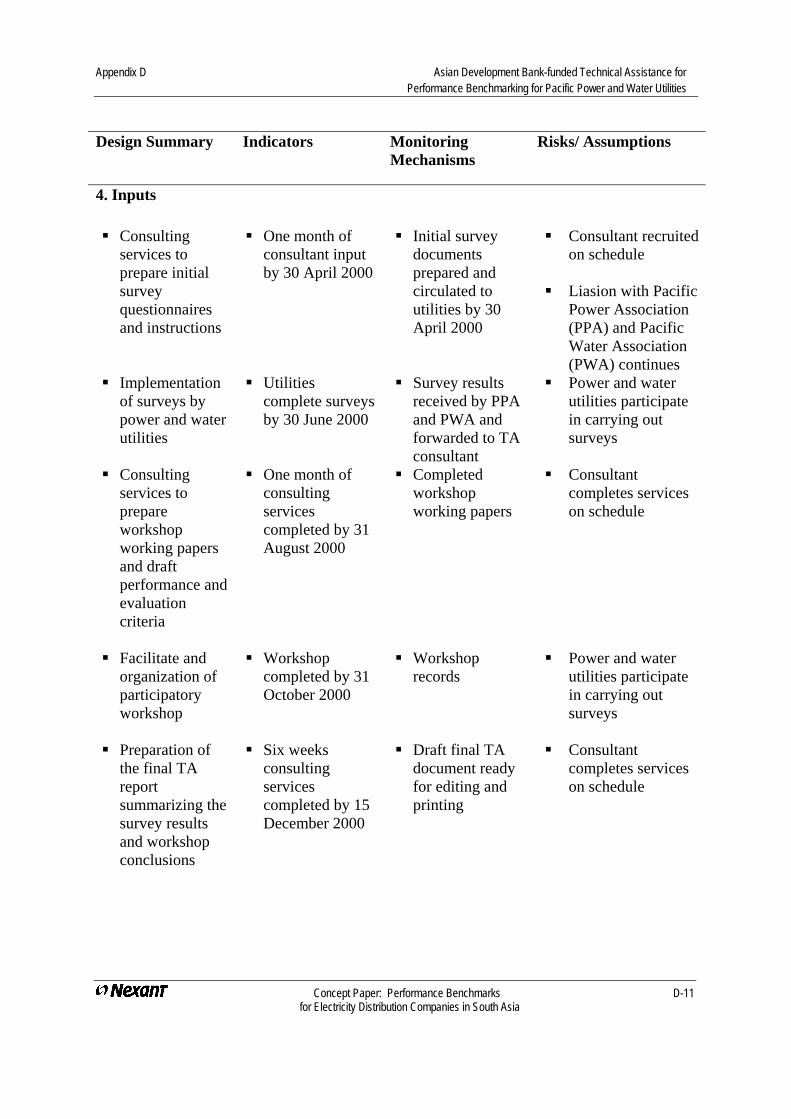
Appendix D Asian Development Bank-funded Technical Assistance for Performance Benchmarking for Pacific Power and Water Utilities
Concept Paper: Performance Benchmarks D-11 for Electricity Distribution Companies in South Asia
Design Summary Indicators Monitoring
Mechanisms Risks/ Assumptions
4. Inputs
Consulting services to prepare initial survey questionnaires and instructions
One month of consultant input by 30 April 2000
Initial survey documents prepared and circulated to utilities by 30 April 2000
Consultant recruited on schedule
Liasion with Pacific
Power Association (PPA) and Pacific Water Association (PWA) continues
Implementation of surveys by power and water utilities
Utilities complete surveys by 30 June 2000
Survey results received by PPA and PWA and forwarded to TA consultant
Power and water utilities participate in carrying out surveys
Consulting services to prepare workshop working papers and draft performance and evaluation criteria
One month of consulting services completed by 31 August 2000
Completed workshop working papers
Consultant completes services on schedule
Facilitate and organization of participatory workshop
Workshop completed by 31 October 2000
Workshop records
Power and water utilities participate in carrying out surveys
Preparation of
the final TA report summarizing the survey results and workshop conclusions
Six weeks consulting services completed by 15 December 2000
Draft final TA document ready for editing and printing
Consultant completes services on schedule
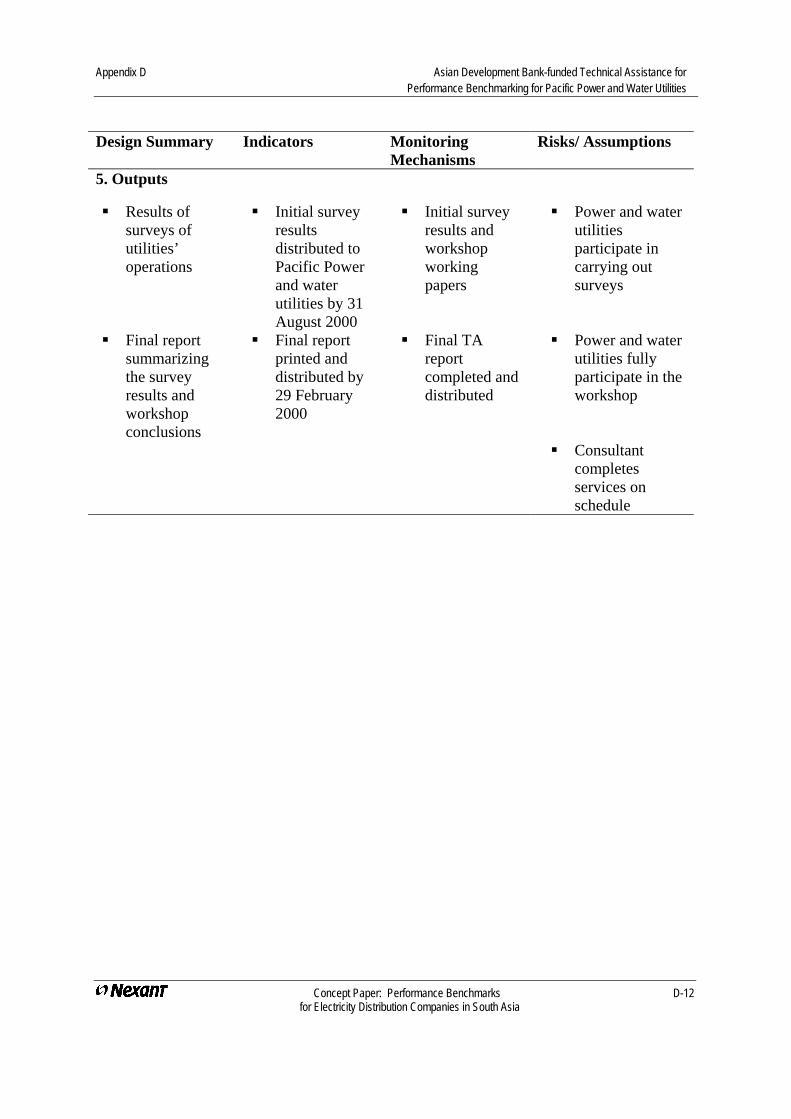
Appendix D Asian Development Bank-funded Technical Assistance for Performance Benchmarking for Pacific Power and Water Utilities
Concept Paper: Performance Benchmarks D-12 for Electricity Distribution Companies in South Asia
Design Summary Indicators Monitoring
Mechanisms Risks/ Assumptions
5. Outputs
Results of surveys of utilities’ operations
Initial survey results distributed to Pacific Power and water utilities by 31 August 2000
Initial survey results and workshop working papers
Power and water utilities participate in carrying out surveys
Final report summarizing the survey results and workshop conclusions
Final report printed and distributed by 29 February 2000
Final TA report completed and distributed
Power and water utilities fully participate in the workshop
Consultant completes services on schedule
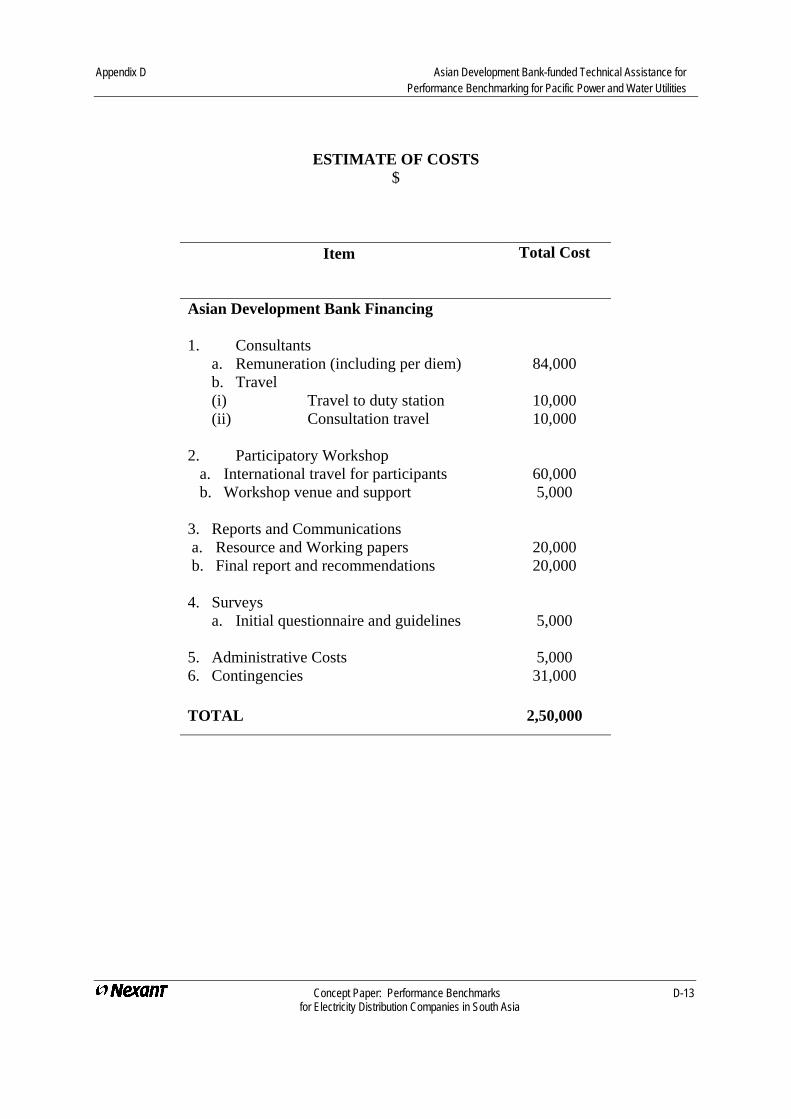
Appendix D Asian Development Bank-funded Technical Assistance for Performance Benchmarking for Pacific Power and Water Utilities
Concept Paper: Performance Benchmarks D-13 for Electricity Distribution Companies in South Asia
ESTIMATE OF COSTS $
Item Total Cost
Asian Development Bank Financing 1. Consultants
a. Remuneration (including per diem) b. Travel (i) Travel to duty station (ii) Consultation travel
2. Participatory Workshop
a. International travel for participants b. Workshop venue and support
3. Reports and Communications a. Resource and Working papers b. Final report and recommendations 4. Surveys
a. Initial questionnaire and guidelines
5. Administrative Costs 6. Contingencies
84,000
10,000 10,000
60,000 5,000
20,000 20,000
5,000
5,000 31,000
TOTAL 2,50,000
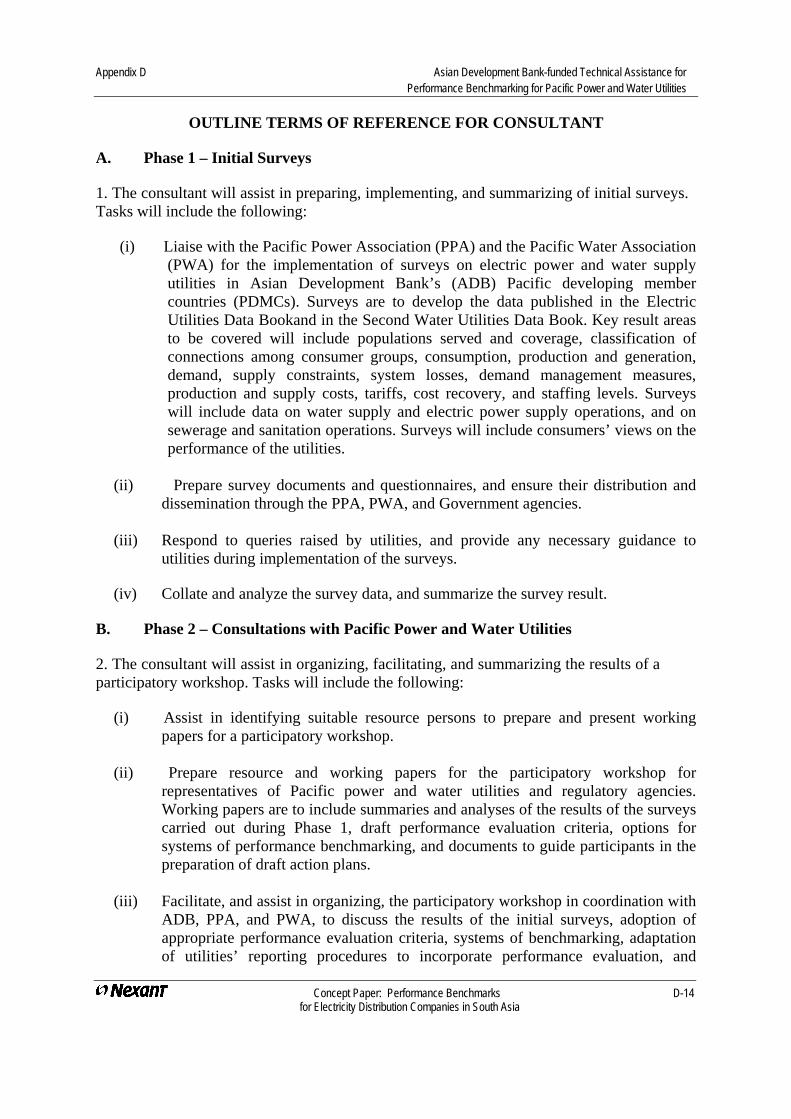
Appendix D Asian Development Bank-funded Technical Assistance for Performance Benchmarking for Pacific Power and Water Utilities
Concept Paper: Performance Benchmarks D-14 for Electricity Distribution Companies in South Asia
OUTLINE TERMS OF REFERENCE FOR CONSULTANT
A. Phase 1 – Initial Surveys
1. The consultant will assist in preparing, implementing, and summarizing of initial surveys. Tasks will include the following:
(i) Liaise with the Pacific Power Association (PPA) and the Pacific Water Association (PWA) for the implementation of surveys on electric power and water supply utilities in Asian Development Bank’s (ADB) Pacific developing member countries (PDMCs). Surveys are to develop the data published in the Electric Utilities Data Bookand in the Second Water Utilities Data Book. Key result areas to be covered will include populations served and coverage, classification of connections among consumer groups, consumption, production and generation, demand, supply constraints, system losses, demand management measures, production and supply costs, tariffs, cost recovery, and staffing levels. Surveys will include data on water supply and electric power supply operations, and on sewerage and sanitation operations. Surveys will include consumers’ views on the performance of the utilities.
(ii) Prepare survey documents and questionnaires, and ensure their distribution and
dissemination through the PPA, PWA, and Government agencies. (iii) Respond to queries raised by utilities, and provide any necessary guidance to
utilities during implementation of the surveys.
(iv) Collate and analyze the survey data, and summarize the survey result.
B. Phase 2 – Consultations with Pacific Power and Water Utilities
2. The consultant will assist in organizing, facilitating, and summarizing the results of a participatory workshop. Tasks will include the following:
(i) Assist in identifying suitable resource persons to prepare and present working papers for a participatory workshop.
(ii) Prepare resource and working papers for the participatory workshop for
representatives of Pacific power and water utilities and regulatory agencies. Working papers are to include summaries and analyses of the results of the surveys carried out during Phase 1, draft performance evaluation criteria, options for systems of performance benchmarking, and documents to guide participants in the preparation of draft action plans.
(iii) Facilitate, and assist in organizing, the participatory workshop in coordination with
ADB, PPA, and PWA, to discuss the results of the initial surveys, adoption of appropriate performance evaluation criteria, systems of benchmarking, adaptation of utilities’ reporting procedures to incorporate performance evaluation, and
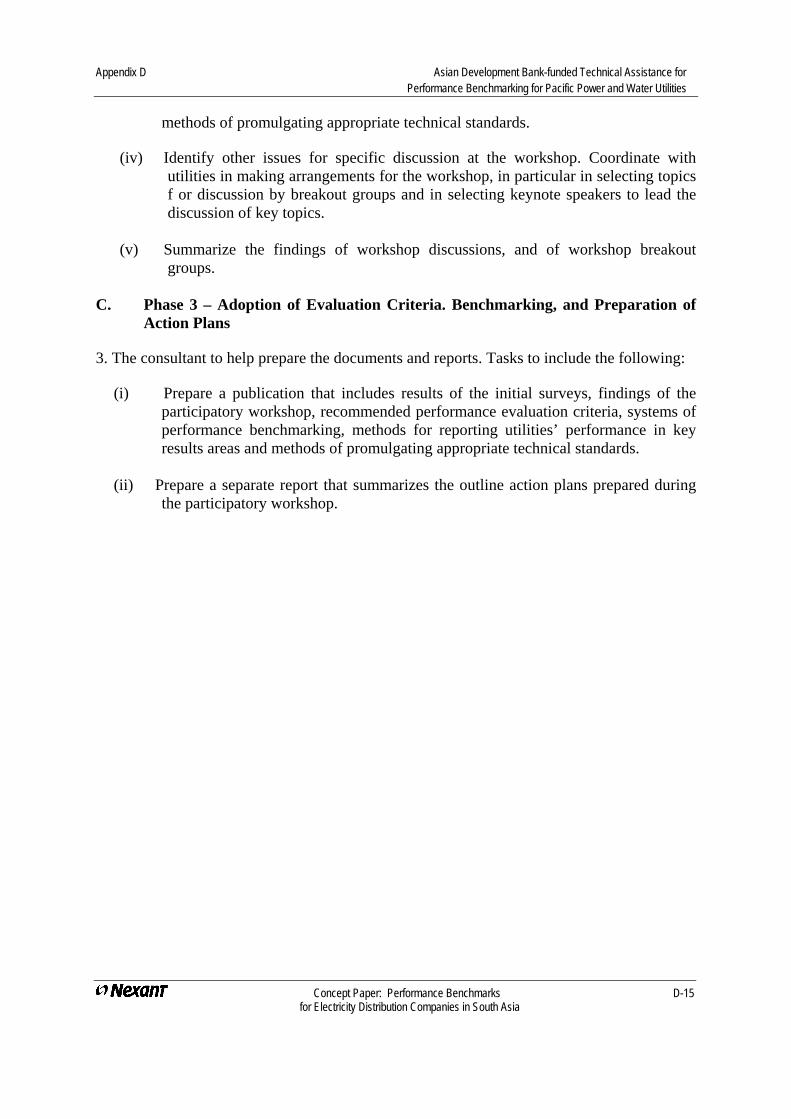
Appendix D Asian Development Bank-funded Technical Assistance for Performance Benchmarking for Pacific Power and Water Utilities
Concept Paper: Performance Benchmarks D-15 for Electricity Distribution Companies in South Asia
methods of promulgating appropriate technical standards.
(iv) Identify other issues for specific discussion at the workshop. Coordinate with utilities in making arrangements for the workshop, in particular in selecting topics f or discussion by breakout groups and in selecting keynote speakers to lead the discussion of key topics.
(v) Summarize the findings of workshop discussions, and of workshop breakout groups.
C. Phase 3 – Adoption of Evaluation Criteria. Benchmarking, and Preparation of
Action Plans
3. The consultant to help prepare the documents and reports. Tasks to include the following:
(i) Prepare a publication that includes results of the initial surveys, findings of the participatory workshop, recommended performance evaluation criteria, systems of performance benchmarking, methods for reporting utilities’ performance in key results areas and methods of promulgating appropriate technical standards.
(ii) Prepare a separate report that summarizes the outline action plans prepared during
the participatory workshop.