performance evaluation of high strength quasi …
TRANSCRIPT

PERFORMANCE EVALUATION OF HIGH STRENGTH
ALLOY STEEL CAST CONNECTOR UNDER
QUASI-STATIC LOAD
by
Sharad Dangol
A thesis submitted to the faculty of The University of Utah
in partial fulfillment of the requirements for the degree of
Master of Science
Department o f Civil and Environmental Engineering
The University o f Utah
May 2013

Copyright © Sharad Dangol 2013
All Rights Reserved
The U n i v e r s i t y of Ut ah G r a d u a t e Sc ho o l
STATEMENT OF THESIS APPROVAL
The thesis of __________________________ Sharad Dangol
has been approved by the following supervisory committee members:
Luis F. Ibarra , Chair 03/07/2013Date Approved
Chris P. Pantelides , Member 03/07/2013Date Approved
Janice J. Chambers , Member 03/07/2013Date Approved
and by __________________Chris P. Pantelides__________________ , Interim Chair of
the Department of _____________ Civil and Environmental Engineering____________
and by Donna M. White, Interim Dean of The Graduate School.

ABSTRACT
High strength alloy steel cast connector refers to a bracing system to be used in
James L. Greene Science Center, Columbia University in New York. The cast
connectors, as the name suggests, are the connection elements in a bracing system that
uses stainless steel rods as the braces instead of traditional steel sections.
The bracing system was designed to support lateral wind load. The cast connector
material is A148 GR. 115/95 (ASTM A958, 2006). The nominal yield strength is f y = 95
ksi, whereas the nominal ultimate strength is f u = 115 ksi. Although the material has very
high yield strength, its ductility is rather limited. Hence, limiting the use o f the
connectors in a quasi-static load like wind load.
This study evaluates cast connector performance under monotonic and cyclic
loading. Experimental results are validated by a finite element (FE) model created in
ANSYS (Chapter 4).
Initial proposed tests on the cast connector specimens showed linear performance.
For loads o f 2 and 2.5 times the design load (P = 275 kip), the test specimens exhibited
linear behavior. Further tests with increased load were performed on a second specimen
(Cast Connector 2) to obtain nonlinear behavior and connector failure modes. The non
linear portion of the curve was not well developed as one would expect for steel, which
demonstrated the brittleness of the material.

TABLE OF CONTENTS
ABSTRACT................................................................................................................................ Ill
LIST OF FIGURES.....................................................................................................................vl
LIST OF TABLES...................................................................................................................... lx
ACKNOWLEDGMENTS......................................................................................................... xl
Chapters
1. INTRODUCTION....................................................................................................................1
1.1 Background.....................................................................................................................11.2 Objectives....................................................................................................................... 2
2. LITERATURE REVIEW ....................................................................................................... 3
2.1 Introductlon.....................................................................................................................32.2 Cast Steel vs. Mllled Steel............................................................................................42.3 Factors Governlng the Steel Castlng D eslgn............................................................. 52.4 Use of Cast Connectors ln Braclng System............................................................... 62.5. Analysis Techniques for Cast Connectors’ Structural Performance..................... 8
3. TEST SETUP AND DESCRIPTION OF CAST CONNECTORS..................................9
3.1 Cast Connector Descrlptlon..........................................................................................93.2 Descrlptlon of Test Performed...................................................................................12
3.2.1 Force vs. Dlsplacement Controlled Loadlng................................................123.2.2 Test Procedures................................................................................................ 14
3.3 Materlal Characterlstlcs.............................................................................................. 163.4 Experlmental Results for Tests Performed on Cast Connector 1..........................16
3.4.1 Monotonlc Test: Maxlmum Applled Load 2P = 550 klps (CC1-T1).......183.4.2 Cycllc Test: Maxlmum Applled Load 2.5P = 688 klps (CC1-T2)........... 23
3.5 Experlmental Results for Cast Connector 2 ............................................................. 323.5.1 Monotonlc Test (CC2-T1).............................................................................. 343.5.2 Cycllc Test (CC2-T2)...................................................................................... 39
3.6 Addltlonal Test Performed on Cast Connector 2 .................................................... 42

3.6.1 Additional Test 1: Maximum Load 826 kips (1.2 x 2.5P = 3P )................453.6.2 Additional Test 2: Maximum Load 894 kips (1.3 x 2.5P = 3.25P).......... 453.6.3 Additional Test 3: Maximum Load 888 kips............................................... 453.6.4 Additional Test 4: Single Leg Loaded, Maximum Load 482 k ip s ........... 493.6.5 Additional Test 5: Single Leg Loaded, Maximum Load 475 k ip s ........... 50
3.7 Summary of Experimental Tests............................................................................... 52
4. FINITE ELEMENT MODELING...................................................................................... 53
4.1. FE Modeling of Cast Connector 1............................................................................534.1.1 Verification of the Model in a Different FE Program.................................574.1.2 Mesh Refinement Study (Convergence Study):..........................................58
4.2 FE Modeling of Cast Connector 2 ............................................................................. 584.3 Parametric Study......................................................................................................... 64
4.3.1 Modulus of Elasticity (E ) ............................................................................... 644.3.2 Postyielding Slope............................................................................................684.3.3 Yield Stress....................................................................................................... 70
5. DISCUSSION........................................................................................................................ 71
5.1 Evaluation of Laboratory Tests..................................................................................715.2 Evaluation of FE Analysis..........................................................................................725.3 Limitations of the Study............................................................................................. 72
6. CONCLUSIONS AND RECOMMENDATIONS............................................................74
6.1 Conclusions...................................................................................................................746.2 Recommendations ....................................................................................................... 75
Appendices
A. ANALYSIS OF DIFFERENT STRUCTURAL COMPONENTS................................77
B. STRAIN RATE COMPUTATION....................................................................................88
C. NORTH STAR CASTEEL REPORT................................................................................ 92
D. LVDT AND STRAIN GAGE CHARACTERISTICS.................................................... 95
REFERENCES............................................................................................................................98
v

LIST OF FIGURES
3.1: Steel Cast Connectors Used in the Experimental Tests.................................................10
3.2: Test Assembly Elevation...................................................................................................10
3.3: Subassembly for Cast Connector for Experimental T ests............................................ 11
3.4: Stress-Strain Curves for Different Steel Materials.........................................................17
3.5: LVDTs and Strain Gages Location on Cast Connector 1 (View I) ............................. 17
3.6: LVDTs and Strain Gages Location on Cast Connector 1 (View I I ) ........................... 18
3.7: Maximum Strains for Monotonic Test of Cast Connector 1 ........................................22
3.8: Strain Variation with Time: (a) SG # 10; (b) SG #11; (c) SG # 7 .............................. 24
3.9: Stress-Strain Curves (Monotonic test): (a) SG # 10; (b) SG # 11; (c) SG # 7 ........... 25
3.10: Cyclic Loading Protocol for Cast Connector 1 ............................................................ 26
3.11: Maximum Strain for Cyclic Test of Cast Connector 1 (View I ) ................................28
3.12: Maximum strain for cyclic test of Cast Connector 1 (View I I ) .................................29
3.13: Deformation and Strains for Cast Connector 1 under Final C y cle ........................... 29
3.14: Differential Strain at Strain Gage # 1 ............................................................................ 31
3.15: Strain vs. Time Curves: (a) SG # 10; (b) SG # 7 .........................................................31
3.16: Cyclic Test Stress-Strain Curves for Strain Gage 1 0 ..................................................32
3.17: Strain Gages on Cast Connector 2 for Monotonic and Cyclic Tests......................... 33
3.18: Maximum Strains for Monotonic Test of Cast Connector 2 ...................................... 37
3.19: Strain Variation with Time for: (a) SG # 4; (b) SG #10 ............................................. 38

3.20: Stress-Strain Curves for Strain Gage 4 ..........................................................................38
3.21: Original Cyclic Loading Protocol for Cast Connector 2 ............................................ 39
3.22: Strain vs. Time Curves for: (a) SG # 4; (b) SG # 10...................................................42
3.23: Maximum Strains for Cyclic Test of Cast Connector 2 (CC2-T2)........................... 43
3.24: Stress-Strain Curves for Strain Gage 4 ..........................................................................44
3.25: Loading Protocol for Additional Test 1.........................................................................46
3.26: Load vs. Strain Curve for SG # 4 ...................................................................................46
3.27: Strain vs. Time Curve for SG # 4 ...................................................................................47
3.28: Loading Protocol for Additional Test 2 .........................................................................47
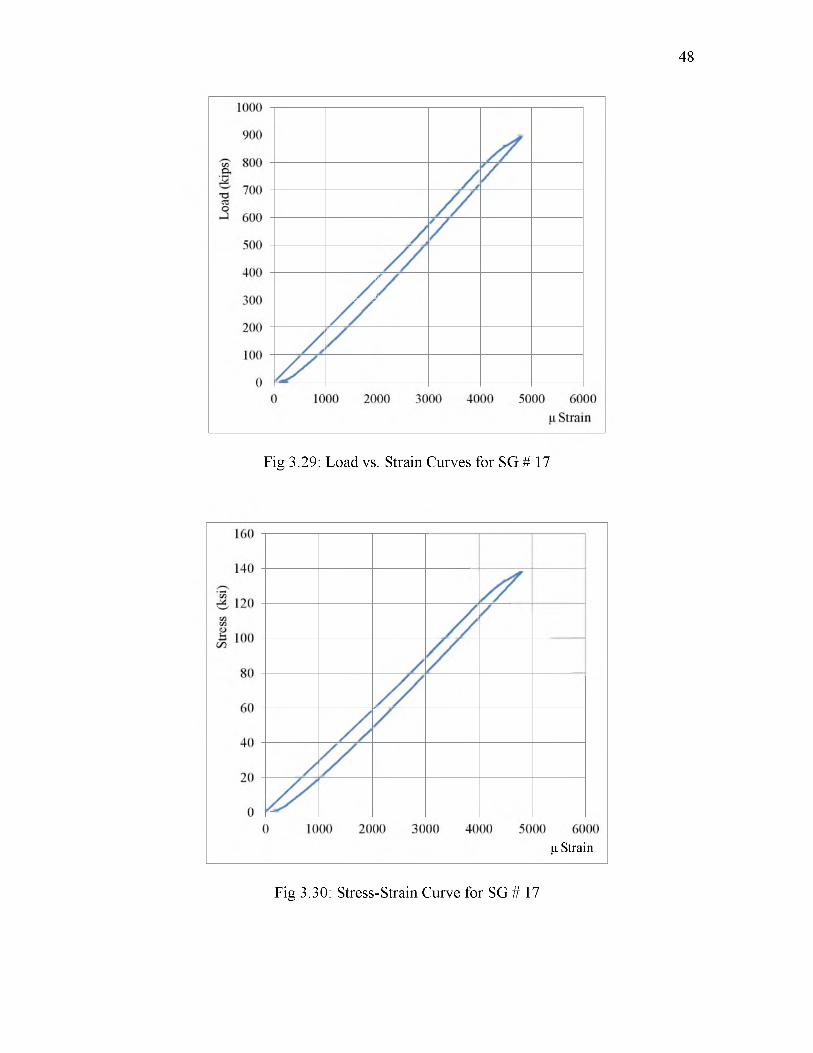
3.29: Load vs. Strain Curves for SG # 17............................................................................... 48
3.30: Stress-Strain Curve for SG # 17..................................................................................... 48
3.31: Loading Protocol for Additional Test 3 .........................................................................49
3.32: (a) Load vs. Strain for SG # 17; (b) Strain vs. Time SG # 17.................................... 50
3.33: Loading Protocol for Additional Test 5 .........................................................................51
3.34: Load vs. Strain for SG # 5 .............................................................................................. 51
3.35: Stress-Strain Curve for SG # 5 ....................................................................................... 52
4.1: von Mises Stress Distribution in Cast Connector 1 at 688 kips (View I ) ................... 54
4.2: von Mises Stress Distribution in Cast Connector 1 at 688 kips (View I I ) .................55
4.3: Comparison of Load-Stress Curves from Lab Tests and FE Analysis (CastConnector 1)................................................................................................................. 56
4.4: von Mises Stress Distribution for Cast Connector 1 at 1044 k ip s .............................. 57
4.5: Plot of Relative Error with Respect to Number of Elements........................................59
4.6: von Mises Stress Distribution on Cast Connector 2 at 709 kips..................................60
4.7: Comparison of Load-Stress Curves from Lab Tests and FE Analysis (709 kips)..... 60
vii

4.8: Comparison of Load-Stress Curves: (a) SG # 4; (b) SG # 17...................................... 61
4.9: Comparison of Load-Stress Curves from Lab Tests and FE Analysis........................62
4.10: von Mises Stress Distribution on Cast Connector 2 at 516.6 kip.............................. 62
4.11: Load-Stress Curves from Lab Tests and FE Analysis at Failure Load (a) SG # 4;(b) SG # 8; (c) SG # 17............................................................................................... 63
4.12: Idealized Bilinear Stress-Strain Curves.........................................................................65
4.13: Load vs. Stress Curves for Three Different Modulus of Elasticity (SG #1, CastConnector 1)................................................................................................................. 66
4.14: Load vs. Stress Curves for Different Modulus of Elasticity (Cast Connector 2)(a) SG #4; (b) SG # 8...................................................................................................66
4.15: Load vs. Stress Curves for Different Modulus of Elasticity (Cast Connector 2)SG # 17......................................................................................................................... 67
4.16: Location A (left); Load vs. Stress Curve for Location A (right)................................68
4.17: Idealized Stress-Strain Curves with Different Tangential Slopes.............................. 69
5.1: Graphical Form of the Bertella-Oliver Equaiton...........................................................73
A. 1: Frame Label and Load Assignment................................................................................ 78
A.2: Joint Assignment............................................................................................................... 78
A.3: Extruded View of the Subassembly Modeled in SAP 2000 ........................................79
A.4: Joint Reactions (Force in kips)........................................................................................ 79
A.5: Axial Force on the Members (Force in k ips).................................................................80
A.6: Shear Force on the Members (Force in kips).................................................................80
A.7: Finite Element of Top Assembly Plate in SAP 2000 ...................................................83
A.8: von Mises Stress Distribution Contour...........................................................................83
A.9: Connection Detail of Joint 2 and 6 ..................................................................................85
viii

LIST OF TABLES
3.1: LVDT Deflectlon Readlng for CC1-T1. Maxlmum Load = 2.0 P = 550 klps........... 19
3.2: Strain Gage Reading (p strain) for CC1-T1 (Fork and Leg Locatlons). MaxlmumLoad = 2.0 P = 550 klps.............................................................................................. 21
3.3: Strain Gage Reading (p strain) for CC1-T1 (Base Locatlons)..................................... 21
3.4: LVDT Deflectlon Readlng for Last Cycle of CC1-T2..................................................26
3.5: Strain Gage Reading (p strain) for Last Cycle of CC1-T2 (Gages at Fork andLegs).............................................................................................................................. 27
3.6: Strain Gage Reading (p strain) for Last Cycle of CC1-T2...........................................27
3.7: LVDT Deflectlon Readlng for CC2-T1...........................................................................34
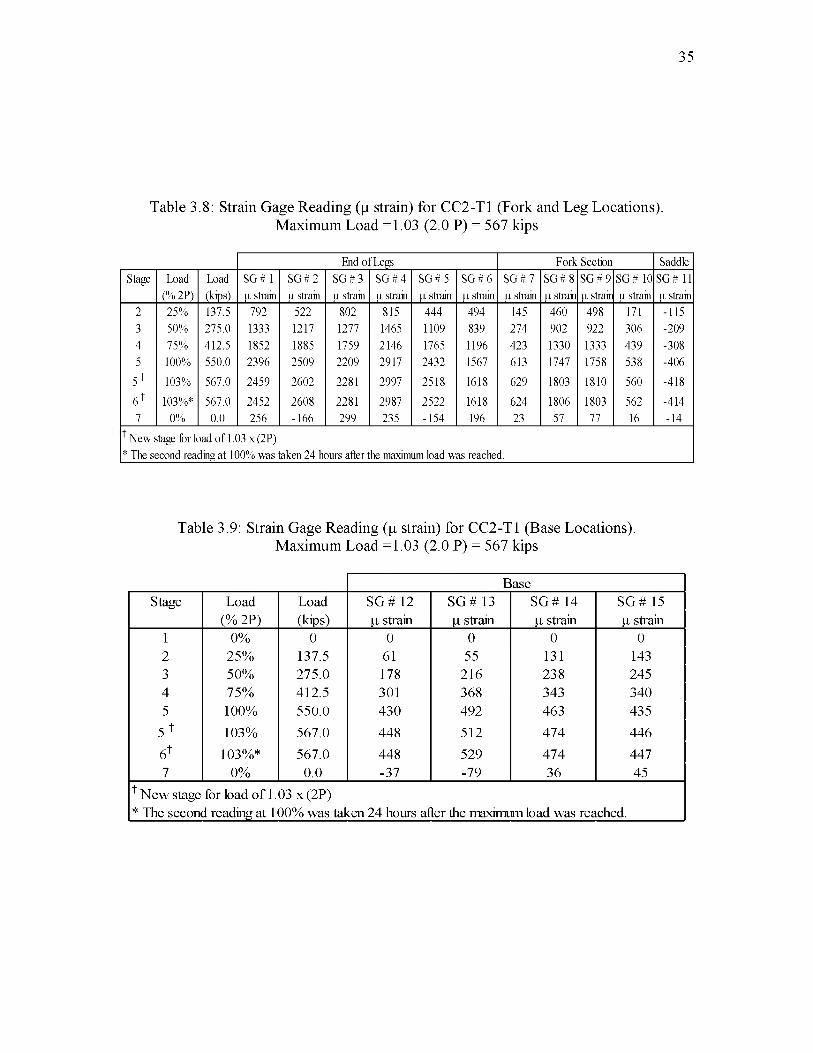
3.8: Strain Gage Reading (p strain) for CC2-T1 (Fork and Leg Locatlons)...................... 35
3.9: Strain Gage Reading (p strain) for CC2-T1 (Base Locatlons)......................................35
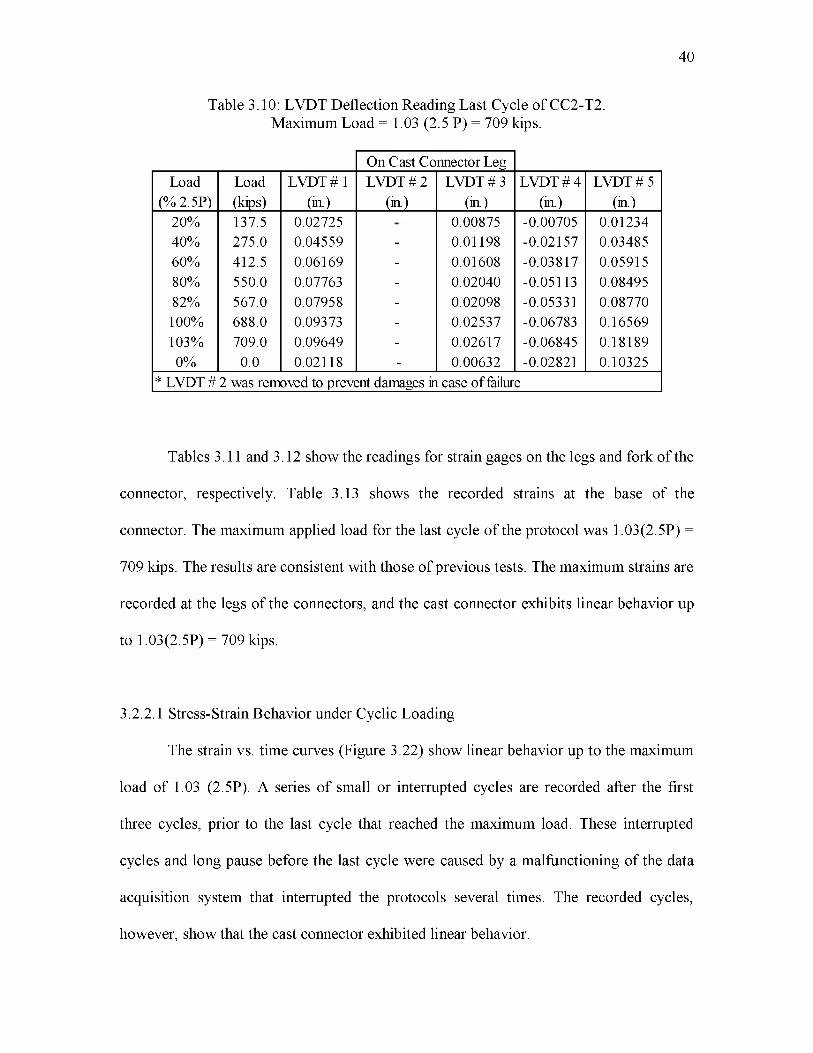
3.10: LVDT Deflectlon Readlng Last Cycle o f CC2-T2...................................................... 40
Table 3.11: Strain Gage Reading (p strain) for Last Cycle of CC2-T2 (Leg Locatlon). .. 41
3.12: Straln Gage Reading (p strain) for Last Cycle of CC2-T2 (Fork and SaddleLocatlon)....................................................................................................................... 41
3.13: Straln Gage Reading (p strain) for Last Cycle of CC2-T2 (Base Locatlon)............ 41
4.1: Results from Convergence Study wlth Relatlve Error...................................................59
4.2: Comparlson of Fallure Load for Dlfferent Modulus of E lastlclty .............................. 65
4.3: Comparlson of Fallure Load for Dlfferent Tangentlal Slopes..................................... 69
4.4: Comparlson of Fallure Load for Dlfferent Yleld Stress................................................70

A. 1: Demand/Capacity Ratio of Each Member of the_Subassembly for a Load of688 kips......................................................................................................................... 81
A.2: Joint Displacements...........................................................................................................81
A.3: Calculations of Joint Capacity using ICR M ethod....................................................... 84
B.1: Strain Rate Calculation for Cast Connector 1 ............................................................... 89
B.2: Strain Rate Calculation for Cast Connector 2 (Monotonic T est)................................90
B.3: Strain Rate Calculation for Cast Connector 2 (Cyclic T est)........................................91
x

ACKNOWLEDGMENTS
I would like to express my sincere gratitude towards my advisor, Assistant Prof.
Luis Ibarra for all the mentoring and support he provided through each and every step.
Special thanks go to the other members of supervisory committee, Prof. Chris Pantelides
and Associate Prof. Janice Chambers.
I am also thankful for all the help provided by Mark Bryant and Wade Stinson
during instrumentation o f the cast connector subassemblies and to Justin Page for the
fabrication o f the subassembly. Dr. Scott Adan, principal o f Adan Engineering, needs
special mention for providing valuable and necessary information necessary to carry out
the experimental tests and to complete this thesis.
Fellow graduate students and friends also deserve a vote o f thanks. Help and
support from Joel Parks, Esra Hasanbas, Birhanu Bishaw and Kalen Wilson are much
appreciated. Last but not the least: I owe huge thanks towards my mom, sister and
brother.
Any opinions, finding and conclusions or recommendations expressed in this
thesis are mine. Comments, constructive criticism and any recommendations are heartily
welcomed.

CHAPTER 1
INTRODUCTION
1.1 Background
The cast connector is a part of a new bracing system to be used in the James L.
Greene Science Center at Columbia University in New York (NY). The bracing system
provides lateral stability to the building under wind load. Each cast connector has to
withstand a design load (P) of 275 kip. This bracing system was tested for the first time at
full-scale in this experiment.
Each specimen o f cast connector (Cast Connector 1 and 2, see Section 1.2) was
subjected to monotonic and cyclic tests. The monotonic test followed the procedure for
testing notch bracing casting connection assembly of the New York City Building Code
(NYCBC, 2012; Section 1714.3.1). The cyclic test included tensile loading and unloading
cycles, but no compression loading cycles due to the nature of the bracing system. The
connectors performed within the linear interval during the above tests. Hence further tests
were performed on Cast Connector 2 (section 1.3).
The results from the experiments are presented in this thesis along with results
from Finite Element (FE) analysis. Experimental tests were carried out on two connectors
under quasi-static loading. The experimental test results reproduced in FE analysis to

determine the main parameters controlling the performance of cast connectors under
quasi-static loading.
1.2 Objectives
The main objective o f this study is to evaluate the performance of a novel cast
connector under quasi-static tensile loading using experimental tests and numerical
simulations. The numerical analyses are used to identify the parameters controlling the
cast connector response.
2

CHAPTER 2
LITERATURE REVIEW
2.1 Introduction
In recent years, the usage of steel castings has increased in frequency o f use and
variety of applications. Steel castings became increasingly popular, especially in Europe,
after they were used in the main stadium at the 1972 Olympics Games in Munich,
Germany. However, the use o f steel cast components remained limited to special
applications. Lack of sufficient research data is one of the main reasons behind the
limited applications.
Traditional methods connect multiple members by using complex connection
details, a complexity that can be reduced by using cast members or cast connectors. Steel
casting connections use members formed by pouring molten metal into a mold, which is
then connected to other structural members. This facilitates the fabrication process and
enhances the system’s aesthetics because the casting can be molded into any geometry.
This allows designer flexibility in selecting a bracing system that meets load carrying
capacity requirements as well as an attractive aesthetic appearance. Despite these

apparent beneflts the development of steel castlngs as structural elements has not been
satlsfactory.
Conventlonal connectlons tend to lnclude complex detalls leadlng to
constructablllty problems, such as mlsallgnment, lncorrect drawlng lnterpretatlon, lack of
avallable lnformatlon, hlgh fabrlcatlon and assemblage costs, among others. Steel
castlngs are capable of overcomlng these requlrements, but there are no sufflclent
research studles on the performance o f steel castlng connectors. Moreover deslgners,
fabrlcators and erectors are unaware of the benefits of steel castlng components.
2.2 Cast Steel vs. Milled Steel
The term “cast steel” refers to steel castings of high strength alloy steel. It is a
speclallzed form of castlng that ls used when normal (mllled) steel cannot dellver enough
strength or the requlred geometry. Cast steel ls produced by pourlng molten steel mlxture
lnto a preformed mold of the requlred geometry. Whereas, “milled steel” refers to steel
that ls manufactured by steel mllls uslng tradltlonal methods, and lt ls avallable only ln
flxed forms or shapes.
The use of cast or mllled steel has pros and cons. Cast steel can be formed to
requlred dlmenslons or geometry, and has hlgher strength than mllled steel. However,
such hlgh strength cast steel has low ductlllty compared to mllled steel. Also, the
structural behavlor of cast steel ls not very well known. On the other, hand mllled steel ls
a ductlle materlal has been used and studled for a long tlme now. On the down slde,
mllled steel strength ls lower compared to cast steel. Sometlmes, strength requlrement
dlctates the complexlty jolnt and slze for elements to be used. Heavy jolnt detalllng
4

5
required when using such steel can be easily simplified using cast steel connections.
Hence, cast steel can be a good alternative to tradition steel design provided proper study
has been conducted.
2.3 Factors Governing the Steel Casting Design
Chen et al. (2010) conducted studies of two types of steel cast connectors and
concluded that the design and performance o f cast steel joints are governed primarily by
the geometric configuration, casting process and joint structural behavior. Usually, the
cast steel connectors have higher strength than the members they connect. They found
that in some cases, aesthetic and casting process control the design rather than the
functional requirement of steel casting joint.
Chen et al. found that stresses in the steel casting are usually lower than those
predicted by analytical formulations. This discrepancy pointed out, that the exact
prediction of stress distribution and stress flow routine in the cast steel joint is very
difficult using simple computations.
Monroe and Poweleit (2003) performed cast steel connector tests, concluding that
although the functional requirements are the primary factors governing the connector
design, geometric complexities and the casting process play a vital role. They also found
that the connected members usually fail before the steel cast connectors, as expected from
the applied design philosophy.
Their study also provided insights on the effect of strength, ductility, weldability
of materials used for the casting on the overall connectors’ performance. Increasing the

6
strength of steel normally reduces its ductility, toughness and weldability. Hence, it is
often desirable to use lower strength grade steel and increase the section size.
Bjorhovde (2010) pointed that limited deformation capacity o f high strength steel
could be problematic, in part because knowledge data base are very limited. Response
characteristics o f high strength steel are still not fully known. This presents challenges as
well as opportunities to engineers and designers to investigate more into application of
such materials.
2.4 Use of Cast Connectors in Bracing System
Steel castings are broadly used in industrial equipments as connectors or
component parts. Steel casting applications in structures have been limited to
compression members, although recently their use is gaining popularity in other areas as
well. Their use in the main stadium at 1972 Olympic Games in Munich increased their
popularity. Cast connectors are used commonly in bridge applications to replace
complicated welded connections. In buildings, castings have mostly been used for
architecturally exposed connections, particularly bracing connections.
Casting connectors are used in many large-span spatial structures and high-rise
buildings (e.g., the “Bird’s Nest” stadium for Beijing Olympics) because they can be
fabricated in a large variety of geometrical shapes and with high strength steel.
Bracing systems are mostly designed to take tensile load. According to Bjorhovde
(2010), high strength materials give major advantage in tension members and connection
applications. Full advantage of higher strength of materials could be taken because

slenderness, local or overall buckling and rotation capacity are rarely considered for
tension members.
Monroe and Poweleit (2003) mentioned that, “steel castings are expensive sources
of steel but cheap suppliers o f geometry” to indicate that high steel casting costs can be
easily compensated by savings achieved by fabricating and assembling less parts, and
optimization of material and system geometry.
Engineers and designers are currently working to establish pre-engineered
connection design and fabrication for hollow structural section connections. Studies are
focused on using cast connectors to modify standard fabrication practices for seismic-
resistant and aesthetic pin connections for hollow structural section. Oliveira et al. (2008)
evaluated the seismic performance o f a proprietary cast connector design. They identified
cases where the use o f mass produced cast steel components could provide significant
advantages over standard fabrication practices. Their study focuses on development of
seismic-resistant and aesthetic pin connections for hollow structural sections using
standardized cast steel connectors developed at the University o f Toronto.
The cast connectors evaluated in this study are part of a bracing system designed
to withstand tensile stress caused by lateral wind loads. The steel castings connect solid
stainless steel rods as braces, unlike other system used for connecting HSS bracing. This
is rather new concept compared to traditional bracing systems.
7

2.5. Analysis Techniques for Cast Connectors’ Structural Performance
The flexibility to fabricate castings of complex geometry presents engineers and
designers with a tough task of analyzing their performance. In general structural design,
the connection behavior can be computed using standard equations for joint capacity.
Numerical, analytical and/or experimental techniques are necessary to predict the
behavior cast connectors with complicated geometry. However, information on structural
design methods o f cast connectors is sparse. Most o f the available data refers to the
mechanical properties of weldable steel castings (Herrion et al. 2007). The studies on the
developments and applications o f casting connections are limited and focused on the
mechanical properties o f casting, casting design, and quality control, rather than the
structural design (Poweleit 2006 and Puthli 2008).
Unlike other steel components, steel casting manufacturing processes involved are
not standardized. The casting process, including pouring into cast, cooling and heat
treatment, may vary widely for different cases. This variation in casting processes affects
the casting behavior. For these reasons standard methods for cast connector design are
not available, and experimental tests and FE analyses are needed to validate new
connector designs
Experimental tests can provide insights into strain distributions and failure modes,
but there are limitations on the number o f tests that can be performed, as well as in
measuring techniques. In addition, for full scale specimens, it is usually difficult to obtain
plastic deformations, or reach final failure due to loading capacity limitations. To
overcome these limitations, FE analyses are performed to complement experimental tests.
8

CHAPTER 3
TEST SETUP AND DESCRIPTION OF
CAST CONNECTORS
3.1 Cast Connector Description
The two cast connector specimens tested in this study are the two-halves of a
single connector. The steel casting connections are welded to the column. To facilitate
the testing of the connector, the tested specimens were cast as two separate halves. Figure
3.1 shows the tested two cast connectors. Both connectors have two circular legs 2.25 in.
in diameter, coming out from 2 in. thick base. The orientation of the two legs and the
geometry of the two connectors vary as shown in Figure 3.1.
A subassembly was fabricated to support the tension loads applied to the cast
connector. Figure 3.2 shows the test assembly elevation used for fabrication. Figure 3.3
presents the subassembly for Cast Connector 2, as installed in the tower frame at the
structural laboratory of the University of Utah. This tower frame has a 2000 kip-actuator,
and it is capable o f withstanding more than two times the factored design loads applied to
the cast connectors.
The components and joints o f the subassembly and top assembly plate (Figures
3.2 and 3.3) were analyzed using SAP 2000 (CSI, 2009). The structural components’

10
Cast Connector 1
Flg 3.1: Steel Cast Connectors Used ln the Experlmental Tests
Flg 3.2: Test Assembly Elevatlon (Reprlnted wlth permlsslon from Adan Englneerlng, LLC, 2012)

11
Fig 3.3: Subassembly for Cast Connector for Experimental Tests

12
strength capacity and deflection limits were evaluated for a maximum load of 2.5P = 688
kips (Appendix A).
3.2 Description of Test Performed
ASTM A 370-05, Standard Test Methods and Definitions for Mechanical Testing
of Steel Products, describes several tests applicable to wrought and cast steels, stainless
steels and related alloys. These tests include tension test, bend test, hardness test, and
charpy impact testing.
Tension test is related to the mechanical testing of steel products subjected to a
measured load sufficient to cause rupture. Main properties sought are yield point, yield
strength, tensile strength, elongation and reduction of area.
Generally the loading o f the test specimen is done by two loading systems,
mechanical (screw power) and hydraulic. The essential requirement is that the load
should be transmitted axially. Any convenient speed of testing may be used up to 0.5
yield point or yield strength. If the machine is equipped with a device to indicate rate of
loading, the rate of loading from 0.5 yield point or yield strength through the yield point
or strength should not exceed 100,000 psi/min. However the minimum rate of stressing
shall not be less than 10,000 psi/min.
3.2.1 Force vs. Displacement Controlled Loading
The tension test can be categorized as per the method of loading to control speed
of testing. The speed of testing is important because mechanical properties are a function
of strain rate (Davis, 2004). Generally, a slow speed test results in lower strength values

and larger ductility than a fast speed test. A test’s speed can be determined by one o f the
following methods:
a) Strain (displacement) rate
b) Stress (load) rate
c) Cross-head separation rate during the test
d) Elapsed time
These methods are listed in order o f decreasing precision. The most common
methods o f testing are strain (displacement) rate and stress (load) rate. Strain
(displacement) rate is expressed as the change in strain per unit time. As strain is a
dimensionless value, it is expressed as a ratio of change in length per unit length.
Generally, a strain rate between 10-5 and 10-1 is preferable for quasi-static tensile tests.
Stress (load) rate is expressed as the change in stress per unit of time. This is usually
determined by defining the load rate. ASTM A 370-05 “Standard Test Methods and
Definitions for Mechanical Testing of Steel Products,” requires that stress rate not exceed
100 ksi/min. This number corresponds to an elastic strain rate of about 5 x 10"5 s-1 for
steel.
It is important to compare displacement (strain) controlled and load (stress)
controlled loading. For elastic behavior, the stain and stress methods are identical. Once
the elastic limit is exceeded, the strain rate increases when a constant stress rate is
applied. Alternatively, the stress rate decreases when a constant strain rate is specified.
Experimental tests performed for this study employed stress controlled or load
controlled loading. This method was chosen as New York City Building Code (NYCBC)
recommends load based tension tests for such connectors. It was also difficult to control
13

the strain or displacement rate of the test setup, which included several components that
could displace. Load controlled loading is usually not preferable for testing beyond
elastic limit, however, the strain rate for any given load rate was found to be within the
recommended values for load controlled tests (Appendix B). Moreover, the load rate was
reduced for large load levels.
3.2.2 Test Procedures
3.2.2.1 Monotonic Test
The monotonic test followed the procedure for testing notch bracing casting
connection assembly is based on the New York City Building Code (NYCBC, 2012),
Section 1714.3.1. The test tensile load for the monotonic test is 2 times the superimposed
design load of 275 kips (i.e., 550 kips). The cast connectors were loaded according to the
following stages:
Stage 1. 0% of the load on the assembly, deflectio n gage readings set to read 0.000”
Stage 2. 25% of the test load on the assembly, deflection gage readings recorded.
Stage 3. 50% of the test load on the assembly, deflection gage readings recorded.
Stage 4. 75% of the test load on the assembly, deflection gage readings recorded.
Stage 5. 100% of the test load on the assembly, deflection gage readings recorded.
Stage 6. 100% of the test load on the assembly shall be left for 24 hours, deflection gage
readings recorded.
Stage 7. 0% of the test load on the assembly, deflection gage readings recorded.
NYCBC also recommends the passing criteria for monotonic test under quasi
static tensile loading. The passing criteria given in the NYCBC states that, the test
14

assembly has to recover more than 75% of the maximum deflection within 24 hours after
removal o f the test load.
3.2.2.2 Cyclic Test
After visual inspection o f the specimen, the cast connectors were reloaded and
subjected to a superimposed load of 2.5 times the design load. Because of the nature of
the braced system, the loading protocol for cyclic tests only included reloading and
unloading cycles in tension.
3.2.2.3 Additional Tests
Five additional tests were performed in Cast Connector 2 after the completion of
proposed monotonic and cyclic tests which showed the linear behavior of the connectors.
These tests were done as attempts to obtain nonlinear behavior or failure. The load was
applied in quasi-static manner in all the additional tests.
The last two additional tests were performed by loading only one leg o f the Cast
Connector 2. Each test was performed on a different leg. The load was applied only on
one leg because o f failure of the nut connecting the rod to the top assembly plate, after
the third test. Testing only one leg had another benefit. The load applied could be reduced
by half o f the load that should have been applied if both legs were loaded. This meant
that the subassembly and its connections were prevented from reaching failure (Section
3.6).
15

3.3 Material Characteristics
Material used for casting of the cast connectors is A148 GR. 115/95 (ASTM
A958, 2006). The nominal yield strength is 95 ksi, whereas the nominal ultimate
strength is 115 ksi. However, tests on two different heats used in the fabrication o f
the cast connectors showed that the material mechanical properties-exhibit overstrength
(Appendix C). The yield strength obtained for the two heats was f y = 115.8 and 121.8 ksi,
and the ultimate strength was f u = 130.8 and 137.3 ksi. Therefore, the yield and ultimate
strength are on average 25 and 17% larger than the nominal specification, respectively.
The rest o f the mechanical properties o f the material used in the cast connectors are
presented in Appendix C.
Figure 3.4 shows the stress-strain for the material compared to that for typical
ASTM Gr. 60 mild steel and ASTM Gr. 75 (Gr. 520) steel (used for stainless steel rods).
As observed, the casting material is a lot less ductile compared to typical mild steel and
stainless steel used for rods. The curve for the stainless steel material is as recorded in lab
and does not extend up to failure unlike the other three curves shown in the figure.
3.4 Experimental Results for Tests Performed on Cast Connector 1
Cast connector 1 was first tested under monotonic load. After reaching the
maximum load of 550 kip (2P), the specimen was loaded at the maximum load for 24
hours. Then the specimen was tested under cyclic load. The cast connector deformations
were recorded with 12 strain gages (SG # 6 was out o f order) and 5 LVDTs (Figures 3.5
and 3.6). See Appendix D for LVDTs and strain gage characteristics.
16

17
Fig 3.4: Stress-Strain Curves for Different Steel Materials
Fig 3.5: LVDTs and Strain Gages Location on Cast Connector 1 (View I)

18
LVDT # 2
1
Fig 3.6: LVDTs and Strain Gages Location on Cast Connector 1 (View II)
3.4.1 Monotonic Test: Maximum Applied Load 2P = 550 kips (CC1-T1)
The load protocol for the monotonic test was divided into four stages based on the
fraction of total load (2P) applied at the end of each stage (see Section III). The load rate
was 5 kips/min for Stage 2 (0.25 x 2P), 4 kips/min for Stages 3 (0.5 x 2P) and 4 (0.75 x
2P), and 3 kips/min for Stage 5 (2P). There were 10-minute pauses between different
stages.
Table 3.1 provides cast connector’s vertical deformations recorded by the
five LVDTs installed in the subassembly. Deformations and strains are presented at
the stages specified by Section 1714.3.1 of NYCBC, 2012. LVDTs # 2 and 3 measure
the deformation at each side o f one o f the cast connector legs. Also, a comparison of

19
Table 3.1: LVDT Deflection Reading for CC1-T1. Maximum Load = 2.0 P = 550 kips.
On Cast Connector LegStage Load Load LVDT# 1 LVDT # 2 LVDT # 3 LVDT # 4 LVDT # 5
(% 2P) (kips) (in.) (m.) (in.) (in.) (in.)1 0% 0.0 0.00000 0.00000 0.00000 0.00000 0.000002 25% 137.5 0.01989 0.00615 0.00640 -0.01137 0.017123 50% 275.0 0.03598 0.01083 0.01152 -0.02135 0.033184 75% 412.5 0.05624 0.01812 0.01839 -0.04454 0.065375 100% 550.0 0.06979 0.02254 0.02300 -0.07097 0.117416 100%* 550.0 0.07104 0.02250 0.02336 -0.07097 0.119367 0% 0.0 0.00659 -0.00004 -0.00150 -0.02901 0.05171
The second reading at 100% was taken 24 hours after the maximum load was reached.*
deformations when the maximum load is reached (Stage 5) and after 24 hours of
sustained load (Stage 6) indicates that the cast connector material did not exhibit creep
effects. Also, the residual deformation after the load was withdrawn (Stage 7) is
practically null. This indicates that the cast connector did not experience plastic
deformations, and performed in the elastic interval. This behavior easily meets the
passing criterion for the monotonic test, which requires the assembly to recover more
than 75% of the maximum deflection within 24 hours after removal o f the test load.
The rest of LVDTs were installed to track the subassembly components’
performance. LVDT # 1 recorded the relative displacement of top assembly plate with
respect to the actuator plate. The residual deformation in LVDT # 1, though small, was
caused by the rearrangement of the bolts and nuts connecting the top assembly plate and
the actuator plate. LVDT # 4 recorded the lateral displacement of the subassembly with
respect to the tower frame. The readings from LVDT # 4 were constantly monitored to
prevent contact of the subassembly with the brace o f the tower frame. These

deformations were caused by stiffness asymmetry o f the subassembly frame that caused a
slight lateral deformation to the right hand side of the test (Figure 3.4).
LVDT # 5 measured the vertical deflection from the subassembly with respect to
the steel floor (Figure 3.3).The residual deformation of LVDT # 5 was mainly caused by
slip o f the frame at the connection o f steel reaction box and the subassembly (see “Slip of
Column - Steel Box Connection”, Section 3.4.2.1).
Tables 3.2 and 3.3 present the strain gage readings at the fork and legs of the cast
connector, and the lower half o f the connector, respectively. In addition, Figure 3.7
presents the maximum strains recorded at each strain gage. The results show that strains
at the lower half o f the connector are significantly lower than those recorded at the legs
and fork of the specimen. Strain gages 1, 2, 10 and 11 exhibited the largest tensile strain,
whereas strain gage 3 showed maximum compressive strain. Strain gage 3 recorded large
compressive strains at the saddle, but these strains rapidly decrease, as can be seen on the
reading for strain gage 13, which is located right below strain gage 3.
The strain gage readings in Tables 3.2 and 3.3 confirm that the cast connector was
capable o f sustaining 2 times the superimposed design loads for a period o f 24 hours,
without exhibiting creep effects (compare strains at Stages 5 and 6). Stage 7 in Tables 3.2
and 3.3 show strain readings close to zero after the specimen was unloaded, indicating
that creep effects and permanent plastic deformations did not occur. Therefore, the
NYCBC (2012, Section 1714.3.1) criterion is satisfied.
20

21
Table 3.2: Strain Gage Reading (p strain) for CC1-T1 (Fork and Leg Locations). Maximum Load = 2.0 P = 550 kips.
End of Legs Fork Section SaddleStage Load Load SG # 10 SG # 11 SG # 1 SG # 2 SG # 3 SG # 13
(% 2P) (kips) p strain p strain p strain p strain p strain p strain1 0% 0.0 0 0 0 0 0 02 25% 137.5 735 585 836 580 -566 -1563 50% 275.0 1362 1114 1373 1098 -993 -2674 75% 412.5 2281 1806 2137 1800 -1578 -4265 100% 550.0 2913 2192 2652 2217 -1951 -5286 100%* 550.0 2937 2204 2576 2229 -1951 -5217 0% 0.0 172 -200 -90 -44 49 18
* The second reading at 100% was taken 24 hours after the maximum load was reached
Table 3.3: Strain Gage Reading (p strain) for CC1-T1 (Base Locations). Maximum Load = 2.0 P = 550 kips.
Stage Load(% 2P)
Load(kips)
SG # 4 p strain
SG # 5 p strain
SG # 6 f p strain
SG # 7 p strain
SG # 8 p strain
SG # 9 p strain
SG # 12 p strain
1 0% 137.5 0 0 - 0 0 0 02 25% 137.5 113 130 - 20 26 86 2003 50% 275.0 190 214 - 50 47 147 3294 75% 412.5 298 327 - 99 79 231 5025 100% 550.0 373 401 - 130 100 285 6156 100%* 550.0 383 409 - 133 102 267 6227 0% 0.0 3 3 - 23 7 -36 -11
* The second reading at 100% was taken 24 hours after the maximum load was reached.
The reading of SG # 6 could not be retrieved because of faulty wire.

22
Fig 3.7: Maximum Strains for Monotonic Test of Cast Connector 1

3.4.1.1 Stress-Strain Behavior under Monotonic Loading
The stress-strain curves for all the cast connector strain gages were linear under a
maximum monotonic load 2P = 550 kip, even after 24 hours of sustained loading. Figure
3.8 shows the strain versus time curves for the specimen at representative strain gages 10,
11 and 7. The curves showed that the increase in strain was linear, as it should be
expected for linear materials subjected to a constant load application increase. The plots
also show that the load was sustained during 24 hours without significant changes in the
strain level.
The stress levels reached at the locations o f SGs # 10, 11, and 7 are shown on the
stress-strain curves o f Figure 3.9, which were obtained based on an elastic modulus of
elasticity E = 29 x 106 psi. The maximum computed stress for this test (SG # 10) is
approximately 89.2 ksi, which is smaller than the nominal yield stress f y = 95 ksi, and the
average recorded stress from the heat tests (fy = 118.8, Appendix C).
3.4.2 Cyclic Test: Maximum Applied Load 2.5P = 688 kips (CC1-T2)
Six cycles were performed for the cyclic test based on a maximum load
equivalent to 2.5P = 688 kips (Figure 3.10). The protocol is adapted from the study
performed by Krawinkler et al. (2001). The load rates were 30 kips/min for the first four
cycles, 20 kips/min for the fifth cycle, and 10 kips/min for the sixth cycle.
Tables 3.4, 3.5 and 3.6 show LVDT deformations and strain gage readings of the
cast connector under the last cycle o f the loading protocol. The stages presented in these
tables correspond to the load levels recorded during the monotonic test, but the load
percentage changes because it is based on 2.5P. The NYCBC (Section 1714.3.1) criterion
23

24
(a) (b)
(c)Fig 3.8: Strain Variation with Time: (a) SG # 10; (b) SG #11; (c) SG # 7

25
(a) (b)
90
80
70
60
GO 50
cn u
GO
40
30
20
10
0500 1000 1500 2000 2500 3000
Straln (p straln)
(c)Flg 3.9: Stress-Straln Curves (Monotonlc test): (a) SG # 10; (b) SG # 11; (c) SG # 7
0

26
Fig 3.10: Cyclic Loading Protocol for Cast Connector 1
Table 3.4: LVDT Deflection Reading for Last Cycle of CC1-T2 Maximum Load = 2.5 P = 688 kips.
On Cast Connector LegLoad Load LVDT # 1 LVDT#2 LVDT # 3 LVDT # 4 LVDT # 5
(% 2.5P) (kips) (in.) (in.) (in.) (in.) (in.)0% 0.0 0.00000 0.00000 0.00000 0.00000
20% 137.5 0.02169 - 0.00841 -0.01053 0.0188640% 275.0 0.03801 - 0.01411 -0.02024 0.0352460% 412.5 0.05274 - 0.02007 -0.03077 0.0523380% 550.0 0.06739 - 0.02574 -0.04269 0.07159100% 688.0 0.08408 - 0.03005 -0.11366 0.321840% 0.0 0.00107 - -0.00285 -0.05627 0.22277
* LVDT # 2 was removed to prevent any damages in case of failure.

27
Table 3.5: Strain Gage Reading (p strain) for Last Cycle of CC1-T2 (Gages at Fork and Legs). Maximum Load = 2.5 P = 688 kips
End of Legs Fork Section SaddleLoad Load SG # 10 SG # 11 SG # 1 SG # 2 SG # 3 SG # 13
(% 2.5P) (kips) p strain p strain p strain p strain p strain p strain0% 0.0 0 0 0 0 0 0
20% 137.5 630 726 831 615 -591 -16340% 275.0 1350 1319 1468 1193 -1082 -29560% 412.5 2088 1903 2086 1769 -1564 -42480% 550.0 2834 2484 2698 2343 -2040 -551100% 688.0 3794 3102 3367 2958 -2494 -6710% 0.0 222 23 -70 38 54 11
Table 3.6: Strain Gage Reading (p strain) for Last Cycle of CC1-T2 Maximum Load = 2.5 P = 688 kips
Load (% 2.5P)
Load(kips)
SG # 4 p strain
SG # 5 p strain
SG # 6 p strain
SG # 7 p strain
SG # 8 p strain
SG # 9 p strain
SG # 12 p strain
0% 0.0 0 0 - 0 0 0 020% 137.5 127 130 - 15 27 91 20740% 275.0 213 226 - 47 50 163 35660% 412.5 301 321 - 81 73 233 50280% 550.0 388 414 - 116 97 304 646
100% 688.0 460 485 - 170 120 361 7590% 0.0 -29 -27 - 25 0 -26 -42
is satisfied because the specimen was able to support a load equivalent to 2.5 times the
superimposed load. The cast connector material exhibited linear performance under the
maximum applied loads. Also, the strains and deformations on the cast connector after
unloading the specimen were close to zero, indicating material linear behavior under the
applied loading protocol. A visual inspection o f the component after the test did not
reveal cracks or permanent deformation o f the cast connector. The test showed that the
specimen can support several large loading cycles, but cumulative damage due to several

excursions into the nonlinear interval was not recorded because the yield stress of the cast
connector material was larger than expected (see Section 3.3.).
Figure 3.11 and 3.12 show the maximum strain at each of the strain gage locations
for cyclic test. It is evident that strains are concentrated around the fork sections and the
legs of the connector. Strains around the base are an order of magnitude lower.
Figure 3.13 presents load-deformation/strain relationships, indicating a linear
relationship. The sudden strain variations on this curve are caused by slip of the overall
frame, as explained in Section 3.4.2.1.
28
Fig 3.11: Maximum Strain for Cyclic Test of Cast Connector 1 (View I)

29
Fig 3.12: Maximum strain for cyclic test of Cast Connector 1 (View II)
Fig 3.13: Deformation and Strains for Cast Connector 1 under Final Cycle.Deformation at LVDT # 3

3.4.2.1 Slip of Column - Steel Box Connection
As observed in Figure 3.13, the load vs. vertical deflection curve for LVDT # 3 is
linear but at a load of about 552 kips there is strain reversal, followed by a linear
reloading path, and a couple of minor strain reversals. After each reversal the curve still
follows a linear path with the same slope as that of original curve. This behavior was
caused by slip o f the subassembly column - steel reaction box connection (see Figure
3.4). Pretensioned bolts were used to connect the subassembly with the reaction box.
Once the load exceeded the pretension capacity the entire subassembly slipped, but it did
not affect the performance o f the cast connector, which only experienced a sudden small
loss o f strain.
The slip effect can also be observed in Figure 3.14, which shows the strain
increase at each time step for strain gage 1 with respect to time. As can be seen, the first
jump in strain takes place at around 9300 seconds when the load reached 552 kips in the
last cycle. That first jump is followed by few more jumps, which coincide with the curve
irregularities o f Figure 3.13.
3.4.2.2 Stress-Strain Behavior under Cyclic Loading
The strain variation with time under cyclic loading showed a linear relationship
up to the maximum load 2.5P = 688 kips (Figure 3.15). The nominal yield stress of the
material is f y = 95 ksi, but North Star Casteel report (Appendix C) indicated that the yield
overstrength is approximately 25%. The stress level at strain gage 10 was about 113.8 ksi
(Figure 3.16), which is less than average f y = 118.8 ksi. Hence, the connector material
was in the linear interval.
30

31
70
03
'tn
£o
50
30
10
I -10£c3
C/0
-30
-50
-706000 7000 8000 9000 10000 11000
Tlme (sec)
Flg 3.14: Dlfferentlal Straln at Straln Gage # 1
500450400350300250200150100500
//!/ 1.y
2500 5000 7500 10000 12500 Tlme (sec)
0
(a) (b)Flg 3.15: Straln vs. Tlme Curves: (a) SG # 10; (b) SG # 7

32
3.5 Experimental Results for Cast Connector 2
The tests for Cast Connector 2 are similar to those for Cast Connector 1. Cast
Connector 2 was also tested under monotonic and cyclic load, but the load was increased
3%. Therefore, the maximum load for the monotonic test was 1.03 (2P) = 567 kips, and
for the cyclic load was 1.03 (2.5P) = 709 kips.
The location o f strain gages and LVDTs for Cast Connector 2 tests is presented in
Figure 3.17. For the monotonic load test, two LVDTs and fifteen strain gages were
installed in the cast connector. For the cyclic load test, LVDT # 2 was removed to prevent
damage to the equipment in case of failure, but strain gages were added to one of the
connector legs (strain gages 16, 17, and 18), and to one of the rods (strain gages 19 and
20).

33
Fig 3.17: Strain Gages on Cast Connector 2 for Monotonic and Cyclic Tests. (LVDT # 2 was used only for the monotonic tests. Strain Gages 16, 17 and 18 were used
only for the cyclic test).

3.5.1 Monotonic Test (CC2-T1)
The load rate for this monotonic test was also 5 kips/min for Stage 2, 4 kips/min
for Stages 3 and 4, and 3 kips/min for Stage 5. There were 10-minute pauses between
different stages. The deformations and strains presented below follow these stages
specified by BC Section 1714.3.1 (NYCBC, 2012). Table 3.7 provides LVDT
deformations, including the two LVDTs placed in the cast connector (LVDTs 2 and 3).
Note that the residual displacement o f LVDT # 5 was caused by slip o f the frame. Table
3.8 presents the strains at the end of legs (Strain Gage (SG) # 1, 2, 3, 4, 5 and 6), at the
fork section (SG # 7, 8, 9 and 10), and at the saddle (SG # 11). Table 3.9 provides strain
gage readings for the gages at the lower half of the connector (SG # 12, 13, 14 and 15)1.
The largest strains were recorded at the legs and fork o f the cast connector.
34
Table 3.7: LVDT Deflection Reading for CC2-T1 Maximum Load = 1.03 (2.0 P) = 567 kips.
On Cast Connector LegStage Load Load LVDT# 1 LVDT# 2 LVDT # 3 LVDT # 4 LVDT # 5
(% 2P) (kips) (in.) (in.) (in.) (in.) (in.)1 0% 0.0 0.00000 0.00000 0.00000 0.00000 0.000002 25% 137.5 0.02596 0.00862 0.00733 -0.00633 0.010703 50% 275.0 0.04478 0.01175 0.01060 -0.02085 0.033324 75% 412.5 0.06095 0.01480 0.01430 -0.04470 0.066725 100% 550.0 0.07693 0.01863 0.02037 -0.09635 0.17868
5 f 103% 567.0 0.07892 0.01911 0.02076 -0.10175 0.18701
6 f 103%* 567.0 0.07940 0.01919 0.02066 -0.10320 0.189197 0% 0.0 0.00298 0.00586 0.00526 -0.05787 0.10948
t New stage for load of 1.03 x (2P)* The second reading at 100% was taken 24 hours after the maximum load was reached.
1 The parameters listed in Tables 3.7-3.9 were corrected to account for a delay of about 1300 seconds on the initial deformation and micro strain recording
35
Table 3.8: Strain Gage Reading (p strain) for CC2-T1 (Fork and Leg Locations). Maximum Load =1.03 (2.0 P) = 567 kips
End of Legs Fork Section SaddleStage Load Load SG # 1 SG # 2 SG # 3 SG # 4 SG # 5 SG # 6 SG # 7 SG # 8 SG # 9 SG # 10 SG # 11
(% 2P) (kips) p strain p strain p strain p strain p strain p strain p strain p strain p strain p strain p strain2 25% 137.5 792 522 802 815 444 494 145 460 498 171 -1153 50% 275.0 1333 1217 1277 1465 1109 839 274 902 922 306 -2094 75% 412.5 1852 1885 1759 2146 1765 1196 423 1330 1333 439 -3085 100% 550.0 2396 2509 2209 2917 2432 1567 613 1747 1758 538 -406
5 T 103% 567.0 2459 2602 2281 2997 2518 1618 629 1803 1810 560 -418
6 T 103%* 567.0 2452 2608 2281 2987 2522 1618 624 1806 1803 562 -4147 0% 0.0 256 -166 299 235 -154 196 23 57 77 16 -14
New stage for load of 1.03 x (2P)* The second reading at 100% was taken 24 hours after the maximum load was reached.
Table 3.9: Strain Gage Reading (p strain) for CC2-T1 (Base Locations). Maximum Load =1.03 (2.0 P) = 567 kips
BaseStage Load Load SG # 12 SG # 13 SG # 14 SG # 15
(% 2P) (kips) p strain p strain p strain p strain1 0% 0 0 0 0 02 25% 137.5 61 55 131 1433 50% 275.0 178 216 238 2454 75% 412.5 301 368 343 3405 100% 550.0 430 492 463 435
5 f 103% 567.0 448 512 474 446
6f 103%* 567.0 448 529 474 4477 0% 0.0 -37 -79 36 45
N ew stage for load o f 1.03 x (2P)* The second reading at 100% was taken 24 hours after the maximum load was reached.

As observed in Figure 3.17, strain gages were placed at the same height in the cast
connector legs for the second tests. For instance, SGs # 1, 2, and 3; and SGs # 4, 5, and 6
are placed at the same level. The average strains obtained from these gages is in
agreement with the force applied at each stage, but significant variation among them is
also observed. For instance, strain at SG # 6 is nearly half the strain at SG # 4. This
discrepancy is partly attributed to the geometry of the specimen that is not perfectly
circular. The main reason for this response is the restraining effect the rods had on the
way that the connector deformed. Also note that the compressive strains recorded at the
saddle of cast connector 2 (i.e., at the bottom of the fork) were approximately one-third of
the strains recorded at the saddle o f the first connector. The reason is that the fork of the
second cast connector is more flexible because the lower part of this connector is thinner.
Figure 3.18 shows the maximum stains at each strain gage location for monotonic load.
The figure indicates that strains are concentrated around legs and fork section o f the cast
connector, in a similar fashion than the strain distribution of Cast Connector 1.
3.5.1.1 Stress-Strain Behavior under Monotonic Load
Figure 3.19 presents strain vs. time curves for SGs # 4 and 10, showing the
maximum and minimum recorded strains, respectively. The overall linear behavior and
flat plateau under sustained loading indicate that the specimen did not experience
plastic deformations. Figure 3.20 shows the stress-strain curves for selected strain gages,
which exhibit linearly elastic behavior up to a load 1.03(2P) = 567 kips. The maximum
calculated stress for this test (SG # 4) is approximately 89.9 ksi, which is smaller than the
average yield stress f y = 118.8 ksi.
36

37
Fig 3.18: Maximum Strains for Monotonic Test of Cast Connector 2

38
(a) (b)Fig 3.19: Strain Variation with Time for: (a) SG # 4; (b) SG #10
Fig 3.20: Stress-Strain Curves for Strain Gage 4

3.5.2 Cyclic Test (CC2-T2)
The cyclic loading protocol o f Figure 3.21 was planned for the second cast
connector. The seventh and ninth cycles were expected to reach a total load equivalent to
1.03 (2.5P) = 709 kips. However, a malfunctioning of the data acquisition system
software interrupted the protocol several times. The cast connector was ultimately
subjected to three cycles at 0.5 (2.5P) = 344 kips, one cycle at 0.7 (2.5P) = 482 kips, and
a final cycle at 1.03 (2.5P) = 709 kips. The load rate for the first four cycles was 30
kips/min. For the final cycle the load rate was 30 kips/min up to 482 kips, and 10
kips/min thereafter.
The deformations recorded at the LVDTs for the final cycle of the loading
protocol are presented in Table 3.10. The cast connector material exhibited linear
performance under the applied load. The residual strains of LVDT # 5 were partly
caused by slip of the frame connection. LVDT # 1 residual strains are the result of the
plate and bolts interaction on the top plate connection.
39
Fig 3.21: Original Cyclic Loading Protocol for Cast Connector 2
40
Table 3.10: LVDT Deflection Reading Last Cycle of CC2-T2. Maximum Load = 1.03 (2.5 P) = 709 kips.
On Cast Connector LegLoad Load LVDT # 1 LVDT#2 LVDT # 3 LVDT # 4 LVDT # 5
(% 2.5P) (kips) (in.) (in) (in.) (in.) (in.)20% 137.5 0.02725 0.00875 -0.00705 0.0123440% 275.0 0.04559 - 0.01198 -0.02157 0.0348560% 412.5 0.06169 - 0.01608 -0.03817 0.0591580% 550.0 0.07763 - 0.02040 -0.05113 0.0849582% 567.0 0.07958 - 0.02098 -0.05331 0.08770100% 688.0 0.09373 - 0.02537 -0.06783 0.16569103% 709.0 0.09649 - 0.02617 -0.06845 0.181890% 0.0 0.02118 - 0.00632 -0.02821 0.10325
* LVDT # 2 was removed to prevent damages in case of failure
Tables 3.11 and 3.12 show the readings for strain gages on the legs and fork of the
connector, respectively. Table 3.13 shows the recorded strains at the base of the
connector. The maximum applied load for the last cycle o f the protocol was 1.03(2.5P) =
709 kips. The results are consistent with those of previous tests. The maximum strains are
recorded at the legs of the connectors, and the cast connector exhibits linear behavior up
to 1.03(2.5P) = 709 kips.
3.2.2.1 Stress-Strain Behavior under Cyclic Loading
The strain vs. time curves (Figure 3.22) show linear behavior up to the maximum
load of 1.03 (2.5P). A series of small or interrupted cycles are recorded after the first
three cycles, prior to the last cycle that reached the maximum load. These interrupted
cycles and long pause before the last cycle were caused by a malfunctioning of the data
acquisition system that interrupted the protocols several times. The recorded cycles,
however, show that the cast connector exhibited linear behavior.

41
Table 3.11: Strain Gage Reading (p strain) for Last Cycle of CC2-T2 (Leg Location).
End ofLegs End of Legs Midsection o f LegsLoad Load SG # 1 SG # 2 SG # 3 SG # 4 SG # 5 SG # 6 SG # 16 SG # 17 SG # 18
(% 2.5P) (kips) p strain p strain p strain p strain p strain p strain p strain p strain p strain20% 137.5 712 471 704 864 481 465 628 558 -40% 275.0 1244 1155 1189 1516 1144 816 1032 1313 -60% 412.5 1764 1818 1719 2171 1783 1191 1461 2035 -80% 550.0 2301 2490 2303 2843 2423 1610 1919 2750 -82% 567.0 2365 2571 2373 2922 2498 1661 1972 2835 -100% 688.0 2819 3147 2882 3500 3044 2051 2374 3425 -103% 709.0 2892 3253 2968 3595 3143 2121 2435 3532 -0% 0.0 189 -151 220 166 -123 177 158 -127 -
Strains lor strain gage 18 could not be recorded due to a bad soldered wire.
Table 3.12: Strain Gage Reading (p strain) for Last Cycle of CC2-T2 (Fork and Saddle Location).
Fork Section SaddleLoad Load SG # 7 SG # 8 SG # 9 SG # 10 SG # 11
(% 2.5P) (kiPs) p strain p strain p strain p strain p strain20% 137.5 166 446 452 137 -9940% 275.0 306 880 878 267 -19860% 412.5 450 1305 1292 411 -29880% 550.0 599 1742 1711 572 -40282% 567.0 615 1794 1760 592 -414100% 688.0 729 2187 2129 739 -498103% 709.0 744 2259 2206 767 -5120% 0.0 -2 56 101 1 1
Table 3.13: Strain Gage Reading (p strain) for Last Cycle of CC2-T2 (Base Location).
Base BaseLoad Load SG # 12 SG # 13 SG # 14 SG # 15
(% 2.5P) (kips) p strain p strain p strain p strain20% 137.5 81 138 138 12940% 275.0 200 292 244 22760% 412.5 317 428 349 32680% 550.0 438 577 459 43182% 567.0 452 592 472 444100% 688.0 550 691 567 542103% 709.0 568 704 582 5570% 0.0 -26 -33 26 33

42
(a) (b)Fig 3.22: Strain vs. Time Curves for: (a) SG # 4; (b) SG # 10
Figure 3.23 shows the maximum strains at each strain gage location for the last
cycle o f the cyclic test. Maximum strains were developed around the fork and the legs of
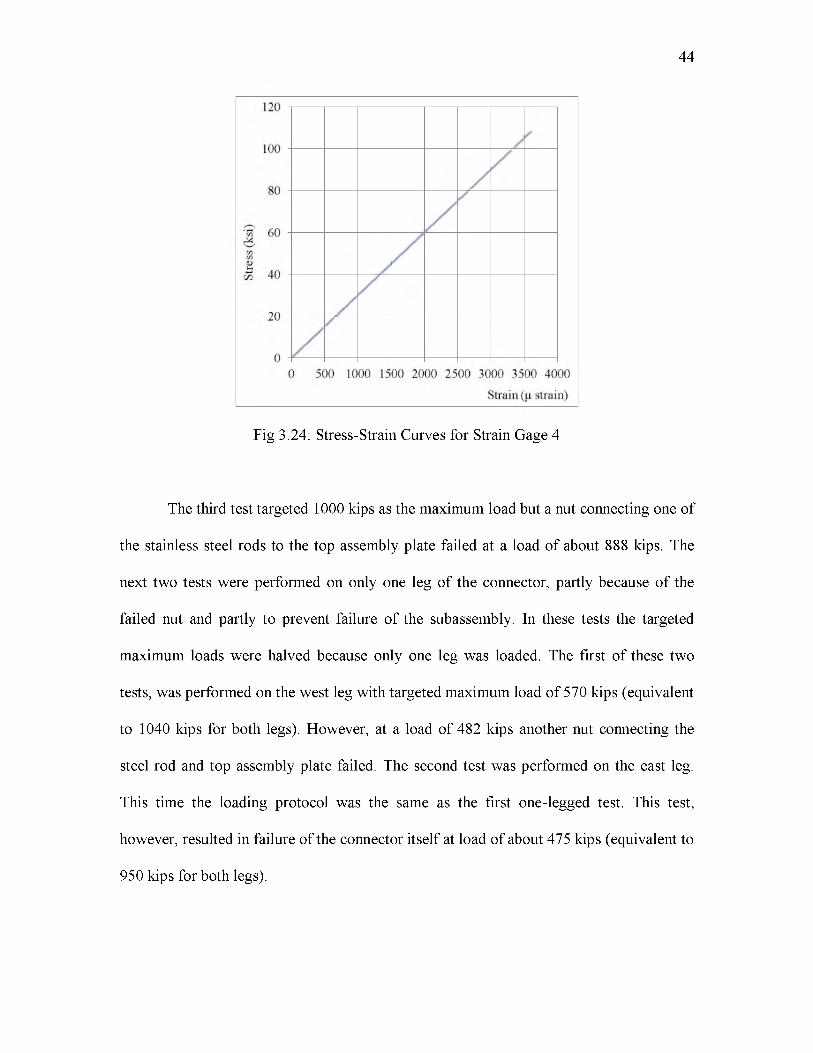
the connector. Figure 3.24 shows the stress-strain curve for stain gage 4. Figure 3.24
shows that the maximum stress was still below the average yield stress obtained from the
heat tests (fy = 118.8 ksi, Appendix C).
3.6 Additional Test Performed on Cast Connector 2
To study the nonlinear performance of the connector and the material, Cast
Connector 2 was subjected to additional tests. Five more tests were performed on the
connector specimen, each test with a targeted maximum load higher than that of
the previous test. In the first tests the specimen was subjected to a maximum load
of 826 kips (3P). The second test performed reached a maximum load o f 894 kips (3.3P).

43
Fig 3.23: Maximum Strains for Cyclic Test of Cast Connector 2 (CC2-T2)
44
Fig 3.24: Stress-Strain Curves for Strain Gage 4
The third test targeted 1000 kips as the maximum load but a nut connecting one of
the stainless steel rods to the top assembly plate failed at a load of about 888 kips. The
next two tests were performed on only one leg of the connector, partly because o f the
failed nut and partly to prevent failure of the subassembly. In these tests the targeted
maximum loads were halved because only one leg was loaded. The first of these two
tests, was performed on the west leg with targeted maximum load of 570 kips (equivalent
to 1040 kips for both legs). However, at a load of 482 kips another nut connecting the
steel rod and top assembly plate failed. The second test was performed on the east leg.
This time the loading protocol was the same as the first one-legged test. This test,
however, resulted in failure of the connector itself at load of about 475 kips (equivalent to
950 kips for both legs).

3.6.1 Additional Test 1: Maximum Load 826 kips (1.2 x 2.5P = 3P)
The first additional test on Cast Connector 2 was performed by loading the
specimen under the loading protocol shown in Figure 3.25. The load rate was 30 kips/min
until the load reached 482 kips. After 482 kips the loading rate was 10 kips/min until the
load reached 709 kips and 4 kips/min for the final loading stage. Figures 3.26 and 3.27
show the load vs. strain and strain vs. time plot for SG # 4, respectively.
3.6.2 Additional Test 2: Maximum Load 894 kips (1.3 x 2.5P = 3.25P)
The second additional test on Cast Connector 2 followed a loading protocol
similar to that of the first additional test. The difference being that the maximum load
applied was 894 kips. Figure 3.28 shows the loading protocol followed for this test.
In this test the cast connector showed clear nonlinear behavior for first time.
Figure 3.29 shows the load vs. strain curve for SG # 17. The nonlinear portion of the
curve started around 842 kips. Figure 3.29 shows that the curve began incursion into
nonlinear interval at a strain o f around 0.429% for SG # 17. The corresponding load was
848 kips and stress 124.4 ksi, which are close to the values o f observed yield stress of the
material (see Section 3.3). Figure 3.30 shows the stress-strain curve for the connector
specimen at the location o f SG # 17. The curve shows that the material started yielding at
stress of 128 ksi.
3.6.3 Additional Test 3: Maximum Load 888 kips
The target load for this test was 1000 kips (1.45 x 2.5P = 3.63P). Figure 3.31
shows the loading protocol used for the test. The objective of this test was to record cast
45

46
fin<NoflOo03—pH(D03P4"O03O
30 60 90
Time (min)0
Fig 3.25: Loading Protocol for Additional Test 1
Fig 3.26: Load vs. Strain Curve for SG # 4

47
Fig 3.27: Strain vs. Time Curve for SG # 4
0 25 50 75 100Time (min)
Fig 3.28: Loading Protocol for Additional Test 2
48
Fig 3.29: Load vs. Strain Curves for SG # 17
^ Strain
Fig 3.30: Stress-Strain Curve for SG # 17

49
<N<+Hoo • o cS
<Dea
"OcSoH-l
Tim e (m in)
Fig 3.31: Loading Protocol for Additional Test 3
connector high nonlinear behavior. Unfortunately, as the load reached around 888 kips
the nut connecting one o f the stainless steel rods and the top assembly plate failed and the
test had to be stopped. Load vs. strain curve obtained for this was similar to the additional
test 2. Figure 3.32 shows the load vs. strain and strain vs. time plot for SG # 17.
3.6.4 Additional Test 4: Single Leg Loaded, Maximum Load 482 kips
This test was carried out after the failure o f the nut connecting one of the rods and
the top assembly plate (test of Section 3.6.3), and consequently, only one leg was loaded
in this test. Unfortunately, the same failure occurred as in additional test three. The
failure of the nut resulted in lack o f reliable data.

50
(a) (b)Fig 3.32: (a) Load vs. Strain for SG # 17; (b) Strain vs. Time SG # 17*
* Change in the slope of line in Figure 3.26 (b) is due the change in the rate of loading.
3.6.5 Additional Test 5: Single Leg Loaded, Maximum Load 475 kips
This was the final test performed on Cast Connector 2 specimen. Like additional
test four, only one leg was loaded. Failure was observed at a load of 475 kips, equivalent
to 950 kips (1.38 x 2.5P = 3.45P) if both the legs were loaded. The loading protocol of
Figure 3.33 was used for the test. The protocol is similar to the test presented in Section
3.6.3, but the load at each stage is halved.
Figure 3.34 shows the load vs. strain curve for SG # 5. The curve shows some
nonlinearity. The nonlinear portion o f the curves is still not very prominent due to the
position o f the strain gages relative to the fracture point. The strain gage was
considerably distant from the fracture point to be greatly influenced by the failure. Strain
gages # 7 and 8 were closer to the failure location but they were not greatly influenced
either. This was due to increase in the cross section. This can be attributed to the
geometry of the connector. The varying width of the connector legs significantly affected
how the connector responded to the applied load and ultimately how the strain gages

51
Time (min)
Fig 3.33: Loading Protocol for Additional Test 5
Fig 3.34: Load vs. Strain for SG # 5

responded. Figure 3.35 shows the stress-strain curves for SG # 5. The figure shows
similar characteristics as observed for other cases. The yielding appears to start around
127.5 ksi.
52
3.7 Summary of Experimental Tests
The experimental tests performed on cast connectors 1 and 2 demonstrate their
ability to sustain large loads. Although Cast Connector 1 was not tested up to failure load,
the final test on Cast Connector 2 showed the failure load was 475 kips for one leg. If
both the legs were loaded the failure load would be much higher than that. To simulate
and verify the experimental test and find the failure load, finite element (FE) analyses
were performed (Chapter 4).
Fig 3.35: Stress-Strain Curve for SG # 5

CHAPTER 4
FINITE ELEMENT MODELING
The cast connectors were modeled in the finite element (FE) program ANSYS to
simulate the specimens’ linear and nonlinear behavior, ultimately determining the
response controlling parameters. The models’ results were compared to experimental data
results. Once the models were sufficiently calibrated, a parametric study was carried out
with the expected relevant parameters to investigate their effect on the connectors’
response.
This chapter includes the description of the FE model created for each connector
and the results obtained from the analysis. Stress and strain distributions at different load
levels obtained from the FE analysis were compared to experimental test results. Normal
stress and von Mises stress for these simulations are similar (apart from fact that von
Mises stress distribution does not show negative sign)
4.1. FE Modeling of Cast Connector 1
The three dimensional (3D) geometry was created in a preprocessing software
(SolidWorks, Dassault Systemes) using the dimensions from drawings and actual sample
measurements. This geometry was imported to ANSYS. The entire geometry of the
connector was modeled as a solid element and SOLID95 was used as element type.

Modulus o f elasticity was defined as 30000 ksi as calculated from the material stress-
strain curve for the material, Section 3.3. Yield strength was defined as 116 ksi and the
ultimate strength was provided as 130.8 ksi. Poisson’s ratio of 0.3 was used, which is a
standard value for steel. Most steels when used within their design limit exhibit a stable
Poisson’s ratio of 0.3.
The connector was constrained at its base in three directions, and monotonically
increasing tensile load was applied to the cast connector model’s legs. The results from
this analysis were compared to the actual laboratory results. Figures 4.1 and 4.2 illustrate
the von Mises stress distribution in cast connector 1 for a total tensile load of 688 kips. At
this load level, the FE model exhibited linear performance with maximum stress of
approximately 91.3 ksi, which is below the average measured yield strength of 118.8 ksi.
54
Fig 4.1: von Mises Stress Distribution in Cast Connector 1 at 688 kips (View I)

55
Fig 4.2: von Mises Stress Distribution in Cast Connector 1 at 688 kips (View II)
Figure 4.3 shows comparison o f load vs. stress curves for SG # 1 obtained from
laboratory tests and FE analysis. The figure shows that the curves tend to agree with each
other to some extent with a maximum error of 9.6%.
Regarding Cast Connector 1’s strain, lab tests show that for monotonic load of
550 kips (CC1-T1), the maximum strain is 2653 pstrain with a corresponding stress of
79.6 ksi. For this test and load level, ANSYS analysis stress was 73 ksi, rendering an
error of 8.3%. For the cyclic test with a maximum load of 688 kip (CC1-T2) the
maximum strain is 3367 pstrain with a corresponding stress of 101 ksi. The
corresponding stress in ANSYS was 91.3 ksi, a 9.6% difference. As observed, lab test
results and ANSYS analysis show reasonable agreement.

56
Fig. 4.3: Comparison of Load-Stress Curves from Lab Tests and FE Analysis (CastConnector 1)
After verifying that the FE model agrees with lab results (which also validates the
model), the load on the FE model was increased to evaluate the connector’s nonlinear
behavior. The material properties for this simulation were not changed from those used
for previous simulation. The failure load criterion for the simulation was defined as the
load when elements reached the provided ultimate stress.
The analysis revealed that Cast Connector 1 would fail at a load of 1044 kips.
Figure 4.4 show von Mises stress distribution on the connector at a load of 1044 kips.
The FE model showed that the connector would fail at the legs, close to the transition, to
form a forked section.

57
0 JC■ P ■ 1 .■ - Vf H4PI a_| 1 |vm Mists stress i|co«ou -j - * *».pj s &]^J; J : * i
jrwsM r r rir
W 7 U M S Y SNmNDWimnrclal 4m snip
MOV 12 2012 17:02:26
NODAL SOLUTIONSTEP=1 SUB =27 TIME=.94 92 5 SEQV (AVG)DMX =.205233 SMN =1.514 SMX -131430
29208 58414 87520 11662714S0E 43311 73017 102224 131430
Fig 4.4: von Mises Stress Distribution for Cast Connector 1 at 1044 kips
4.1.1 Verification of the Model in a Different FE Program
A different FE program (ABAQUS; Dassault Systemes, 2011) was also used to
verify the model in addition to ANSYS. The ABAQUS model provided a verification of
FE results, and the opportunity to perform a convergence study by refining the model
mesh, a difficult task in ANSYS due to memory constraints.
ABAQUS results for Cast Connector 1 analyses were similar to those obtained
from ANSYS. The latter model predicted a failure load of 1044 kips, while ABAQUS
showed the failure load at 1045 kip.

4.1.2 Mesh Refinement Study (Convergence Study):
ABAQUS results at SG location one, and for a load o f 688 kips, were compared
to those obtained from experimental tests on Cast Connector 1 by refining the mesh size.
Table 4.1 shows the stress comparison at SG # 1 for the initial model with an average
element size on 1 in. and for four additional models in which the average element size
was reduced. Table 4.1 also shows the relative error for each case. It is clear that as the
number o f elements increases, the error decreases up to case four. The difference in
results stabilizes at an element size of 0.4 in. or lower.
The model created in ANSYS was similar to case one of Table 4.1, and the error
was 9.6%. This value is close to 10.1% error obtained from the ABAQUS simulation.
Figure 4.5 represents the plot of convergence study shown in Table 4.1.
4.2 FE Modeling of Cast Connector 2
Procedures similar to those used for Cast Connector 1 were implemented on Cast
Connector 2. To gain sufficient confidence with the model, the FE analysis was run to
simulate laboratory tests and match or compare the results. Figure 4.6 show the stress
distribution on Cast Connector 2 for 709 kips (1.03*2.5P).
Comparison of the FE analysis results with the experimental data showed that the
model was able to predict the stress distribution on the connector within reasonable
accuracy with a maximum error of 12%. Stresses at SG # 8 and SG # 17 were compared
(Figure 4.7) as the FE model showed that they were closer to the critical location (shown
in red in Figure 4.6).
58

59
Table 4.1: Results from Convergence Study with Relative Error. Experimental Stress at Location 1 = 101.01 ksi
Case No. Element Number of Average von RelativeSize (in.) Elements Mises Stress (ksi) Error
1 1 12747 90.7742 -0.101332 0.8 22035 91.7611 -0.091563 0.6 50910 93.3958 -0.075384 0.4 146357 95.8536 -0.051055 0.3 316894 95.8394 -0.05119
Convergence Study PlotNumber of Elements
0 75000 150000 225000 300000 375000
Fig 4.5: Plot of Relative Error with Respect to Number of Elements

60
'© A N S Y SHMfMAnwrtlil uM ari jNOV 7 201,3
NODAL SOLUTION£T E P =1 SUB = 2 8 T iM E ^lS L W <AVU)UMX - . 0 6 1 2 ^ - 1 5MN = 2 . 4 9 85HX =111331
1 .498 24741 49M 1 71221 9396113371 37111 618S1 86591 111311
Fig 4.6: von Mises Stress Distribution on Cast Connector 2 at 709 kips
(a) (b)Fig 4.7: Comparison o f Load-Stress Curves from Lab Tests and FE Analysis (709 kips).
(a) SG # 8; (b) SG # 17 (SG #17 was not used for monotonic test)

As more test data were available for cast connector 2, comparisons were also
made with results obtained from simulating each test (894 kip and 888 kip). Figures 4.8
and 4.9 show load vs. stress curves for SGs # 4, 8 and 17 obtained from experimental
tests and FE analysis.
All the curves show reasonable agreement (with a maximum difference of 19% at
maximum load o f 894 kips). This difference is reduced by increasing the number of
elements in the model as done for cast connector 1 (see Section 4.1.1).
After the above validations, the FE model was subjected to tensile loads only on
one leg as the additional test 5 (Section 3.6.5). The failure load observed in FE analysis
was 516.6 kip and that observed in experimental tests was 475 kip. The FE model’s
prediction was 8.8% higher than the experimental failure load. Figure 4.10 shows the
stress distribution on cast connector 2 as predicted by FE analysis at a failure load of
516.6 kips. Figure 4.11 compares the load vs. stress curves for SGs # 4, 8 and 17.
61
(a) (b)Fig 4.8: Comparison o f Load-Stress Curves: (a) SG # 4; (b) SG # 17

62
1 A A A
. & q o o
0
i s i )
)
-a 9 0 0^ 8 0 0
S 7 0 0-J / 0 0
£ 0 0
5 0 0
4 0 0
3 0 0
9 0 02 0 0
1 0 0
0
0
F E A n
2
a ly s is -l
°
r 4 0 6
T e s t ( 8 ‘
00 /-
) &
© S
0 1 0
- A - L a i
) 0 12
S I
T e s t (8
fH
W
r->
S 00
© c
oo
Fig 4.9: Comparison of Load-Stress Curves from Lab Tests and FE Analysis (SG #17)
NODAL SOLUTION STEP=1SEQV (AVG)DMX =.159068 SUN =.7514 9 SMX =13X430
I fO V 7 2 Q 12 lfe:51:17
wr3 l c ^ 5 J i i : *j M\
( Or/rtiw pi Hi
.7E14S 2?2D7 58414 97620 11£82714604 43810 73017 102223 131130
Fig: 4.10: von Mises Stress Distribution on Cast Connector 2 at 516.6 kip

63
(a) (b)
(c)Fig 4.11: Load-Stress Curves from Lab Tests and FE Analysis at Failure Load (a) SG # 4;
(b) SG # 8; (c) SG #17

4.3 Parametric Study
A parametric study was performed based on the model used for verification and
validation, to find those parameters affecting the response o f casted connectors.
Geometry, material property, casting process and other parameters affect the response of
such connectors. In this parametric study, material properties are considered. The
parametric study is used to evaluate cases that are not viable during the experimental
phase. The material properties investigated in this section are the modulus of elasticity,
postyielding slope and yield stress.
4.3.1 Modulus of Elasticity (E)
For the first parametric study, three modulus o f elasticity were considered: 29000
ksi, 30000 ksi and 32000 ksi. The tangential slope (postyielding slope) kept constant at
6% of initial slope (as obtained from the stress strain curve for the material, see Section
3.3). The stress-strain curve for each case was idealized as bilinear curve (Figure 4.12).
Ultimate failure load was compared for each case to evaluate if modifications to
the modulus of elasticity would have a significant impact on the response of the
connectors. Table 4.2 presents a comparison o f each case for both connectors. The table
shows that although the modulus of elasticity of the material has some effect on the
response of the connectors, the impact is not as significant. The results for base case
(which utilizes the full stress-strain curve for simulation) and 30000 ksi case (which
idealizes the stress-strain curve as bilinear) show good agreement. It shows that
idealization of the curve as bilinear does not alter the results significantly.
64

65
Table 4.2: Comparison of Failure Load for Different Modulus of Elasticity
Modulus of Elasticity E (ksi)
Maximum Load at Failure (kip)Cast Connector 1 Cast Connector 2
Base Case* 1042.0 1035.429000 1024.4 1024.430000 1046.4 1035.432000 1093.5 1069.5
* Note: Base case refers to the simulation in which actual stress-strain curve was used.
Figure 4.13 presents load vs. stress curves for SG # 1 o f Cast Connector 1, for
three modulus o f elasticity used for the study. Figure 4.14 shows similar comparison for
SG # 4, 8 and 17 o f Cast Connector 2. Figures 4.14 (a)-(b) and 4.15 show that there is a
small effect on Cast Connector 2 as modulus o f elasticity (E) changes; specifically when
E changes from 30000 ksi to 32000 ksi. However, there is a small difference between the
curves for 30000 ksi and 32000 ksi. One of the reasons for the small effect of change in E
could be nonuniform change in stiffness or rigidity of different parts of the connectors.

66
Fig 4.13: Load vs. Stress Curves for Three Different Modulus of Elasticity(SG #1, Cast Connector 1)
(a) (b)Fig 4.14: Load vs. Stress Curves for Different Modulus of Elasticity (Cast Connector 2)
(a) SG #4; (b) SG # 8
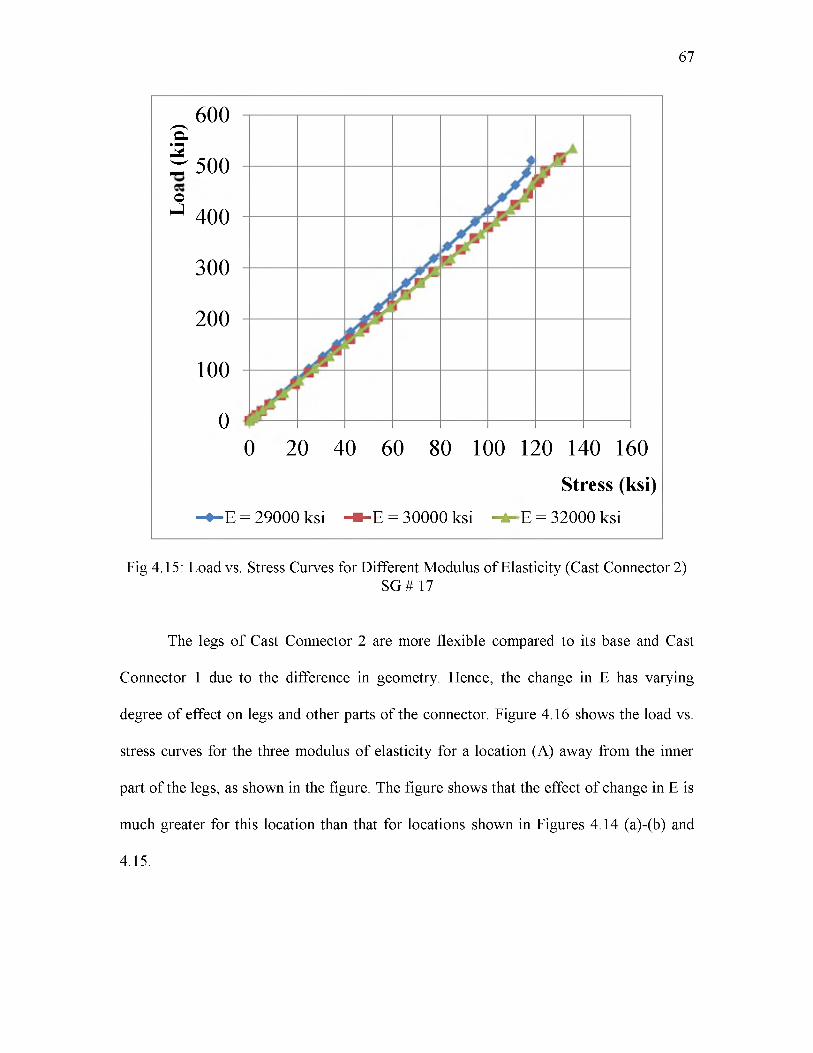
67
_ 600 ' S 3:r 500 ©^ 400
300
200
100
00 20 40 60 80 100 120 140 160
Stress (ksi)
- ♦ - E = 29000 ksi -B -E = 30000 ksi -A- E = 32000 ksi
Fig 4.15: Load vs. Stress Curves for Different Modulus of Elasticity (Cast Connector 2)SG # 17
The legs o f Cast Connector 2 are more flexible compared to its base and Cast
Connector 1 due to the difference in geometry. Hence, the change in E has varying
degree of effect on legs and other parts of the connector. Figure 4.16 shows the load vs.
stress curves for the three modulus o f elasticity for a location (A) away from the inner
part of the legs, as shown in the figure. The figure shows that the effect of change in E is
much greater for this location than that for locations shown in Figures 4.14 (a)-(b) and
4.15.

68
Fig 4.16: Location A (left); Load vs. Stress Curve for Location A (right)
4.3.2 Postyielding Slope
For the second parametric study, tangential slope (postyielding modulus) was
changed keeping the initial modulus, yield stress and the ultimate strain constant. The
stress strain curve is still idealized as bilinear curve. Figure 4.17 shows the curves used
for this parametric study. The tangential slope was varied as 2%, 4%, 6%, 8% and 10% of
the initial slope.
Ultimate failure load was chosen as the comparison criteria for this case also.
Table 4.3 summarizes the findings from this parametric study. The results show that for
tangential slope less than 6%, the effect on connectors’ response is significant. However,
for tangential slope greater than 6%, the response is affected but to a lesser degree.

69
% Strain— 6% — 4% — 8% — 10% — 2%
Fig 4.17: Idealized Stress-Strain Curves with Different Tangential Slopes.(Initial Slope = 30,000 ksi)
Table 4.3: Comparison of Failure Load for Different Tangential Slopes
Tangential Slope Maximum Load at Failure (kip)Cast Connector 1 Cast Connector 2
2% 936.7 936.74% 980.4 980.46% 1046.4 1035.48% 1057.5 1047.510% 1083.5 1079.2
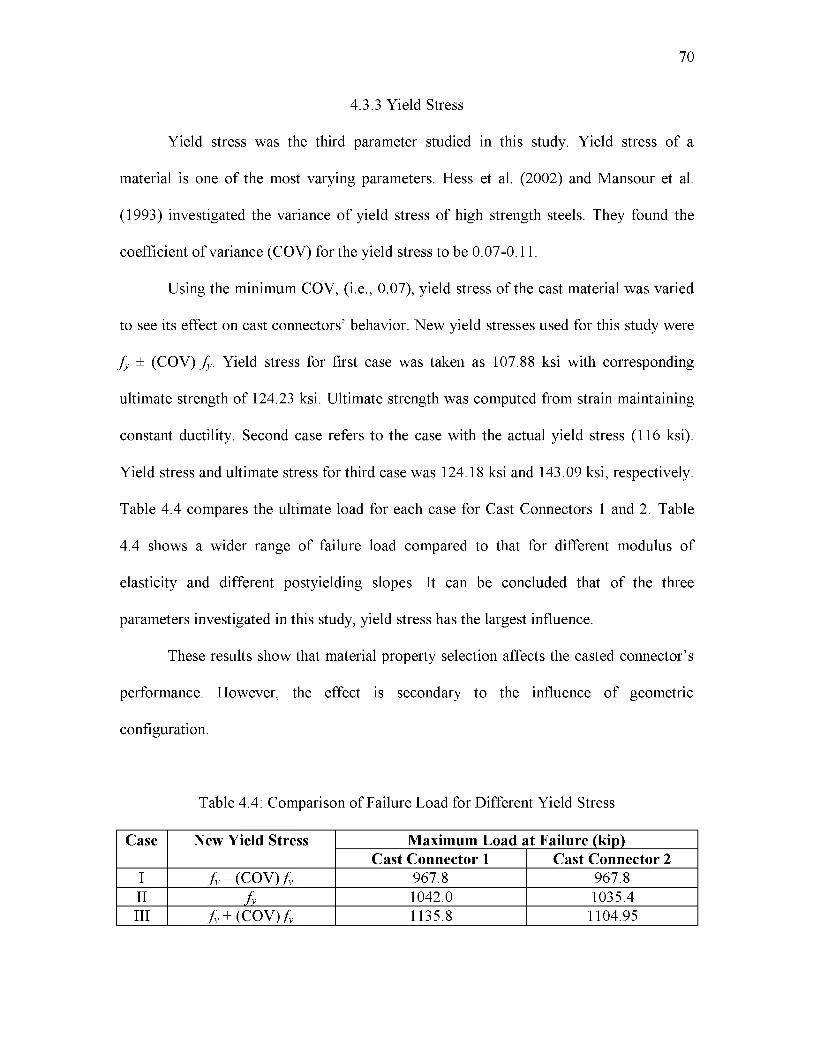
4.3.3 Yield Stress
Yield stress was the third parameter studied in this study. Yield stress of a
material is one of the most varying parameters. Hess et al. (2002) and Mansour et al.
(1993) investigated the variance o f yield stress of high strength steels. They found the
coefficient of variance (COV) for the yield stress to be 0.07-0.11.
Using the minimum COV, (i.e., 0.07), yield stress of the cast material was varied
to see its effect on cast connectors’ behavior. New yield stresses used for this study were
f y ± (COV) f y. Yield stress for first case was taken as 107.88 ksi with corresponding
ultimate strength of 124.23 ksi. Ultimate strength was computed from strain maintaining
constant ductility. Second case refers to the case with the actual yield stress (116 ksi).
Yield stress and ultimate stress for third case was 124.18 ksi and 143.09 ksi, respectively.
Table 4.4 compares the ultimate load for each case for Cast Connectors 1 and 2. Table
4.4 shows a wider range of failure load compared to that for different modulus of
elasticity and different postyielding slopes. It can be concluded that of the three
parameters investigated in this study, yield stress has the largest influence.
These results show that material property selection affects the casted connector’s
performance. However, the effect is secondary to the influence o f geometric
configuration.
70
Table 4.4: Comparison of Failure Load for Different Yield Stress
Case New Yield Stress Maximum Load at Failure (kip)Cast Connector 1 Cast Connector 2
I fy - (COV) . fy 967.8 967.8II fy 1042.0 1035.4III fy + (COV) . fy 1135.8 1104.95

CHAPTER 5
DISCUSSION
5.1 Evaluation of Laboratory Tests
The tests performed on cast connectors 1 and 2, show that the connectors are
capable of sustaining the design load. The initial monotonic and cyclic tests on the
connectors helped establish the high strength capability o f the connector. The legs were
identified as the critical sections of the connectors. Tensile loads o f 688 kips (2.5P) and
709 kips (1.03* 2.5P) were supported by the connectors within linear regime. The study
of additional tests on cast connector 2 indicated that under tensile loads as high as 848
kips (3.1P) the connectors behave linearly.
The overall connector’s nonlinear performance was very close to expectations
based on the material characteristics. The connectors exhibited large elastic capacity, but
the stress-strain curve for the material (A148 GR. 115/95 (ASTM A958, 2006) show that
the cast connector material is less ductile than other structural steels, a conclusion
supported by the tests carried out to the failure limit state. Thus, the experimental tests
performed in this study support the use of cast connectors to demand solicitations
expected under wind loading conditions. Further tests are required prior to using cast

connectors under seismic demands. On the other hand, the cast connector’s high strength
results in a more efficient bracing system.
5.2 Evaluation of FE Analysis
FE analyses were performed to verify the experimental test results and to perform
a parametric study. FE analysis techniques accurately predicted the stress distribution
over the complex cast connectors’ geometry.
FE analyses highlighted the complex stress distribution over the uneven geometry
of the connectors, and showed good agreement with the findings from the experimental
tests. The parametric study showed that effect of variation of the material properties is
not as significant. Complex geometrical configuration o f the connectors governs its
overall response.
5.3 Limitations of the Study
The goals of the study are the cast connectors’ performance evaluation subjected
to quasi-static loading, and identification o f the parameters most affecting their
performance. Experimental tests performed and FE analyses results show that the
connectors should perform satisfactorily for the application o f design quasi-static load o f
275 kips. Results o f the parametric study show that the material properties affect the
connectors’ performance. However, the factors that affect the material properties have
not been investigated in this study.
The results from experimental tests and FE analyses show that the elongation or
the ultimate strain at failure was less than the ultimate strain of around 1.1%. The FE
72

analysis shows that at the most critical location the ultimate strain was 24.2% lower. This
could be attributed to the size effect (effect of test-piece dimension). This means that the
results, like the ultimate load capacity and ultimate strain, are limited to test specimens
having dimensions similar to that of the tested connectors. Effect of test-piece dimension
can be expressed by the Bertella-Oliver equation:
e = eo(L/A1/2)~a
1 /2where eo is the specific elongation constant; L/A is the slimness ratio of gage length
(L) and cross-sectional area (A), a is another material constant. Graphical form of the
Bertella-Oliver equation is shown in Figure 5.1.
The graph shows that the elongation decreases as the slimness ratio increases.
This explains the reduction of strain for same stress as the dimension of cast connector
was greater than the specimen used to obtain the stress-strain curve (which was 0.5 in.
diameter). Also, the performance o f the connectors is evaluated only for quasi-static load.
Performance o f such connectors under dynamic loads could render different conclusions.
100
o- c ac o
-t—'
CO O)c o LU
10ICp 1 10 ~~ 102
Slimness ratio (K ), U/A
73
Fig 5.1: Graphical Form of the Bertella-Oliver Equaiton

CHAPTER 6
CONCLUSIONS AND RECOMMENDATIONS
6.1 Conclusions
This study addresses the performance of high strength alloy steel cast connectors
under quasi-static tensile loading, as well as the parameters controlling the structural
response. Tension tests were performed on both connectors, and FE simulations were
used to validate the experimental results and predict stress distributions. The main
findings are:
• The cast connectors are capable o f withstanding the design load, P, of
275 kips. NYCBC requires connectors to be used in bracing systems to
be able to safely support 2 and 2.5 times the design load. Tests revealed
that both connectors met the requirement. The only test taken to failure
had a safety factor of 3.5.
• Experimental tests show a failure load o f 475 kip (for single leg test) for
cast connector 2. FE analysis showed that to be 516.6 kip (single leg) for
the same case, a difference of 8.8%. FE analysis for two legs loaded case
showed that the failure load was about 1035.4 kips. Hence, for

experimental tests it would be expected to have an ultimate load o f at
least 950 kips.
• Although cast connector 1 was not tested up to failure, the FE analysis
showed a maximum load of 1044 kips.
• Stress distributions in the connectors were largely governed by their
complex geometric shapes. Apart from geometry, material properties also
affect their response, but to a lesser degree.
• Brittle failure was observed for Cast Connector 2 at 3.5 times the design
load. This brittle behavior appears to be triggered by the cast connector
legs dimensions.
In conclusion, cast connectors under quasi-static load performed better than
expected. The connector was able to support 846 kips, which is 3.07 times more than the
design load (P = 275 kips) and 1.23 times more than 2.5P, while still exhibiting elastic
behavior. Hence, using such connectors in bracing systems, subjected to lateral loads like
wind load, is justified provided that the connection designed to perform within linear
range for expected loading.
6.2 Recommendations
It is recommended for future research to perform a more detailed exploration into
factors affecting the material properties supplemented by sufficient laboratory tests and
testing the connectors under dynamic or seismic load.
Because o f the limited number o f laboratory tests, it was difficult to create a
complete picture of factors affecting the material properties and performance of such
75

connectors. Further research is necessary to fully investigate and understand the extent of
impact these factors have on the connectors’ responses. Some considerations could be
taken towards improving the ductility o f the material, such as, altering the heat treatment
and cooling rate of the material.
This study involved evaluation of performance of cast connectors under quasi
static load. As the cast connectors are a part of lateral bracing system, it is of interest to
understand the performance o f the connectors under dynamic or seismic loading. These
experimental tests are needed to determine the feasibility of high strength connectors in
seismic regions.
76

ANALYSIS OF DIFFERENT STRUCTURAL COMPONENTS
APPENDIX A

The subassembly and its different components, including the connections, were
analyzed using SAP 2000. The structural components strength capacity and deflection
limits were evaluated for a maximum load 2.5P = 688 kips. The subassembly had to
safely sustain the applied loads. Deflection of the subassembly also had to be checked as
there was small (3/8 in.) clearance between the subassembly and the load frame.
The top assembly plate (i.e., the plate connecting the steel rods and the actuator)
was also analyzed. A simplistic finite element model was prepared in SAP 2000 to check
if the plate was capable of transferring the load safely.
A.1 Analysis and Check for the Subassembly
The subassembly designed for the tests was analyzed in SAP 2000 to verify the
demand capacity ratio of each element, deflection of the entire subassembly, and
connection design (Figures A.1, A.2 and A.3). The joint reactions, axial force and shear
force on each member are presented in Figures A.4, A.5 and A.6, respectively.
78
Fig A. 1: Frame Label and Load Fig A.2: Joint AssignmentAssignment

79
Fig A.4: Joint Reactions (Force in kips)

80
Fig A.5: Axial Force on the Members Fig A.6: Shear Force on the Members(Force in kips) (Force in kips)
Table A.1 shows that demand/capacity ratios of all members are less than unity
for a tensile applied load of 688 kips. Along with the members, all the joint connections
were designed in accordance with AISC design code (Part 7, 8, 9 and 10).
The analysis was also used to verify that the deflection of the subassembly did not
exceed the clearance o f the load frame and the subassembly. Table A.2 presents the
deflection o f all the joints. U1, U2 and U3 represent the deflection in X, Y and Z
direction, respectively. Deflection of joint number 5 along X direction (U1 in the table)
was the most crucial one as its deflection had to be smaller than the clearance of 3/8 in.
A.2 Analysis of Top Assembly Plate
A steel plate was used to tie the rods connecting the cast connectors to the
actuator. Force was applied to the rod and ultimately to the connector via this plate. The
top plate was modeled in SAP 2000 under the expected loading conditions.

81
Table A. 1: Demand/Capacity Ratio of Each Member of the Subassembly for a Load of 688 kips
TAB] ^E: Steel Design 1-Summary Data-AISC-LRFD93Frame Design Sect Design Type Status Ratio
1 W8X58 Column No Messages 0.6991712 W8X58 Column No Messages 0.0371517 Col 18 Brace No Messages 0.8070288 Col 18 Brace No Messages 0.5588399 W14X211 Brace No Messages 0.31508611 4x4 Beam No Messages 0.70765412 4x4 Beam No Messages 0.70765413 4x4 Beam No Messages 0.54811814 4x4 Beam No Messages 0.54811815 W8X58 Column No Messages 0.77269116 W8X58 Column No Messages 0.29633717 W8X58 Column No Messages 0.068452
Table A.2: Joint Displacements
Joint OutputCase CaseType U1 U2 U3Text Text Text in in in
1 live LinStatic 0 0 02 live LinStatic 0.07961 0 0.053833 live LinStatic 0.08723 0 0.053804 live LinStatic 0.16073 0 0.021355 live LinStatic 0.13843 0 0.021376 live LinStatic 0.02347 0 0.009758 live LinStatic 0.09996 0 0.076749 live LinStatic 0 0 010 live LinStatic 0 0 011 live LinStatic 0 0 012 live LinStatic 0 0 013 live LinStatic 0 0 0

82
A 3 in. plate was reinforced with 1 in. central plate at the top and bottom to
withstand the maximum tensile force of 2.5P. To reduce load concentration around bolt
holes, 1 in. thick washers were used to distribute the load on the plate.
Figure A.7 and Figure A.8 show the FEM model in SAP 2000 and von Mises
stress contour for the top plate. The central green portion in Figure A.7 is the 1 in. thick
reinforcement plate welded on top and bottom of the 3 in. thick plate (represented in
blue). The green elements at the sides and the yellow elements at the center of the plate
represent the washers. Load was applied on the two central washers.
A.3 Connection Design Check
Calculations were made to find out capacity of each connection. Connections at
joints numbered 1, 2, 5, 6, 8 and 13 (refer Figure A.2) were investigated. Calculations
showed that the capacity of connections were as follows
• Joint 1 and 13: 557 kip (each),
• Joint 8 (welded connection): 664 kip
• Joint 2 and 6 : 329 kip (each)
• Joint 5 (bolted connection, with prying considered): 338 kip
The capacity o f each connection was greater than the forces acting on these
connections shown in Figures A.5 and A.6. Sample calculations for finding out the
capacity o f some connections are provided. All the calculations, presented in sample
calculations, are based on AISC Steel Construction Manual.

83
Fig A.8: von Mises Stress Distribution Contour

A.3.1 Sample Calculations
A.3.1.1 Joints 1 and 13
Connections given by joint number 1 and 13 each have two separate connections
with six-1 / in. diameter bolts arranged in two columns separated by 8 in. spacing. Each
separate connection is subjected to eccentric shear force. The capacity o f these
connections can be found out by “Instantaneous Center of Rotation Method” (ICR
method) described in part 7 of the AISC Steel Construction Manual. Table A.3 provides
the calculations for finding the capacity o f a connection.
The table shows that capacity o f each six bolt connection is 278.5 kip. Hence, the
capacity o f joint 1 and 13 is equal to twice the capacity of a single six bolt connection
(= 557 kip). This capacity is greater than the force acting on these connections.
84
Table A.3: Calculations of Joint Capacity using ICR Method
For A 325 X type bolt 1 1/4”Instantaneous Center Distance (E) = 2.5364 in Shear strength of bolts $rn = 62.7 kipsSpacing of columns= 8 inDistance of load from last bolt line (Lp) = 7 in moment arm : 9.536 in
Bolt No x; yi Li ri ri/^m (Xi/ L)*( r/<pr n) Li( r/9m) ry (Reaction)1 2.54 4 4.74 34.41 0.86 0.461 4.07 18.422 10.54 4 11.27 39.26 0.98 0.918 11.06 36.703 2.54 0 2.54 28.35 0.71 0.709 1.80 28.354 10.54 0 10.54 39.08 0.98 0.977 10.29 39.085 2.54 4 4.74 34.41 0.86 0.461 4.07 18.426 10.54 4 11.27 39.26 0.98 0.918 11.06 36.70
Pu allowable = 278.5 kips

85
A.3.1.2 Joint 2 and 6
Joint 2 and 6 each, have two-five bolt connections as shown in Figure A.9. They
are concentrically loaded in shear and tension. The computations for finding out the
capacity o f the connection are presented in the following.
A.3.1.2.1 Members Properties
A 572 Gr. 50
Fy = 50 ksi, Fu = 65 ksi
Thickness of plate (t) = 3/8”
a = 2 / ” < 3.5” (OK)
Leh = 2*d = 2(1) = 2” < 2 / ” (OK)
n < 6
A.3.1.2.2 Shear Strength
9m = 40 kips (p. 7-22 of AISC manual)
12r3"J _
A 572 Gr. 50 plate
1” bolt holes
Fig A.9: Connection Detail of Joint 2 and 6

86
Shear deformation, 9m = 0.75 (2.4) d t Fu
= 0.75 (2.4) (1) (3/8) 65 = 43.88 kip
Tear out:
9Rn = 0.75 (1.2) Lc t Fu = 0.75 (1.2) (1.5 - 17/32) (3/8) 65
= 26.57 kip
Tear trough:
9m = 0.75 (1.2) (3-17/16) (3/8) 65 = 42.5 kip
Therefore, ^Rn = 4*40 +26.57 = 186.57 kip
A.3.1.2.3 Weld Strength
wmin = 1/4” but, w = 5/16” (OK)
100*w = 100 (5/16) =31.25 > (3 x 5 +2 x 1 / ) = 18 in.
therefore, Le = 18 in.
9Rn = 0.75 (0.6) Fexx te Le = 0.75 (0.6) (70) (0.707) (5/16) 2 (18)
= 250.54 kip
A.3.1.2.4 Shear Yield on Plate
^Rn = 0.6 Ag Fy = 0.6 (18) (3/8) 50 = 202.5 kip
A.3.1.2.5 Shear Fracture (Rupture) on Plate
9Rn = 0.75 (0.6) [15-5(1 + 1/8)] 3/8 (65) = 102.83 kip

87
A.3.1.2.6 Block Shear of Plate
^Rn = 123.4 kip
A.3.1.2.7 Plate Bending
9Rn =0.9 Fy S/(23/4 ) = 0.9 (50) (3/8) (15)2 /(6 * 2.75) = 127.84 kip > 102.83 kip
hence, Vu = 102.83 kip
Therefore, Pu = Vu/cos(39) = 164.75kip
2 x Pu = 329 kip
Similar calculations can be done for the strength of connection in tension.
However, the tensile strength is more than the shear strength, hence the shear strength
governs. Hence, capacity o f the joint = 329 kips.

APPENDIX B
STRAIN RATE COMPUTATION

Table B.1: Strain Rate Calculation for Cast Connector 1
Cast Connector I
LVDT L0 = 13.25 in.Monotonic
Load Load rate Time LVDT 2 LVDT 3 SG 10 SG 11 Avg Rate(kip) (kip/min) (min) Deflection Strain rate (in/in/min) Deflection Strain rate (in/in/min) (in/in) (in/in) (in/in) (in/in/min)
137.5 5 27.5 0.0062 0.0005 1.688E-05 0.0064 0.0005 1.756E-05 0.00075 0.00059 0.00067 2.427E-05275.0 4 34.4 0.0108 0.0008 1.028E-05 0.0115 0.0009 1.124E-05 0.00136 0.00111 0.00124 1.660E-05412.5 4 34.4 0.0181 0.0014 1.601E-05 0.0184 0.0014 1.508E-05 0.00228 0.00181 0.00204 2.343E-05550.0 3 45.8 0.0225 0.0017 7.278E-06 0.0230 0.0017 7.591E-06 0.00291 0.00219 0.00255 1.111E-05
CyclicLoad Load rate Time LVDT 2 LVDT 3 SG 10 SG 11 Avg Rate(kip) (kip/min) (min) Deflection Strain rate (in/in/min) Deflection Strain rate (in/in/min) (in/in) (in/in) (in/in) (in/in/min)
137.5 30 4.6 0 0.000E+00 0.00841 0.00063 1.385E-04 0.00063 0.000726 0.00068 1.479E-04275.0 30 4.6 0 0.000E+00 0.01411 0.00106 9.386E-05 0.00135 0.001319 0.00133 1.432E-04412.5 30 4.6 0 0.000E+00 0.02007 0.00151 9.814E-05 0.002088 0.001903 0.002 1.442E-04550.0 10 9.1 0 0.000E+00 0.02574 0.00194 4.694E-05 0.002834 0.002484 0.00266 7.278E-05688.0 10 13.8 0 0.000E+00 0.03005 0.00227 2.357E-05 0.003794 0.003102 0.00345 5.717E-05
*Note: LVDT 2 was not used in cyclic test.
oo89

Cast Connector II
LVDT L0 = 19.375 in.
Table B.2: Strain Rate Calculation for Cast Connector 2 (Monotonic Test)
MonotonicLoad Load rate Time LVDT 2 LVDT 3(kip) (kip/min) (min) Deflection Strain rate (in/in/min) Deflection Strain rate (in/in/min)
137.5 5 27.5 0.00862 0.000445 1.618E-05 0.00733 0.00038 1.376E-05275.0 4 34.4 0.01175 0.000606 4.700E-06 0.01060 0.00055 4.910E-06412.5 4 34.4 0.01480 0.000764 4.579E-06 0.01430 0.00074 5.555E-06550.0 3 45.8 0.01863 0.000962 4.313E-06 0.02037 0.00105 6.835E-06557.0 3 2.3 0.01911 0.000986 1.062E-05 0.02076 0.00107 8.627E-06
Load(kip)
SG 1 (in/in)
SG 2 (in/in)
SG 3 (in/in)
Avg(in/in)
Rate(in/in/min)
SG 4 (in/in)
SG 5 (in/in)
SG 6 (in/in)
Avg(in/in)
Rate(in/in/min)
137.5 0.00079 0.000522 0.000802 0.000705 2.565E-05 0.000815 0.00044 0.000494 0.0005843 2.125E-05275.0 0.00133 0.001217 0.001277 0.001276 1.659E-05 0.001465 0.00111 0.000839 0.0011377 1.610E-05412.5 0.00185 0.001885 0.001759 0.001832 1.618E-05 0.002146 0.00177 0.001196 0.0017023 1.643E-05550.0 0.0024 0.002509 0.002209 0.002371 1.177E-05 0.002917 0.00243 0.001567 0.0023053 1.316E-05557.0 0.00246 0.002602 0.002281 0.002447 3.257E-05 0.002997 0.00252 0.001618 0.0023777 3.100E-05

Table B.3: Strain Rate Calculation for Cast Connector 2 (Cyclic Test)
CyclicLoad Load rate Time LVDT 2 LVDT 3(kip) (kip/min) (min) Deflection Strain rate (in/in/min) Deflection Strain rate (in/in/min)
137.5 30 4.6 0 0.000E+00 0.00875 0.00045 9.853E-05275.0 30 4.6 0 0.000E+00 0.01198 0.00062 3.637E-05412.5 30 4.6 0 0.000E+00 0.01608 0.00083 4.617E-05550.0 10 9.1 0 0.000E+00 0.02040 0.00105 2.446E-05557.0 10 0.7 0 0.000E+00 0.02098 0.00108 4.276E-05688.0 10 13.1 0 0.000E+00 0.02537 0.00131 1.730E-05709.0 10 2.1 0 0.000E+00 0.02617 0.00135 1.966E-05
*Note: LVDT 2 was not used in cyclic test.
Load(kip)
SG 1 (in/in)
SG 2 (in/in)
SG 3 (in/in)
Avg(in/in)
Rate(in/in/min)
SG 4 (in/in)
SG 5 (in/in)
SG 6 (in/in)
Avg(in/in)
Rate(in/in/min)
137.5 0.00071 0.00047 0.00070 0.00063 1.372E-04 0.00086 0.00048 0.00047 0.00060 1.316E-04275.0 0.00124 0.00116 0.00119 0.00120 1.237E-04 0.00152 0.00114 0.00082 0.00116 1.212E-04412.5 0.00176 0.00182 0.00172 0.00177 1.246E-04 0.00217 0.00178 0.00119 0.00172 1.214E-04550.0 0.0023 0.00249 0.00230 0.00236 6.556E-05 0.00284 0.00242 0.00161 0.00229 6.329E-05557.0 0.00237 0.00257 0.00237 0.00244 1.024E-04 0.00292 0.00250 0.00166 0.00236 9.762E-05688.0 0.00282 0.00315 0.00288 0.00295 3.916E-05 0.00350 0.00304 0.00205 0.00287 3.852E-05709.0 0.00289 0.00325 0.00297 0.00304 4.206E-05 0.00360 0.00314 0.00212 0.00295 4.190E-05
APPENDIX C
NORTH STAR CASTEEL REPORT

93

94

APPENDIX D
LVDT AND STRAIN GAGE CHARACTERISTICS

LVDTs:
No. 1: LVDT located between the actuator plate and the subassembly’s top plates.
Model: MVL7C Range: ± 0.500 inch
Part No: 060-5654-01
S/N: L6931600
No. 2: (On the cast connector, behind the visible side)
Model: MVL7C Range: ± 0.500 inch
Part No: 060-5654-01
S/N: L6931200
No. 3: (On the cast connector, visible side)
Model: MVL7C Range: ± 0.500 inch
Part No: 060-5654-01
S/N: L6931300
No. 4: (for the lateral deflection of entire assembly)
Model: MVL7C Range: ± 0.500 inch
Part No: 060-5654-01
S/N: L6931800
No. 5: (bottom of the frame)
Model: MVL7C Range: ± 0.500 inch
Part No: 060-5654-01
S/N: L6931500
96

97
Strain Gages
Grid Resistance in Ohms 350.0 ± 0.3%
Grid Gage Factor @ 24°C1 2.120 ± 0.5%
TC of Gage Factor, % / 100°C (+1.3 ± 0.2)
Transverse Sensitivity +0.1 ± 0.2%
Calculation o f Thermal Output for Strain Gages:
a0 + a1*T + a2*T2 + a3*T3 +a4*T4
where, a0, a^ .... a4 are coefficients as given below and TN is temperature raised to the
power N.
Order Fahrenheit Celsius0 -2.26 E+2 -8.83 E+11 +5.46 E+0 +5.84 E+02 -3.87 E-2 -9.91 E-23 +8.80 E-5 +4.71 E-44 -5.62 E-8 -5.90 E-7
Foil Lot Number
A65AD853
Item Code
Batch Number
CF531872
Code
3204 223113

REFERENCES
ABAQUS/CAE 6 version 12.2 [computer software]; 3D Simulia Dassault Systemes: Waltham, Massachusetts, 2012.
SolidWorks [computer software]; 3D Simulia Dassault Systemes: Waltham, Massachusetts, 2012.
American Institute of Steel Construction. Part 7, 8, 9 and 10. In Steel Construction Manual (14th ed.): Chicago, Illinois, 2011.
ANSYS version 14.5 [computer software]; ANSYS, Inc.: Canonsburg, Pennsylvania,2012.
ASM International. Tensile Testing (2nd ed.); Davis, J.R., Eds.; ASM International: Materials Park, Ohio, 2004.
American Society for Testing Materials. A370-05 Standard Test Methods and Definitions for Mechanical Testing of Steel Products; ASTM International: West Conshohocken, Pennsylvania, 2006.
American Society for Testing Materials. A958-00 Standard Specification for Steel Castings, Carbon and Alloy, with Tensile Requirements, Chemical Requirements Similar to Standard Wrought Grades; ASTM International: West Conshohocken, Pennsylvania, 2006.
American Society for Testing Materials. A488/A488M-06 Standard Practice for Steel Castings, Welding, Qualifications o f Procedures and Personnel; ASTM International: West Conshohocken, Pennsylvania, 2006.
Bao, W.; Xing, W.; Qiu, J. The Use of Cast Steel in Steel Structure. Advanced Material Research. 2011, 183-185.
Bjorhovde, R. Performance and Design Issues for High Strength Steel in Structures. Advances in Structural Engineering. 2010, Vol. 13, No. 3.
Brockenbrough, R.L.; Merritt, F.S. (2006). Properties of Structural Steels and Effects of Steelmaking and Fabrication. In Structural Steel Designer’s Handbook: AISC, AASHTO, AISI, ASTM, AREMA, andASCE-07Design Standards (4th ed.); McGraw-Hill: New York, 1999; pp 1.1-1.40.

99
Chen, Y.Y.; Zhao, X.Z.; Tong, L.W. Research and Application of Connections of Structural Steel Casting. Advances in Structural Engineering. 2010, Vol. 13 No. 3.
Coelho, A.M.G.; Bijlaard, F. High Strength Steel in Buildings and Civil Engineering Structures: Design of Connections. Advances in Structural Engineering. 2010, Vol. 13, No. 3.
SAP2000 version 14.1.0 [computer software]; Computers and Structures, Inc.: Berkeley, California, 2009.
Edlund L. In Coefficients of Variation for the Yield Strength of Steel, 2nd Colloquium on Stability o f Steel Structures, Liege, Belgium, 1977.
Hess, P.E.; Barchman, D.; Assakkaf, I.A.; Ayyub, B.M. Uncertainties in Material Strength, Geometric, and Load Variables. Naval Engineers Journal. 2002, Vol. 114,Issue 2.
Krawinkler, H; Parisi, F.; Ibarra L.; Ayoub, A; Medina, R. Development of a Testing Protocol for Woodframe Structures. In The CUREE-Caltech Woodframe Project;CUREE Publication: Richmond, CA, 2001; W-02.
Mansour, A. E.; Lin, M.; Hovem, L; Thayamballi, A. Probability-based ShipDesign Procedures; A Demonstration. In SSC-368. U.S. Coast Guard: Washington, DC, 1993.
Monroe, R; and Poweleit, D. Scraping the Sky with Steel Castings. Engineered Casting Solutions. 2004, Vol. 6, Issue 2.
NYC Buildings. Structural Tests and Special Inspections. In New York City Building Code, NYC Buildings: New York, 2012; Chapter 17. http://www.nyc. gov/html/dob/downloads/pdf/cc_chapter 17.pdf.
Oliveira, J.-C. de; Gray, M.G.; Packer, J. A.; Christopoulos, C. In Standardized Cast Steel Connectors for Tubular Hollow Structural Sections, Proceedings of the CSCE Annual Conference, Quebec, Canada, 2008.
RPBW. In Typical Truss Details 3. S-432.00; Renzo Piano Building Workshop: Genova, Italy, 2010.
Tectonic Engineering. In Procedure for Testing Notch Bracing Casting Connection Assembly; Rev. 2011: Long Island City, New York, 2011.