competitive-strength evaluation of corobrik in the …
TRANSCRIPT
COMPETITIVE-STRENGTH EVALUATION OF COROBRIK IN THE FACE-BRICK MARKET
by
HEINRICH VON WIELLIGH
Submitted in partial fulfilment of the requirements for the degree
MASTERS IN BUSINESS LEADERSHIP
in the
GRADUATE SCHOOL OF BUSINESS LEADERSHIP
UNIVERSITY OF SOUTH AFRICA
Supervisor: Professor P. Venter
November 2007

i
I hereby declare that the dissertation submitted for the degree Masters in Business
Leadership, at the University of South Africa, Pretoria, is my own original work and
has not previously been submitted to any other institution of higher education. I
further declare that all sources cited or quoted are indicated and acknowledged by
means of a comprehensive list of references.
H. von Wielligh
Copyright@ University of South Africa (UNISA), Pretoria 2007

ii
DEDICATED TO MY PARENTS TILLA AND GAWIE VON WIELLIGH,
MY WIFE MADELEIN, MY CHILDREN MARISKA AND RECHARDT,
MY BROTHER JURGEN AND MY GRANDMOTHER
CORRIE MOOLMAN
iii
ABSTRACT The main purpose of the study is to determine strategies for retaining valuable
current customers and acquiring attractive new customers for Corobrik; therefore, the
problem to be investigated is the reason for Corobrik’s inability to gain significant
market share in the brick market over the last five years. Although there has been
tremendous growth in the building industry, Corobrik has not been able to fully
capitalise on the situation despite increasing its own capacity.
A competitive-strength evaluation will form the basis of this study in order to
determine customer preferences, as well as competitor performance relating to these
preferences.
The study will be limited to the Gauteng Province owing to the enormous number of
customers in South Africa as well as to time constraints. The market in Gauteng is
substantial enough to yield a fair representation of what is to be achieved with the
study. A questionnaire will be distributed to Architects, Contractors and Distributors,
which represent the different market segments, and the data will be collected by
means of telephonic interviews.
McDonald & Dunbar (2004) expounded on a method of competitive-strength
evaluation, entailing a method of understanding the customers’ preferences and
understanding their views of competitor performance in relation to the customers'
own preferences. Based on this method, a questionnaire was drafted which will be
distributed to role players in the market in order to collect the required data.
This research study can be seen as exploratory, since future research tasks could be
discovered during the study. This study will be a ‘snapshot in time’ because of time
constraints, and could possibly yield different results if repeated at any other time.
The questionnaire is such that the data could be analysed and certain propositions
could be compared with the ratings. Therefore, a semi-quantitative study is possible,
i.e. people’s perceptions can be measured. It is important that the study be done in a
‘field setting’ to reflect what would occur under actual conditions. In addition, exactly
the same questionnaire was used for all respondents, minimising the possibility of the
respondents or the researcher manipulating the ratings reflected in the survey.
iv
The main findings revealed that sales to Distributors and Contractors constitute
approximately 85 per cent of the total product sales of Corobrik and that Distributors
and Contractors perceived Corobrik as expensive, Price being rated as their most
important DBC.
Architects rated Quality and Aesthetics as the most important DBCs and they rated
Corobrik the best performer in these categories. This finding implies that Corobrik
manages to satisfy Architects’ most important needs; however, Price was also
Corobrik’s worst performing DBC in terms of the Architect ratings.
Corobrik does satisfy the needs of Architects fairly well; however, this study was
limited to the brick industry and did not attempt to compare face bricks with rival
materials such as glass, aluminium, wood, plaster and paint and others.
Consequently, Corobrik’s performance was not compared with that of the
manufacturers of these rival products with regard to the relevant DBCs. It is,
therefore, recommended that such a study be conducted in order to determine how
well Corobrik performs in comparison with the rival companies. In addition, Corobrik
should consider a marketing objective of developing new products for existing market
segments (Architects), i.e. products that are able to compete with glass, aluminium
and other rival materials, or that could even be used to compliment one another. This
initiative could lead to increased market share, not only in the brick market but also in
the bigger construction market.
It appears that Corobrik has to date followed the marketing strategy of supplying
existing products to new segments such as the residential market, and the
researcher’s impression is that this new segment does not really want the product
because of its affordability. Therefore, Corobrik needs to consider developing new
products for the relatively new residential market, but with the emphasis on
affordability.
v
TABLE OF CONTENTS
PAGE ACKNOWLEDGEMENTS xi ABSTRACT iii LIST OF APPENDICES ix LIST OF TABLES vii LIST OF FIGURES viii LIST OF ABBREVIATIONS x
CHAPTER 1 1
1. INTRODUCTION 1 1.1 PURPOSE OF THIS RESEARCH 4 1.2 THE OBJECTIVE OF THE STUDY 4 1.3 DEFINITIONS 5 1.4 DELIMITATIONS OF THE STUDY 8 1.5 IMPORTANCE OF THE STUDY 9 1.6 OUTLINE OF THE RESEARCH REPORT 9
CHAPTER 2 11
2. LITERATURE REVIEW 11 2.1 INTRODUCTION 11 2.2 MARKETING 12 2.3 DEFINE MARKETS AND SEGMENTS, AND UNDERSTAND VALUE 14 2.3.1 Segmentation as part of marketing strategy 16 2.3.2 Development of market segmentation 18 2.3.3 Segmenting criteria 20 2.4 DETERMINE THE VALUE PROPOSITION 23 2.4.1 Market targeting 25 2.5 DELIVERING THE VALUE PROPOSITION 28 2.6 MONITORING VALUE 30 2.7 CONSUMER PREFERENCES 32 2.8 POSITIONING 34 2.8.1 Approaches to positioning research 37 2.8.2 Positioning maps 38 2.8.3 Attribute positioning maps 41 2.8.4 Attitude positioning maps 41 2.9 COMPETITIVENESS AND CRITICAL SUCCESS FACTORS 42 2.9.1 SCORING THE COMPANY AND THE COMPETITORS 44
vi
2.10 MARKETING PLANNING 44 2.10.1 The Marketing planning process 45 2.11 SUMMARY 49
CHAPTER 3 53
3. RESEARCH METHODOLOGY 53 3.1 PROPOSITIONS 55 3.2 RESEARCH DESIGN 58 3.2.1 Design strategy 58 3.2.2 Data-collection design 59 3.2.3 Sample design 60 3.2.4 Timeline 61 3.2.5 Instrument 61 3.2.6 Data analysis 63 3.3 LIMITATIONS OF THE STUDY 65
CHAPTER 4 67
4. RESULTS 67 4.1 PARTICIPATION ANALYSES OF GROUPS 67 4.2 RESEARCH RESULTS 68 4.3 PROPOSITIONS 83 4.4 POSITIONING MAPS 87
CHAPTER 5 90
5. CONCLUSION AND RECOMMENDATIONS 90 5.1. BACKGROUND 90 5.2 CONCLUSION 91 5.3. RECOMMENDATIONS 94
REFERENCES 95
vii
LIST OF TABLES
PAGE Table 2.1: Competitive-strength evaluation (after McDonald & Dunbar, 2004:319) 44 Table 3.1: Research-design strategy 58 Table 3.2: Proposed research timeline 61 Table 4.1: Distributors’ average DBC scores 70 Table 4.2: Average competitor scores by Distributors for Corobrik 70 Table 4.3: Average competitor scores by Distributors for Brickor 71 Table 4.4: Average competitor scores by Distributors for African Brick and
West End Brick 72 Table 4.5: Consolidated competitive-strength evaluation by Distributors 73 Table 4.6: Contractors’ average DBC scores 74 Table 4.7: Average competitor scores by Contractors for Corobrik 75 Table 4.8: Average competitor scores by Contractors for Brickor 76 Table 4.9: Average competitor scores by contractors for African Brick and West
End Brick 77 Table 4.10: Consolidated competitive-strength evaluation by Contractors 78 Table 4.11: Architects’ average DBC scores 79 Table 4.12: Average competitor scores by Architects for Corobrik 80 Table 4.13: Average competitor scores by Architects for Brickor 81 Table 4.14: Average competitor scores by Architects for African Brick
and West End Brick 82 Table 4.15: Consolidated competitive-strength evaluation by Architects 83
viii
LIST OF FIGURES
PAGE
Figure 2.1: Map of the marketing domain (after McDonald, 2006:103). 14 Figure 2.2: Define markets and segments, and understand value (McDonald & Dunbar &
McDonald, 2004:15). 15 Figure 2.3: Developing a marketing strategy (after Berry, Hill & Klompmaker,
1999:3603). 18 Figure 2.4: Determine value proposition (McDonald & Dunbar, 2004:17). 24 Figure 2.5: Deliver value proportion (after McDonald & Dunbar, 2004:20). 30 Figure 2.6: Monitor value (after McDonald & Dunbar, 2004:25). 31 Figure 2.7: Semantic differential and semantic-differential profile (after Proctor,
2000:203). 38 Figure 2.8: A hypothetical positioning map (after Ruskin-Brown, 1999:97). 39 Figure 2.9: Hypothetical spidergram positioning map (after Ruskin-Brown, 1999:98). 40 Figure 2.10: The Ansoft Matrix (after McDonald, 2006:105). 48 Figure 4.1: Spidergram with Architects’ ratings for competitor evaluation 87 Figure 4.2: Spidergram with Contractors’ ratings for competitor evaluation 88 Figure 4.3: Spidergram with Architects’ ratings for competitor evaluation 89

ix
LIST OF APPENDICES
PAGE
APPENDICES 99
APPENDIX A SELF-DEVELOPED QUESTIONNAIRE 100
x
LIST OF ABBREVIATIONS
ABBREVIATIONS
CSF – Critical Success Factor
DBC – Decisive Buying Criteria
e.g. – L exempli gratia, for example
etc. – et cetera, and so on
i.e. – L id est, that is to say
inc. – including
i.t.o – in terms of
LSM – Living Standards Measure
MBA – Masters Building Association
MBL – Masters of Business Leadership
SAARF – South African Advertising Research Foundation
VALS – Values And Life Styles

xi
ACKNOWLEDGEMENTS The author wishes to express his gratitude to:
His supervisor, Professor P. Venter of the School of Business Leadership, University of South Africa (UNISA), for assisting him with the completion of this dissertation. The programme administrator, Ms Elsabie Brooderyk of the School of Business Leadership, University of South Africa (UNISA), for administrative assistance during the course of his studies. Corobrik, for making available the necessary information for the completion of this dissertation. Mr. D.J. Meyer, who approved and supported the author’s bursary. Ms Adri van Heerden, for her considerable effort with proofreading and editing.

1
CHAPTER 1
1. INTRODUCTION
Corobrik is the largest manufacturer, distributor and exporter of bricks and
allied building products in Africa. Corobrik touches the lives of millions of
people every day because their products are used in every conceivable
building including houses, hotels, shopping centres, office parks, factories,
hospitals and schools.
Corobrik (Pty) Ltd was established in Durban in 1902. There are fourteen
operating factories in South Africa and over two thousand people are
employed countrywide. Corobrik has the most extensive distribution network in
the country and the products are available throughout South Africa and many
countries worldwide. The latest technology in the manufacturing processes is
employed, and the research and development team works towards the latest
and innovative product designs.
Corobrik is a proudly South African company and have their head office in
Durban, with regional offices in Johannesburg and Cape Town. There are 28
Corobrik sales centres countrywide.
Black economic empowerment (BEE) is the corner stone of Corobrik’s future,
with AKA Capital (Pty) Ltd, a leading black-empowerment private-equity
investment company, being part of the Corobrik shareholder complement.
According to Dangers (2007) the external and internal environment of Corobrik
can be summarised as follows:
Brick products are supplied to a variety of customers and are used in
the residential, commercial and industrial markets, as well as by the
government in South Africa. Some of the products are exported to
neighbouring countries in Africa and to countries abroad.
2
The key players in the use of brick products include Architects,
Contractors, Developers, government and consumers in the South
African market.
Approximately 50 per cent of the total amount of product sold in the
Gauteng region is done through distribution and Corobrik centres, of
which approximately 80 per cent is sold to the residential market. The
client purchasing products through centres is referred to as the ‘man in
the street’, consumer or customer. A designer or a Contractor mostly
influences the customer’s purchase decision.
Approximately 30 to 35 per cent of the product in the commercial and
industrial markets (non-residential) is sold to Contractors. Architects are
responsible for about 70 to 75 per cent of the decisions on using
products in this market, with the balance of the decisions being made
by the Developers. The influence of the Contractor, however, cannot be
ignored, since the Contractor has an influence on the Architect and the
Developer, based on past experience with a product.
An estimated 15 to 20 per cent of product sold in the Gauteng region is
to the government for use in government projects. Architects and
Specifiers normally have a 50 per cent influence on the type of product
to be used, with the balance of the decision-making influence belonging
to the relevant community.
Corobrik, obviously being conversant with the decision-making
background, has structured their sales department to take advantage of
the situation. Part of the sales force deals directly with Architects, while
another section of the sales team deals directly with Contractors, which
are divided into large and small Contractors depending on the size of
projects. Within the large Contractor group, Architects specify 75 per
cent of the products utilised, while Developers decide upon the balance.
This ratio changes to 50/50 when dealing with smaller contractors.
Corobrik centres and distribution centres have products available
directly to the public or consumer. There are 28 Corobrik centres
countrywide, with each having a centre manager. A certain proportion of
the architectural representatives concentrate on government projects. A
total of 24 reputable distributors of hardware, including face bricks, in
Gauteng, not only sell Corobrik products but also products from the
3
opposition. These distributors account for a total of 64 centres in
Gauteng, i.e. some distributors have more than one centre.
In view of the above-mentioned information, Corobrik has segmented
the Gauteng market into three major parts, namely the 1)
consumers/customers in the residential market purchasing from
centres, 2) Contractors purchasing for the commercial and industrial
markets led by Architects and Developers as main influencers with
regards to product choice, and 3) the government, influenced by
Architects/Specifiers and local communities regarding product choice.
The Gauteng region is responsible for 44 per cent of the total revenue
of Corobrik. Corobrik owns approximately 90 to 95 per cent of the total
face-brick market and 15 to 20 per cent of the clay-brick market, but
less than 10 per cent of the total brick market when cement products
are included. The brick market in South Africa comprises a total of
approximately 12 billion units per annum. The main role players in the
clay face-brick manufacturing market are Corobrik, Brickor, West End
Brick and African Brick. There are many other smaller clay-brick
manufacturers but they do not have as diversified a range as the above-
mentioned suppliers.
Corobrik has significantly increased its own manufacturing capacity over the
last 4 to 5 years to keep pace with the increased demand on building
materials; however, the opposition has done the same to increase their output
capacity. Corobrik has essentially maintained its market share but is getting
ever-increasing fierce competition from the opposition. The residential market,
especially, has shown tremendous growth in the last few years and it is in this
segment that opposition brick manufacturers have taken advantage of the
situation. It is unsure how much the building industry has grown in terms of
brick products, but it is estimated to have almost doubled in the last five years.
Corobrik is not only competing with other brick manufacturers in a booming
industry, but also with other building products such as glass, aluminium,
plaster and paint. This study, however, will be confined to the brick industry.
Corobrik needs to be aware not only of what factors are important to
customers buying face brick, but also how well the company is performing with
4
regard to these requirements compared with the opposition. The aim is to
ensure that at the least its market share is maintained, but also that
opportunities are created and used to gain market share by taking it away from
the opposition.
The problem that will be investigated in this study, therefore, is to establish
why Corobrik has not been able to gain significant market share in the brick
market over the last five years. There has been tremendous growth in the
building industry in the last few years, but Corobrik has not been able to fully
capitalise on this situation despite increasing its own capacity.
A competitive-strength evaluation will form the basis of this study in order to
determine customer preferences, as well as competitor performance relating to
these preferences.
1.1 PURPOSE OF THIS RESEARCH
The main purpose of the study is to determine strategies for retaining valuable
current customers and acquiring attractive new customers for Corobrik.
1.2 THE OBJECTIVE OF THE STUDY
The main objective of the study is to determine the importance of the key
attributes customers are seeking when purchasing face brick. It is also
important to know how the customer perceives a company in comparison with
its competitors with regard to their (the customers’) requirements. This
information should enable the company to best position itself and its products
in the market and will provide an opportunity to develop effective customer
relationships. Depending on the outcome of the information, current marketing
strategies may be revised in order to ensure that these strategies are more
successful in meeting the requirements of customers than those of the
opposition.
5
1.3 DEFINITIONS
Marketing Marketing can be described as a process for (McDonald & Dunbar 2004:9):
Defining markets
Quantifying the needs of customer groups (segments) within these markets
Determining the value propositions to meet these needs
Communicating these value propositions to all concerned in the
organisation and gaining their cooperation with regard to their role in the
initiative
Playing an important part in delivering these value propositions (usually
only communications)
Monitoring the value actually delivered
This definition of marketing can be regarded as a function for strategy
development, as well as for tactical sales delivery. A map could be drawn to
visualise the above in order to clarify how marketing effectiveness can be
measured.
Market segmentation Market segmentation is a process of partitioning a market into a number of
distinct sections, using criteria that reflect different and distinct purchasing
behaviour and the motives of customers (Proctor, 2000).
Needs-based segmentation Needs-based segmentation entails segmenting the market based on
understanding the needs of the customers (Greengrove, 2002).
Characteristics-based segmentation
Characteristics-based segmentation is based on characteristics, attitudes or
behaviour of the customer and the characteristics of the area in order to
segment customers (Greengrove, 2002).
6
Marketing strategy Marketing strategy specifies the target market and a related marketing mix. It
is a ‘big picture’ of what a firm will do in a specific market. Two interrelated
parts are needed: 1) a target market — a fairly homogeneous group of
customers the company wishes to appeal to; 2) a marketing mix — the
controllable variables the company puts together to satisfy the requirements of
the target group (Perreault & McCarthy, 2002).
Strategic marketing plan A strategic plan is defined as a plan that covers a period beyond the next fiscal
year, usually between three and five years (McDonald, 2002).
Tactical marketing plan A tactical plan, or operational plan, is defined as a plan that covers in detail the
actions to be taken, and by whom, during a short-term planning period; usually
one year or less (McDonald, 2002).
Target market A target market can be defined as the market or market segments which form
the focus of the firm’s marketing efforts (Proctor, 2000).
Positioning Positioning refers to the way customers perceive proposed and/or present
brands in the market (Gwin & Gwin, 2003).
Decisive buying criteria (DBC) During a process of evaluation, customers make a decision between
alternative offers in terms of perceived or stated attributes and this is referred
to as the Decisive Buying Criteria (DBC) (McDonald & Dunbar, 2004).
Critical success factors (CSF) The successes in relation to the constituents of the offer required to deliver
each DBC are referred to as the Critical Success Factors (CSF) (McDonald &
Dunbar, 2004).
7
Face brick
A face brick can be described as a clay or cement masonry unit that is
characterised by tight size tolerances, being fit for purpose and not requiring
any rendering once in place/use. Clay is by far the most commonly used
material for face brick. Cement products that do not require any rendering are
more commonly found in a format more suited to paving purposes. Face brick
is used in interior and exterior walls and is made in a variety of colours and
textures (Ledbitter, 2007).
Clay brick
The term ’clay brick’ includes all masonry units manufactured from clay,
including face brick. Clay brick, other than face brick, has less size tolerances
and may require rendering once in place/use. Having to render clay products
once in place/use could be because of the less pleasing aesthetics of the
product, or the non-durability of the product, i.e. the durability not being
adequate if the product, such as plaster brick, is not protected (Ledbitter,
2007).
Cement brick
Masonry units made of cement are more commonly used in walls that will be
plastered and painted because of their less aesthetic appearance. Cement
bricks could be regarded as a direct competitor of clay bricks (excluding face
brick). Cement pavers also fall in the category of cement bricks, but they would
not be used for walling purposes (Ledbitter, 2007).
Architect A person, or group of people, in charge of the design and aesthetics of a
building is referred to as an Architect or group of Architects. Factors such as
ergonomics, fashion, ease of use of products and cost all play a role in the
scope of the building design (Ledbitter, 2007).
Contractor The Contractor, in the context of masonry products, is the entity that
purchases the product and physically uses the product to construct what the
Architect initially designed (Ledbitter, 2007).
8
Developer A Developer is the client of what has been constructed by the Contractor and
designed by the Architect. The Developer becomes the property owner, uses
the property as a means of investment and therefore has the ability to
influence the choice of products used (Ledbitter, 2007).
Specifier Any person who has a decisive influence on the choice of product to be used
is regarded as the Specifier for a particular project. An engineer could specify
a particular masonry unit because of the strength requirements of the
structure, or an Architect may specify a specific colour of clay brick to match
the tiles to be used. Alternatively, a landscape designer or interior decorator
could be the Specifier because of the specific aesthetic requirements of their
designs (Ledbitter, 2007).
1.4 DELIMITATIONS OF THE STUDY
The scope of this study is to examine the requirements of customers and to
compare how well Corobrik is meeting these demands in comparison with its
competitors. This study will not be done on a national basis, but will be
confined to the Gauteng Province owing to the practical problems of reaching
all customers; time and cost constraints being the main limiting factors. The
Gauteng region represents 44 per cent of Corobrik’s total revenue and any
marketing strategy will therefore have the biggest impact in this area, and, if
successful, could be tested elsewhere.
The economy is currently in a boom phase and this study could possibly obtain
different results should the economy be closer to, or in a recession phase. The
current high demands influence the perceptions of availability, price, and
quality and these could change when the economic climate changes.
This study will include only the main suppliers in Gauteng of clay brick (which
includes face brick) as competitors. There are other, smaller, clay-brick
manufacturers but their product diversification is limited, customers may not
9
even be aware of their suppliers and, consequently, the results may be
skewed. Suppliers of other building materials such as glass, aluminium and
plaster and paint are excluded for the purpose of this study.
1.5 IMPORTANCE OF THE STUDY
Corobrik supplies building materials to the construction industry and it is
important that the company understands what the decisive buying criteria of
consumers are when they purchase building materials, in this case bricks. In
addition, it is important to understand how well the company lives up to the
expectations of consumers and customers compared with its competitors. The
demand for building materials, including bricks, is currently in excess of, or
close to the supply capacity of companies in this industry; however, if an
economic downturn should occur, only those companies being better able than
the opposition to satisfy the requirements of customers will have a chance of
surviving or of maintaining their market share. The building industry has
experienced cyclic performances over the years that are directly linked to the
local economic climate. Corobrik has increased its output, as had the
opposition, over the past few years to keep up with the growing demand of the
building industry. Corobrik’s market share has remained fairly stable; however,
it is being threatened by increasing competition from other brick
manufacturers. The information gained from this study should produce some
insight with regard to consumer requirements for face brick as well as
company competitiveness, and, therefore, could enable the company not only
to gain customers during good economic times, but also to retain them during
bad economic times.
1.6 OUTLINE OF THE RESEARCH REPORT
Chapter 2 contains the literature study of this research project and describes
the foundation of marketing and marketing principles. Principles such as
market segmentation, target marketing, positioning, and marketing strategies
are discussed. The process of the marketing domain is described and explains
10
the steps toward understanding the customer and the competitors, as well as
the own company’s capabilities, and then delivering the offer by means of
various marketing strategies. The chapter also includes the following:
monitoring of the process, and an explanation of how a competitive-strength
evaluation can be done, taking into account the decisive buying criteria (DBCs)
from customers with regard to rival face-brick manufacturers.
Chapter 3 contains the research methodology followed in this study. The
instrument used is based on the competitive-strength evaluation method
discussed in the previous chapter and will determine the importance of certain
DBCs which have been identified from a previous study. This will be
conducted with various groups or segments of customers, and the
competitiveness of rival face-brick manufacturers in relation to these DBCs will
be tested.
Chapter 4 contains the results of this study and includes the importance
ratings with regard to the identified DBCs from Distributors, Contractors and
Architects. These groups also rated the relevant rival face-brick manufacturers’
performance in relation to the DBCs. Positioning maps are included in the
chapter in order to visualise the results to the researcher, as well as the
reader. The propositions made in Chapter 3 are discussed, together with their
relevance.
Chapter 5 concludes this study with a discussion of the results, and
recommendations are made to Corobrik based on the findings.
11
CHAPTER 2
2. LITERATURE REVIEW 2.1 INTRODUCTION
Companies striving to be successful generally adopt four objectives, namely 1)
maximising revenue, 2) maximising profits, 3) maximising return on investment
and 4) minimising costs. Adopting these objectives is part of a process that
normally starts with a company formulating a mission statement, setting
corporate objectives, scanning the internal and external environment of the
company, deciding which products to deliver to which customers, delivering
the offering and monitoring the effectiveness of the delivery. This process
starts at the top of a company’s hierarchal structure and is filtered downward
to the rest of the company’s business units, including the marketing function.
Corporate planning is concerned with applying business planning to the
different units of the business. Marketing planning is part of the corporate
planning and is based primarily on factors such as markets, customers and
products/services, while business planning concerns other corporate
resources that will have an influence on the various markets.
The main focus of this literature study is on the marketing processes that are
aligned with the overall purpose of the research study, which is determining
ways of retaining valuable current customers and acquiring attractive new
customers for Corobrik.
A basic marketing process will be discussed, including related marketing
concepts. The process evolves from dividing the customers in groups or
segments based on various criteria, to understanding the requirements of the
customer, to defining marketing strategies to deliver the offering to the
customer, to a process of actually delivering the offering and, finally, how to
monitor the effectiveness of the delivery.
12
Market segmentation is discussed in slightly more detail to illustrate its
importance, as well as the complexity of the process. Consumer purchasing
behaviour, which is closely related to the segmentation process, is also dealt
with. This exercise is part of the marketing function and is done to gain better
insight with regard to customers. The concept of target marketing explains how
groups of people may be targeted i.t.o. a company’s marketing focus.
Positioning maps are used to visualise the perceptions of customers in relation
to the offering of a company, and can even be used to compare customers’
perceptions with regard to the performance of competitors. An overview is
given of the development of positioning and positioning maps and how these
maps can be applied. The importance of competitors is reflected in the
competitive-strength evaluation as well as the importance of the needs of the
customers.
The competitive-strength evaluation is the basis of the research-study
questionnaire and evaluation, and also forms part of the monitoring process of
the marketing function.
A brief discussion of the marketing planning process finalises the literature
study and provides a method of implementing marketing strategies and
converting them into objectives and action statements.
The literature study will show that all these concepts are interdependent, and
will emphasise the importance of understanding customers, competitors and
the capabilities of your own company.
2.2 MARKETING
Marketing can be described as a process for (McDonald & Dunbar, 2004:9):
Defining markets
Quantifying the needs of customer groups (segments) within these markets
Determining the value propositions to meet these needs
13
Communicating these value propositions to all in the organisation
responsible for delivering them, and obtaining their cooperation for the role
they have to play
Playing an important part in delivering these value propositions (usually
only communications).
Monitoring the value actually delivered
This definition of marketing can be regarded as a function for strategy
development, as well as tactical sales delivery. A map can be drawn to
visualise the above in order to clarify how marketing effectiveness can be
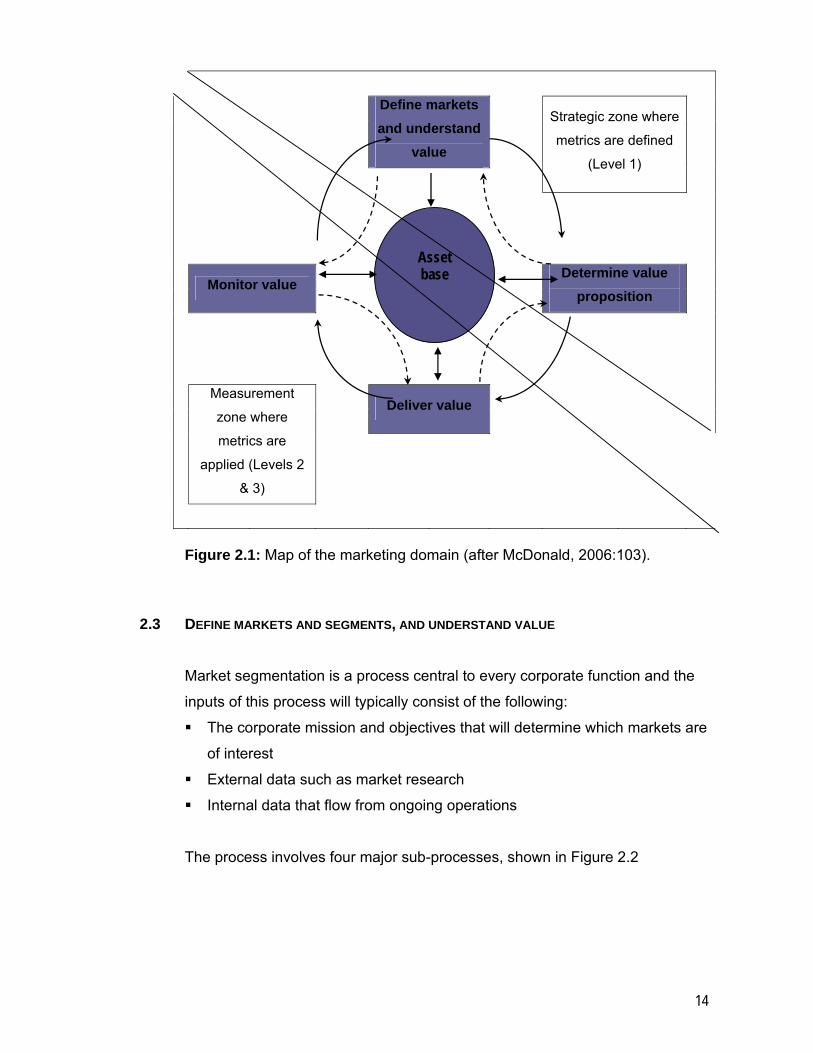
measured (see Figure 2.1, depicting the marketing domain). This is a cyclical
process, in that monitoring the value delivered will update the organisation’s
understanding of the value required by its customers. The cycle referred to
here could be an annual cycle, with a marketing plan documenting the output
from the ‘understand value’ and ’determine value proposition’ processes;
however, changes could occur during the 'marketing' year in response to
threats or even opportunities.
The first box ‘define markets and understand value’ refers to a company that
needs to define the markets it wants to operate in and divide this market into
segments of customers with fairly similar needs. Thereafter the company
needs to understand what value each of the customers in the relevant
segments is looking for. ‘Determine the value proposition’ refers to the
decision-making process, i.e. deciding what the offering to the customer will
be. The decision, therefore, is what value the customer will receive and what
value the company will receive in return. The process of delivering this value
proposition by either making a physical product or by delivering a service
relates to the box ‘deliver value’. The ‘monitor value’ box refers to measuring
the effect and the success of the product or service delivery against what was
planned. The various choices made during the marketing process are
constrained by the company’s asset base such as financial resources, human
resources, information-technology assets and physical assets. The ‘asset
base’ box refers to the company’s assets. Each box will be described in more
detail in the sections to follow.
14
Define markets and understand
value
Strategic zone where
metrics are defined
(Level 1)
Monitor value
Determine value proposition
Deliver value
Measurement
zone where
metrics are
applied (Levels 2
& 3)
Figure 2.1: Map of the marketing domain (after McDonald, 2006:103).
2.3 DEFINE MARKETS AND SEGMENTS, AND UNDERSTAND VALUE
Market segmentation is a process central to every corporate function and the
inputs of this process will typically consist of the following:
The corporate mission and objectives that will determine which markets are
of interest
External data such as market research
Internal data that flow from ongoing operations
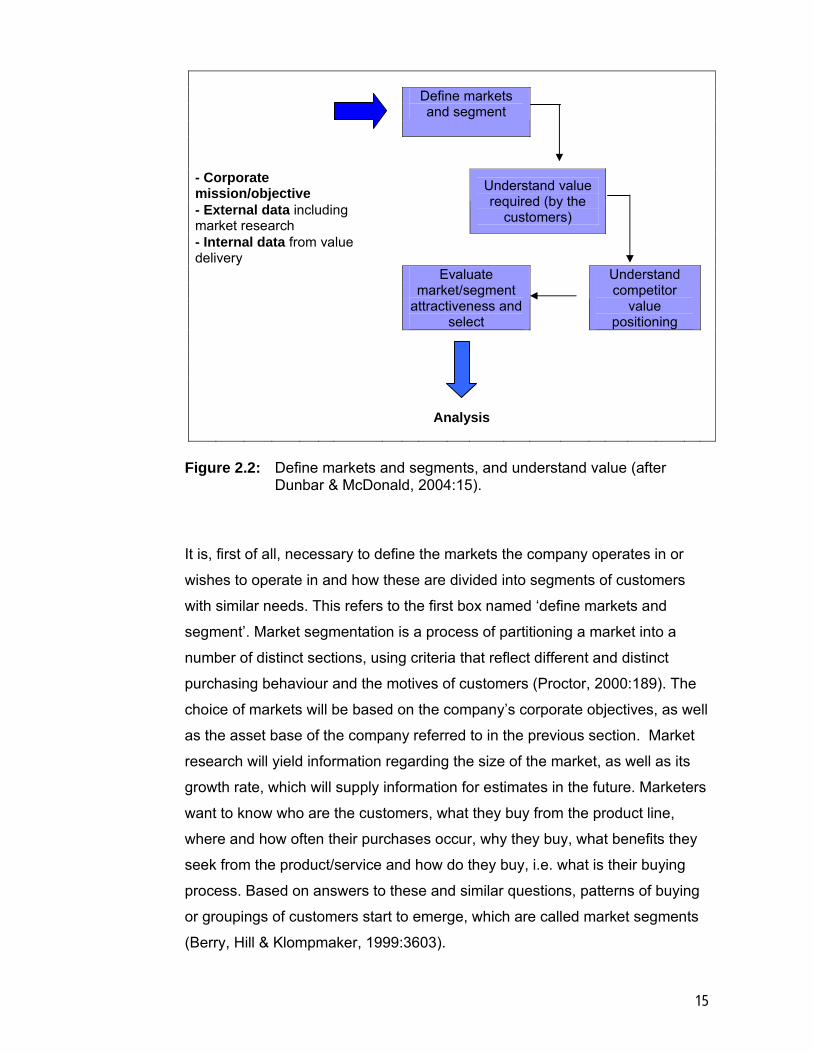
The process involves four major sub-processes, shown in Figure 2.2
Asset base
15
Define markets and segment
- Corporate mission/objective
- External data including market research
Understand value required (by the
customers)
- Internal data from value delivery
Evaluate market/segment
attractiveness and select
Understand competitor
value positioning
Analysis
Figure 2.2: Define markets and segments, and understand value (after Dunbar & McDonald, 2004:15).
It is, first of all, necessary to define the markets the company operates in or
wishes to operate in and how these are divided into segments of customers
with similar needs. This refers to the first box named ‘define markets and
segment’. Market segmentation is a process of partitioning a market into a
number of distinct sections, using criteria that reflect different and distinct
purchasing behaviour and the motives of customers (Proctor, 2000:189). The
choice of markets will be based on the company’s corporate objectives, as well
as the asset base of the company referred to in the previous section. Market
research will yield information regarding the size of the market, as well as its
growth rate, which will supply information for estimates in the future. Marketers
want to know who are the customers, what they buy from the product line,
where and how often their purchases occur, why they buy, what benefits they
seek from the product/service and how do they buy, i.e. what is their buying
process. Based on answers to these and similar questions, patterns of buying
or groupings of customers start to emerge, which are called market segments
(Berry, Hill & Klompmaker, 1999:3603).
16
The next step in the process, as described in Figure 2.2, is to ‘understand
value required by the customers’. Analysing and understanding customers is a
very important factor in the marketing function. The value the customers are
looking for can be considered as benefits gained from products or services,
but can also include related services such as maintenance or information. This
step also includes what a customer is prepared to give in exchange in terms of
price or even loyalty. This step also includes the determination or prediction of
what the future requirement of customers will be. Over time, customer
requirements may change because of external factors such as technology,
economical and political changes. ‘Understand competitor value proposition’
refers to how well the company and the opposition are delivering the value that
the customers are looking for. This process entails analysing how the
competitor/s might improve, determining their strengths and weaknesses, and
assessing the own company’s capabilities in order to plan better delivery of the
required value, with the ultimate aim of outperforming the opposition. Once the
market has been defined and segmented, the value required by the customers
and the competitor value positioning is understood, the relative attractiveness
of the different markets and, within each of the markets, the segments can be
evaluated. This evaluation relates to the last sub-process, referred to as
‘evaluate market/segment attractiveness and select’. For example, Porter’s
five-forces model (Porter, 1985) can be used to evaluate the forces shaping
the competitive landscape, together with a SWOT analysis to determine
internal strengths and weaknesses and external threats and opportunities in
the market. The attractiveness of a given market or segment can then be
estimated. The output of this process will be an analysis in the form of a
portfolio matrix, where all key information is summed up. This information will
enable a company to prioritise amongst many possible product/segment
combinations. Before the next phase of the process is discussed, the concept
of segmentation will be explained to illustrate its importance and complexity.
2.3.1 Segmentation as part of marketing strategy
Berry, Hill & Klompmaker (1999:3603) have a similar view of the development
of a marketing strategy, and emphasise the central role of market
17
segmentation. First of all, it is important to understand the customers in order
to know what they want from a product line, when they buy, how often these
purchases occur, what benefits they seek, what their buying process is and
where they would prefer to buy. By analysing these data, patterns of buying or
groupings of customers will become clear and these are called market
segments. An essential element in market segmentation is assigning
customers exhibiting similar buying behaviour to the same segments
(customers across segments will not exhibit the same buying behaviour). The
goal of all marketing strategies is to influence buying behaviour in a way that
will benefit the firm selling the product, while meeting the demands of
customers. By working with customers with similar buying behaviours,
marketers can develop a strategy for that market segment which is specific to
that segment. Similarly, specific, unique strategies for other segments can be
developed and this is known as target marketing. The above emphasises the
fact that a marketing strategy has to start with understanding the customers
and grouping them into segments based on this understanding.
While acknowledging that customer differences are key, recognising that rival
companies are following the same strategies would eliminate narrow-minded
strategies which fail to recognise the key role played by competitors (Berry, Hill
& Klompmaker, 1999:3603). Competitors in the market all possess unique
capabilities and they are constantly trying to outdo their opposition in meeting
the needs of the customers. It is essential to have knowledge of the
opposition; a competitor analysis could reveal how strong the rivalry is in the
relevant industry, what is the potential for new entrants/competitors in the
industry, what possible substitute products are available, what competitive
strengths the opposition has, etc. Recognising, acknowledging and specifying
these differences are the arena of product differentiation, i.e. the marketer
objectively acknowledges a company’s strengths and weaknesses and where
various competitors might be stronger or weaker. Product differentiation is an
attempt to provide a product or service to a group of customers in a unique
way that no competitor is doing or is capable of doing. The own company’s
capabilities in terms of core competencies and resources also form part of the
analysis, eventually enabling the marketer to make decisions regarding which
markets to serve with which products/services and what strategy to follow.
18
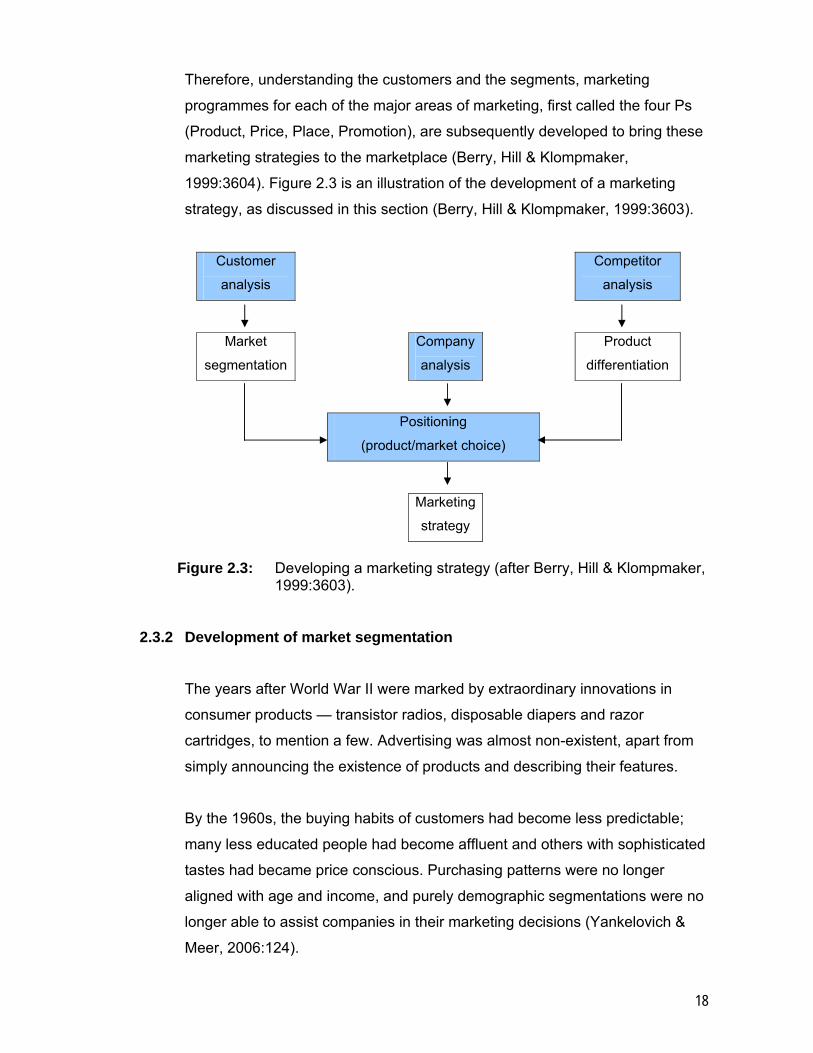
Therefore, understanding the customers and the segments, marketing
programmes for each of the major areas of marketing, first called the four Ps
(Product, Price, Place, Promotion), are subsequently developed to bring these
marketing strategies to the marketplace (Berry, Hill & Klompmaker,
1999:3604). Figure 2.3 is an illustration of the development of a marketing
strategy, as discussed in this section (Berry, Hill & Klompmaker, 1999:3603).
Customer
analysis Competitor
analysis
Market
segmentation
Company
analysis
Product
differentiation
Positioning
(product/market choice)
Marketing
strategy
Figure 2.3: Developing a marketing strategy (after Berry, Hill & Klompmaker,
1999:3603). 2.3.2 Development of market segmentation
The years after World War II were marked by extraordinary innovations in
consumer products — transistor radios, disposable diapers and razor
cartridges, to mention a few. Advertising was almost non-existent, apart from
simply announcing the existence of products and describing their features.
By the 1960s, the buying habits of customers had become less predictable;
many less educated people had become affluent and others with sophisticated
tastes had became price conscious. Purchasing patterns were no longer
aligned with age and income, and purely demographic segmentations were no
longer able to assist companies in their marketing decisions (Yankelovich &
Meer, 2006:124).
19
During the 1970s, the focus of creative departments gradually moved from the
product to the consumer in an attempt to revive the advertising effort. Using a
person in the advertisement, with which particular groups of consumers could
identify, was one effective marketing strategy companies discovered. Since
then, various methods have been developed in an attempt to segment
markets; for example, social scientists/psychologists began using personality
tests and, with the aid of these results, market segments, based on people’s
shared worldviews, were created. The Stanford Research Institute launched
the Values and Lifestyles (VALS) programme that classified individuals
according to nine enduring psychological types (Yankelovich & Meer,
2006:125). VALS and similar models soon turned psychographics into the
most accepted mode of market segmentation. The South African Advertising
Research Foundation (SAARF) developed an index, using a combination of
variables for market-segmentation purposes. This index is called the Living
Standards Measure (LSM) and has become the most widely used marketing
research tool in southern Africa. LSM divides the population into ten LSM
groups, with ten being the highest and one the lowest. The LSM index has
used various types and quantities of variables over the years, with the latest
version, 2004, comprising 29 characteristics or variables (South African
Advertising Research Foundation, 2006:6).
The above gives an indication of how market segmentation has evolved over
the years and the way in which market segmentation can be approached.
Market segmentation is still widely used, but there are doubts regarding the
effectiveness of the process. In 2004, Markon Associates and The Economist
Intelligence Unit surveyed 200 senior executives of large companies, with 59
per cent reporting that they had conducted a major segmentation exercise
during the previous two years. Interestingly enough, only 14 % of them
reported that they had derived real value from the exercise (Yankelovich &
Meer, 2006:126).
If meaningful segmentation depends on finding patterns in customers’ actual
buying behaviour, then to construct segmentation properly, the relevant data
must be gathered, for example information regarding the benefits and features
20
that customers seek. In addition, which customers are willing to pay higher
prices or demand lower ones must be known. It is also important to know the
relative advantages or disadvantages current products or services have to
offer, and data on emerging social, economic and technological trends that
may change purchasing behaviour are also required.
It is of the utmost importance that companies capture this information
routinely, and qualitative research could be employed to explore motives and
needs for current purchases and to understand competitive strengths and
weaknesses. Armed with all these data, segments that are revealing and
applicable can be fashioned. Such segments will:
Reflect the company’s strategy
Indicate where sources of revenue or profit lie
Identify customers’ values, attitudes and beliefs in relation to products or
services
Focus on actual customer behaviour
Make sense to top executives
Accommodate or anticipate changes in markets or consumer behaviour
(Yankelovich & Meer, 2006:126)
According to Proctor (2000:191) information that is vital to the marketer
includes identifying the needs of each segment, what the segment can afford,
its loyalty to a particular competitor and its response to an offer. Careful
segmentation and accurate targeting keep a company close to the market,
reduce waste, uncover the best customers and assist in keeping them
satisfied.
2.3.3 Segmenting criteria
Consumer markets can be segmented by using different variables such as
(Proctor, 2000:191):
Geographic segments, including location such as streets, towns, regions,
and countries, trading blocks such as the European Union, and continents.
21
Demographic segments, including social statistics such as age, family, sex,
life cycle, occupation type and group income level.
Geodemographic segments — a mixture of geographic and demographic
information to categorise house types and locations, such as people who
live in separate houses in exclusive suburbs.
Psychographic segments — segmentation is done according to
psychological profiles of people i.t.o. their personalities, attitudes and life-
style, such as energetic ‘go-getters’.
Behavioural segments, dealing with behaviour patterns such as usage and
uses (e.g. heavy or light users), the manner in which a product or service is
used (e.g. benefits enjoyed).
Geographic segmentation assumes that the market is large enough to
generate a volume of sales and profits. The disadvantage is that a variety of
consumers with different lifestyles may be located in one particular area and
offerings to certain consumers may be irrelevant.
Demographic segmentation tries to group people of certain demographic
characteristics together and assumes that these groups have more or less the
same needs or lifestyle; however, the segment may not be large enough in a
certain geographical area and the communications may not be easily directed
at them. On the other hand, if a combination of demographic information is
utilised, a better understanding of the target segment may be obtained.
Geodemographics attempts to combine as many segmentation criteria as
possible from available demographic and geographic data. This method
should give a better understanding of the specific groups and, as more than
one variable, based on the characteristics and behaviour of the segments, is
used, the communication of the offering can be tailored for that specific group.
There is, however, no information regarding the needs of or the benefits
sought by the customer and certain customers, having the same needs, may
be excluded owing to the above-mentioned criteria.
Psychographics groups people who have similar lifestyles and attitudes
together, enabling marketers to group large numbers of people together in

22
order to generate volumes of sales for particular products or services. The
disadvantage of this segmenting criterion is that attitudes and lifestyles may
change quickly, for example because of technological and economic changes.
Behavioural segments concentrate on the needs and benefits enjoyed by
customers and this technique to derive at an effective marketing strategy is
more pragmatic than other approaches. Needs-based or benefits-based
segmentation has become the preferred technique for successful product
positioning, new product introduction, pricing, advertising and distribution
(Proctor 2000:190).
Proctor (2000:191) explains that markets can be segmented based on the
needs sought and benefits enjoyed; this would include people from different
segments buying the same product for a different reason, for example some
people use shampoo for clean hair, others for damaged hair, and some people
buy it for both reasons. More than one variable can be used for market
segmentation, the more variables there are the more focussed and tighter the
target market. It must also be noted that the more variables are used, the more
complex the process becomes.
The link between attributes, benefits and values could be a basis for market
segmentation and conjoint segmentation uses the importance of attributes as
a basis for segmentation. Other approaches such as the Stanford VALS
(Values And Life Styles) approach uses values as a basis of segmentation.
Market segmentation based on means-end chains has a distinct advantage
because it combines the strengths of product-specific (e.g., attribute-based
segmentation) and consumer-specific (e.g., values-based) bases of
segmentation by linking attributes, benefits, and values at the segment level
(Vriens & Hofstede, 2000:8).
According to Greengrove (2002:410), segmentation is the view that not all
customers are the same, therefore the markets consist of a number of
‘segments’, each segment consisting of ‘homogeneous’ customers.
Greengrove (2002:410) identifies two main segmentation approaches, namely:
23
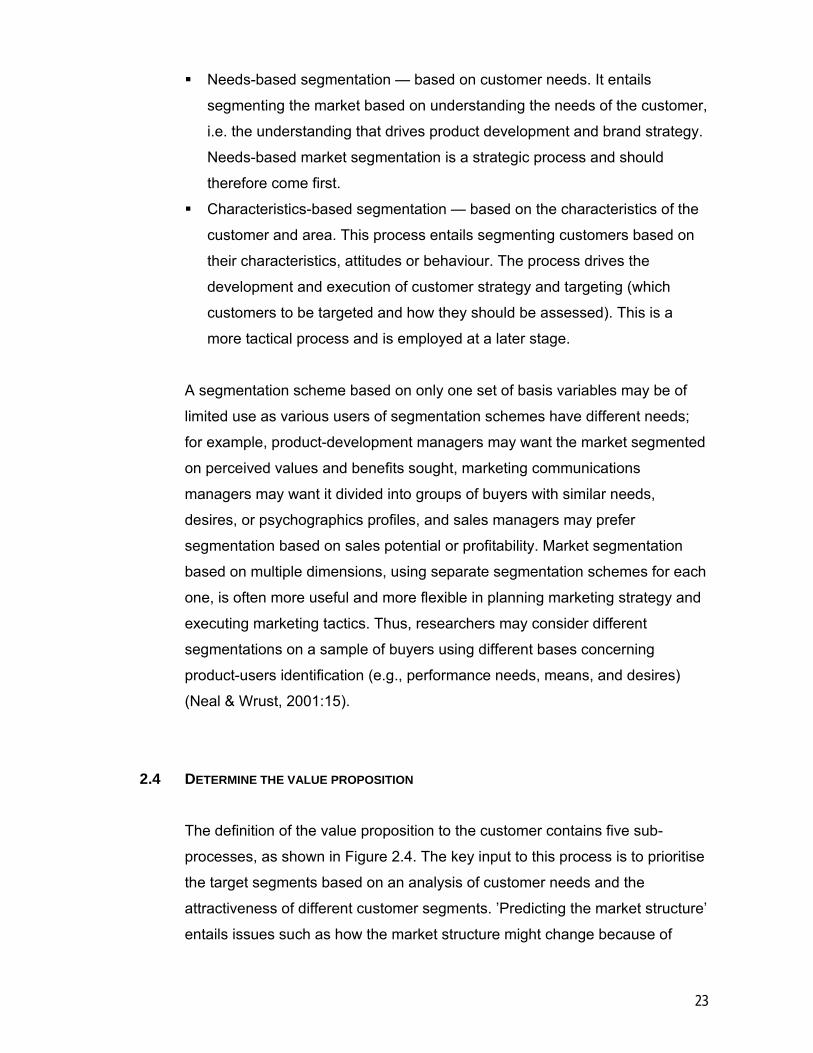
Needs-based segmentation — based on customer needs. It entails
segmenting the market based on understanding the needs of the customer,
i.e. the understanding that drives product development and brand strategy.
Needs-based market segmentation is a strategic process and should
therefore come first.
Characteristics-based segmentation — based on the characteristics of the
customer and area. This process entails segmenting customers based on
their characteristics, attitudes or behaviour. The process drives the
development and execution of customer strategy and targeting (which
customers to be targeted and how they should be assessed). This is a
more tactical process and is employed at a later stage.
A segmentation scheme based on only one set of basis variables may be of
limited use as various users of segmentation schemes have different needs;
for example, product-development managers may want the market segmented
on perceived values and benefits sought, marketing communications
managers may want it divided into groups of buyers with similar needs,
desires, or psychographics profiles, and sales managers may prefer
segmentation based on sales potential or profitability. Market segmentation
based on multiple dimensions, using separate segmentation schemes for each
one, is often more useful and more flexible in planning marketing strategy and
executing marketing tactics. Thus, researchers may consider different
segmentations on a sample of buyers using different bases concerning
product-users identification (e.g., performance needs, means, and desires)
(Neal & Wrust, 2001:15).
2.4 DETERMINE THE VALUE PROPOSITION
The definition of the value proposition to the customer contains five sub-
processes, as shown in Figure 2.4. The key input to this process is to prioritise
the target segments based on an analysis of customer needs and the
attractiveness of different customer segments. ’Predicting the market structure’
entails issues such as how the market structure might change because of
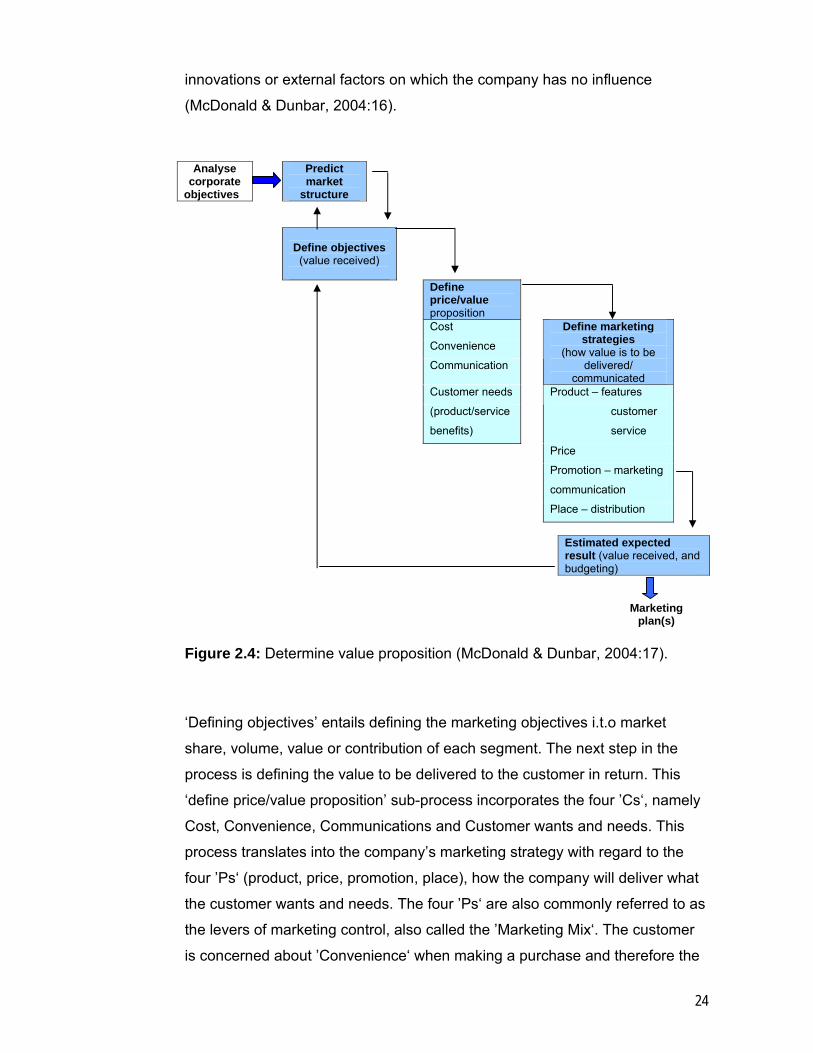
24
innovations or external factors on which the company has no influence
(McDonald & Dunbar, 2004:16).
Analyse corporate
objectives
Predict market
structure
Define objectives (value received)
Define price/value proposition
Cost
Convenience
Communication
Define marketing strategies
(how value is to be delivered/
communicated
Customer needs
(product/service
benefits)
Product – features
customer
service
Price
Promotion – marketing
communication
Place – distribution
Estimated expected
result (value received, and budgeting)
Marketing plan(s)
Figure 2.4: Determine value proposition (McDonald & Dunbar, 2004:17).
‘Defining objectives’ entails defining the marketing objectives i.t.o market
share, volume, value or contribution of each segment. The next step in the
process is defining the value to be delivered to the customer in return. This
‘define price/value proposition’ sub-process incorporates the four ’Cs‘, namely
Cost, Convenience, Communications and Customer wants and needs. This
process translates into the company’s marketing strategy with regard to the
four ’Ps‘ (product, price, promotion, place), how the company will deliver what
the customer wants and needs. The four ’Ps‘ are also commonly referred to as
the levers of marketing control, also called the ’Marketing Mix‘. The customer
is concerned about ’Convenience‘ when making a purchase and therefore the
25
company needs to have a corresponding strategy to identify the ’Place‘ where
it is going to distribute the product. The same applies to customer wants and
needs that are met by the ’Product', thus ’defining market strategies‘ is a
process of establishing how the value to the customer is to be delivered and
communicated in order to satisfy the client in the way that he/she seeks.
Separate strategies relating to the four ’Ps‘ may be produced, but are
interlinked so that the choice of distribution channel may impact on the
communications plan, as well as the price that can be charged. People and
processes within the company need to be planned for and are dimensions that
can be changed in order to achieve the desired offering to the customer with
regard to the product, price, place and/or promotion.
Once these issues have been resolved, an estimate of the expected results of
the various possible marketing strategies can be made with regard to the cost
to the company and the impact of the price/value proposition. It is important to
consider, once again, the original objectives set in the earlier stages of the
process in order to determine if the strategies will actually deliver the desired
results. McDonald & Dunbar (2004:18) explain that the logical output of the
‘determine the value proposition’ process is typically a strategic marketing plan
that should cover a period of at least three years. As stated earlier, in some
cases companies develop specific plans such as a pricing plan, distribution
plan or customer promotions plan. It is extremely important that the contents of
these plans are communicated to and agreed upon by all the departments and
functions responsible for delivering the stipulated customer value.
2.4.1 Market targeting
A target market can be defined as the market or market segments which form
the focus of the firm’s marketing efforts (Proctor, 2000:196). Before the
process of ‘determining the value proposition’ can begin, market segments
need to be identified and then a decision needs to be made as to which
customer groups to target and how many groups to target. Once the target
segments or groups are identified, the delivery of the offering may begin
26
(discussed in the next section). Proctor (2000:196) proposes various options of
strategies and factors influencing the targeting strategy, including:
Mass-marketing strategy: This strategy offers one product or service
concept to most of the market across many market segments. Economies
of scale can be achieved, but there is the risk of a few customers being
dissatisfied. This approach is also referred to as an undifferentiated
approach or marketing, and the assumption is that all customers have the
same wants and needs. The marketing mix (four ’Ps’) will be in a
standardised format and will have a standard product, similar price level,
one method of distribution and a promotional mix that is directed at
everyone.
There are probably only two conditions under which a mass-marketing
approach is the most appropriate. The first condition reflects the low
amount of variation in the needs of consumers for a given product or
service. This situation is becoming increasingly rare, as individuals and
companies nowadays have a wide variety of characteristics, wants, needs
and interests. The second condition reflects the ability of a company to
develop and sustain a single marketing mix that satisfies all.
Single-segment strategy: This strategy is relatively cheap in terms of
resources and concentrates on a single segment with a product/service
concept. The risk with this strategy is that if that particular segment fails,
the company’s financial strength will decline rapidly. There is also a
problem with regard to flexibility in changing the product’s market posture.
High-quality image companies find it difficult to move into product market
segments that have a lower-quality image. Rolex, for example, would find it
difficult to manufacture and market cheap watches in a competitive way.
Mercedes Benz would have the same problem; however to move slightly
’down-market‘ would not be impossible as long as the product and the
perceived value (including the price) is not too far removed from the main
brand. It must be noted that a single-segment strategy permits a company
to specialise and enables the company to put all its effort into satisfying the
27
needs of a particular market segment, thereby achieving economies of
scale.
Multi-segment strategy: This strategy refers to targeting a different product
or service at a number of segments and developing a marketing-mix
strategy for each of the segments. This approach does spread the risk by
committing to a number of segments simultaneously, but it is also a
resource-demanding option.
Various factors influence the choice of the company’s targeting strategy,
depending on a wide range of market, product and competitive factors. These
factors are:
Stage of product-market maturity: At the introductory stage of a product’s
life cycle, there are few, if any, competitors. However, competition may
occur between alternative product types. Target-segmentation strategies
are most critical during the mature stage of the product market, because of
the differing needs of buyers. The competition increases as the lifecycle
approaches maturity and, therefore, targeting decisions are influenced and
strategies shaped accordingly.
Extent of buyer differentiation: When buyer wants are similar throughout
the product market, there is less opportunity for extensive segmentation
than in markets with buyers with different wants. The more complex the
product market is with respect to competing companies, variety in product
market offerings, and variations in user needs and wants, the more likely it
is that a useful method of segmentation can be found.
Market position: Companies with low market share have to compete in
segments where their strengths are most highly valued and where large
competitors are unlikely to compete. The strength may be in the range of
products produced, the cost and speed of distribution or the credit and
service arrangements. These companies typically have to put considerably
more effort into identifying unique segments than into serving the entire
industry.
Structure and intensity of competition: When many companies compete in
an industry, selective targeting is often an appropriate target-market
strategy. Large companies may be able to reap the benefits of using a
multiple-segmentation strategy.
28
Adequate resources: Possession of substantial resources often places a
company in a strong position to consider various target-market alternatives;
however, a single-segment strategy is the only option when resources are
limited. Having the expertise to analyse the market capability and ample
resources will put a company in a position to choose target markets that
will yield profitable returns.
Production and marketing-scale economics: The choice of target-market
strategy may be influenced by production and marketing-scale economics.
The production process may need large-scale output to achieve the
necessary cost advantages. An extensive market-coverage strategy may
also be required in order to gain the sales volume to support large-volume
production and distribution.
According to Proctor (2000:199) five factors govern the attractiveness of a
segment; these include segment size, segment growth, profitability of the
segment, current and potential competition and capabilities of the business.
Although a large, lucrative and expanding market segment may seem
appealing, it will definitely attract other competitors. Therefore, a company
must have the capabilities, as well as the resources to compete in such a
market segment. The same principle applies to segments that are
contracting, making it less competitive because of the withdrawal of
competitors, thereby making the segment more attractive to companies
with fewer capabilities.
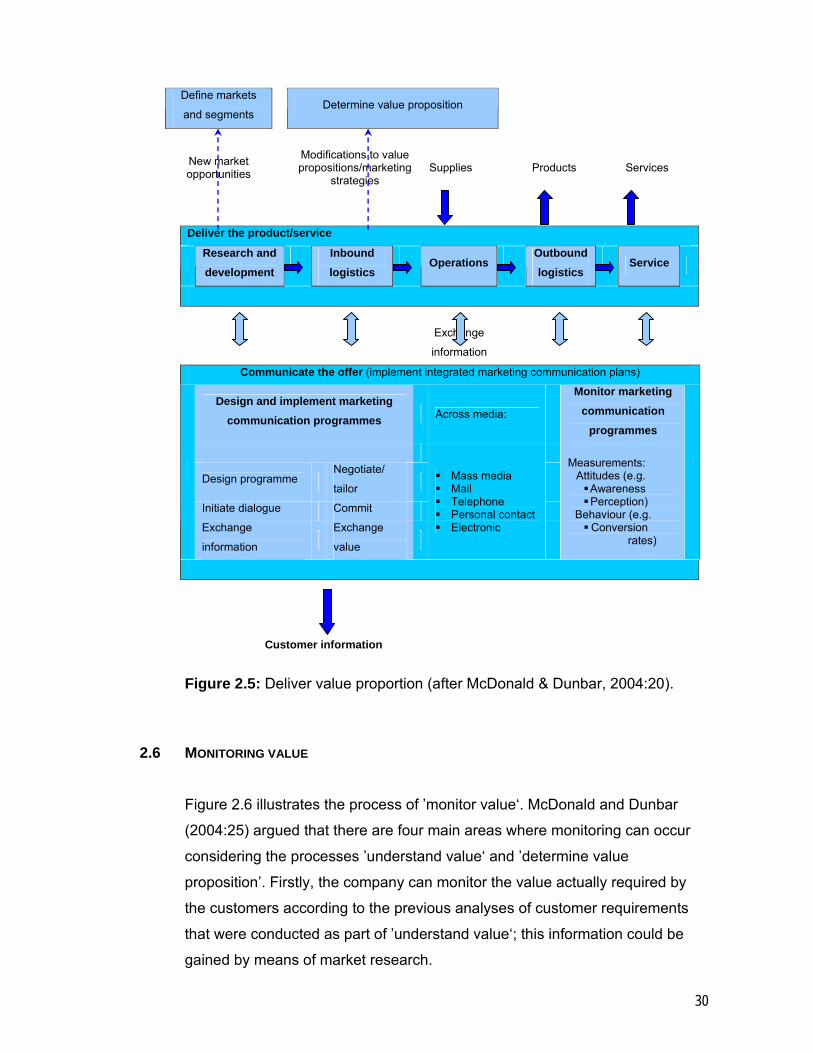
2.5 DELIVERING THE VALUE PROPOSITION
The third major process in the marketing domain is to deliver the value
proposition. The major input in this process is the strategic marketing plans
developed during the previous process. Porter’s value chain (Porter, 1980) is
the point of departure of this process. The process of delivering the value
proposition is presented in Figure 2.5. The tasks in the value chain include
research and development, inbound logistics, operations, outbound logistics,
leading to service, and are contained in the ’deliver the product/service‘ box.
29
However, there are a number of marketing activities, which coincide with the
value-chain activities, for example, evaluating a product with customers at the
research and development stage. The customer may want the product
modified, resulting in different components being added, assembled and
delivered. This represents a process of information exchange between the
marketing and value-chain activities. ’Communicate the offer‘ represents the
marketing activities and is typically managed by designing, implementing and
monitoring a number of marketing communication programmes.
Examples of such programmes are direct-mail campaigns, a series of sales
seminars, in-store promotions, etc. Other examples are depicted in the
’communicate the offer‘ box. The concept ‘marketing communication
programmes’, according to McDonald and Dunbar (2004:20), also includes
strategies such as the management of the sales force by means of set targets.
These programmes will need monitoring; there is a difference in the monitoring
of the effectiveness of particular programmes such as the response rates to a
direct-mail campaign or awareness and attitudes arising from advertising
compared with the overall value delivered to the customer. The latter forms
part of the last process of the marketing domain.
Products and services are outputs from the value chain that was mentioned
earlier. One of the most important outputs from the communications sub-
processes is customer information. This entails what the customer issues are
and the particular needs that arise from this, what products and services are
purchased/used, what is the nature of any complaints, etc.
30
Define markets
and segments Determine value proposition
New market opportunities
Modifications to value propositions/marketing
strategies Supplies Products Services
Deliver the product/service
Research and development
Inbound logistics
Operations
Outbound logistics
Service
Exchange
information
Communicate the offer (implement integrated marketing communication plans)
Design and implement marketing
communication programmes Across media:
Monitor marketing communication
programmes
Design programme Negotiate/
tailor
Initiate dialogue Commit
Exchange
information
Exchange
value
Mass media Mail Telephone Personal contact Electronic
Measurements: Attitudes (e.g.
Awareness Perception)
Behaviour (e.g. Conversion
rates)
Customer information
Figure 2.5: Deliver value proportion (after McDonald & Dunbar, 2004:20).
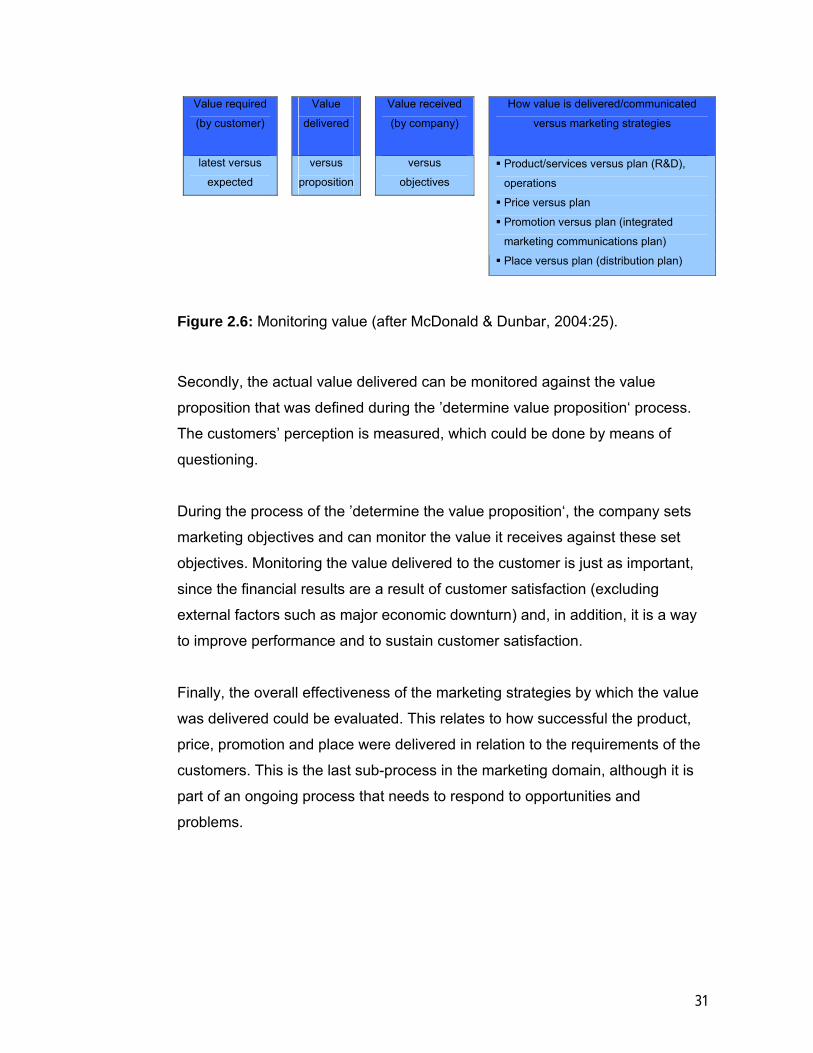
2.6 MONITORING VALUE
Figure 2.6 illustrates the process of ’monitor value‘. McDonald and Dunbar
(2004:25) argued that there are four main areas where monitoring can occur
considering the processes ’understand value‘ and ’determine value
proposition’. Firstly, the company can monitor the value actually required by
the customers according to the previous analyses of customer requirements
that were conducted as part of ’understand value‘; this information could be
gained by means of market research.
31
Value required
(by customer)
Value
delivered
Value received
(by company)
How value is delivered/communicated
versus marketing strategies
latest versus
expected
versus
proposition
versus
objectives
Product/services versus plan (R&D),
operations
Price versus plan
Promotion versus plan (integrated
marketing communications plan)
Place versus plan (distribution plan)
Figure 2.6: Monitoring value (after McDonald & Dunbar, 2004:25).
Secondly, the actual value delivered can be monitored against the value
proposition that was defined during the ’determine value proposition‘ process.
The customers’ perception is measured, which could be done by means of
questioning.
During the process of the ’determine the value proposition‘, the company sets
marketing objectives and can monitor the value it receives against these set
objectives. Monitoring the value delivered to the customer is just as important,
since the financial results are a result of customer satisfaction (excluding
external factors such as major economic downturn) and, in addition, it is a way
to improve performance and to sustain customer satisfaction.
Finally, the overall effectiveness of the marketing strategies by which the value
was delivered could be evaluated. This relates to how successful the product,
price, promotion and place were delivered in relation to the requirements of the
customers. This is the last sub-process in the marketing domain, although it is
part of an ongoing process that needs to respond to opportunities and
problems.
32
2.7 CONSUMER PREFERENCES
Consumer preferences, or consumer purchase behaviour, are associated with
the segmentation process and the process of understanding the customer.
Various studies have been conducted in this field and a number of these will
be discussed in this section in order to illustrate the diversity and complexity of
this field.
In a recent study by Friese, Wänke & Plessner (2006:1) it was found that the
participants in the study whose explicit and implicit preferences regarding
generic food products and well-known food brands were incongruent, were
more likely to choose the implicitly preferred brand over the explicitly preferred
one when choices were made under time pressure; the opposite being true
when there was more than enough time to make a decision. This study was
based on the assumption that people may have two different attitudes toward
an object at the same. These attitudes refer to, firstly, an explicit attitude that
corresponds with deliberative behaviour, and, secondly, refers to an implicit
attitude that corresponds with spontaneous behaviour.
Friese, Wänke & Plessner (2006:2) explained that the expression of explicit
attitudes refers to the construct, which social psychologists commonly try to
assess by means of questionnaires or interviews. In contrast, individuals may
not be aware of implicit attitudes or they may be unable to verbalise them.
However, the study has shown that implicit attitudes may influence information
processing and impulsive behaviour and, therefore, will have an influence on
consumer purchase behaviour.
Draganska & Jain (2005) studied consumers’ preferences for product
attributes in the yogurt industry. In this industry, manufacturers produce
several product lines that differ in quality (as measured by fat/sugar content)
and price; these products are vertically differentiated. In addition, there is a
horizontal differentiation, the assortment of flavours for each product line. The
empirical analyses of the study revealed that consumers valued the line
attributes more than they did the flavour attributes. It was also established that
the value of a product line is not merely a function of the number of flavours it
33
includes. The calculated values of the model used for the study indicated that
more flavours do not always result in increased utility for consumers and,
therefore, do not necessarily mean increased market share. The model used
was fairly detailed and tailored to the specifics of the yogurt industry
(Draganska & Jain, 2005:173). For this reason, a number of issues need to be
considered when the model is applied to support managerial decisions in other
product categories. Although the details of the model will not be discussed in
this study, it may have some relevance to the brick industry. Bricks differ in
quality based on squareness and size conformity as well as price and could
therefore be vertically differentiated. Within each product line some horizontal
differentiation does exist because of variants of the main product line being
manufactured and sold as variations or ’unique‘ products. A study could be
done to determine if the expansion of horizontal differentiation contributes to
the increase of market share in the brick industry and the findings could be
compared to those of the above study.
The above-mentioned study does provide some insight regarding the
implications of consumer preferences for companies’ product-line pricing
strategies. The proposed modelling approach could also be utilised to capture
the realities and characteristics of specific industries.
Products sold in industrial markets are often quite different from those sold in
consumer markets. Industrial products tend to have some of the following
characteristics:
More complex, unique and technical in nature
Often purchased on the basis of specification
There is often a choice of producing or buying products
Seldom sold in the final market (e.g. raw materials/components)
More protective packaging, which is informative and less persuasive in
nature
Emphasis on timely delivery, essential to avoiding production delays for
buyers
Emphasis on pre-selling and post-sale technical assistance and servicing
(Lichtenthal & Goodwin, 2006: 230)
34
Lichtenthal & Goodwin (2006:231) proposed that industrial products and
services can generally be divided into three broad categories, namely:
Entering goods
Foundation goods
Facilitating goods
In addition, they proposed that each one of these product categories is linked
to a product-related attribute framework. For each type of product, this
framework portrays the likelihood that the buyer would use each product-
related attribute category as the primary source for his determinant attributes.
For example, a business buyer of raw materials would typically view this type
of offering because of its basic nature in terms of physical characteristics (e.g.
temperature, colour intensity) and pseudo-physical characteristics (objective
characteristics, but not as measurable as physical characteristics, e.g.
shininess and smoothness). The likelihood of the buyer categorising them as
beneficial (e.g. durable, convenient or safe) will be little and even less as
imagery (e.g. phrases such as “gives high-tech appearance” or “the choice of
professionals”). In general, entering goods such as raw materials and
component parts are purchased and used to build a final product; for this
reason, their physical attributes are of concern. At the other extreme, a
business buyer of consumable supplies would view such products or offerings
in terms of their benefits as the most important attribute.
Understanding consumer preferences is an integral part of understanding the
needs and wants of customers. Various studies have been done on consumer
preferences and purchase behaviour in order to better understand the needs
of the customer. These analyses can also be used to segment the market,
which makes it easier for the company to target a specific market by using the
best possible marketing strategy.
2.8 POSITIONING
This section will illustrate how positioning fits in with a company’s marketing
strategy, the approaches of positioning, the use of positioning maps and how
positioning can be used to achieve marketing objectives.
35
Positioning refers to how customers think about proposed and/or present
brands in the market (Gwin & Gwin, 2003:30). Brand positioning enables a
company to build a sustainable competitive advantage on product attributes,
whether tangible or intangible, in the mind of the consumer. Therefore,
consumer purchase behaviour analysis and segmentation analysis supply
information to the marketer to understand the market and, consequently, to
position the product or service accordingly.
To effectively position a brand, a company must know how this brand is
perceived in relation to other brands in the product category. Several tools are
available for evaluating a brand’s positioning. Multi-attribute compositional
models are the most widely used, with multi-dimensional scaling, factor
analyses and discriminant analyses also being used. Gwin & Gwin (2003:30)
indicated that the purpose of positioning is to evaluate whether:
The brand has a positioning that is differentiated from other brands in the
market
Potential opportunities exist for the introduction of new products, or
repositioning of an existing brand
Certain segments are underserved by existing brands in the category
The positioning is critical to a new product. This new product needs to deliver
the benefits that the customer needs, but it must do so better than the
opposition or competition. Gwin & Gwin (2003:31) proposed that in developing
a positioning the marketer must consider four things:
The target market
How the product is different or better than that of the competitors
The value of this difference to the target market
The ability to demonstrate or communicate this difference to the target
market
The target market and the perceived differentiation from competitors are core
concepts of positioning. Segmentation and positioning, according to Gwin &
Gwin (2003:31), are too often treated as independent concepts in practice and
in literature. The value of positioning is almost non-existent unless it is
36
appropriate to a target segment. Differentiation for new and established
products typically takes the form of attributes that can be built into the product
design to deliver benefits to the customers. This differentiation can be in
quality, additional features, packaging innovation and accessibility, to name
just a few. A company may have a cost advantage in comparison with its
competitors and the product could be positioned to offer value by means of a
lower price.
It is important for brand positioning to be monitored and for the marketing
section of a company to consider repositioning once the effectiveness of the
positioning has decreased.
Positioning and targeting strategies are interrelated, according to Proctor
(2000:199). The choice of one or more target markets is based on the
feasibility of the company designing and implementing an effective positioning
strategy to meet the target market’s needs. Positioning is achieved through the
use of marketing-mix variables; for example, a company may have a unique
combination of product offering, distribution approach, price, advertising and
personal selling to serve each segment. Some marketing-mix components
may look different or be the same for different segments. Proctor (2000:199)
explained the way in which the marketers of a product or service position
themselves in the minds of the users, and differentiate one product or service
from another. Market positioning refers to the arrangement for a product or
service to occupy a clear, distinct and desirable place — relative to competing
products — in the minds of target customers. Thus, what is being marketed
must be perceived by the selected customers to have a distinct image (relative
to the competitors’ products), which meets the desires or expectations of
customers. The positioning of an offering is related to the attributes ascribed to
it by customers; examples include quality, strengths and weaknesses, price
and the value it represents to users. The marketing mix is important in
developing an effective positioning, since the offering must be in line with the
target customers’ needs and expectations.
There are various positioning strategies or options for companies entering a
market:
37
Position close to the leader as an acceptable alternative
Position away from existing rivals in either un-served niches or innovative
new positions
For an existing market brand leader a sensible positioning includes an
intense promotion campaign of existing superiority, and/or augmenting
present superiorities with extra layers of differential advantages
For the badly positioned companies, the options include adapting the
offering to fit in more closely with the needs of the customers or,
alternatively, finding new positioning. Another option is to try to alter the
perception of the customer, while withdrawing from the market is also an
option (Ruskin-Brown, 1999:99).
2.8.1 Approaches to positioning research
Proctor (2000:201), discussed two approaches regarding positioning research.
Qualitative research can be applied by means of using protective techniques
whereby images can be uncovered that serve to show how the particular
brand of a firm is positioned in the mind of the respondent. Quantitative
approaches, on the other hand, focus on considering positioning relative to the
positioning of major competitors and relative to the desires, wants and needs
of the target customers. One of the most common ways of collecting
quantitative positioning data is through the use of attitude or attribute scaling.
The dimensions that the respondent uses to differentiate and choose between
alternative offerings are included in a survey and presented as a semantic
scale to enable respondents to express their views.
In marketing research, the semantic differential is frequently used to measure
attitudes toward the imagery surrounding product and services. The scale
consists of a number of bipolar adjective phrases and statements that could be
used to describe what is being evaluated. Figure 2.7 shows an example of the
bipolar adjective pairs used to provide a profile or image of the objects being
investigated. All of the favourable adjectives phrases are positioned on the
same side in order to obtain a sensible and overall impression of respondents’
perception of the object being evaluated. More than one object can be
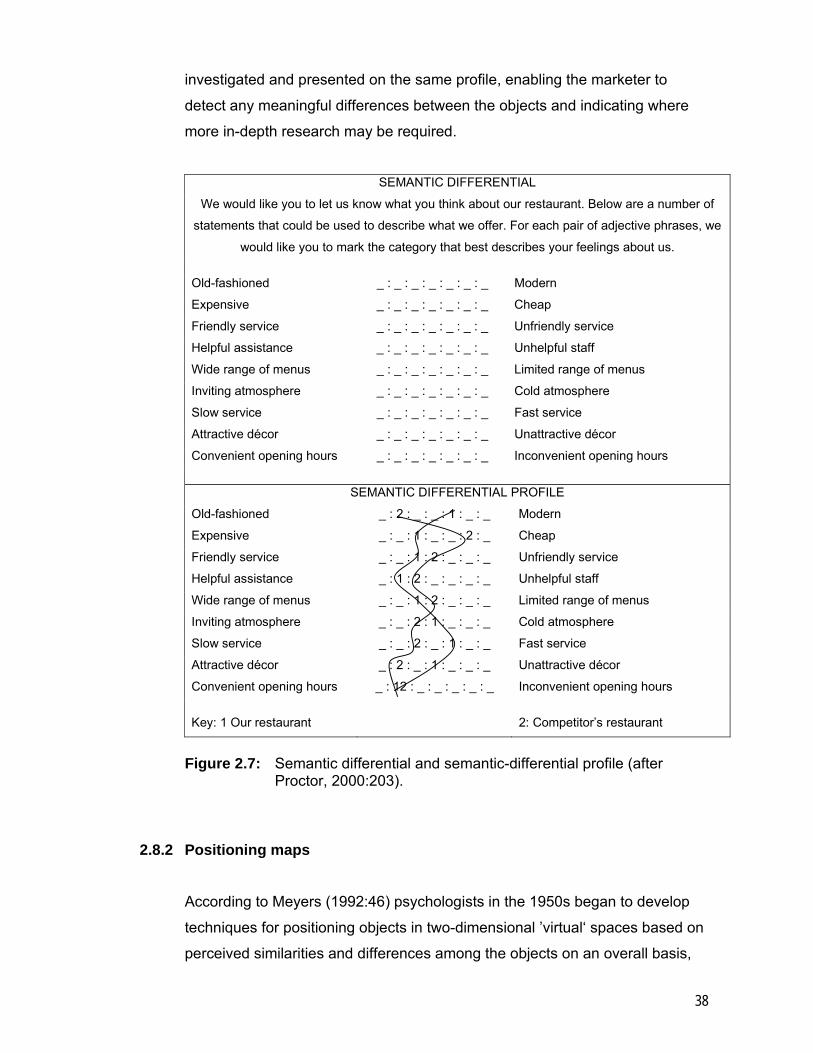
38
investigated and presented on the same profile, enabling the marketer to
detect any meaningful differences between the objects and indicating where
more in-depth research may be required.
SEMANTIC DIFFERENTIAL
We would like you to let us know what you think about our restaurant. Below are a number of
statements that could be used to describe what we offer. For each pair of adjective phrases, we
would like you to mark the category that best describes your feelings about us.
Old-fashioned _ : _ : _ : _ : _ : _ : _ Modern
Expensive _ : _ : _ : _ : _ : _ : _ Cheap
Friendly service _ : _ : _ : _ : _ : _ : _ Unfriendly service
Helpful assistance _ : _ : _ : _ : _ : _ : _ Unhelpful staff
Wide range of menus _ : _ : _ : _ : _ : _ : _ Limited range of menus
Inviting atmosphere _ : _ : _ : _ : _ : _ : _ Cold atmosphere
Slow service _ : _ : _ : _ : _ : _ : _ Fast service
Attractive décor _ : _ : _ : _ : _ : _ : _ Unattractive décor
Convenient opening hours _ : _ : _ : _ : _ : _ : _ Inconvenient opening hours
SEMANTIC DIFFERENTIAL PROFILE
Old-fashioned _ : 2 : _ : _ : 1 : _ : _ Modern
Expensive _ : _ : 1 : _ : _ : 2 : _ Cheap
Friendly service _ : _ : 1 : 2 : _ : _ : _ Unfriendly service
Helpful assistance _ : 1 : 2 : _ : _ : _ : _ Unhelpful staff
Wide range of menus _ : _ : 1 : 2 : _ : _ : _ Limited range of menus
Inviting atmosphere _ : _ : 2 : 1 : _ : _ : _ Cold atmosphere
Slow service _ : _ : 2 : _ : 1 : _ : _ Fast service
Attractive décor _ : 2 : _ : 1 : _ : _ : _ Unattractive décor
Convenient opening hours _ : 12 : _ : _ : _ : _ : _ Inconvenient opening hours
Key: 1 Our restaurant 2: Competitor’s restaurant
Figure 2.7: Semantic differential and semantic-differential profile (after
Proctor, 2000:203). 2.8.2 Positioning maps
According to Meyers (1992:46) psychologists in the 1950s began to develop
techniques for positioning objects in two-dimensional ’virtual‘ spaces based on
perceived similarities and differences among the objects on an overall basis,
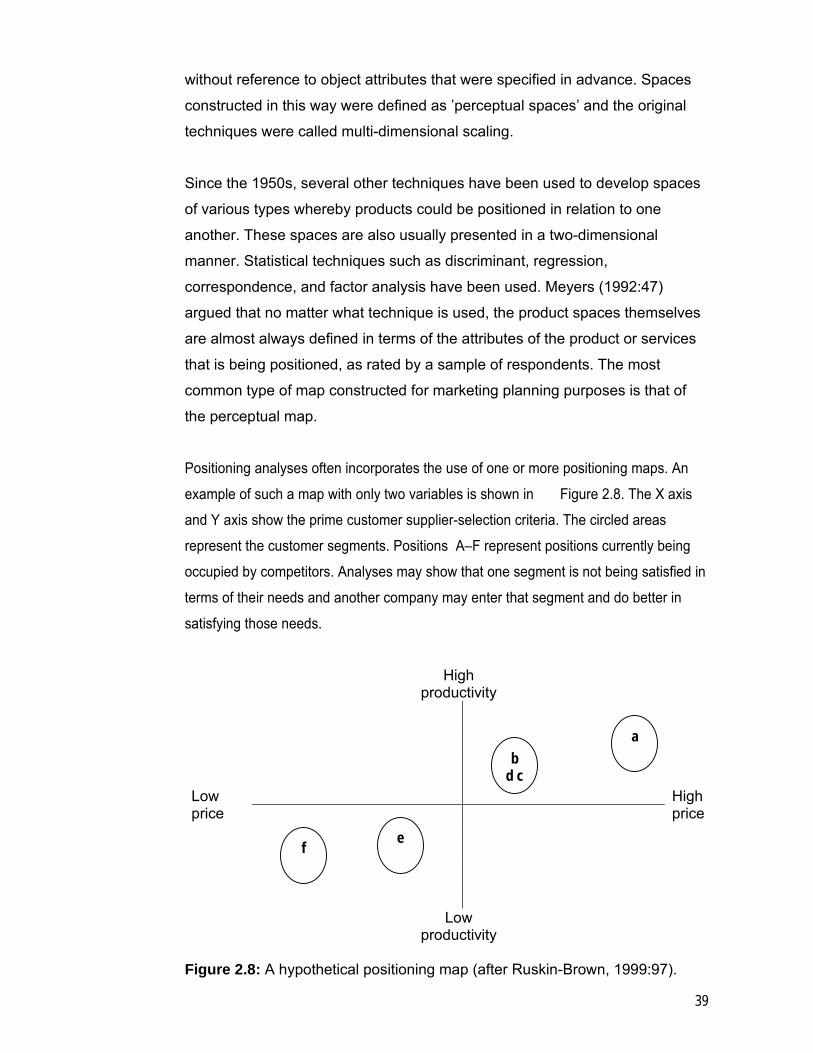
39
without reference to object attributes that were specified in advance. Spaces
constructed in this way were defined as ’perceptual spaces’ and the original
techniques were called multi-dimensional scaling.
Since the 1950s, several other techniques have been used to develop spaces
of various types whereby products could be positioned in relation to one
another. These spaces are also usually presented in a two-dimensional
manner. Statistical techniques such as discriminant, regression,
correspondence, and factor analysis have been used. Meyers (1992:47)
argued that no matter what technique is used, the product spaces themselves
are almost always defined in terms of the attributes of the product or services
that is being positioned, as rated by a sample of respondents. The most
common type of map constructed for marketing planning purposes is that of
the perceptual map.
Positioning analyses often incorporates the use of one or more positioning maps. An
example of such a map with only two variables is shown in Figure 2.8. The X axis
and Y axis show the prime customer supplier-selection criteria. The circled areas
represent the customer segments. Positions A–F represent positions currently being
occupied by competitors. Analyses may show that one segment is not being satisfied in
terms of their needs and another company may enter that segment and do better in
satisfying those needs.
High productivity
Low price
High price
Low productivity
Figure 2.8: A hypothetical positioning map (after Ruskin-Brown, 1999:97).
f e
b d c
a
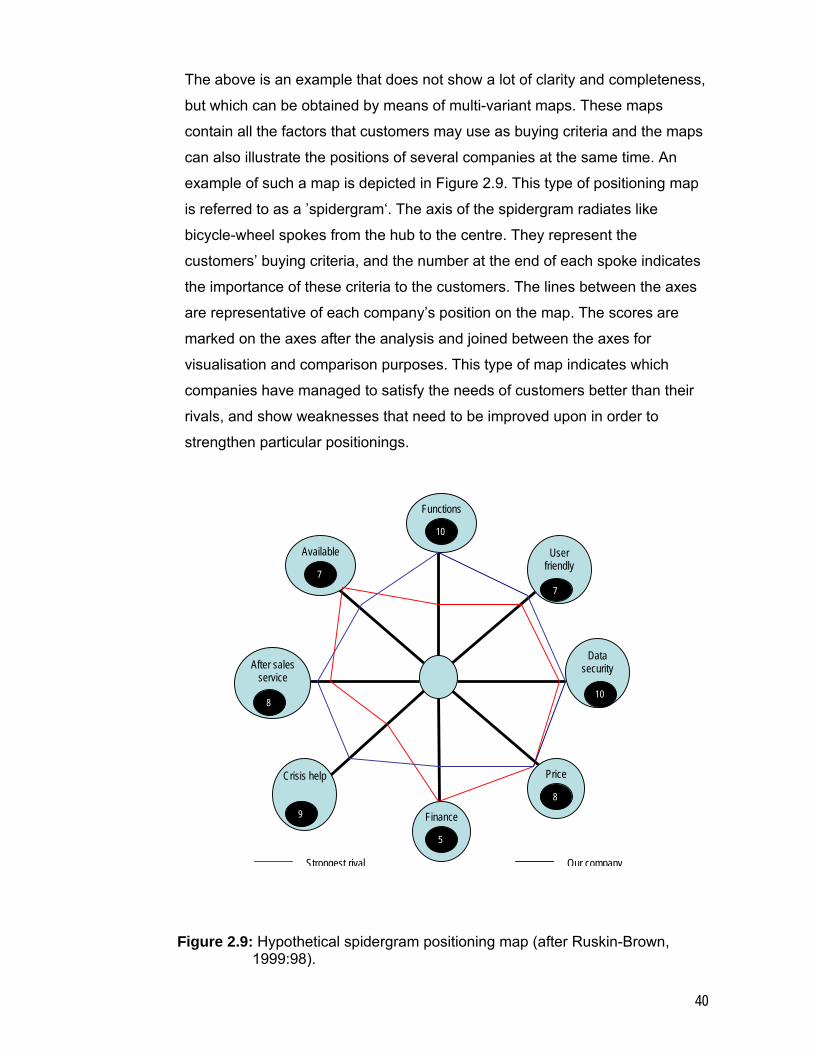
40
The above is an example that does not show a lot of clarity and completeness,
but which can be obtained by means of multi-variant maps. These maps
contain all the factors that customers may use as buying criteria and the maps
can also illustrate the positions of several companies at the same time. An
example of such a map is depicted in Figure 2.9. This type of positioning map
is referred to as a ’spidergram‘. The axis of the spidergram radiates like
bicycle-wheel spokes from the hub to the centre. They represent the
customers’ buying criteria, and the number at the end of each spoke indicates
the importance of these criteria to the customers. The lines between the axes
are representative of each company’s position on the map. The scores are
marked on the axes after the analysis and joined between the axes for
visualisation and comparison purposes. This type of map indicates which
companies have managed to satisfy the needs of customers better than their
rivals, and show weaknesses that need to be improved upon in order to
strengthen particular positionings.
Figure 2.9: Hypothetical spidergram positioning map (after Ruskin-Brown,
1999:98).
Available
After sales service
Crisis help
Finance
Price
Data security
User friendly
Functions
10
7 7
10
8
5
9
8
Strongest rival Our company
41
2.8.3 Attribute positioning maps
The emphasis placed on perceptual maps by marketing researchers has
resulted in a tendency for most marketing practitioners to think that these are
the only meaningful type of spaces to use for positioning products and
services. The assumption is that all consumer evaluations and buying
decisions start with cognition (which includes perception), a basic precept of
the cognitive revolution in psychology (Meyers, 1992:47). A growing number of
scholars argue that preferences and choices need no antecedents, and they
suggest that, in a typical buying situation, consumers could start at any point
on a continuum between initial perception and actual purchase. This
continuum starts at:
Need awareness →development of alternatives (cognition) →evaluation of
alternatives (effect) →final choice (conation).
According to Meyers (1992:47) a few practitioners have realised that
positioning maps could be constructed for any stage in the process and they
proceeded to draft positioning maps of the following types in terms of the
important attributes of a product or service:
Perceptual space, defined in terms of product attributes that distinguish or
differentiate most among products or services in a category
Preference space, defined in terms of product attributes that consumers
want the most
Choice space, defined in terms of attributes that drive actual choice among
competing products or brands within a category
2.8.4 Attitude positioning maps
The concept of attitude positioning maps is defined by Meyers (1992) as the
attitude that people hold toward a need that a product or service category is
intended to serve. Attitude and usage studies measure respondents’ attitudinal
viewpoints toward a selected product or service category in terms of many
attitude statements. These ratings can also be used for segmentation
purposes on the basis of attitudes. Respondents are asked to reveal their
42
attitudes toward any given object by means of a Likert-type scale, which
reflects their responses. An attitude space can then be created in the same
way as a perceptual space, but instead of using attribute ratings, attitude
ratings are utilised. Meyers (1992:48) indicated that the map shows three
useful factors:
The particular attitudes that distinguish best among the most frequent
users of each major brand in a product or service category
Competitive sets of brands or companies that compete most directly with
one another, based on the attitudes of their customers
Basic attitudes held by the most frequent users of each brand. These are
the attitudes that characterise each brand in the eyes of its most frequent
users
2.9 COMPETITIVENESS AND CRITICAL SUCCESS FACTORS
Competitiveness factors relate to a combination of a company’s relative
strengths versus competitors, in relation to customer needs in each identified
segment. Measuring strengths in relation to other competitors while trying to
satisfy customer needs are interrelated with positioning (discussed in the
previous section). Customers, at some stage, develop a need and become
aware of it. The next stage, as described earlier, is to develop and evaluate
alternatives to the product or service that will satisfy the need. McDonald &
Dunbar (2004:212) explained that during the process of evaluation customers
make a decision between alternative offers in terms of perceived or stated
attributes, referred to as the Decisive Buying Criteria (DBC) of the customers
in a particular segment. Therefore, to win any business in any particular
segment, a company has to be more successful than its competitors in
meeting the segment’s DBCs. This success is relative to the constituents of
the offer required to deliver each DBC and these are referred to as the Critical
Success Factors (CSFs). An example of a DBC could be delivery reliability
and the CSF that accompanies it is the minimum time perceived by the
customer to have the product delivered at the correct address. According to
McDonald & Dunbar (2004:316) CSFs can often be subdivided as follows:
43
Product requirements
Price requirements
Promotion requirements
Place (distribution and service) requirements
Each one of the above-mentioned headings can be further subdivided into
subheadings in order to further analyse them, based on the relevance of each
segment. Product strengths, for example, could be subdivided as follows:
Relative product safety
Relative product convenience
Relative cost effectiveness
According to McDonald & Dunbar (2004:317) an assessment can be done of
the company to determine how well the company is meeting the requirements
of each segment. The following questions could be considered:
Do we have the right products?
How large is our segment share?
How well are we known in this segment?
What image do we have?
Do we have the right technical skills?
Can we adapt to change?
Do we have enough capacity?
Can we grow?
How close are we to this segment?
The answers to these questions will indicate where the company has to improve in
order to satisfy the needs of customers. A company’s relative strength in meeting
customer needs is a function of its capabilities in respect of the CSFs relative to the
capabilities of the best competitor. The purpose of this analysis is to translate the
information into actionable proportions of other functions within the company in order to
meet customer needs. The marketing department cannot perform all these functions
and is not directly responsible for purchasing, production distribution, etc. The
marketing department, therefore, needs to persuade these other company functions to
cooperate in the effort to improve CSF scores. CSF scores will be discussed in the next
section.
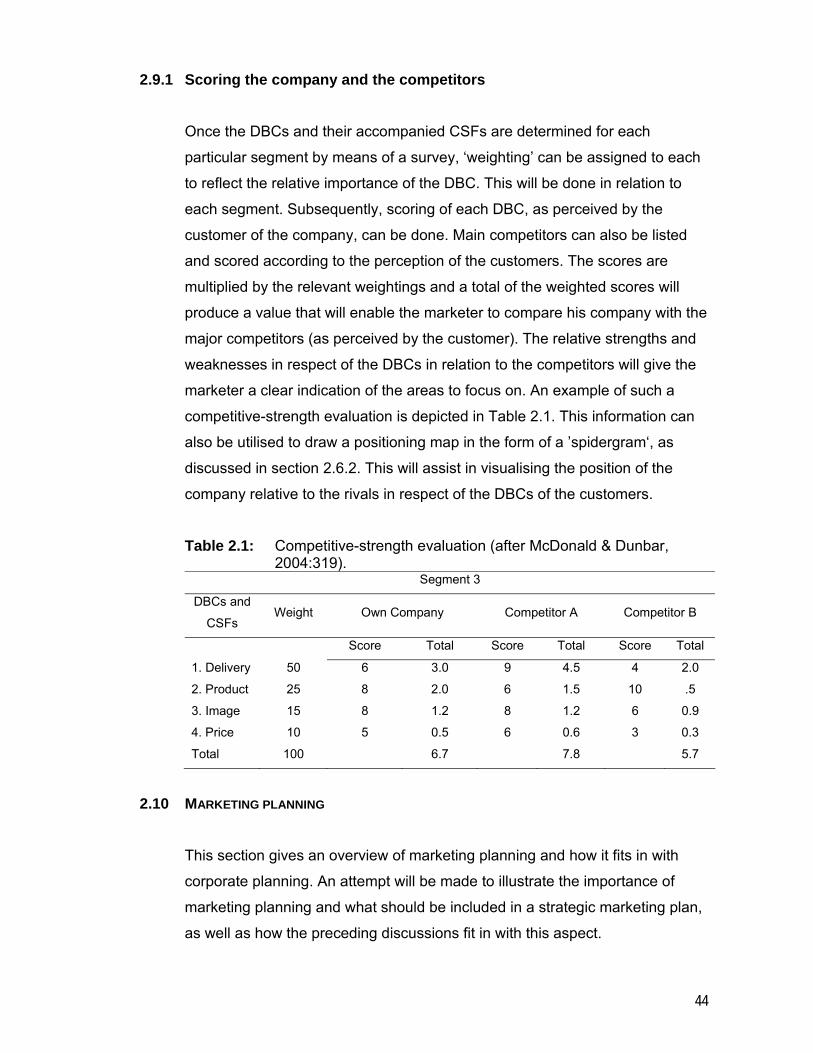
44
2.9.1 Scoring the company and the competitors
Once the DBCs and their accompanied CSFs are determined for each
particular segment by means of a survey, ‘weighting’ can be assigned to each
to reflect the relative importance of the DBC. This will be done in relation to
each segment. Subsequently, scoring of each DBC, as perceived by the
customer of the company, can be done. Main competitors can also be listed
and scored according to the perception of the customers. The scores are
multiplied by the relevant weightings and a total of the weighted scores will
produce a value that will enable the marketer to compare his company with the
major competitors (as perceived by the customer). The relative strengths and
weaknesses in respect of the DBCs in relation to the competitors will give the
marketer a clear indication of the areas to focus on. An example of such a
competitive-strength evaluation is depicted in Table 2.1. This information can
also be utilised to draw a positioning map in the form of a ’spidergram‘, as
discussed in section 2.6.2. This will assist in visualising the position of the
company relative to the rivals in respect of the DBCs of the customers.
Table 2.1: Competitive-strength evaluation (after McDonald & Dunbar, 2004:319).
Segment 3
DBCs and
CSFs Weight Own Company Competitor A Competitor B
Score Total Score Total Score Total
1. Delivery 50 6 3.0 9 4.5 4 2.0
2. Product 25 8 2.0 6 1.5 10 .5
3. Image 15 8 1.2 8 1.2 6 0.9
4. Price 10 5 0.5 6 0.6 3 0.3
Total 100 6.7 7.8 5.7
2.10 MARKETING PLANNING
This section gives an overview of marketing planning and how it fits in with
corporate planning. An attempt will be made to illustrate the importance of
marketing planning and what should be included in a strategic marketing plan,
as well as how the preceding discussions fit in with this aspect.
45
According to McDonald (2002:28) companies set four typical objectives:
Maximise revenue
Maximise profits
Maximise return on investment
Minimise cost
In reality, the best that can be achieved is an optimum compromise because
each of these objectives could be in conflict with one another. A marketing
plan is useful in many ways and McDonald (2002:29) regards it useful to the
marketer, superiors, non-marketing functions and subordinates. It also helps to
identify sources of competitive advantages and assists in forcing an organised
approach, while developing specificity. It also ensures consistent relationships
and that enough resources are applied by means of enough support.
Commitment is gained once a plan is in place and, ultimately, clear objectives
and strategies will ensure that everyone concerned is working toward a
common and achievable goal.
It is important to note the difference between a strategic marketing plan versus
a tactical or operational marketing plan. McDonald (2002:31) defines a
strategic plan as a plan that covers a period beyond the next fiscal year,
usually between three and five years. He defines a tactical plan as a plan that
covers in detail the actions to be taken, and by whom, during a short-term
planning period, usually one year or less. Therefore, the strategic marketing
plan must be developed first by scanning the external environment and
identifying the forces emanating from it. Appropriate strategies can then be
developed, involving all levels of management in the process. Only once the
strategic plan has been approved should the one-year operational marketing
plan be developed.
2.10.1 The marketing planning process McDonald (2002) described the marketing planning process in ten steps, as
follows:
46
Step 1 Mission statement The following should appear in a mission statement:
Role or contribution in terms of profit, service or opportunity seeker
Business definition — in terms of the benefits to be provided or the needs
to be satisfied
Distinctive competencies — the essential skills or capabilities resources
that underpin whatever success has been achieved to date
Indications for the future in terms of what the firm will do, might do and
would never do
Step 2 Setting corporate objectives
The corporate plan will usually contain at least the following elements:
The desired level of profitability
Business boundaries i.t.o what type of products will be sold to which
markets, what kind of facilities will be developed, the size and character of
the labour force, as well as funding
The social responsibility, corporate image, stock-market image and
employer image
Step 3 The marketing audit An audit is the means with which a company endeavours to understand how it
relates to the environment in which it operates. In addition, it is the means with
which a company can identify its own strengths and weaknesses as they relate
to external opportunities and threats; thus, it is a way of helping management
to select a position in that environment based on known factors. This audit
needs to be conducted at least once a year, at the beginning of the planning
cycle, in much the same way that an annual financial audit is carried out. A
continuous identification, measurement, collection and analysis of all the
relevant facts will be highlighted on a regular basis.
Step 4 SWOT analyses
A SWOT analysis starts with examining internal strengths and weaknesses in
the areas of profitability, sales, marketing, quality, customer service,
productivity, financial resources, financial management, operations and
distribution. When embarking on a SWOT analysis, at least five strengths and
47
opportunities, as well as weaknesses and threats, must be listed. Knowing
these will help to identify and develop marketing strategies. The goal is to
determine which small market niches to focus on and dominate, and discover
how to please customers in a way that is better than the competition (Vass,
2005:18).
Vass (2005:18) stated that a company needs to know its competition and the
starting point is to list basic facts about the five largest competitors, including
their names, the names and roles of key players, the number of employees,
market share, key customers, distribution patterns, etc. A simple form of quick
reference on own company position versus that of competitors can be used,
including what the customer wants, what the competitor provides and what the
own company provides. The DBCs discussed earlier apply to the customer,
whereas the SWOT analysis applies to the competitors as well as the own
company.
Step 5 Assumptions Examples of assumptions are a price competition that would force price levels
down by ten per cent across the board, or a new product in the field would be
introduced by a major competitor before the end of a certain period. The
purpose of assumptions is to standardise the planning environment.
Step 6 Marketing objectives and strategies
An objective is something that must be achieved and a strategy is the ‘how to’
of achieving the objective. Marketing objectives are simply about one or more
of the following:
Existing products for existing markets
New products for existing markets
Existing products for new markets
New products for new markets
Objectives should be measurable; otherwise they cannot be classified as
objectives. Measurement should be in terms of sales volumes, sales value,
market share, profit, and percentage penetration of outlets. The Ansoft Matrix,
depicted in Figure 2.10, illustrates the marketing-objective possibilities visually.
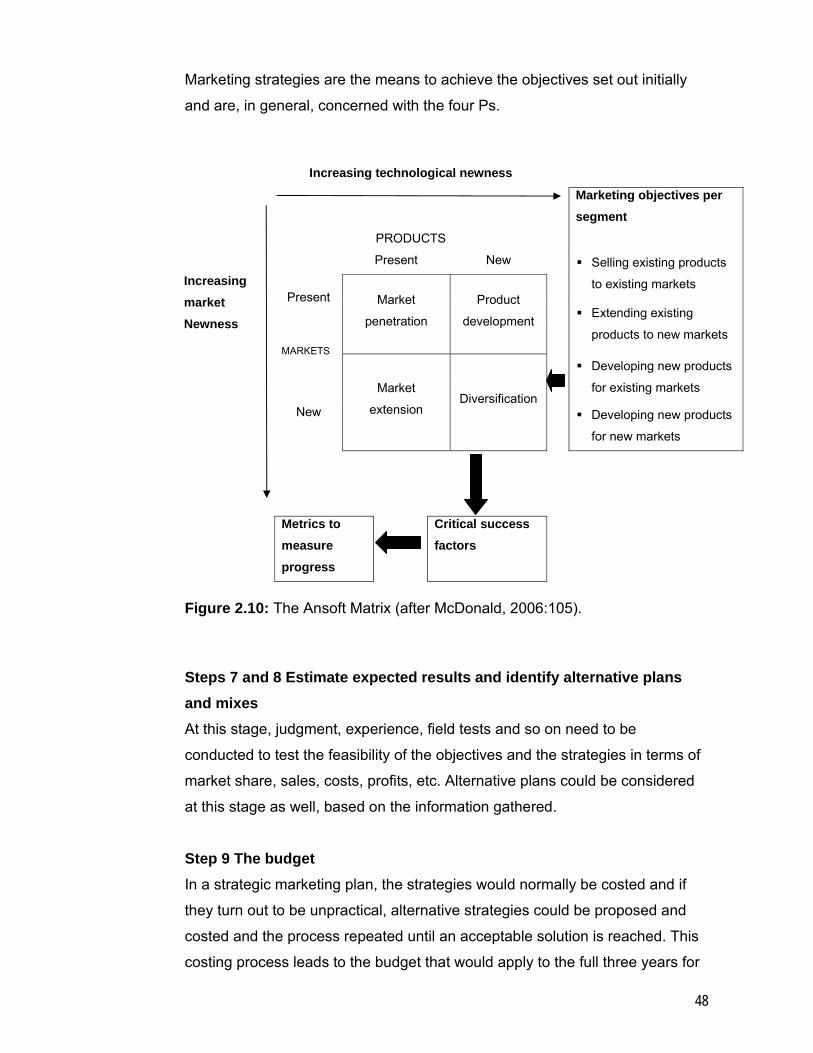
48
Marketing strategies are the means to achieve the objectives set out initially
and are, in general, concerned with the four Ps.
Increasing technological newness
Marketing objectives per segment
PRODUCTS
Present New Selling existing products
to existing markets Present Market
penetration
Product
development Extending existing
products to new markets MARKETS
Developing new products
for existing markets
New
Market
extension Diversification
Developing new products
for new markets
Increasing market Newness
Metrics to measure progress
Critical success factors
Figure 2.10: The Ansoft Matrix (after McDonald, 2006:105).
Steps 7 and 8 Estimate expected results and identify alternative plans and mixes At this stage, judgment, experience, field tests and so on need to be
conducted to test the feasibility of the objectives and the strategies in terms of
market share, sales, costs, profits, etc. Alternative plans could be considered
at this stage as well, based on the information gathered.
Step 9 The budget In a strategic marketing plan, the strategies would normally be costed and if
they turn out to be unpractical, alternative strategies could be proposed and
costed and the process repeated until an acceptable solution is reached. This
costing process leads to the budget that would apply to the full three years for
49
a strategic marketing plan (a detailed budget would apply to a one-year
operational plan).
Step 10 First-year detailed implementation programme In the one-year tactical plan, the marketing strategies would be developed into
specific objectives, each supported by detailed strategy and action statements.
A product-based company, for example, could have a product plan with
objectives, strategies and tactics for price, place, and promotion. Any
combination is possible, depending on the company and the external
circumstances.
These strategies, or CSFs, will be weighted according to their relative
importance to the customers in the segment. McDonald (2006) reiterates that it
is unlikely for the marketing function to be responsible for what needs to be
done to improve a CSF. Other functions perform tasks such as after-sales
service, channel management, product development, etc. However, the
marketing function needs to persuade the other role players of the need to
improve the company's CSF scores; this explains why marketing actions
cannot be linked directly to profitability and emphasises the interdependence
between the various functions.
2.11 SUMMARY
Marketing can be described as a process for:
Defining markets
Quantifying the needs of the customer groups (segments) within these
markets
Determining the value propositions to meet these needs
Communicating these value propositions to all the role players in the
organisation responsible for delivering them and obtaining their cooperation
Playing an important part in delivering these value propositions (usually
only communications)
Monitoring the value actually delivered (McDonald & Dunbar, 2004:9).
50
A company needs to decide within which markets it wishes to participate,
these markets then need to be segmented or divided into groups of customers
with similar needs. There are various criteria available to 'segment' customers,
most of which concern the purchasing behaviour of customers. Once the
market has been segmented, unique strategies could be developed for each
segment, known as target marketing. Marketing programmes in each of the
major areas of marketing, first called the four Ps (product, price, place,
promotion) are subsequently developed to bring the marketing strategies into
the marketplace.
It is important for the marketer to identify the following for each segment:
needs, what it can afford, how loyal the customer is to a competitor and what
the response is of that particular customer to an offer. Proper segmentation
keeps the company close to the market and its customers, and 'uncovers' the
best customers while identifying what it takes to satisfy them.
Once the market has been defined, it is necessary to understand the value
that customers in each segment seek. This value relates to the benefit the
customer is gaining by acquiring the service or product. The Cost,
Convenience, Communications and Customer wants and needs are translated
into the strategy of the company i.t.o. the four Ps (product, price, promotion
and place) referred to as the levers of marketing control with regard to the
marketing mix.
The third major process in the marketing domain is to deliver the value
proposition. A company’s value chain is the starting point and certain tasks
have to be performed in order to deliver the value to the customer.
Lastly, the monitoring of the marketing efforts will determine how successful
the value to the customers was delivered. This monitoring process includes
the measurement of customer perception, value required by the customer,
value received by the company and the effectiveness of the marketing
strategies.
51
This marketing process and, in particular, the monitoring process will be the
main focus of this research study. Corobrik wants to understand the value
required by the customer, as well as the perception of the customers relating
to its products and service offerings. In addition, Corobrik wants to understand
how the competitors are performing in the market segments where Corobrik is
also operating. As described in the marketing domain by McDonald & Dunbar
(2004), the process is of a cyclical nature and the information gained from the
analysis should be used to improve the delivery of the offerings to the
customers in order to build better relationships with valuable current
customers, while attracting new customers.
When customers make a decision to acquire a product or service, a process of
evaluation between alternative offerings is done and the attributes of the
service or product, leading to a decision being made, is referred to as the
Decisive Buying Criteria (DBC). The factors leading to the success of
delivering the DBCs are referred to as the Critical Success Factors (CSFs).
These factors relate to a combination of a company’s relative strengths versus
those of competitors in relation to customer needs in each identified segment.
This study will investigate the importance of certain DBCs to customers and
compare the performance of Corobrik with its competitors in relation to these
DBCs as perceived by customers in various segments. This process of
competitive-strength evaluation, described by McDonald & Dunbar (2004), will
quantify the performance of competitors, as perceived by customers, as well
as the value required by the customer. Therefore, this evaluation process is a
means of conducting part of the marketing process in an effort to become
consumer/customer focused.
The concept of positioning described in the literature could be utilised to draw
positioning maps of the findings in order to visualise the results. The marketing
mix is important in developing an effective positioning, since the offering must
be aligned with the target customers’ needs and expectations. This eventually
leads to various positioning strategies that can be followed in the effort to meet
the needs of customers.

52
The literature has shown that customer purchase behaviour is complex and it
must be kept in mind when new objectives and strategies are formulated
during the marketing planning process. These objectives and strategies, based
on the latest customer and competitor analyses, relate to meeting the needs of
the customers in a way that is superior to that of the opposition.
53
CHAPTER 3
3. RESEARCH METHODOLOGY
The main purpose of the study is to determine ways of retaining current
customers and acquiring new customers for Corobrik. The main objective of
the study is to determine the importance of key attributes customers are
seeking when purchasing face brick. It is also important to know how the
customer perceives a company in comparison with competitors in relation to
the requirements of the customer. This information enables the marketer to
best position the company and its products in the market place and provides
an opportunity to develop effective customer relationships. Depending on the
outcome of the information, current marketing strategies may be revised to
ensure that they are successful in meeting the requirements of customers
better than those of rival companies.
A brief summary of the methodology follows and will be discussed in more
detail later in this chapter.
From a sampling-design point of view, the study will be limited to the Gauteng
Province owing to the enormous number of customers in South Africa and
because of time constraints. The market in Gauteng is substantial enough to
yield a fair representation of what needs to be achieved in the study. A
questionnaire will be distributed to Architects, Contractors and Distributors,
which represent the different market segments.
The data will be collected by means of a telephonic interview because of cost
and time constraints.
The research design is summarised in Table 3.1. McDonald & Dunbar (2004)
indicated a method of competitive-strength evaluation that entails an
understanding of the customers’ preferences and their views on competitor
performance, related to the customers’ own preferences. Based on this
method, a questionnaire was constructed; how to deal with the questions, data
54
and the analysis will be dealt with further on in the chapter. This competitive-
strength evaluation is aligned with the research problem and literature study in
the sense that once the customer and competitor is understood, strategies can
be revised, if needed, to better satisfy the customer, increase competitiveness
and increase market share.
This research study can be seen as exploratory, since future research tasks
could be discovered during the study. This study will be a ‘snapshot in time’
owing to time constraints and will possibly yield different results if repeated at
another time. The questionnaire is such that the data could be analysed and
certain propositions compared with the ratings. Therefore, a semi-quantitative
study is possible where the perceptions of people can be measured.
Respondents will be asked to complete the questionnaire during telephone
interviews. The questionnaire could have been distributed via e-mail but to
obtain all the addresses and organise the distribution and retrieval of
information would probably have taken much longer. It is important that the
study is done in a ‘field setting’ to reflect what would occur under actual
conditions. In addition, the same questionnaire was used for all respondents,
helping to ensure that the respondents or the researcher did not manipulate
ratings reflected in the survey, even if the respondents and competitors under
investigation are diversified.
Dangers (2007) referred to specific attributes in his survey as being important
decision-making criteria in respect of the choice to purchase bricks. In this
study, these attributes will be used as the basis for the DBCs of customers
purchasing bricks. These attributes are as follows:
Price (affordability or value for money to the customer)
Availability (available within an acceptable time frame)
Quality (squareness, consistent texture and colour, free from chips and
cracks)
Aesthetics (yielding the desired effect, pleasing to the eye)
Service (service before, during and after sale)
55
3.1 PROPOSITIONS
Proposition 1: Architects will regard Aesthetics as the most important
DBC.
Architects, with the assistance of design engineers, design buildings/structures
not only for their practical purposes, but also for the aesthetic qualities inherent
in the designs and the aesthetic value they bring to their environment/setting.
Because of these aesthetic and functional requirements, the construction
materials to be used need to have specific qualities and properties.
Commercial structures, as well as residential buildings, carry the signatures of
the designers for a very long time, creating an added incentive to produce
aesthetically pleasing designs. It is therefore assumed that Architects will
regard Aesthetics as the most important DBC when a purchase decision is
made for face brick.
Proposition 2: Contractors will regard Availability as the most important
DBC.
Contractors purchase products/materials for use in the buildings they were
contracted to construct. As Contractors are only paid what is due them near
the end of the construction period and because they are penalised for late
completion of contracts, it is assumed that Contractors want to complete the
contract as soon as possible. Therefore, if the product specified is not
available, Contractors will view this negatively and, therefore, it is assumed
that for Contractors Availability is the most important DBC
It also assumed that the product was specified and that there will be only one
supplier, depending on the tightness of the specifications. Face-brick products
in the South African market are unique and very distinct and Specifiers have to
work accordingly. In such a case, the price of the product specified does not
have much relevance as it automatically becomes part of a ‘standard’ cost in
the contract because of the limited number of suppliers. However, when the
specifications are less strict/rigid, Price would probably become a major factor
56
in terms of the DBCs; the contract would then be completed using the
cheapest product for the specific contract price.
Proposition 3: Consumers will regard Price as the most important DBC.
The consumers referred to here represent the ‘man in the street’ or customer
buying bricks from outlet centres for personal use. The assumption is made
that people build a house or extend an existing house for practical and
investment purposes. Investments of this type are quite expensive and often
funded with income from a salary; therefore, it is assumed that this market is
price sensitive and will regard Price as the most important DBC when
purchasing face brick.
Proposition 4: Corobrik will score the lowest with regard to the Price as
DBC, compared with competitors.
Corobrik is commonly known as a company that sells good quality products at
prices slightly more than the average brick manufacturer charges. Small brick
manufacturers with minimal overheads, and manufacturing for the plaster brick
market, could also be part of the group of companies being compared with
Corobrik. This might not be a fair comparison, but, nevertheless, the general
perception exists that Corobrik products are expensive. It is expected that
Corobrik will perform the worst in terms of price. Corobrik’s ‘top of the range’
products are undoubtedly the most expensive in the face-brick market, but this
is limited to a handful of products. The question is how well the balance of the
products compares with the rival products with regard to Price as a DBC.
Some products are similar in appearance, but differ in cost to the customer for
various reasons such as manufacturing cost and transport distances. When
buying a cheaper product, the customer perceives value for money when the
end product is meeting aesthetic requirements (maybe not as much as the
more expensive product), or when the product is utilised for functional
purposes only, such as a retaining wall.
57
Proposition 5: Corobrik will be perceived as more successful than
competitors in delivering quality and aesthetically pleasing
products.
As mentioned before, Corobrik is generally perceived as a company that
produces quality products, which proposition no 5 will test. In addition,
Corobrik produces a wide range of product colours and it is expected, although
not guaranteed, that a customer should find an aesthetically pleasing product.
It is therefore expected that Corobrik will be rated highly and probably even
better than competitors in this category.
Proposition 6: Corobrik will score the highest with regard to Availability
as DBC compared with competitors.
Corobrik has increased its output capacity significantly over the last few years.
It is known that competitors have done the same, however, it is not certain to
what extent. However, it is expected that the increased capacity and current
stockholding of Corobrik will assist the company in having stock available and,
consequently, a higher score compared with competitors is expected.
Proposition 7: Corobrik will score the highest with regard to perceived
service to customers compared with competitors.
Corobrik is the largest brick manufacturer in Africa and it is assumed that it has
the infrastructure to deal with the increased demand in products and customer
service. It is true that size does not guarantee service excellence, but it is
assumed that in order to have grown the business significantly from an already
large base, the infrastructure to ensure acceptable service needed to have
been in place. Therefore, it would not be surprising to see Corobrik having the
best rating in terms of customer service. It must be noted, as was mentioned
earlier, that Corobrik’s competition has become fiercer and service
improvement is one way of increasing product differentiation and competition.
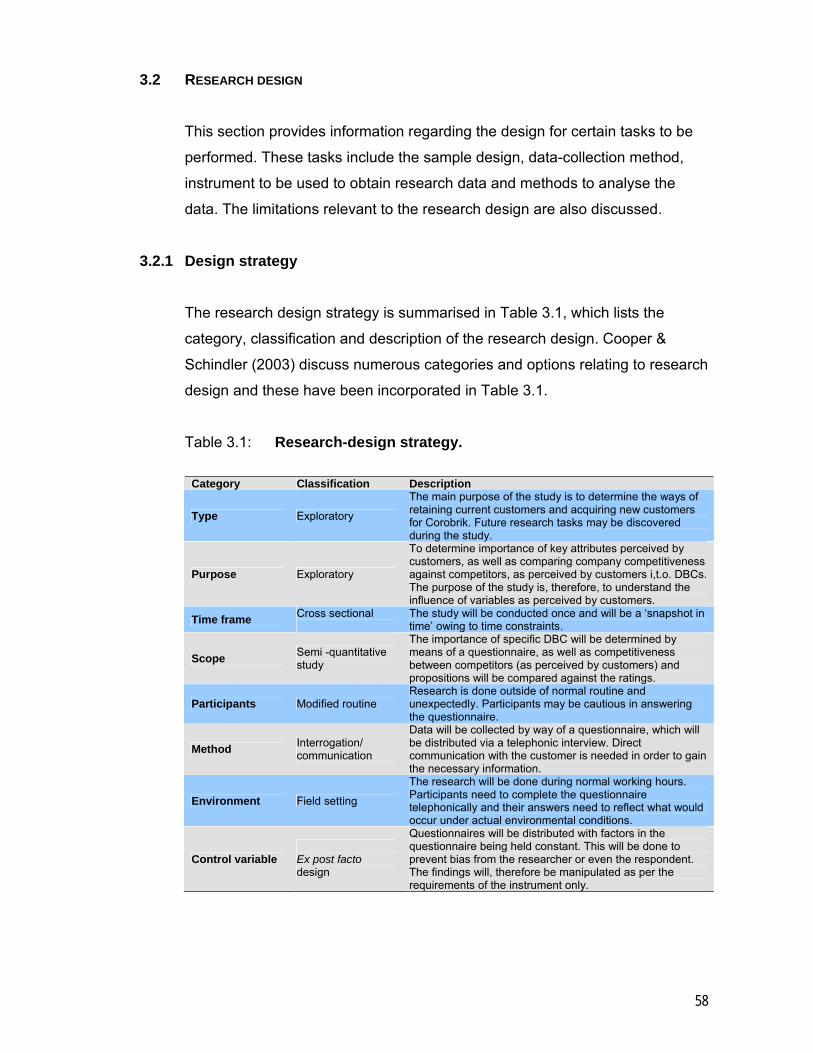
58
3.2 RESEARCH DESIGN
This section provides information regarding the design for certain tasks to be
performed. These tasks include the sample design, data-collection method,
instrument to be used to obtain research data and methods to analyse the
data. The limitations relevant to the research design are also discussed.
3.2.1 Design strategy
The research design strategy is summarised in Table 3.1, which lists the
category, classification and description of the research design. Cooper &
Schindler (2003) discuss numerous categories and options relating to research
design and these have been incorporated in Table 3.1.
Table 3.1: Research-design strategy.
Category Classification Description
Type Exploratory
The main purpose of the study is to determine the ways of retaining current customers and acquiring new customers for Corobrik. Future research tasks may be discovered during the study.
Purpose Exploratory
To determine importance of key attributes perceived by customers, as well as comparing company competitiveness against competitors, as perceived by customers i,t.o. DBCs. The purpose of the study is, therefore, to understand the influence of variables as perceived by customers.
Time frame Cross sectional
The study will be conducted once and will be a ‘snapshot in time’ owing to time constraints.
Scope Semi -quantitative study
The importance of specific DBC will be determined by means of a questionnaire, as well as competitiveness between competitors (as perceived by customers) and propositions will be compared against the ratings.
Participants Modified routine Research is done outside of normal routine and unexpectedly. Participants may be cautious in answering the questionnaire.
Method Interrogation/ communication
Data will be collected by way of a questionnaire, which will be distributed via a telephonic interview. Direct communication with the customer is needed in order to gain the necessary information.
Environment Field setting
The research will be done during normal working hours. Participants need to complete the questionnaire telephonically and their answers need to reflect what would occur under actual environmental conditions.
Control variable Ex post facto design
Questionnaires will be distributed with factors in the questionnaire being held constant. This will be done to prevent bias from the researcher or even the respondent. The findings will, therefore be manipulated as per the requirements of the instrument only.
59
3.2.2 Data-collection design
A self-developed, structured questionnaire will be distributed to Architects,
Contractors, and Distribution Centre Managers (representing customers as
consumers) that are involved in the purchase transaction of brick products.
The self-developed questionnaire with table to be filled in by the interviewer is
included in Appendix A.
Research will be done by telephonic interviews. Corobrik already has an
infrastructure in place to deal with customer surveys by telephonic means and
this will be utilised to collect data for this study. The number of interviews for
each group will be discussed in the sample-design section.
Owing to the size and diversity of the customer base, it is more practical to
deal with customer surveys by means of telephonic interviews. From a cost
point of view, the telephonic survey will be cheaper compared with personal
interviews. More importantly, owing to the time constraints of this study,
telephonic interviews will facilitate a faster data-collection method. A high
percentage of the customers to be interviewed have immediate access to
telephones, which should assist in a high response rate.
Cooper & Schindler (2003) stipulated that there are three broad conditions to
be met in order to have a successful personal interview:
The participant must possess the information being targeted by the
investigative questions
The participant must understand his or her role in the interview as the
provider of accurate information
The participant must perceive adequate motivation to cooperate
There are certain disadvantages to be considered in using a telephone for
research purposes, as stipulated by Cooper & Schindler (2003). One major
consideration is the limit on the interview length. It is suggested that ten
minutes is the ideal, but lengths of twenty minutes or more are not uncommon.
This means that, in general, fewer measurement questions should be asked
60
compared with the personal interview. This limitation depends a lot on the
interest shown by the participant in terms of the topic under discussion.
Another disadvantage of this method is the limitation on use of visual or
complex questions. When interviewing by telephone, it is difficult to use maps,
illustrations, visual aids, complex scales or measurement techniques.
Telephone responses also tend to yield less thorough responses.
Considering the above, the questions need to be short and concise to enable
the researcher to adequately obtain the information that is sought.
3.2.3 Sample design
This study will be limited to the Gauteng Province owing to the sheer size of
the customer base in the country. The revenue of Corobrik emanating from
sales in Gauteng is 44 per cent of all national sales, indicating the size of the
Gauteng market and his region should yield a fair representation of what is to
be achieved in this study.
A self-developed questionnaire will be distributed to Architects and a non-
probability sampling technique, judgement sampling, will be used. Dangers
(2007) advised that there are about 1 800 registered architectural practices in
South Africa and a sample of the top 30 reputable architects in Gauteng will be
selected to answer the questionnaire. Corobrik will supply the sampling frame.
It is estimated by the Masters Building Association (MBA) that approximately
450 construction contractors are available in South Africa. It is not known how
many of them do business in the Gauteng Province; however, a total number
of at least thirty reputable contractors will be targeted to answer the
questionnaire.
There are a total of 24 reputable distributors of hardware, including face bricks,
in Gauteng, not only selling Corobrik products but also products from the
opposition. These Distributors constitute a total of 64 centres in Gauteng, i.e.
some distributors have more than one centre. An attempt will be made to
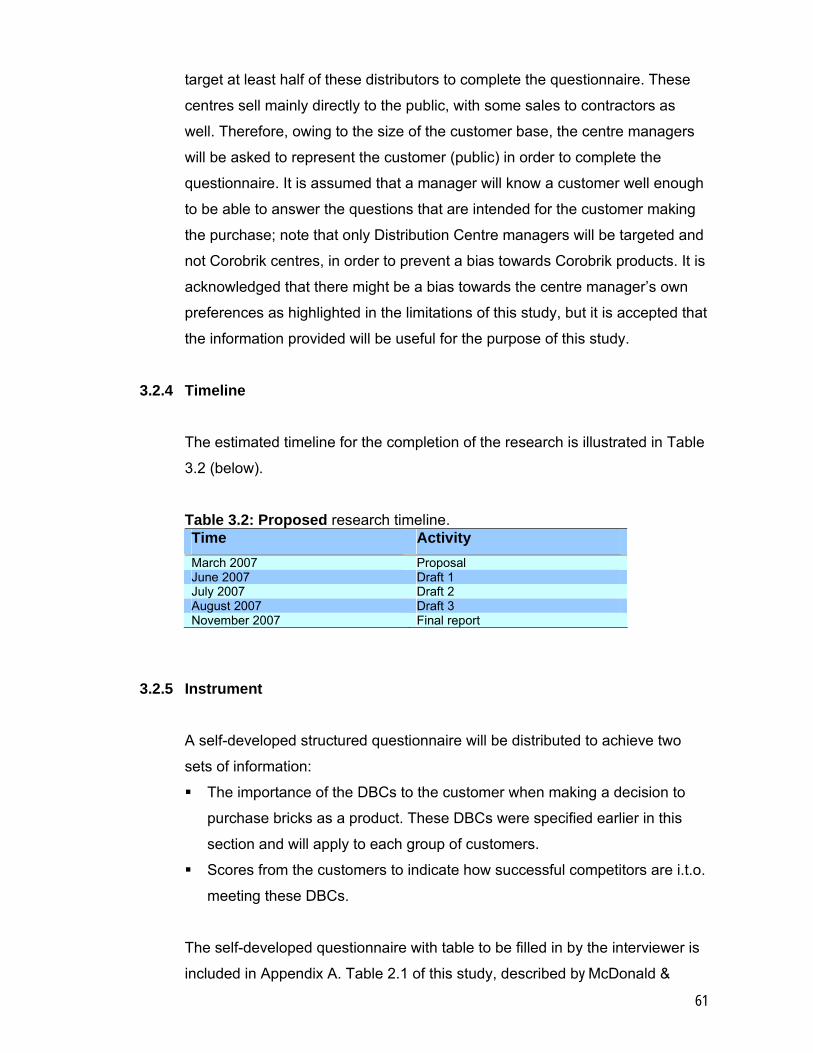
61
target at least half of these distributors to complete the questionnaire. These
centres sell mainly directly to the public, with some sales to contractors as
well. Therefore, owing to the size of the customer base, the centre managers
will be asked to represent the customer (public) in order to complete the
questionnaire. It is assumed that a manager will know a customer well enough
to be able to answer the questions that are intended for the customer making
the purchase; note that only Distribution Centre managers will be targeted and
not Corobrik centres, in order to prevent a bias towards Corobrik products. It is
acknowledged that there might be a bias towards the centre manager’s own
preferences as highlighted in the limitations of this study, but it is accepted that
the information provided will be useful for the purpose of this study.
3.2.4 Timeline
The estimated timeline for the completion of the research is illustrated in Table
3.2 (below).
Table 3.2: Proposed research timeline. Time Activity March 2007 Proposal June 2007 Draft 1 July 2007 Draft 2 August 2007 Draft 3 November 2007 Final report
3.2.5 Instrument
A self-developed structured questionnaire will be distributed to achieve two
sets of information:
The importance of the DBCs to the customer when making a decision to
purchase bricks as a product. These DBCs were specified earlier in this
section and will apply to each group of customers.
Scores from the customers to indicate how successful competitors are i.t.o.
meeting these DBCs.
The self-developed questionnaire with table to be filled in by the interviewer is
included in Appendix A. Table 2.1 of this study, described by McDonald &
62
Dunbar (2004), forms the basis of the instrument to be used and the
questionnaire has been designed to specifically address the information
required for the table. The questionnaire, in conjunction with the instrument,
has been utilised with the view of resolving the management problem. Only
two questions are asked, keeping in mind the length of the telephonic interview
and to only supply specific information. Question 1 deals with the importance
of the DBCs, and the relevant DBCs for this study have been obtained from
Dangers (2007). The relevant competitors of Corobrik have also been obtained
from Dangers (2007) and are part of the second question, which deals with
competitor performance. The scaling of the responses has also been provided
for in the questions and will be discussed later in this section.
Because a telephonic interview will be conducted, the questions need to be
easily understood and the answers need to be presented in a concise manner.
To obtain the information regarding the importance of the DBCs, the answer
from each respondent will be in the form of a fixed sum scale. Therefore, each
respondent will be asked to rate Price, Availability, Quality, Aesthetics and
Service in terms of importance when buying face bricks, and the total must
add up to 100. This scale is often used to record attitudes, behaviour and
behavioural intend (Cooper & Schindler, 2003) and automatically places the
data in a format that is compatible with percentages and makes it ideal for
weighting the DBC scores for each group of customer.
In order to compare the rival companies, each respondent must rate three
groups of competitors with regard to how they believe these competitors are
performing with respect to the above-mentioned DBCs. The information will be
reflected on a numerical scale from 1 to 10. A rating of 1 will indicate the
poorest performance possible, whereas a rating of 10 will indicate the best
possible performance of a competitor relating to the specific DBCs.
The information from this questionnaire will be utilised as described by McDonald & Dunbar (2004) in Table 2.1 of this study, as part of the
instrument. The importance rating will be used for weighting the DBCs in
accordance with the information from each group of customer. This weighting
will be an average for each DBC score from each customer group. Then the
63
average scores from each group of customers, relating to the competitor
performance, will be multiplied with the importance rating of the specific DBC
and will yield a weighted total for each competitor relating to that DBC. This
will be done for each group of customer. The total of the weighted scores will
yield a weighted average for each competitor and the one with the highest
score could be regarded as the market leader, as perceived by that group of
customers.
The competitors for this study will be Corobrik, Brickor, West End Brick and
African Brick. West End Brick and African Brick will be grouped together owing
to their size in terms of volume produced. Therefore, three main groups of
competitors will be compared.
3.2.6 Data analyses
From the questionnaire, three sets of tables will be generated and will
eventually be consolidated into one. The first set depicts the importance
ratings of the DBCs from the particular group being interviewed. The individual
ratings of the respondents are listed below each of the listed DBCs and should
total 100 when added horizontally. The scores for each DBC are averaged
vertically and represent the average importance rating for each DBC from a
specific group — the higher the rating, the higher the importance of that DBC
to that specific group.
The second set of tables represents the rating of Distributors, Contractors and
Architects with regard to their view of the performance of the various
competitors in relation to the relevant DBCs. The ratings of the individuals
representing the group regarding competitor performance are listed below the
relevant DBCs. These scores are averaged vertically in the table and
represent the performance of each competitor relating to the specific DBC as
perceived by the Distributors, Contractors or Architects depending on the
relevant group. A scale from 1 to 10 is provided for the ratings with a score of
1 indicating poor performance and10 indicating excellent performance.
64
Ultimately, the goal is to arrive at the third set of tables, which indicates the
competitive-strength evaluation. The information of the first two sets of tables
is consolidated with the DBCs listed below one another on the left-hand side of
the table and with the average DBC scores across them obtained from the
relevant group rating; this is referred to as the importance rating and will be
used as a weighting factor. This factor is multiplied with the corresponding
average competitor ratings to yield a weighted average for each DBC. Once
these weighted averages are added together, a total score for each competitor
is generated and is regarded as the market leader when the score is the
highest (perceived by Distributors, Contractors and Architects respectively).
The weighted average scores, relating to the competitors for each DBC, can
be compared within each group, as well as between groups, to pick up any
trends or significant differences.
The scores for each competitor within each group could be totalled and the
competitors could be compared in totality with one another. This, once again,
can be done within and between groups.
The results of the Architects’ and Contractors’ groups placed together will yield
a reflection of the customers’ views in the industrial and the commercial
market, whereas the Distributors’ group will yield the perception within the
residential market.
The main purpose of the table that will be constructed for each group is to
determine the ‘leader’, as perceived by that group, by comparing the total
scores of each competitor. Individual DBC scores per group for each
competitor will indicate specific shortcomings for a specific competitor. The
above information will be utilised to discuss the propositions made in this
study.
The instrument or method to be used for this study has not been validated,
although prescribed by McDonald & Dunbar (2004) to conduct a competitive-
strength evaluation.
65
3.3 LIMITATIONS OF THE STUDY
This study will be confined to the Gauteng Province and will not be done on a
national basis owing to the practicality of reaching all customers. The Gauteng
Region represents 44 per cent of Corobrik’s total revenue. Any marketing
strategy followed there will, therefore, have the biggest impact in the area and,
if successful, could be tested elsewhere.
Owing to a large customer base, only a sample of Architects, Contractors and
Centre Managers will be selected to represent the above-mentioned groups. It
must be noted that the centre managers of Distribution Centres will represent
the consumers of this market segment. This will be done owing to time and
customer-volume constraints. Note that only Distribution Centre Managers will
be targeted, and not Corobrik centres, in order to prevent a bias towards
Corobrik products.
It is assumed that the Distribution Centre Managers know their customers very
well and should, therefore, be a reliable source of information regarding the
preferences of the customers. However, a very important limitation of the study
should be pointed out, which is that a high probability exist that there will be
biases toward the centre managers’ own preferences and the true preferences
of the target group will not be reflected.
For the purpose of this study to investigate the industrial and commercial
market, the Developers will be excluded and only the Contractors (who
purchase the product) and the Architects (decision makers) will be involved.
Up to 70 per cent of the time, the Architect is the main person influencing the
decision of product choice and it should yield a reasonable representative
perspective from decision makers. This will be done because of time
constraints.
Currently, the economy is in a boom phase and this study could possibly show
different results when the economy is closer to, or in a recession phase.
66
Because of current high demands, the perception of availability, price, quality,
etc. may change when the economic climate changes.
The government segment will not be part of this study because of the
complexity of the decision-making process, since both the community and
Architects have a say in the product to be used.
This study will include only the main suppliers of clay brick, which includes
face brick, in Gauteng as competitors. Other, smaller clay-brick manufacturers
exist, but their product diversification is limited and customers may not even
know the supplier; consequently the results may be skewed. There are other
suppliers of building materials such as Glass, Aluminium and Plaster and Paint
but, for the purpose of this study, they will be excluded.

67
CHAPTER 4
4. RESULTS 4.1 PARTICIPATION ANALYSES OF GROUPS
There are 24 reputable distributors of hardware, which includes face bricks, in
Gauteng. These distributors have a total of 64 centres among them, i.e. some
distributors have more than one distribution centre.
A total of 12 distributors were contacted to participate in the questionnaire as a
representative of consumers; of these, a total of 8 replied, yielding a response
rate of 66.67 per cent. The unavailability of centre managers during the period
of interviews explains why a response rate of 100 per cent was not achieved.
The response represents 33.34 per cent of all the reputable distributors in
Gauteng and the analysis of the results could be meaningful, keeping in mind
the sample representation before any conclusions are drawn.
A total of 30 contractors were contacted for participation in this study. A total of
24 contractors participated in the telephonic interview, equating to a response
rate of 80 per cent. The unavailability of contract managers during the survey
period accounts for the ‘non-responses’. The Masters Building Association
(MBA) estimates that a total of 450 contractors are operating in South Africa
with regard to construction. It is unknown how many operate in Gauteng, but a
response of 24 reputable contractors in Gauteng can be considered sufficient
for this study to draw meaningful conclusions.
There are 1800 registered architectural practices in South Africa. Owing to
time constraints, the aim was to take a sample of the top 30 reputable
architects in Gauteng in order to complete the questionnaire. The response
from the architects was disappointing in two ways; firstly, the total response
rate was 50 per cent, with 15 of the planned 30 architectural companies
participating in the questionnaire. Secondly, the competitor scores were not
rated as thoroughly as they could have been, the main reason being that some

68
architectural firms were not prepared to rate any competitor, even if Corobrik
was the only supplier of face brick used. The interviewer does not know the
reason for this non-response and can only assume that those practices using
only Corobrik as a supplier of face brick regarded the competitor rating
irrelevant. It is, however, suspected that the Architects may not have had
much time at their disposal for such interviews. Most of the Architects had to
be contacted more than once before they could make themselves available to
complete the questionnaire. The results are presented in the next section, and
consideration of the response rate, as well as the quality of the responses
would be important before meaningful conclusions could be drawn and
recommendations are made.
4.2 RESEARCH RESULTS
A series of tables will be presented in this section, based on the results
obtained from the questionnaire. Firstly, the results from the Distributors will be
presented, followed by the Contractors and finally the Architects. Within each
of these groups, the average DBC rating of that group will be presented,
followed by the average competitor scores for each competitor; this
information will then be combined in a competitive-strength evaluation table for
each group. This will be done for all three groups in respect of the ratings of
the competitors, as well as the DBC scores.
An explanation will be given on how to read and interpret each table.
The first table within each group represents the importance ratings of the
DBCs from the particular group interviewed. The respondents of each group
are listed on the left-hand side of the table. Their individual ratings are listed
below each of the listed DBCs, and should total 100 when added up
horizontally. The scores for each DBC are averaged vertically. This average
score represents the average importance rating for each DBC from a specific
group. A high average indicates a high importance level for the specific group.
Tables 4.1, 4.6 and 4.11 depict the results of the importance ratings of the
DBCs of the Distributors, Contractors and Architects respectively.
69
The Distributors, Contractors and Architects had to rate each competitor on
how they perceive the competitors' performance with regard to the listed
DBCs. These results are presented in tables 4.2, 4.3, 4.4, 4.7, 4.8, 4.9, 4.12,
4.13 and 4.14. The individuals representing each group are, once again, listed
and their scores listed horizontally, underneath each relevant DBC. The scores
are averaged vertically and represent the performance of each competitor
relating to the specific DBC as perceived by the Distributors, Contractors or
Architects depending on the relevant group. The rating scale makes provision
for a score from 1 (poor performance) to 10 (maximum rating) and, therefore, a
maximum average of 10 can be achieved. A comparison of the average scores
of competitors within each group can be done for analysis purposes.
From the average DBC scores and competitor ratings, a consolidated
competitive-strength evaluation table can be constructed to represent the
views of Distributors, Contractors and Architects respectively. This information
is presented in tables 4.5, 4.10 and 4.15. The DBCs are listed on the left side
of the table, with the average DBC scores, obtained from the relevant group
rating, across them. The average performance ratings of the competitors, by
the relevant group, are listed across from each DBC under the related
competitor heading. The average DBC rating, or importance rating, is used as
a weighting factor and is multiplied with the corresponding competitor ratings
to yield a weighted average for each DBC (listed below all the competitor
headings). These weighted averages are added together in order to arrive at a
total score for each competitor, and the one with the highest score is regarded
as the market leader (as perceived by the particular group).
The aim is, therefore, to arrive at a competitive-strength evaluation table to
determine the market leader for each group, and then to analyse the DBC
ratings and competitor ratings from the groups for trends or patterns.
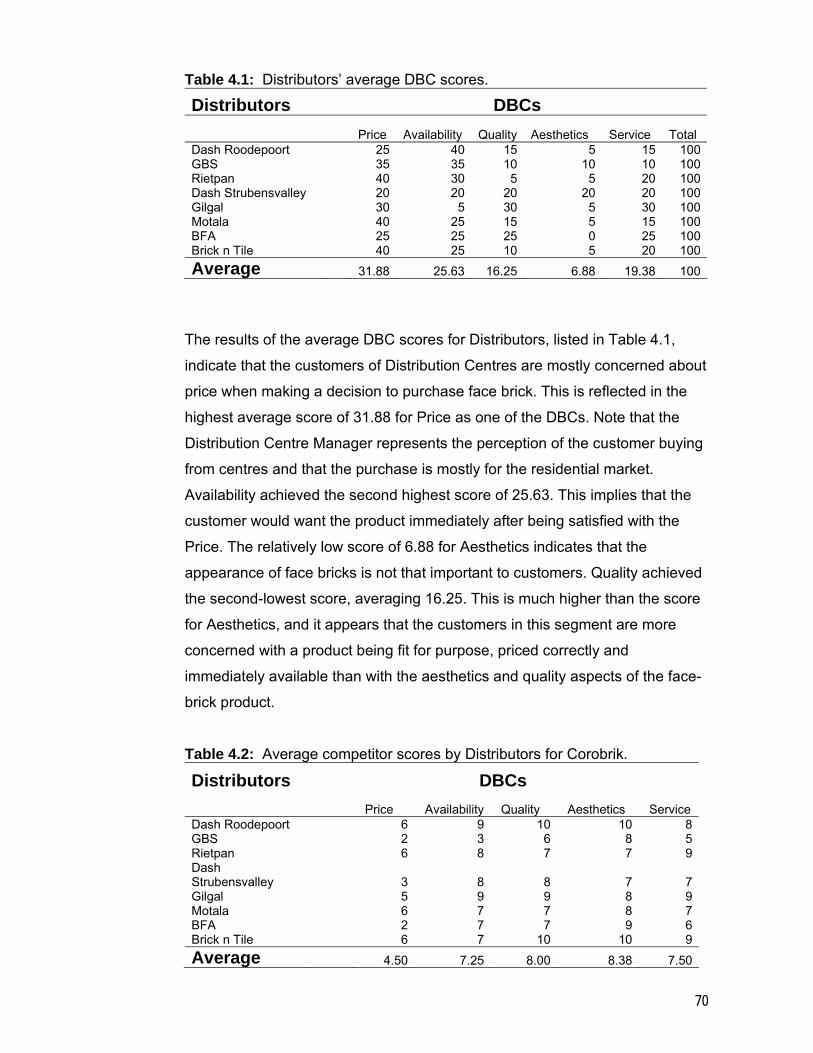
70
Table 4.1: Distributors’ average DBC scores.
Distributors DBCs
Price Availability Quality Aesthetics Service Total Dash Roodepoort 25 40 15 5 15 100GBS 35 35 10 10 10 100Rietpan 40 30 5 5 20 100Dash Strubensvalley 20 20 20 20 20 100Gilgal 30 5 30 5 30 100Motala 40 25 15 5 15 100BFA 25 25 25 0 25 100Brick n Tile 40 25 10 5 20 100Average 31.88 25.63 16.25 6.88 19.38 100
The results of the average DBC scores for Distributors, listed in Table 4.1,
indicate that the customers of Distribution Centres are mostly concerned about
price when making a decision to purchase face brick. This is reflected in the
highest average score of 31.88 for Price as one of the DBCs. Note that the
Distribution Centre Manager represents the perception of the customer buying
from centres and that the purchase is mostly for the residential market.
Availability achieved the second highest score of 25.63. This implies that the
customer would want the product immediately after being satisfied with the
Price. The relatively low score of 6.88 for Aesthetics indicates that the
appearance of face bricks is not that important to customers. Quality achieved
the second-lowest score, averaging 16.25. This is much higher than the score
for Aesthetics, and it appears that the customers in this segment are more
concerned with a product being fit for purpose, priced correctly and
immediately available than with the aesthetics and quality aspects of the face-
brick product.
Table 4.2: Average competitor scores by Distributors for Corobrik.
Distributors DBCs
Price Availability Quality Aesthetics Service Dash Roodepoort 6 9 10 10 8GBS 2 3 6 8 5Rietpan 6 8 7 7 9Dash Strubensvalley 3 8 8 7 7Gilgal 5 9 9 8 9Motala 6 7 7 8 7BFA 2 7 7 9 6Brick n Tile 6 7 10 10 9Average 4.50 7.25 8.00 8.38 7.50
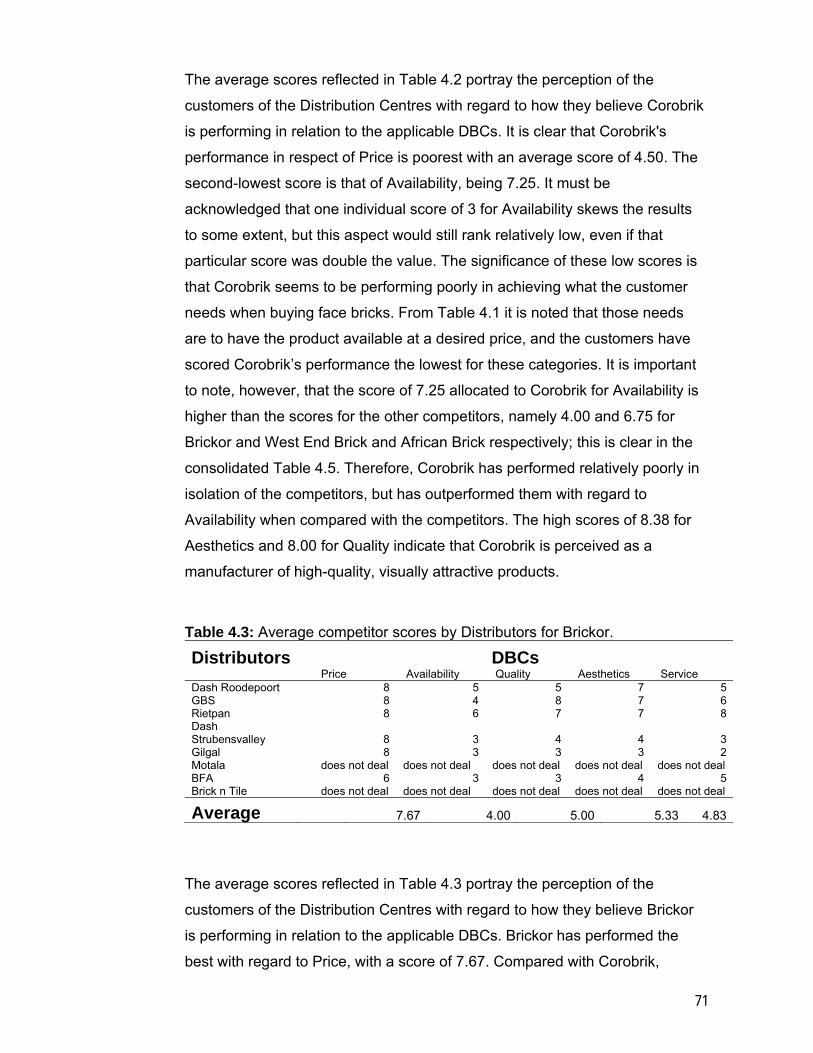
71
The average scores reflected in Table 4.2 portray the perception of the
customers of the Distribution Centres with regard to how they believe Corobrik
is performing in relation to the applicable DBCs. It is clear that Corobrik's
performance in respect of Price is poorest with an average score of 4.50. The
second-lowest score is that of Availability, being 7.25. It must be
acknowledged that one individual score of 3 for Availability skews the results
to some extent, but this aspect would still rank relatively low, even if that
particular score was double the value. The significance of these low scores is
that Corobrik seems to be performing poorly in achieving what the customer
needs when buying face bricks. From Table 4.1 it is noted that those needs
are to have the product available at a desired price, and the customers have
scored Corobrik’s performance the lowest for these categories. It is important
to note, however, that the score of 7.25 allocated to Corobrik for Availability is
higher than the scores for the other competitors, namely 4.00 and 6.75 for
Brickor and West End Brick and African Brick respectively; this is clear in the
consolidated Table 4.5. Therefore, Corobrik has performed relatively poorly in
isolation of the competitors, but has outperformed them with regard to
Availability when compared with the competitors. The high scores of 8.38 for
Aesthetics and 8.00 for Quality indicate that Corobrik is perceived as a
manufacturer of high-quality, visually attractive products.
Table 4.3: Average competitor scores by Distributors for Brickor.
Distributors DBCs Price Availability Quality Aesthetics Service Dash Roodepoort 8 5 5 7 5 GBS 8 4 8 7 6 Rietpan 8 6 7 7 8 Dash Strubensvalley 8 3 4 4 3 Gilgal 8 3 3 3 2 Motala does not deal does not deal does not deal does not deal does not deal BFA 6 3 3 4 5 Brick n Tile does not deal does not deal does not deal does not deal does not deal
Average 7.67 4.00 5.00 5.33 4.83
The average scores reflected in Table 4.3 portray the perception of the
customers of the Distribution Centres with regard to how they believe Brickor
is performing in relation to the applicable DBCs. Brickor has performed the
best with regard to Price, with a score of 7.67. Compared with Corobrik,
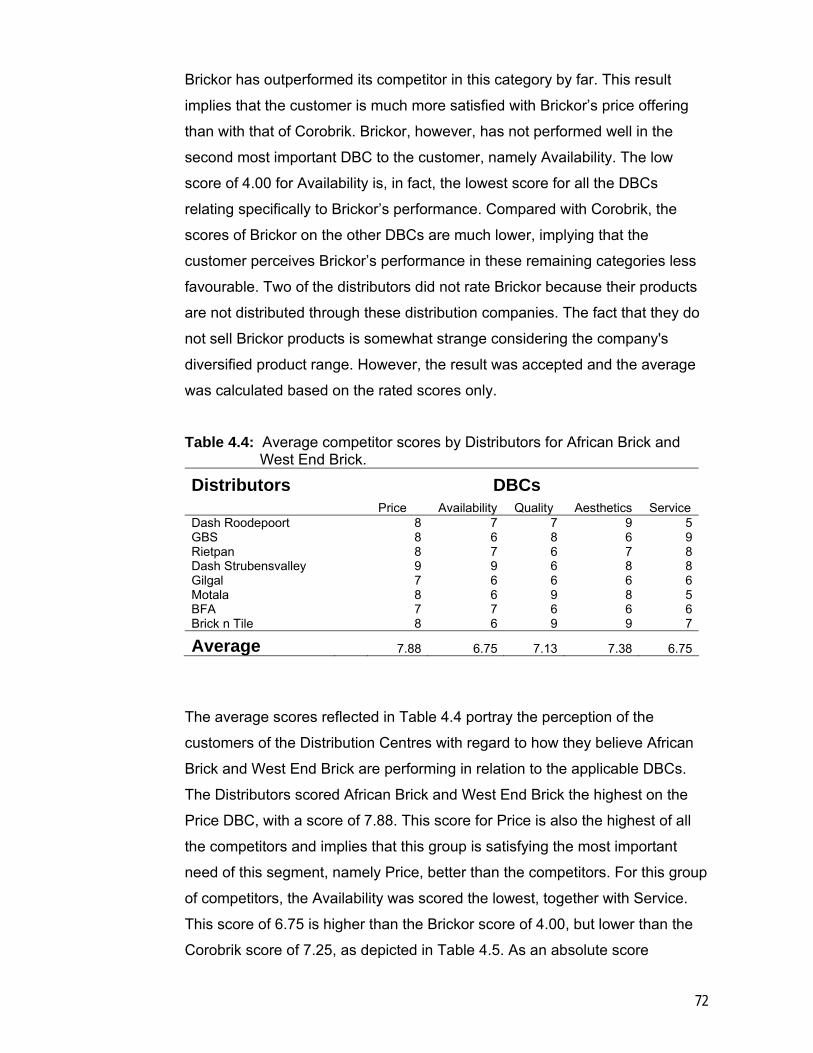
72
Brickor has outperformed its competitor in this category by far. This result
implies that the customer is much more satisfied with Brickor’s price offering
than with that of Corobrik. Brickor, however, has not performed well in the
second most important DBC to the customer, namely Availability. The low
score of 4.00 for Availability is, in fact, the lowest score for all the DBCs
relating specifically to Brickor’s performance. Compared with Corobrik, the
scores of Brickor on the other DBCs are much lower, implying that the
customer perceives Brickor’s performance in these remaining categories less
favourable. Two of the distributors did not rate Brickor because their products
are not distributed through these distribution companies. The fact that they do
not sell Brickor products is somewhat strange considering the company's
diversified product range. However, the result was accepted and the average
was calculated based on the rated scores only.
Table 4.4: Average competitor scores by Distributors for African Brick and
West End Brick.
Distributors DBCs Price Availability Quality Aesthetics Service Dash Roodepoort 8 7 7 9 5GBS 8 6 8 6 9Rietpan 8 7 6 7 8Dash Strubensvalley 9 9 6 8 8Gilgal 7 6 6 6 6Motala 8 6 9 8 5BFA 7 7 6 6 6Brick n Tile 8 6 9 9 7
Average 7.88 6.75 7.13 7.38 6.75
The average scores reflected in Table 4.4 portray the perception of the
customers of the Distribution Centres with regard to how they believe African
Brick and West End Brick are performing in relation to the applicable DBCs.
The Distributors scored African Brick and West End Brick the highest on the
Price DBC, with a score of 7.88. This score for Price is also the highest of all
the competitors and implies that this group is satisfying the most important
need of this segment, namely Price, better than the competitors. For this group
of competitors, the Availability was scored the lowest, together with Service.
This score of 6.75 is higher than the Brickor score of 4.00, but lower than the
Corobrik score of 7.25, as depicted in Table 4.5. As an absolute score
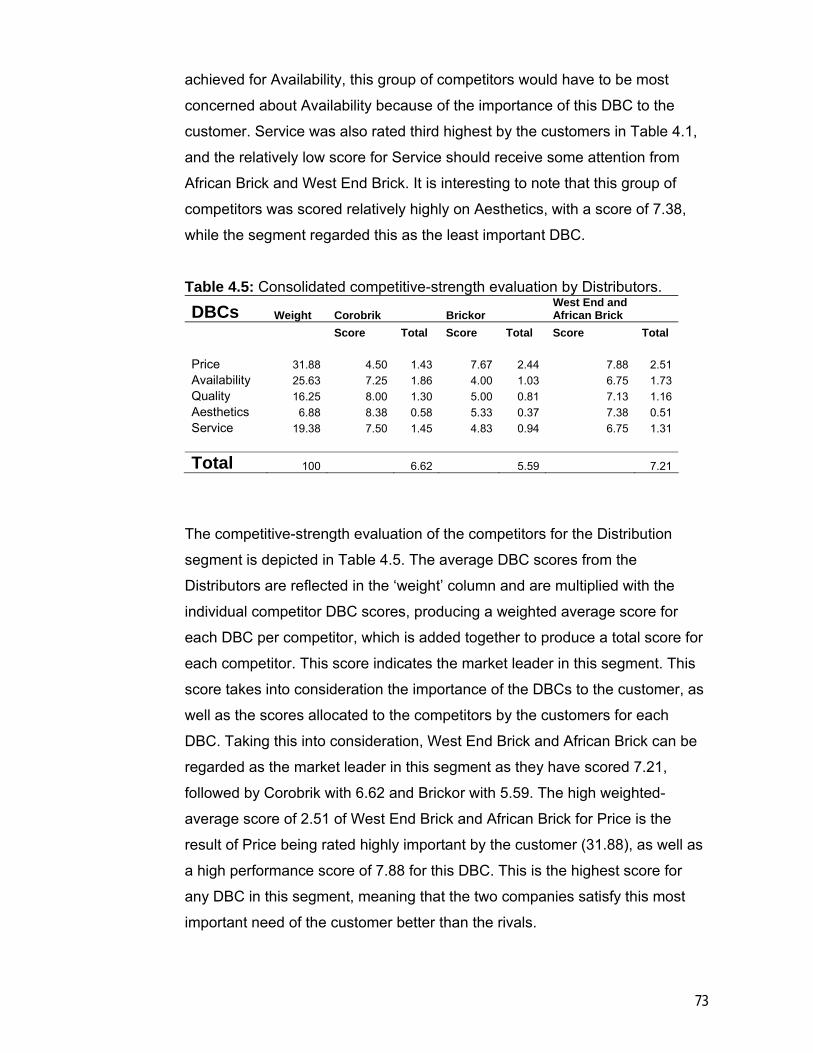
73
achieved for Availability, this group of competitors would have to be most
concerned about Availability because of the importance of this DBC to the
customer. Service was also rated third highest by the customers in Table 4.1,
and the relatively low score for Service should receive some attention from
African Brick and West End Brick. It is interesting to note that this group of
competitors was scored relatively highly on Aesthetics, with a score of 7.38,
while the segment regarded this as the least important DBC.
Table 4.5: Consolidated competitive-strength evaluation by Distributors.
DBCs Weight Corobrik Brickor West End and African Brick
Score Total Score Total Score Total Price 31.88 4.50 1.43 7.67 2.44 7.88 2.51 Availability 25.63 7.25 1.86 4.00 1.03 6.75 1.73 Quality 16.25 8.00 1.30 5.00 0.81 7.13 1.16 Aesthetics 6.88 8.38 0.58 5.33 0.37 7.38 0.51 Service 19.38 7.50 1.45 4.83 0.94 6.75 1.31
Total 100 6.62 5.59 7.21
The competitive-strength evaluation of the competitors for the Distribution
segment is depicted in Table 4.5. The average DBC scores from the
Distributors are reflected in the ‘weight’ column and are multiplied with the
individual competitor DBC scores, producing a weighted average score for
each DBC per competitor, which is added together to produce a total score for
each competitor. This score indicates the market leader in this segment. This
score takes into consideration the importance of the DBCs to the customer, as
well as the scores allocated to the competitors by the customers for each
DBC. Taking this into consideration, West End Brick and African Brick can be
regarded as the market leader in this segment as they have scored 7.21,
followed by Corobrik with 6.62 and Brickor with 5.59. The high weighted-
average score of 2.51 of West End Brick and African Brick for Price is the
result of Price being rated highly important by the customer (31.88), as well as
a high performance score of 7.88 for this DBC. This is the highest score for
any DBC in this segment, meaning that the two companies satisfy this most
important need of the customer better than the rivals.
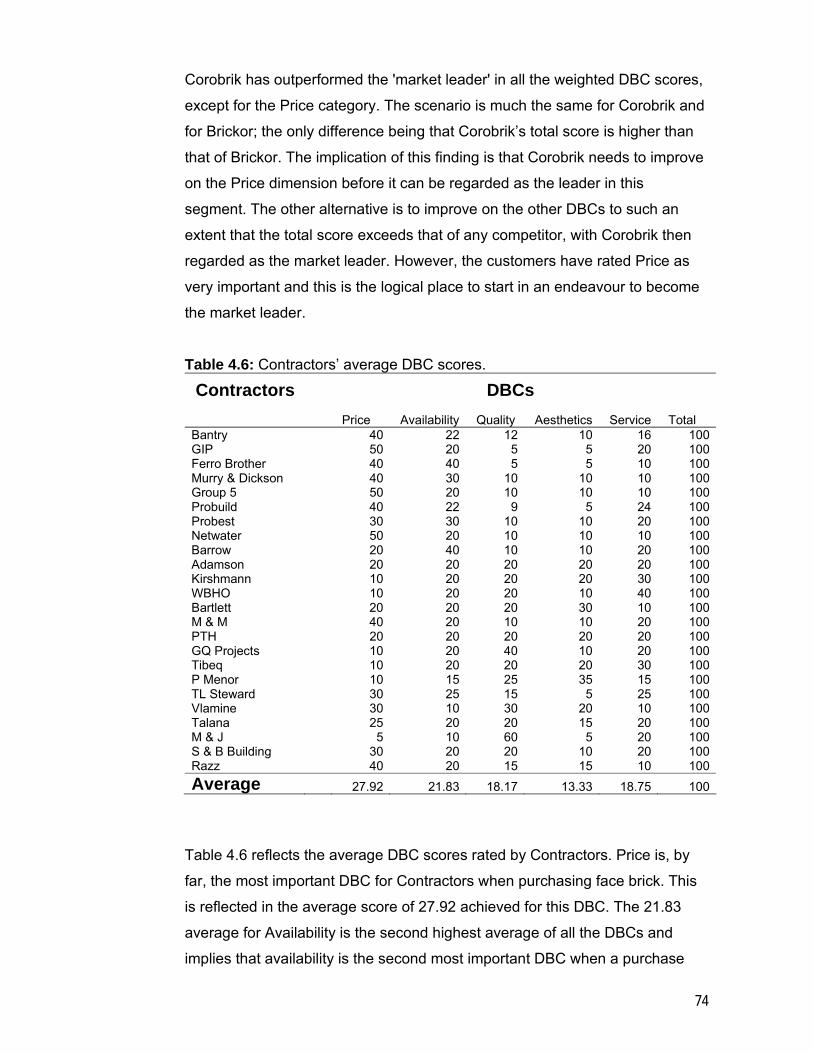
74
Corobrik has outperformed the 'market leader' in all the weighted DBC scores,
except for the Price category. The scenario is much the same for Corobrik and
for Brickor; the only difference being that Corobrik’s total score is higher than
that of Brickor. The implication of this finding is that Corobrik needs to improve
on the Price dimension before it can be regarded as the leader in this
segment. The other alternative is to improve on the other DBCs to such an
extent that the total score exceeds that of any competitor, with Corobrik then
regarded as the market leader. However, the customers have rated Price as
very important and this is the logical place to start in an endeavour to become
the market leader.
Table 4.6: Contractors’ average DBC scores.
Contractors DBCs
Price Availability Quality Aesthetics Service Total Bantry 40 22 12 10 16 100GIP 50 20 5 5 20 100Ferro Brother 40 40 5 5 10 100Murry & Dickson 40 30 10 10 10 100Group 5 50 20 10 10 10 100Probuild 40 22 9 5 24 100Probest 30 30 10 10 20 100Netwater 50 20 10 10 10 100Barrow 20 40 10 10 20 100Adamson 20 20 20 20 20 100Kirshmann 10 20 20 20 30 100WBHO 10 20 20 10 40 100Bartlett 20 20 20 30 10 100M & M 40 20 10 10 20 100PTH 20 20 20 20 20 100GQ Projects 10 20 40 10 20 100Tibeq 10 20 20 20 30 100P Menor 10 15 25 35 15 100TL Steward 30 25 15 5 25 100Vlamine 30 10 30 20 10 100Talana 25 20 20 15 20 100M & J 5 10 60 5 20 100S & B Building 30 20 20 10 20 100Razz 40 20 15 15 10 100Average 27.92 21.83 18.17 13.33 18.75 100
Table 4.6 reflects the average DBC scores rated by Contractors. Price is, by
far, the most important DBC for Contractors when purchasing face brick. This
is reflected in the average score of 27.92 achieved for this DBC. The 21.83
average for Availability is the second highest average of all the DBCs and
implies that availability is the second most important DBC when a purchase
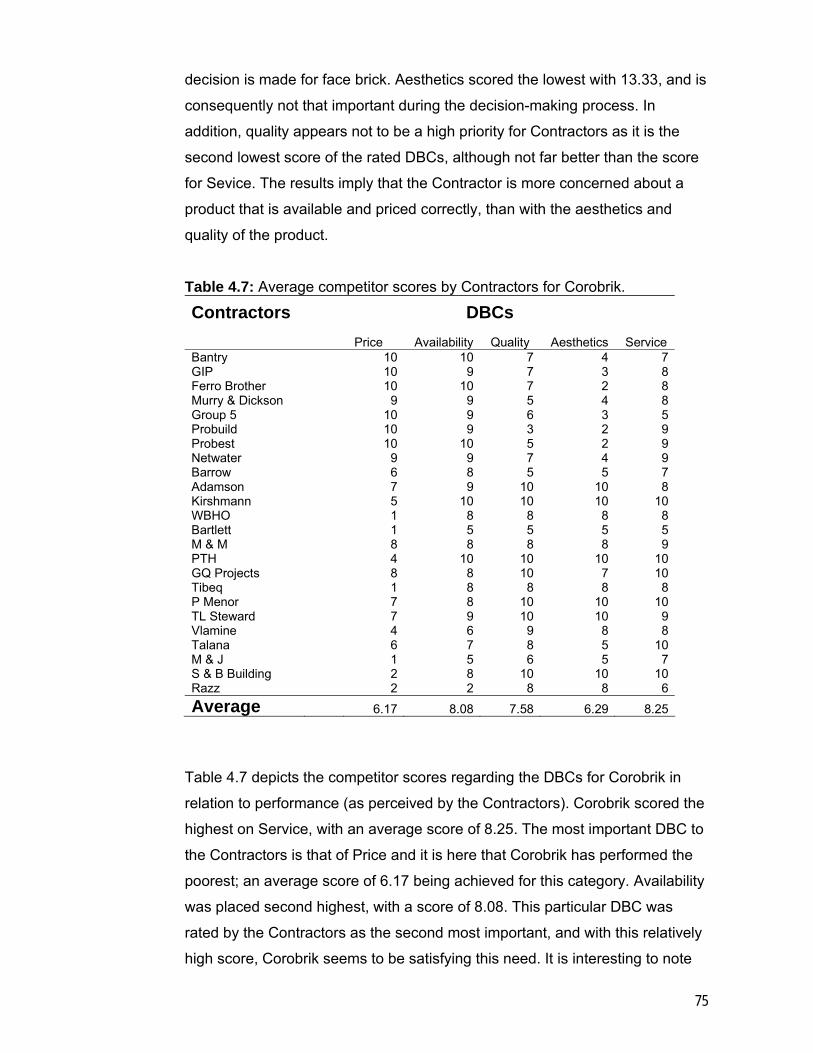
75
decision is made for face brick. Aesthetics scored the lowest with 13.33, and is
consequently not that important during the decision-making process. In
addition, quality appears not to be a high priority for Contractors as it is the
second lowest score of the rated DBCs, although not far better than the score
for Sevice. The results imply that the Contractor is more concerned about a
product that is available and priced correctly, than with the aesthetics and
quality of the product.
Table 4.7: Average competitor scores by Contractors for Corobrik.
Contractors DBCs
Price Availability Quality Aesthetics Service Bantry 10 10 7 4 7GIP 10 9 7 3 8Ferro Brother 10 10 7 2 8Murry & Dickson 9 9 5 4 8Group 5 10 9 6 3 5Probuild 10 9 3 2 9Probest 10 10 5 2 9Netwater 9 9 7 4 9Barrow 6 8 5 5 7Adamson 7 9 10 10 8Kirshmann 5 10 10 10 10WBHO 1 8 8 8 8Bartlett 1 5 5 5 5M & M 8 8 8 8 9PTH 4 10 10 10 10GQ Projects 8 8 10 7 10Tibeq 1 8 8 8 8P Menor 7 8 10 10 10TL Steward 7 9 10 10 9Vlamine 4 6 9 8 8Talana 6 7 8 5 10M & J 1 5 6 5 7S & B Building 2 8 10 10 10Razz 2 2 8 8 6Average 6.17 8.08 7.58 6.29 8.25
Table 4.7 depicts the competitor scores regarding the DBCs for Corobrik in
relation to performance (as perceived by the Contractors). Corobrik scored the
highest on Service, with an average score of 8.25. The most important DBC to
the Contractors is that of Price and it is here that Corobrik has performed the
poorest; an average score of 6.17 being achieved for this category. Availability
was placed second highest, with a score of 8.08. This particular DBC was
rated by the Contractors as the second most important, and with this relatively
high score, Corobrik seems to be satisfying this need. It is interesting to note
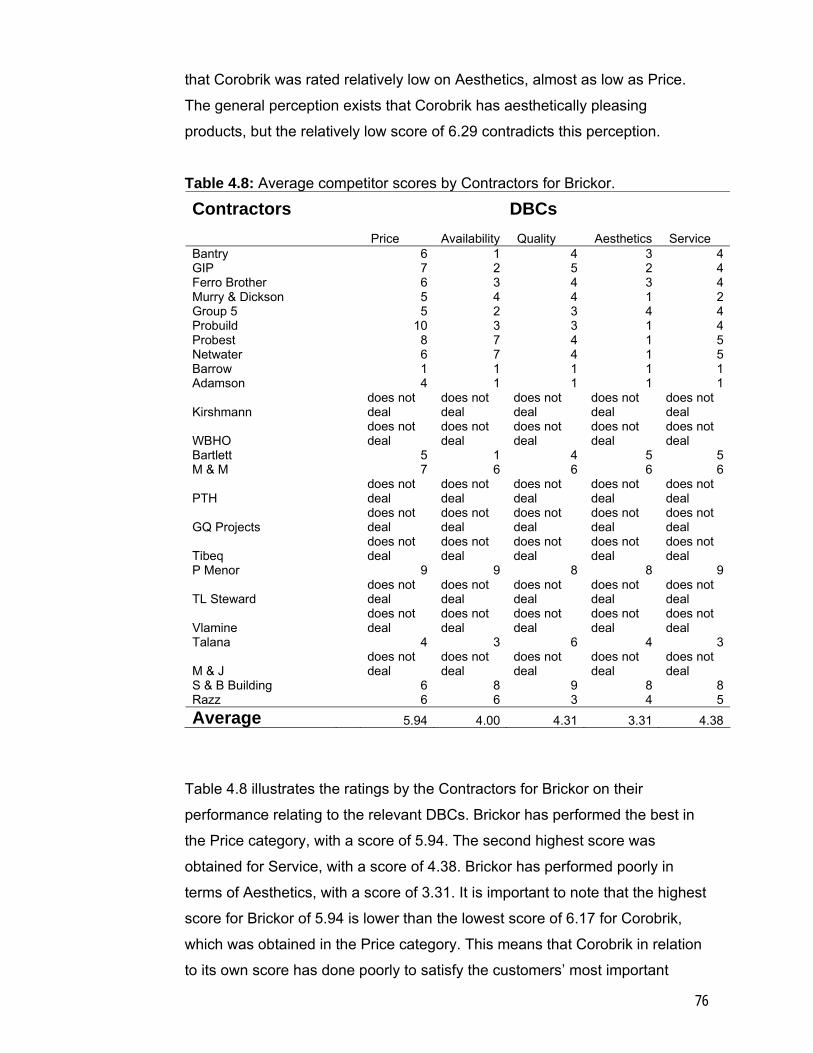
76
that Corobrik was rated relatively low on Aesthetics, almost as low as Price.
The general perception exists that Corobrik has aesthetically pleasing
products, but the relatively low score of 6.29 contradicts this perception.
Table 4.8: Average competitor scores by Contractors for Brickor.
Contractors DBCs
Price Availability Quality Aesthetics Service Bantry 6 1 4 3 4GIP 7 2 5 2 4Ferro Brother 6 3 4 3 4Murry & Dickson 5 4 4 1 2Group 5 5 2 3 4 4Probuild 10 3 3 1 4Probest 8 7 4 1 5Netwater 6 7 4 1 5Barrow 1 1 1 1 1Adamson 4 1 1 1 1
Kirshmann does not deal
does not deal
does not deal
does not deal
does not deal
WBHO does not deal
does not deal
does not deal
does not deal
does not deal
Bartlett 5 1 4 5 5M & M 7 6 6 6 6
PTH does not deal
does not deal
does not deal
does not deal
does not deal
GQ Projects does not deal
does not deal
does not deal
does not deal
does not deal
Tibeq does not deal
does not deal
does not deal
does not deal
does not deal
P Menor 9 9 8 8 9
TL Steward does not deal
does not deal
does not deal
does not deal
does not deal
Vlamine does not deal
does not deal
does not deal
does not deal
does not deal
Talana 4 3 6 4 3
M & J does not deal
does not deal
does not deal
does not deal
does not deal
S & B Building 6 8 9 8 8Razz 6 6 3 4 5Average 5.94 4.00 4.31 3.31 4.38
Table 4.8 illustrates the ratings by the Contractors for Brickor on their
performance relating to the relevant DBCs. Brickor has performed the best in
the Price category, with a score of 5.94. The second highest score was
obtained for Service, with a score of 4.38. Brickor has performed poorly in
terms of Aesthetics, with a score of 3.31. It is important to note that the highest
score for Brickor of 5.94 is lower than the lowest score of 6.17 for Corobrik,
which was obtained in the Price category. This means that Corobrik in relation
to its own score has done poorly to satisfy the customers’ most important
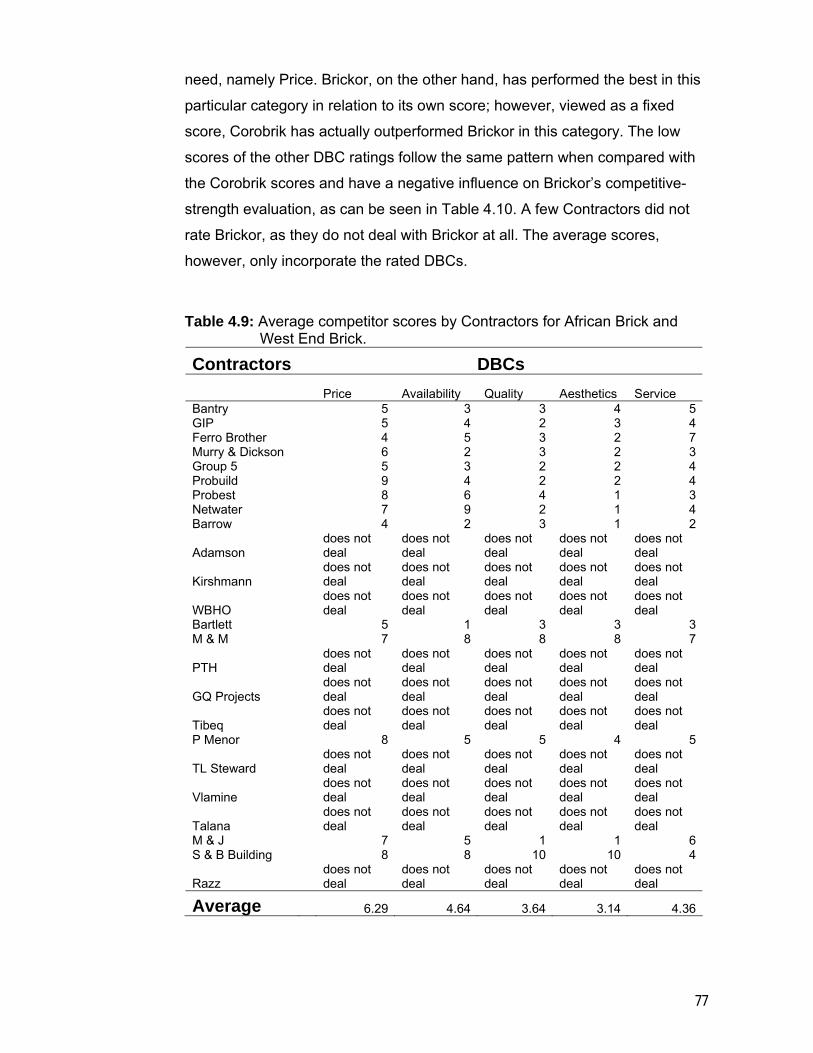
77
need, namely Price. Brickor, on the other hand, has performed the best in this
particular category in relation to its own score; however, viewed as a fixed
score, Corobrik has actually outperformed Brickor in this category. The low
scores of the other DBC ratings follow the same pattern when compared with
the Corobrik scores and have a negative influence on Brickor’s competitive-
strength evaluation, as can be seen in Table 4.10. A few Contractors did not
rate Brickor, as they do not deal with Brickor at all. The average scores,
however, only incorporate the rated DBCs.
Table 4.9: Average competitor scores by Contractors for African Brick and West End Brick.
Contractors DBCs
Price Availability Quality Aesthetics Service Bantry 5 3 3 4 5GIP 5 4 2 3 4Ferro Brother 4 5 3 2 7Murry & Dickson 6 2 3 2 3Group 5 5 3 2 2 4Probuild 9 4 2 2 4Probest 8 6 4 1 3Netwater 7 9 2 1 4Barrow 4 2 3 1 2
Adamson does not deal
does not deal
does not deal
does not deal
does not deal
Kirshmann does not deal
does not deal
does not deal
does not deal
does not deal
WBHO does not deal
does not deal
does not deal
does not deal
does not deal
Bartlett 5 1 3 3 3M & M 7 8 8 8 7
PTH does not deal
does not deal
does not deal
does not deal
does not deal
GQ Projects does not deal
does not deal
does not deal
does not deal
does not deal
Tibeq does not deal
does not deal
does not deal
does not deal
does not deal
P Menor 8 5 5 4 5
TL Steward does not deal
does not deal
does not deal
does not deal
does not deal
Vlamine does not deal
does not deal
does not deal
does not deal
does not deal
Talana does not deal
does not deal
does not deal
does not deal
does not deal
M & J 7 5 1 1 6S & B Building 8 8 10 10 4
Razz does not deal
does not deal
does not deal
does not deal
does not deal
Average 6.29 4.64 3.64 3.14 4.36
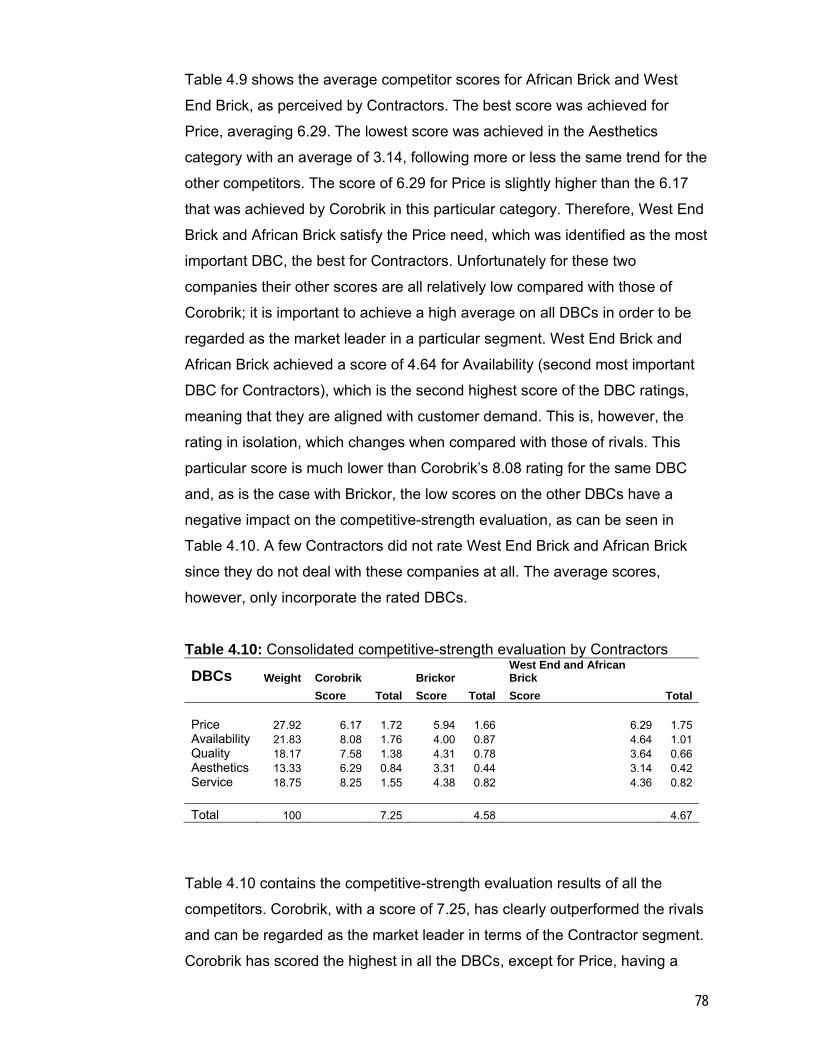
78
Table 4.9 shows the average competitor scores for African Brick and West
End Brick, as perceived by Contractors. The best score was achieved for
Price, averaging 6.29. The lowest score was achieved in the Aesthetics
category with an average of 3.14, following more or less the same trend for the
other competitors. The score of 6.29 for Price is slightly higher than the 6.17
that was achieved by Corobrik in this particular category. Therefore, West End
Brick and African Brick satisfy the Price need, which was identified as the most
important DBC, the best for Contractors. Unfortunately for these two
companies their other scores are all relatively low compared with those of
Corobrik; it is important to achieve a high average on all DBCs in order to be
regarded as the market leader in a particular segment. West End Brick and
African Brick achieved a score of 4.64 for Availability (second most important
DBC for Contractors), which is the second highest score of the DBC ratings,
meaning that they are aligned with customer demand. This is, however, the
rating in isolation, which changes when compared with those of rivals. This
particular score is much lower than Corobrik’s 8.08 rating for the same DBC
and, as is the case with Brickor, the low scores on the other DBCs have a
negative impact on the competitive-strength evaluation, as can be seen in
Table 4.10. A few Contractors did not rate West End Brick and African Brick
since they do not deal with these companies at all. The average scores,
however, only incorporate the rated DBCs.
Table 4.10: Consolidated competitive-strength evaluation by Contractors
DBCs Weight Corobrik Brickor West End and African Brick
Score Total Score Total Score Total Price 27.92 6.17 1.72 5.94 1.66 6.29 1.75 Availability 21.83 8.08 1.76 4.00 0.87 4.64 1.01 Quality 18.17 7.58 1.38 4.31 0.78 3.64 0.66 Aesthetics 13.33 6.29 0.84 3.31 0.44 3.14 0.42 Service 18.75 8.25 1.55 4.38 0.82 4.36 0.82 Total 100 7.25 4.58 4.67
Table 4.10 contains the competitive-strength evaluation results of all the
competitors. Corobrik, with a score of 7.25, has clearly outperformed the rivals
and can be regarded as the market leader in terms of the Contractor segment.
Corobrik has scored the highest in all the DBCs, except for Price, having a
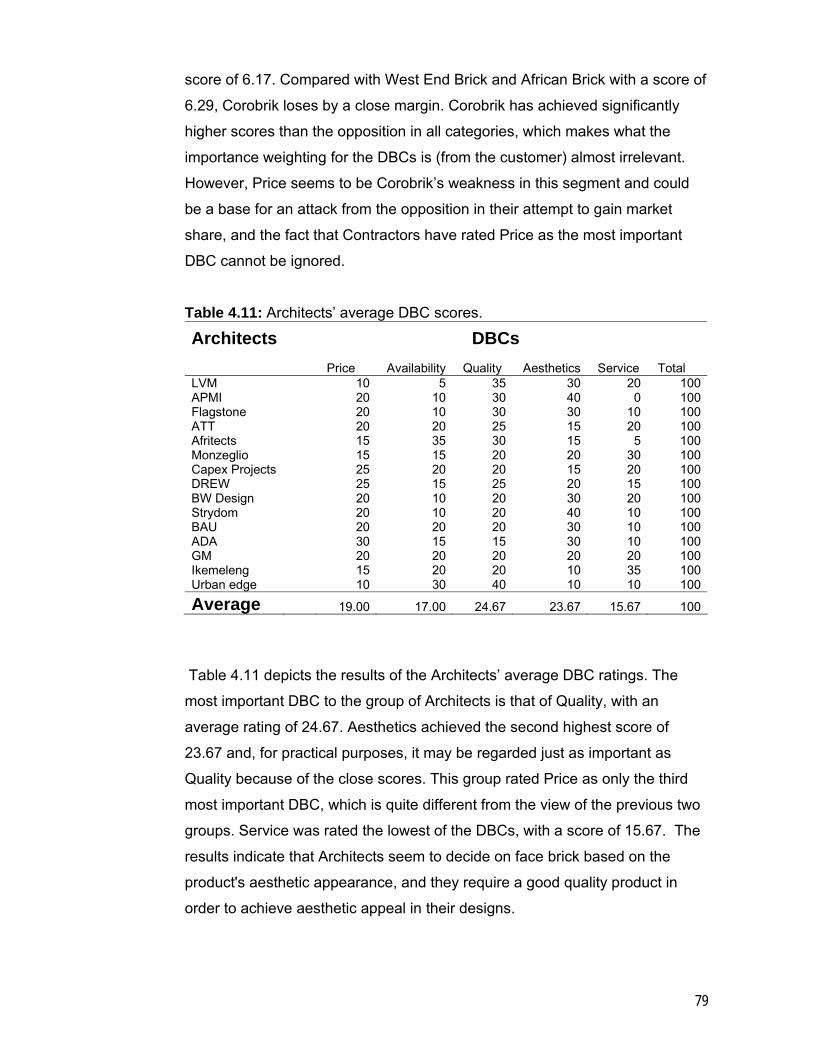
79
score of 6.17. Compared with West End Brick and African Brick with a score of
6.29, Corobrik loses by a close margin. Corobrik has achieved significantly
higher scores than the opposition in all categories, which makes what the
importance weighting for the DBCs is (from the customer) almost irrelevant.
However, Price seems to be Corobrik’s weakness in this segment and could
be a base for an attack from the opposition in their attempt to gain market
share, and the fact that Contractors have rated Price as the most important
DBC cannot be ignored.
Table 4.11: Architects’ average DBC scores.
Architects DBCs
Price Availability Quality Aesthetics Service Total LVM 10 5 35 30 20 100APMI 20 10 30 40 0 100Flagstone 20 10 30 30 10 100ATT 20 20 25 15 20 100Afritects 15 35 30 15 5 100Monzeglio 15 15 20 20 30 100Capex Projects 25 20 20 15 20 100DREW 25 15 25 20 15 100BW Design 20 10 20 30 20 100Strydom 20 10 20 40 10 100BAU 20 20 20 30 10 100ADA 30 15 15 30 10 100GM 20 20 20 20 20 100Ikemeleng 15 20 20 10 35 100Urban edge 10 30 40 10 10 100
Average 19.00 17.00 24.67 23.67 15.67 100
Table 4.11 depicts the results of the Architects’ average DBC ratings. The
most important DBC to the group of Architects is that of Quality, with an
average rating of 24.67. Aesthetics achieved the second highest score of
23.67 and, for practical purposes, it may be regarded just as important as
Quality because of the close scores. This group rated Price as only the third
most important DBC, which is quite different from the view of the previous two
groups. Service was rated the lowest of the DBCs, with a score of 15.67. The
results indicate that Architects seem to decide on face brick based on the
product's aesthetic appearance, and they require a good quality product in
order to achieve aesthetic appeal in their designs.
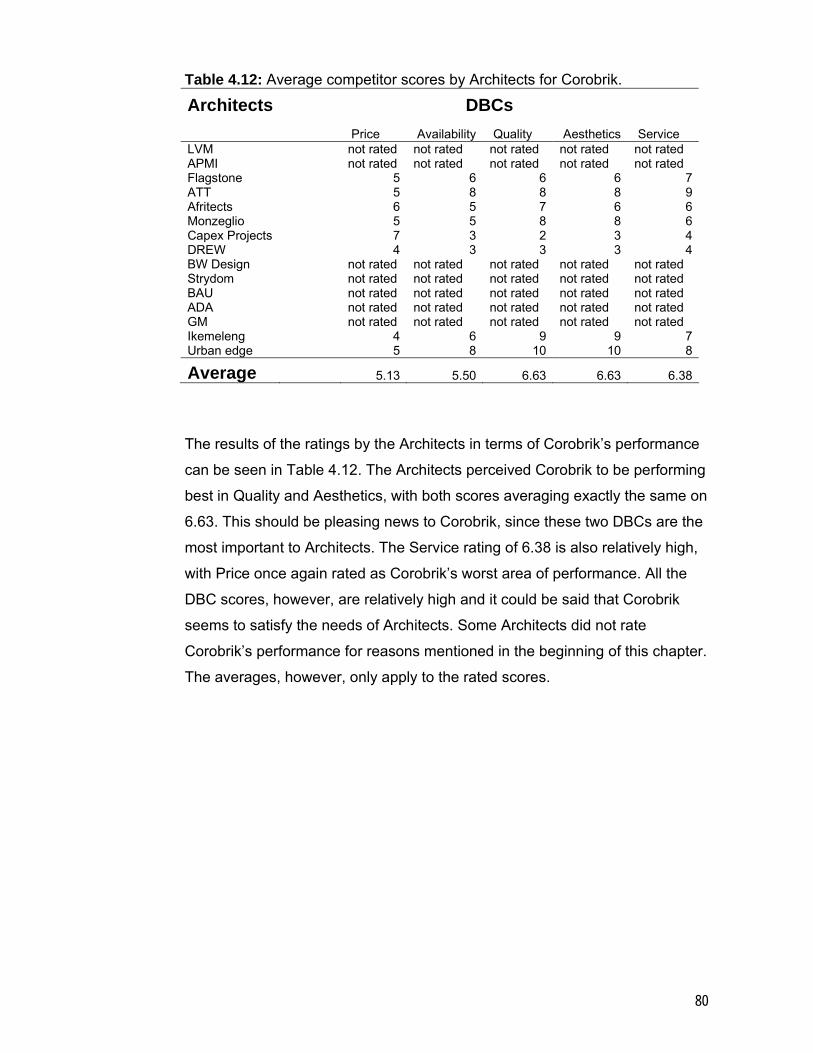
80
Table 4.12: Average competitor scores by Architects for Corobrik.
Architects DBCs
Price Availability Quality Aesthetics Service LVM not rated not rated not rated not rated not rated APMI not rated not rated not rated not rated not rated Flagstone 5 6 6 6 7ATT 5 8 8 8 9Afritects 6 5 7 6 6Monzeglio 5 5 8 8 6Capex Projects 7 3 2 3 4DREW 4 3 3 3 4BW Design not rated not rated not rated not rated not rated Strydom not rated not rated not rated not rated not rated BAU not rated not rated not rated not rated not rated ADA not rated not rated not rated not rated not rated GM not rated not rated not rated not rated not rated Ikemeleng 4 6 9 9 7Urban edge 5 8 10 10 8
Average 5.13 5.50 6.63 6.63 6.38
The results of the ratings by the Architects in terms of Corobrik’s performance
can be seen in Table 4.12. The Architects perceived Corobrik to be performing
best in Quality and Aesthetics, with both scores averaging exactly the same on
6.63. This should be pleasing news to Corobrik, since these two DBCs are the
most important to Architects. The Service rating of 6.38 is also relatively high,
with Price once again rated as Corobrik’s worst area of performance. All the
DBC scores, however, are relatively high and it could be said that Corobrik
seems to satisfy the needs of Architects. Some Architects did not rate
Corobrik’s performance for reasons mentioned in the beginning of this chapter.
The averages, however, only apply to the rated scores.
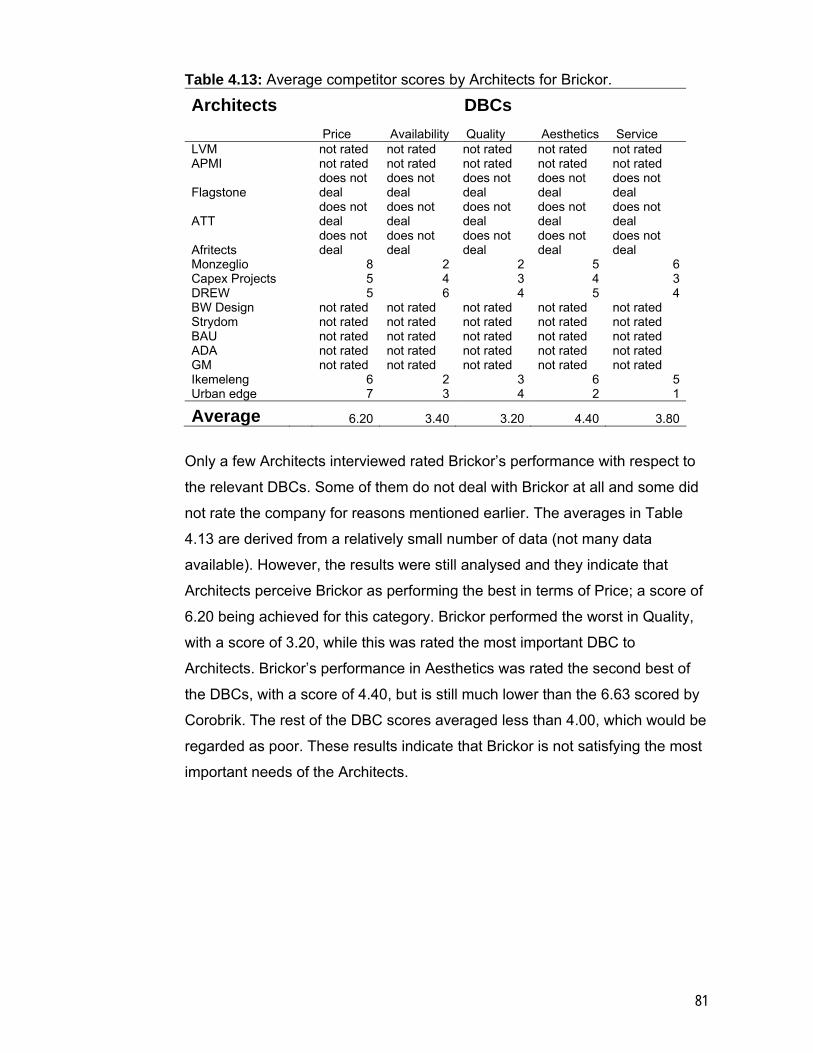
81
Table 4.13: Average competitor scores by Architects for Brickor.
Architects DBCs
Price Availability Quality Aesthetics Service LVM not rated not rated not rated not rated not rated APMI not rated not rated not rated not rated not rated
Flagstone does not deal
does not deal
does not deal
does not deal
does not deal
ATT does not deal
does not deal
does not deal
does not deal
does not deal
Afritects does not deal
does not deal
does not deal
does not deal
does not deal
Monzeglio 8 2 2 5 6Capex Projects 5 4 3 4 3DREW 5 6 4 5 4BW Design not rated not rated not rated not rated not rated Strydom not rated not rated not rated not rated not rated BAU not rated not rated not rated not rated not rated ADA not rated not rated not rated not rated not rated GM not rated not rated not rated not rated not rated Ikemeleng 6 2 3 6 5Urban edge 7 3 4 2 1
Average 6.20 3.40 3.20 4.40 3.80
Only a few Architects interviewed rated Brickor’s performance with respect to
the relevant DBCs. Some of them do not deal with Brickor at all and some did
not rate the company for reasons mentioned earlier. The averages in Table
4.13 are derived from a relatively small number of data (not many data
available). However, the results were still analysed and they indicate that
Architects perceive Brickor as performing the best in terms of Price; a score of
6.20 being achieved for this category. Brickor performed the worst in Quality,
with a score of 3.20, while this was rated the most important DBC to
Architects. Brickor’s performance in Aesthetics was rated the second best of
the DBCs, with a score of 4.40, but is still much lower than the 6.63 scored by
Corobrik. The rest of the DBC scores averaged less than 4.00, which would be
regarded as poor. These results indicate that Brickor is not satisfying the most
important needs of the Architects.
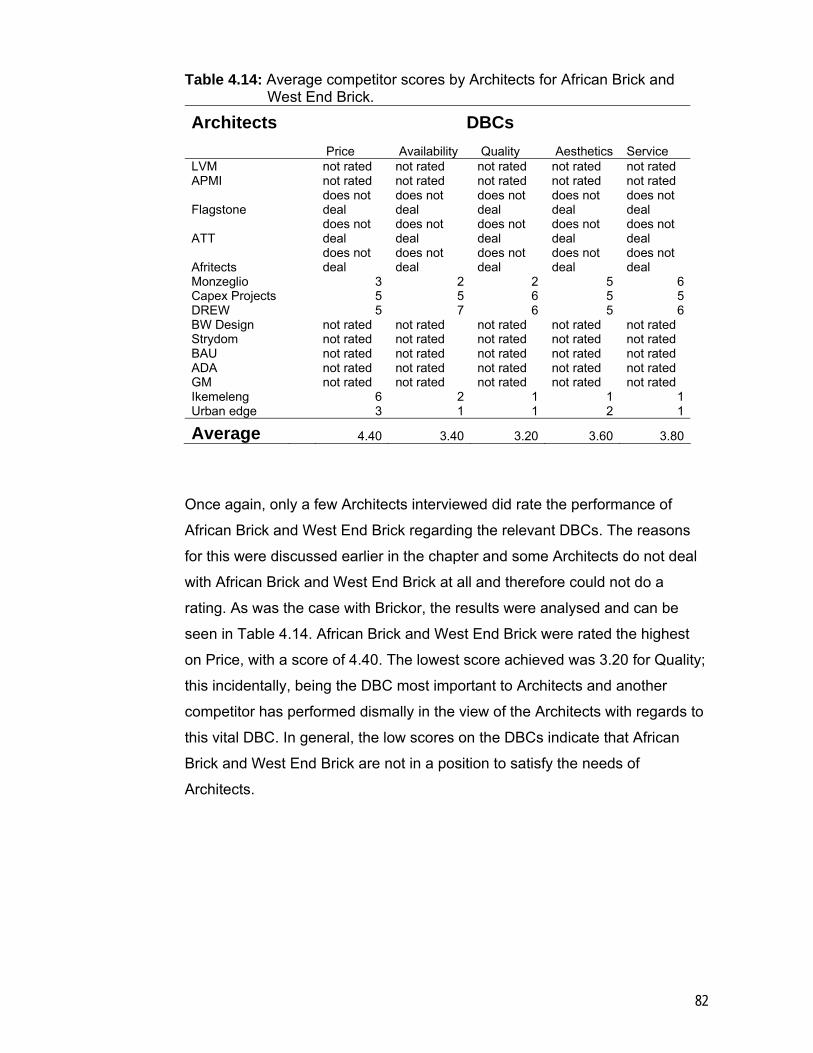
82
Table 4.14: Average competitor scores by Architects for African Brick and West End Brick.
Architects DBCs
Price Availability Quality Aesthetics Service LVM not rated not rated not rated not rated not rated APMI not rated not rated not rated not rated not rated
Flagstone does not deal
does not deal
does not deal
does not deal
does not deal
ATT does not deal
does not deal
does not deal
does not deal
does not deal
Afritects does not deal
does not deal
does not deal
does not deal
does not deal
Monzeglio 3 2 2 5 6Capex Projects 5 5 6 5 5DREW 5 7 6 5 6BW Design not rated not rated not rated not rated not rated Strydom not rated not rated not rated not rated not rated BAU not rated not rated not rated not rated not rated ADA not rated not rated not rated not rated not rated GM not rated not rated not rated not rated not rated Ikemeleng 6 2 1 1 1Urban edge 3 1 1 2 1
Average 4.40 3.40 3.20 3.60 3.80
Once again, only a few Architects interviewed did rate the performance of
African Brick and West End Brick regarding the relevant DBCs. The reasons
for this were discussed earlier in the chapter and some Architects do not deal
with African Brick and West End Brick at all and therefore could not do a
rating. As was the case with Brickor, the results were analysed and can be
seen in Table 4.14. African Brick and West End Brick were rated the highest
on Price, with a score of 4.40. The lowest score achieved was 3.20 for Quality;
this incidentally, being the DBC most important to Architects and another
competitor has performed dismally in the view of the Architects with regards to
this vital DBC. In general, the low scores on the DBCs indicate that African
Brick and West End Brick are not in a position to satisfy the needs of
Architects.
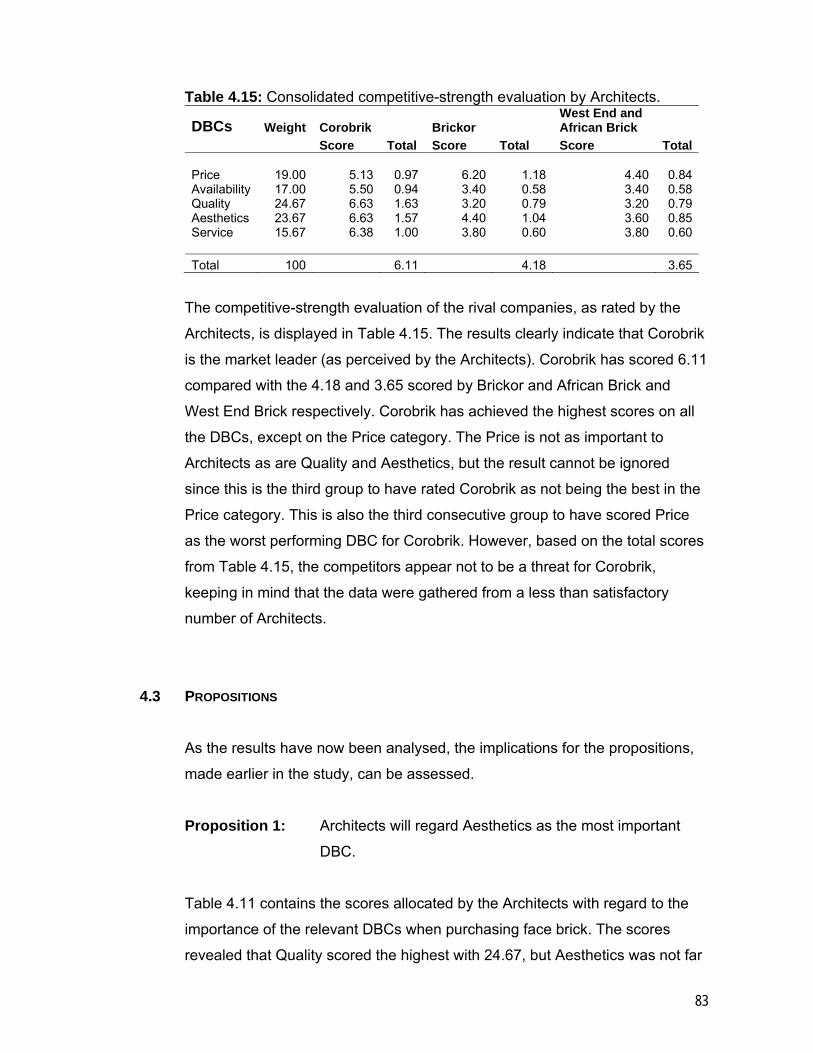
83
Table 4.15: Consolidated competitive-strength evaluation by Architects.
DBCs Weight Corobrik Brickor West End and African Brick
Score Total Score Total Score Total Price 19.00 5.13 0.97 6.20 1.18 4.40 0.84Availability 17.00 5.50 0.94 3.40 0.58 3.40 0.58Quality 24.67 6.63 1.63 3.20 0.79 3.20 0.79Aesthetics 23.67 6.63 1.57 4.40 1.04 3.60 0.85Service 15.67 6.38 1.00 3.80 0.60 3.80 0.60 Total 100 6.11 4.18 3.65
The competitive-strength evaluation of the rival companies, as rated by the
Architects, is displayed in Table 4.15. The results clearly indicate that Corobrik
is the market leader (as perceived by the Architects). Corobrik has scored 6.11
compared with the 4.18 and 3.65 scored by Brickor and African Brick and
West End Brick respectively. Corobrik has achieved the highest scores on all
the DBCs, except on the Price category. The Price is not as important to
Architects as are Quality and Aesthetics, but the result cannot be ignored
since this is the third group to have rated Corobrik as not being the best in the
Price category. This is also the third consecutive group to have scored Price
as the worst performing DBC for Corobrik. However, based on the total scores
from Table 4.15, the competitors appear not to be a threat for Corobrik,
keeping in mind that the data were gathered from a less than satisfactory
number of Architects.
4.3 PROPOSITIONS
As the results have now been analysed, the implications for the propositions,
made earlier in the study, can be assessed.
Proposition 1: Architects will regard Aesthetics as the most important
DBC.
Table 4.11 contains the scores allocated by the Architects with regard to the
importance of the relevant DBCs when purchasing face brick. The scores
revealed that Quality scored the highest with 24.67, but Aesthetics was not far
84
behind with a score of 23.67. Technically, this proposition was proven wrong;
however, the close scores need to be kept in mind. The above-mentioned
scores do, however, indicate the importance to Architects of the Quality and
Aesthetics of the product they use for their designs.
Proposition 2: Contractors will regard Availability as the most important
DBC.
The Contractors scored Availability as the second most important DBC when
purchasing face brick. Availability scored an average importance rating of
21.83, as reflected in Table 4.6. The Price, however, was rated the most
important DBC and scored and average of 27.92. Therefore, this proposition is
proven incorrect. The importance of the Price signifies the need for Contactors
to increase the profit margin of a particular project by purchasing the cheapest
possible product that still complies with the specifications.
Proposition 3: Consumers will regard Price as the most important DBC.
The Consumers in this study were represented by Distributor Centre
Managers for reasons mentioned elsewhere. The results from Table 4.1
revealed that Price was indeed rated as the most important DBC that
Consumers would consider when purchasing face brick. The score of 31.88 for
Price is well ahead of the second highest score of 25.63 for Availability.
Therefore, this proposition has been proven correct and shows the price
sensitivity in this segment of the market.
Proposition 4: Corobrik will score the lowest with regard to the Price as
DBC, compared with competitors.
The Distributors rated Corobrik the worst performer in terms of Price, with a
score of 4.50 compared with 7.67 and 7.88 for Brickor and the group of African
Brick and West End Brick respectively. These results are reflected in Table
4.5.
85
The Contractors scored Corobrik second with a score of 6.17, after African
Brick and West End Brick, with a score of 6.29. Brickor was scored the lowest
with a score of 5.94. The Contractor scores are summarised in Table 4.10.
The Architects rated Brickor the best performer regarding Price, with a score of
6.20. Corobrik was, once again, rated second with a score of 5.13. The worst
performers were the group of African Brick and West End Brick, with a score of
4.40. These results can be seen in Table 4.15.
If all these results are considered, proposition 4 would be proven wrong
because Corobrik was rated by only one group as the worst. Two other
groups, however, have scored Corobrik as the second best out of three groups
of competitors and this factor should be seen as a weakness in the marketing
mix of Corobrik.
Proposition 5: Corobrik will be perceived as more successful than
competitors in delivering quality and aesthetically pleasing
products.
The results in Table 4.5 reveal that the Distributors have scored Corobrik the
highest in both Quality and Aesthetics, with scores of 8.00 and 8.38
respectively. African Brick and West End Brick were scored the second
highest with sores of 7.13 and 7.38 for Quality and Aesthetics respectively.
Brickor was scored the worst, with scores of 5.00 and 5.33 for Quality and
Aesthetics respectively.
The results in Table 4.10 show similar results, with Corobrik outperforming the
competition. Corobrik scored 7.58 and 6.29 for Quality and Aesthetics
respectively and Brickor was rated second best performer with sores of 4.31
for Quality and 3.31 Aesthetics. African Brick and West End Brick obtained
scores of 3.64 and 3.14 for Quality and Aesthetics respectively.
Table 4.15, once again, shows a similar pattern, with Corobrik scoring 6.63 for
both Quality and Aesthetics from the Architects. Brickor scored 3.20 for quality
and 4.40 for Aesthetics. African Brick and West End Brick scored 3.20 for
Quality and 3.60 for Aesthetics.
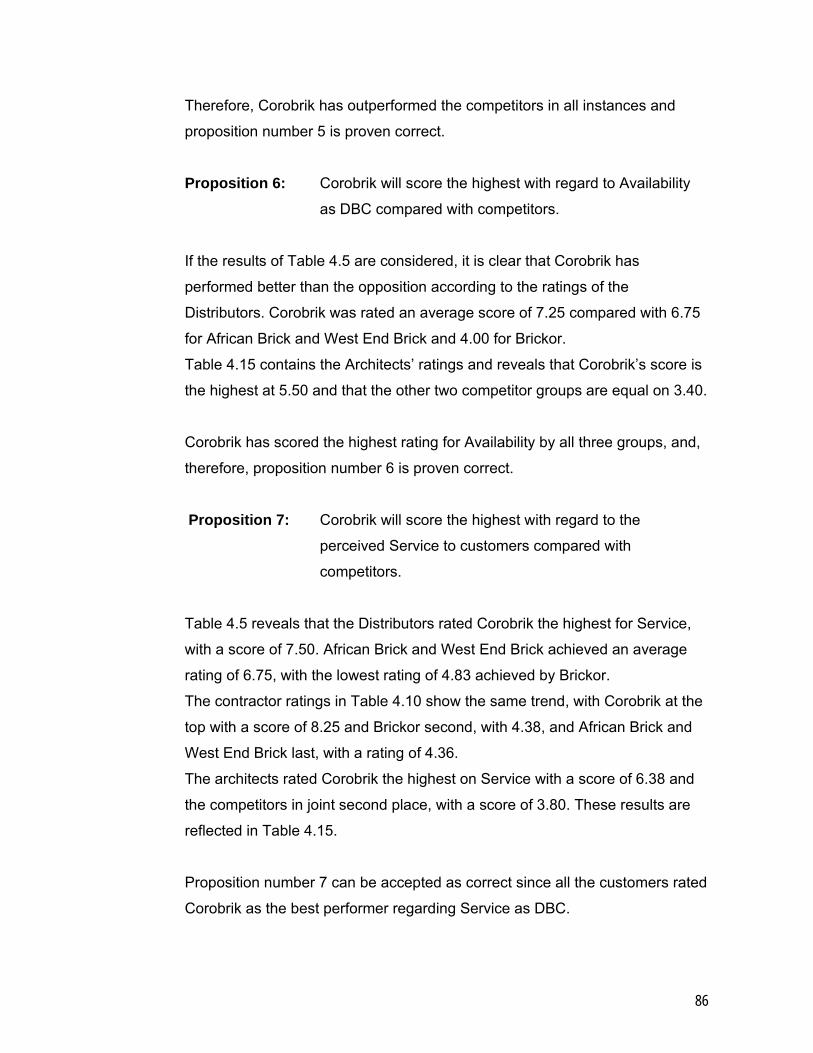
86
Therefore, Corobrik has outperformed the competitors in all instances and
proposition number 5 is proven correct.
Proposition 6: Corobrik will score the highest with regard to Availability
as DBC compared with competitors.
If the results of Table 4.5 are considered, it is clear that Corobrik has
performed better than the opposition according to the ratings of the
Distributors. Corobrik was rated an average score of 7.25 compared with 6.75
for African Brick and West End Brick and 4.00 for Brickor.
Table 4.15 contains the Architects’ ratings and reveals that Corobrik’s score is
the highest at 5.50 and that the other two competitor groups are equal on 3.40.
Corobrik has scored the highest rating for Availability by all three groups, and,
therefore, proposition number 6 is proven correct.
Proposition 7: Corobrik will score the highest with regard to the
perceived Service to customers compared with
competitors.
Table 4.5 reveals that the Distributors rated Corobrik the highest for Service,
with a score of 7.50. African Brick and West End Brick achieved an average
rating of 6.75, with the lowest rating of 4.83 achieved by Brickor.
The contractor ratings in Table 4.10 show the same trend, with Corobrik at the
top with a score of 8.25 and Brickor second, with 4.38, and African Brick and
West End Brick last, with a rating of 4.36.
The architects rated Corobrik the highest on Service with a score of 6.38 and
the competitors in joint second place, with a score of 3.80. These results are
reflected in Table 4.15.
Proposition number 7 can be accepted as correct since all the customers rated
Corobrik as the best performer regarding Service as DBC.
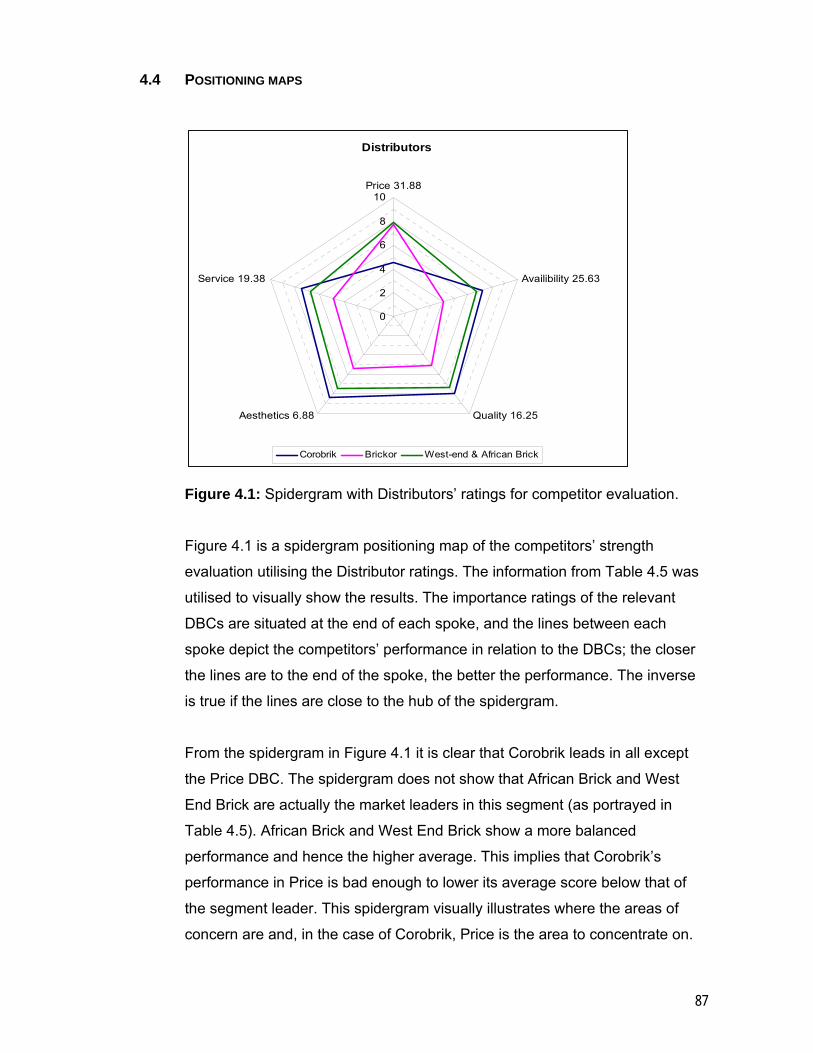
87
4.4 POSITIONING MAPS
Figure 4.1: Spidergram with Distributors’ ratings for competitor evaluation.
Figure 4.1 is a spidergram positioning map of the competitors’ strength
evaluation utilising the Distributor ratings. The information from Table 4.5 was
utilised to visually show the results. The importance ratings of the relevant
DBCs are situated at the end of each spoke, and the lines between each
spoke depict the competitors’ performance in relation to the DBCs; the closer
the lines are to the end of the spoke, the better the performance. The inverse
is true if the lines are close to the hub of the spidergram.
From the spidergram in Figure 4.1 it is clear that Corobrik leads in all except
the Price DBC. The spidergram does not show that African Brick and West
End Brick are actually the market leaders in this segment (as portrayed in
Table 4.5). African Brick and West End Brick show a more balanced
performance and hence the higher average. This implies that Corobrik’s
performance in Price is bad enough to lower its average score below that of
the segment leader. This spidergram visually illustrates where the areas of
concern are and, in the case of Corobrik, Price is the area to concentrate on.
Distributors
0
2
4
6
8
10Price 31.88
Availibility 25.63
Quality 16.25Aesthetics 6.88
Service 19.38
Corobrik Brickor West-end & African Brick
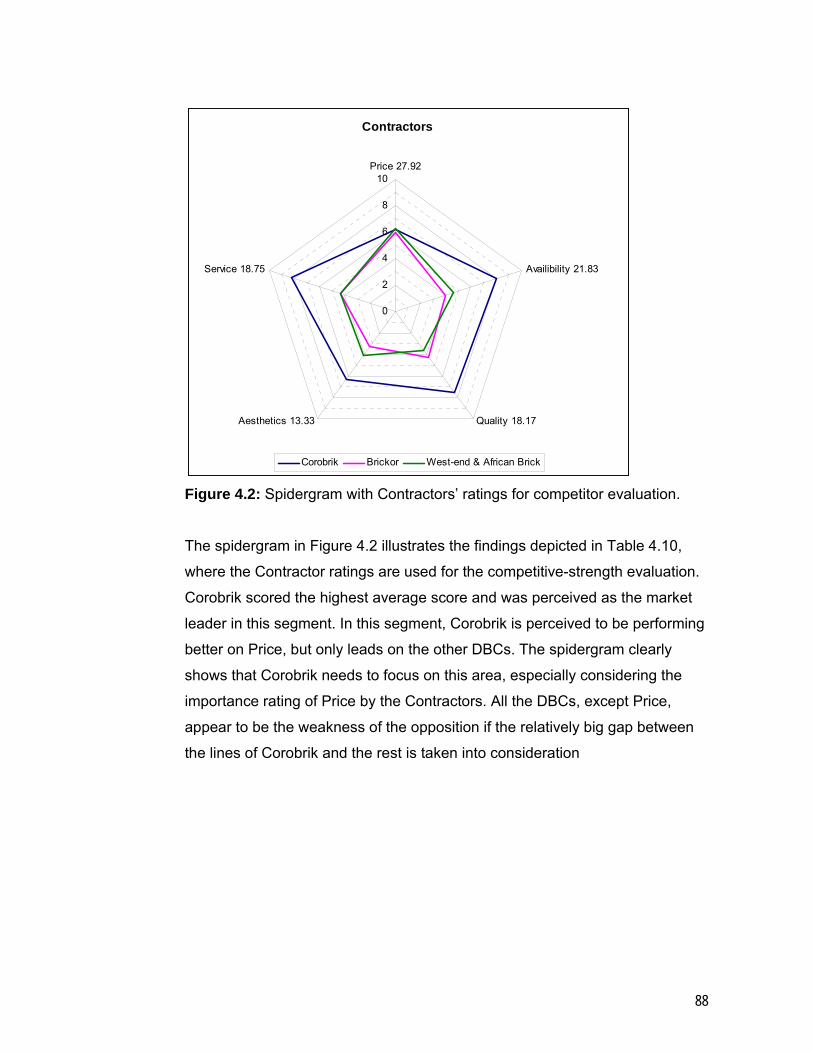
88
Contractors
0
2
4
6
8
10Price 27.92
Availibility 21.83
Quality 18.17Aesthetics 13.33
Service 18.75
Corobrik Brickor West-end & African Brick
Figure 4.2: Spidergram with Contractors’ ratings for competitor evaluation.
The spidergram in Figure 4.2 illustrates the findings depicted in Table 4.10,
where the Contractor ratings are used for the competitive-strength evaluation.
Corobrik scored the highest average score and was perceived as the market
leader in this segment. In this segment, Corobrik is perceived to be performing
better on Price, but only leads on the other DBCs. The spidergram clearly
shows that Corobrik needs to focus on this area, especially considering the
importance rating of Price by the Contractors. All the DBCs, except Price,
appear to be the weakness of the opposition if the relatively big gap between
the lines of Corobrik and the rest is taken into consideration
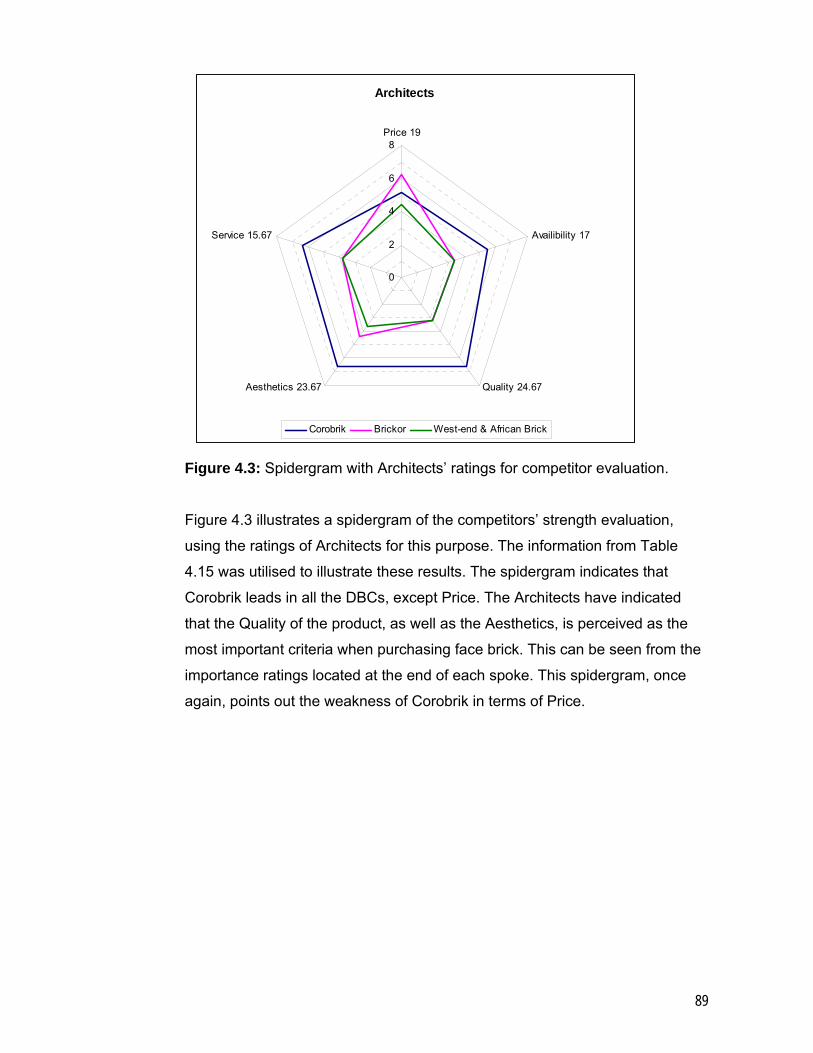
89
Figure 4.3: Spidergram with Architects’ ratings for competitor evaluation.
Figure 4.3 illustrates a spidergram of the competitors’ strength evaluation,
using the ratings of Architects for this purpose. The information from Table
4.15 was utilised to illustrate these results. The spidergram indicates that
Corobrik leads in all the DBCs, except Price. The Architects have indicated
that the Quality of the product, as well as the Aesthetics, is perceived as the
most important criteria when purchasing face brick. This can be seen from the
importance ratings located at the end of each spoke. This spidergram, once
again, points out the weakness of Corobrik in terms of Price.
Architects
0
2
4
6
8Price 19
Availibility 17
Quality 24.67Aesthetics 23.67
Service 15.67
Corobrik Brickor West-end & African Brick
90
CHAPTER 5
5. CONCLUSION AND RECOMMENDATIONS 5.1. BACKGROUND
The literature study has revealed that the marketing domain is a cyclical
progression that contains a few interrelated sub-processes and is a means to
measure and manage marketing effectiveness. The first step in the domain is
to ‘define markets and understand value’, with which markets are defined, a
better understanding of the values required by the customers is obtained, as
well as an understanding of how well the company is satisfying the needs of
customers in comparison with rival companies. The last step in this process is
to evaluate the market segments’ attractiveness, and then to decide on which
segment to focus.
The next step in the marketing domain is the ‘determine value proposition’
process during which marketing strategies, amongst others, are defined.
Marketing strategies revolve around the four Ps (Product, Price, Promotion
and Place) that are referred to as the levers of marketing control, also called
the ‘Marketing Mix’; this refers to ‘how’ the company will deliver what the
customer wants and needs.
The third step in the marketing domain concerns the ‘deliver value’ step and
explains how the value is delivered to the customer, while the last step
involves a monitoring programme in the ‘monitor value’ step.
The factor emphasised in this study is to understand the value required by
customers when they make a decision to purchase face bricks. The
performance of competitors in the face-brick market was also measured and
quantified in terms of the value required by the customers. Three groups of
customers were interviewed to obtain these results, namely: Distributors,
Contractors and Architects. These results were utilised in reviewing the
marketing mix and will be included in the recommendations to improve the
91
offerings to the customers as part of the overall marketing strategy. The
discussions and recommendations are given from the perspective of Corobrik.
With respect to the literature survey, this study can be seen as a monitoring
exercise to improve marketing effectiveness in order to retain valuable current
customers and acquire attractive new customers for Corobrik.
5.2 CONCLUSION
The study has highlighted a few issues that will be discussed in this section.
The Distributors rated Price as the most important DBC when purchasing face
bricks, while Availability was rated as the second most important DBC,
followed by Service. Quality and Aesthetics were rated the lowest of the DBCs.
These results imply that the customer buying ‘over the counter’ for mostly
residential purposes, is more concerned about an affordable product that is
available on demand and must to be fit for purpose, rather than about the
aesthetic appeal of the face brick.
Corobrik, Brickor as well as African Brick and West End Brick have been rated
by the Distributors, representing their customers, in respect of how they
perceive the competitors’ performance relating to the DBCs. Corobrik has
performed the worst in terms of Price, and Corobrik’s best rating was that of
Aesthetics; this is in direct conflict with that which is needed by the customers
in this segment. African Brick and West End Brick scored the highest in the
competitive-strength evaluation and, according to the results, they can be
regarded as the market leader in this segment. Corobrik has outperformed all
the competitors on all the DBCs, except Price, which cost them the first
position (market leader).
Corobrik’s bad performance in the Price category should be a point of concern
to their management team. Approximately 50 per cent of all Corobrik products
are sold in the Gauteng region to Distributors, of which 80 per cent are sold to
the residential market. This means that a substantial number of sales go to
Distributors and eventually to the residential customer, who is very particular
about the cost of the product. Corobrik’s competitors, on the other hand, have
seized their opportunity to provide products that satisfy the customers’ most
92
important need, namely Price. Their performance in relation to the other DBCs
was not as good, but these are less important than the Price to the customer.
These results explain the inability of Corobrik to gain market share in this
segment, i.e. the opposition is able to supply a product that satisfies the most
important needs (Price) of customers. In the current booming market of South
Africa, availability of products is an important factor as imbalance could
develop because of supply and demand dynamics. Corobrik has performed
better than the competitors in this category, which has surely assisted in
maintaining competition to the opposition companies.
The Contractors also rated Price and Availability as the first and second most
important DBC respectively. It can thus be assumed that Contractors share the
same views as the previous customer group, namely to have an affordable
product available on demand. The Contractor usually purchases the product to
complete the project and receives payment for phases completed. In this case,
customers need the products to be priced ‘correctly’ and to be available on
demand in order that their profit margin is increased and they receive payment
for the completed project as soon as possible. Although the motives of the two
groups (Distributors and Contractors) are different, their needs are very
similar.
Corobrik received its worst score for Price (from the Contractors) in the
relevant competitive-strength evaluation. The performance ratings of Corobrik
on the other DBCs were much better and the company has actually beaten the
competition soundly, except on Price. African Brick and West End Brick
performed better with regard to Price, although only by a small margin.
Corobrik has scored the best in the competitive-strength evaluation and can be
regarded as the market leader (as perceived by the Contractors). Although
Corobrik’s rating from the Contractors on Price was not as bad as from the
Distributors, both groups regarded Price as Corobrik’s worst performing DBC.
Price, on the other hand, was the best performing DBC of both Brickor and
African Brick and West End Brick, although not as good as that perceived by
the Distributors. Therefore, Corobrik’s competition in this segment is from
companies that attempt to satisfy Contractors’ most important need, namely
Price. The opposition’s poor performance in the other DBCs becomes almost
93
irrelevant if the high premium placed on Price (for which they did score very
well) is taken into account. The above shows that there is a weak spot in the
marketing strategy of Corobrik (as perceived by Contractors), and the
opposition has the chance to gain market share with aggressive pricing
strategies.
Approximately 30 to 35 per cent of the Corobrik brick sales goes to the
commercial and industrial markets (bought by Contractors) and this customer
segment regards Price as the most important criteria when purchasing face
brick. Sales to Distributors and Contractors amount to approximately 85 per
cent of the total sales of Corobrik and they perceive Corobrik as expensive
while Price remains a sensitive issue to them.
The Architects, however, regarded Quality as the most important criterion
when purchasing face-brick products, Aesthetics being almost as important,
followed by Price. It was expected that Architects would endeavour to design
structures that reflect Aesthetic appeal, which can only be obtained by using
high-quality products.
In the competitive-strength evaluation, using Architects’ perception ratings,
Corobrik achieved the highest score and can be regarded as the market
leader. This good performance is further emphasised when it is taken into
account that the highest scores were obtained in the two most important DBCs
to the Architects, namely Quality and Aesthetics. It is interesting to note that,
once again, Corobrik’s worst score was for Price, while this was the best score
of the opposition. Unfortunately for Corobrik’s opposition, Price is not the most
important DBC to Architects and the rival companies are unable satisfy this
customer segment’s key needs. Architects, on the other hand, scored
Corobrik, very high. These ratings indicate that Corobrik’s opposition
concentrates mainly on product price and not as much on anything else to hold
on to market share.
When contractors purchase face bricks for commercial or industrial purposes,
the Architect, up to 75 per cent of the time, influences the choice of product.
This choice could be specific, e.g. product X with specification ABC, or less
94
specific, e.g. product X or Y or Z as long as it is light red and conforms to
certain other standards. The Contractor, on the other hand, could also take the
role of Specifier in terms of product choice, or assist with this function. The
implication for this market segment is that if the Contractors have the greater
influence on choice of product, customer needs will be affordable products; on
the other hand, when the Architect influences the choice of product, the needs
are the quality and aesthetics of the product.
5.3. RECOMMENDATIONS
In the light of the results of the study, it seems that Corobrik is meeting the
requirements of Architects quite well and is doing so better than the
opposition. It could be recommended that Corobrik simply maintain the status
quo; however, it must be noted that this study only considered face bricks and
did not compare face bricks with rival materials such as glass, aluminium,
wood, plaster and paint, etc. Consequently, Corobrik’s performance was not
compared with the manufacturers of these rival products with regard to the
relevant DBCs. It is therefore recommended that such a study be conducted in
order that Corobrik’s performance in comparison with these opposition
companies is determined. The proposed study should include the same
market segments of this current study.
Corobrik should also consider a marketing objective of new product
development, i.e. developing new products for existing market segments
(Architects) with the purpose of competing better with alternative building
materials, such as glass, aluminium and others. This strategy can also be
used to gain market share, not only in the brick market, but also in the bigger
construction market.
Examples of such new products are specially shaped products or bricks with
surface coatings to produce a much wider range of colours than is currently
available. In this way, the Architect would have more choices in order to satisfy
his key needs, namely Quality and Aesthetics.
95
Marketing strategies are the means to achieve marketing objectives and they
are generally concerned with the four Ps of the marketing mix. Obviously a
product with new features would take care of the ’product’ as one of the
marketing levers. This product, however, needs to be ‘promoted’ and the
benefits need to be communicated to the customer for him to see the how it
can satisfy his needs. Corobrik manufactures special shaped bricks, but the
product must to be promoted much more aggressively in order that more
customers are aware of it and for the design flexibility benefits they hold.
Product development still needs to be done on the surface-coated bricks and
specially textured products before they can be promoted.
The segment for the Distribution market seems to be very Price sensitive, with
Quality and Aesthetics being less important to this group of customers. This is
the segment in which Corobrik has performed the worst in terms of Price.
Corobrik has become used to supplying the commercial and industrial markets
(Architects and Specifiers) with products. However, the residential market
(Price sensitive) has enjoyed a boom phase together with the other markets.
Corobrik has managed to increase its capacity in order to keep up with
demand, but it is not sure if enough products were designed and made
available to keep up with the residential demand. It appears that Corobrik has
followed a marketing objective of supplying existing products to new segments
(residential market) and the impression is that the new segment does not
really want the product because of its affordability. The new market segment is
referred to as the Distribution or ‘man in the street’ segment. Although this
‘new’ segment of the market is not really new to Corobrik, it is considered new
because its growth has opened up many new opportunities for Corobrik and its
rival companies.
It is therefore recommended that Corobrik adjusts its marketing objective to
develop new products for this ‘new’ segment.
Referring to the marketing mix, the main objective or feature of the new
product is to be fit for purpose with acceptable Quality and Aesthetics, taking
care of the Product in the marketing mix. The Price is by far the most important
factor in this marketing mix and absolutely needs to be affordable. The new
96
product does not necessarily need to be the cheapest, but its performance in
terms of Price needs to be acceptable to the consumer. Therefore, a product
or product range needs to be developed that can be made fairly cheaply, and
manufacturing large volumes of this product in one or more facilities will help
to gain economies of scale. The Promotion of these new products, as well as
existing products, is crucial to achieving success. The benefits of face brick
with regard to after-sales maintenance need to be communicated. Extremely
little or no maintenance is needed after installation, having major cost benefits
for existing and new products. It is recommended that the cost of erecting a
face-brick wall versus using other materials, as well as the cost of
maintenance after installation must be calculated and communicated to the
customer. The customer must be made aware of the cost of the ‘total
package’, i.e. product and maintenance, and not only the product cost.
Corobrik is known for its good quality, aesthetically pleasing products and was
rated accordingly by all customers. In order to capitalise on this positive factor,
the visual aspects of the end product (house or other building) for which
Corobrik products were used (versus using the rival products) need to be
promoted much more aggressively, thereby concentrating on Corobrik’s
strengths. The future value of the final product, consequently, needs to be part
of the Promotion. Lastly the Branding of the Corobrik centres needs more
attention and needs to compare with the Branding of rival companies such as
the CTM tile-distribution centres or Tile Africa centres. The Promotion needs to
be done in such a way that the customer perceives Corobrik centres and its
products as the automatic choice.
The above recommendations should steer Corobrik to have products available
for specific market segments that will better satisfy the specific needs of
customers. The above recommendations apply also to Contractors, since their
needs are the same as those of the Distribution segment.
If these recommendations are implemented successfully, Corobrik will
certainly retain their current customer base, will be able to acquire new
customers and will definitely be able to take market share away from
opposition brick manufacturers and possibly from companies manufacturing
rival construction products.
97
REFERENCES
Berry WL, Hill T & Klompmaker JE, 1999: Aligning marketing and manufacturing
strategies with the market. International Journal of Production Research,
37(16)3603-3604.
Cooper DR & Schindler PS, 2003: Business Research Methods. 8th edition. New
York: McGraw-Hill.
Dangers A, 2007: Personal communication with Mr Allin Dangers, National Sales
Manager, Corobrik. 28 February 2007.
Draganska M & Jain DC, 2005: Consumer Preferences and Product-Line Pricing
Strategies: An Emperical Analysis. Marketing Science. 25(2):164-167.
Friese M, Wänke M & Plessner H, 2006: Implicit Consumer Preferences and Their
Influence on Product Choice. Psychology & Marketing. 23(9):727-740.
Greengrove K, 2002: Needs-based segmentation: principles and practice.
International Journal of Market Research. 44(4):410.
Gwin CF & Gwin CR, 2003: Product Attributes Model: A Tool for Evaluating Brand
Positioning. Journal of Marketing Theory & Practice. 11(2)30-31.
Ledbitter D, 2007: Personal communication with Mr D Ledbitter, Sales Manager
Northen Gauteng, Corobrik. 27 July 2007.
Lichtenthal JD & Goodwin S, 2006: Product Attributes for Business Markets:
Implications for Selling and Sales Management. Psychology & Marketing.
23(3):225-251.
McDonald M, 2006: Do your marketing strategies create or destroy shareholder
value. Journal of Database Marketing & Customer Strategy Management.
13(2)102-107.
McDonald M, 2002: Marketing Plans: How to prepare them, how to use them. 5th
edition. Oxford: Elsevier Butterworth-Heinemann.
McDonald M & Dunbar I, 2004: Market Segmentation: How to do it, How to Profit
from it. Oxford: Elsevier Butterworth-Heinemann.
Meyers JH, 1992: Positioning Products/Services in Attitude Space. Marketing
Research. 4(1)46-49.
Neal WD & Wrust J, 2001: Advances in Market Segmentation. Marketing Research,
13(1):14-15.
98
Perreault WD & McCarthy EJ, 2002: Basic Marketing: A Global Managerial Approach:
14th edition. New York: McGraw-Hill.
Porter ME, 1980: Competitive Strategy: Techniques for Analysing Industries and
Competitors. New York: Free Press.
Porter ME, 1985: Competitive Advantage – Creating and Sustaining Superior
Performance. New York: Free Press.
Proctor T, 2000: Chapter 10: Segmentation, Targeting and Positioning. Strategic
Marketing, 10:188-211.
Ruskin-Brown I, 1999: Introducing the new marketing mix: the marketing tools (the
four of five P’s). Mastering Marketing. Chapter 3. Thorogood
South African Advertising Research Foundation.2006:
http://www.saarf.co.za
Accessed on 30/8/07
Vass K, 2005: A solid Marketing Plan Begins with SWOT. Textile World. 155(4):18-
19.
Vriens M, & Hofstede FT, 2000: Linking attribute, Benefits and Consumer Values.
Marketing Research, 12(3):4-10.
Yankelovich D & Meer D, 2006: Rediscovering market segmentation. Harvard
Business Review, 84(2)122-126.

99
APPENDICES
100
APPENDIX A Self-developed questionnaire
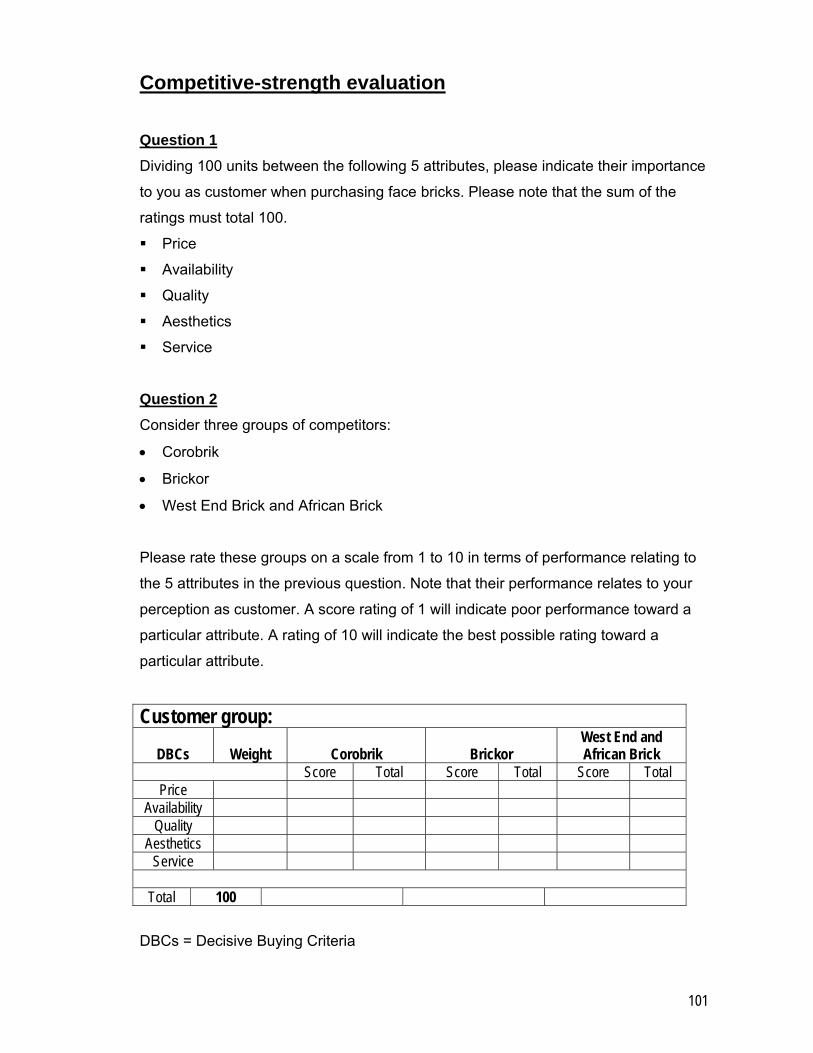
101
Competitive-strength evaluation Question 1
Dividing 100 units between the following 5 attributes, please indicate their importance
to you as customer when purchasing face bricks. Please note that the sum of the
ratings must total 100.
Price
Availability
Quality
Aesthetics
Service
Question 2
Consider three groups of competitors:
• Corobrik
• Brickor
• West End Brick and African Brick
Please rate these groups on a scale from 1 to 10 in terms of performance relating to
the 5 attributes in the previous question. Note that their performance relates to your
perception as customer. A score rating of 1 will indicate poor performance toward a
particular attribute. A rating of 10 will indicate the best possible rating toward a
particular attribute.
Customer group:
DBCs Weight Corobrik Brickor West End and African Brick
Score Total Score Total Score Total Price
Availability Quality
Aesthetics Service
Total 100
DBCs = Decisive Buying Criteria