evaluation of indirect tensile strength to identify
TRANSCRIPT

Graduate Theses, Dissertations, and Problem Reports
2004
Evaluation of indirect tensile strength to identify asphalt concrete Evaluation of indirect tensile strength to identify asphalt concrete
rutting potential rutting potential
Geetha Srinivasan West Virginia University
Follow this and additional works at: https://researchrepository.wvu.edu/etd
Recommended Citation Recommended Citation Srinivasan, Geetha, "Evaluation of indirect tensile strength to identify asphalt concrete rutting potential" (2004). Graduate Theses, Dissertations, and Problem Reports. 1465. https://researchrepository.wvu.edu/etd/1465
This Thesis is protected by copyright and/or related rights. It has been brought to you by the The Research Repository @ WVU with permission from the rights-holder(s). You are free to use this Thesis in any way that is permitted by the copyright and related rights legislation that applies to your use. For other uses you must obtain permission from the rights-holder(s) directly, unless additional rights are indicated by a Creative Commons license in the record and/ or on the work itself. This Thesis has been accepted for inclusion in WVU Graduate Theses, Dissertations, and Problem Reports collection by an authorized administrator of The Research Repository @ WVU. For more information, please contact [email protected].

Evaluation of Indirect Tensile Strength to Identify Asphalt Concrete Rutting Potential
By
Geetha Srinivasan
Thesis submitted to the College of Engineering and Mineral Resources at West Virginia University
in partial fulfillment of the requirements for the degree of
Master of Science
in
Civil Engineering
John P. Zaniewski, Ph.D., Chair
Ronald W. Eck, Ph.D.
Jim French III, Ph.D.
Department of Civil and Environmental Engineering
Morgantown, West Virginia
2004
Key Words
Asphalt mix design, rutting potential, Marshall Stabilometer, indirect tensile strength,
compaction slope, voids in mineral aggregates

ABSTRACT
Evaluation of Indirect Tensile Strength to Identify Asphalt
Concrete Rutting Potential
Geetha Srinivasan
The Superpave mix design procedure, as implemented at the end of the Strategic
Highway Research Program (SHRP) does not include any testing to evaluate asphalt
mixture for resistance to permanent deformation. This prompted the National
Cooperative Highway Research Program (NCHRP) to sponsor projects for the
development of a simple performance test for rutting potential of asphalt mixtures.
Anderson et al [2003] found that rutting potential can be evaluated by considering
indirect tensile strength (IDT), compaction slope measured with the Superpave Gyratory
compactor and voids in mineral aggregate (VMA). Anderson evaluated IDT strength at a
deformation rate of 3.75 mm/min and 34? C, and used repeated shear constant head,
RSCH, tester to estimate the rutting potential of asphalt mixtures. RSCH is a
sophisticated and expensive piece of equipment that is available only at a few research
agencies and universities. Likewise, few agencies have the ability to duplicate the IDT
strength tests methodology used by Anderson.
The objective of this research was to study if rutting potential can be evaluated
with equipment readily available to state highway agencies. Rutting potential was
evaluated with the Asphalt Pavement Analyzer (APA). The parameters that were
evaluated as independent variables include the IDT strength, volumetric parameters,
compaction slope, and the compacted aggregate resistance. IDT was measured using the
Marshall Stabilometer with a split tensile head and with the samples at 60°C. The main
factors included in the experiment were binder type, asphalt content, sand content,
nominal maximum aggregate size, NMAS, and gradation. The analysis of variance
demonstrated significant effects of all the main factors and their interactions on rutting
potential. Further there is a strong correlation between rutting potential and indirect
tensile strength as measured with the stabilometer.

iii
ACKNOWLEDGEMENTS
I would like to express my gratitude to my advisor, Dr. John Zaniewski, who
provided a motivating and enthusiastic atmosphere. It was a great pleasure for me to
work under his supervision. Thank you for your friendship and encouragement
throughout this research endeavor.
I would like to extend my thanks to Dr. Ronald Eck and Dr. Jim French III for
their review of my work and willingness to serve on my committee. Mr. Andrew Kincell,
Manager of the WVU Asphalt Technology Laboratory provided continuing assistance
with training, supplying materials and support throughout the laboratory work. I would
also like to acknowledge the contributions of my graduate student colleagues, Thomas
Adams and Andrew Corkrean, who greatly assisted with the performance of the tests in
support of this research.
This research was supported by the West Virginia Division of Highways. The
materials division staff, including Larry Barker, Dave Mattics and Stu Groves provided
information and guidance relative to practices of the Division.
The support of the asphalt paving industry in West Virginia also contributed to
the success of this research, in particular, the materials supplied by JF Allen, Martin
Maretta, and Marathon Ashland Petroleum, LLC.
I would also like to give my special thanks to my husband whose patient love and
emotional support enabled me to complete this work.

iv
TABLE OF CONTENTS
Abstract ............................................................................................................................... ii
Acknowledgements ............................................................................................................ iii
Table of Contents................................................................................................................iv
List of Figures ......................................................................................................................v
List of Tables ......................................................................................................................vi
CHAPTER 1: INTRODUCTION....................................................................................... 1
1.1 Background ...................................................................................................... 1
1.2 Problem Statement ........................................................................................... 3
1.3 Objective .......................................................................................................... 4
1.4 Scope and Limitations ...................................................................................... 5
1.5 Organization of Thesis ..................................................................................... 5
CHAPTER 2: LITERATURE REVIEW ............................................................................ 6
2.1 Introduction...................................................................................................... 6
2.2 Principles of Rutting in Asphalt Mixtures ....................................................... 6
2.3 Compaction Slope .......................................................................................... 14
2.4 IDT as an Indicator of Rutting Potential of Asphalt Mixtures....................... 20
2.5 Rutting Potential as Estimated using SGC Properties and IDT Strength ...... 21
2.6 Conclusions .................................................................................................... 23
CHAPTER 3: RESEARCH METHODOLOGY .............................................................. 24
3.1 Introduction.................................................................................................... 24
3.2 Experimental Design...................................................................................... 24
3.3 Aggregate Preparation.................................................................................... 26
3.3.1 Aggregate Gradation........................................................................... 26
3.3.2 Aggregate Specific Gravity................................................................. 28
3.4 Mix Preparation.............................................................................................. 29
3.5 Volumetric Analysis ...................................................................................... 30
3.6 Compaction Slope .......................................................................................... 31
3.7 Evaluation of Rutting Potential Using APA.................................................. 31

v
3.8 Indirect Tensile Strength Test........................................................................ 33
3.9 Compacted Aggregate Resistance Test........................................................... 35
CHAPTER 4: RESULTS AND ANALYSIS ................................................................... 36
4.1 Volumetric Properties .................................................................................... 36
4.2 Results ............................................................................................................ 37
4.2.1 APA Rut Results ................................................................................. 37
4.2.2 IDT Strength Test Results................................................................... 37
4.2.3 Compaction Slope Computations ....................................................... 37
4.2.4 CAR Test Results................................................................................ 38
4.3 Analysis.......................................................................................................... 39
4.3.1 ANOVA of APA Results .................................................................... 39
4.3.2 ANOVA of IDT Strength Test Results ............................................... 41
4.3.3 Regression Analysis ............................................................................ 42
4.4 Evaluation of Covariant Terms ....................................................................... 46
4.5 Summary of Results ....................................................................................... 48
CHAPTER 5:CONCLUSIONS AND RECOMMENDATIONS..................................... 49
5.1 Conclusions .................................................................................................... 49
5.2 Recommendations for Future Study .............................................................. 50
REFERENCES ................................................................................................................. 52
APPENDIX A – TEST RESULTS ................................................................................... 54
APPENDIX B - ANOVA ................................................................................................. 61
LIST OF FIGURES
Figure 1.1 Effect of VMA and Compaction Slope on Rut Depth...................................... 3
Figure 2.1 Mohr-Coulomb Failure Theory........................................................................ 8
Figure 2.2 Maximum Permanent Shear Strain from RSCH Test as a Function of IDT
Strength..................................................................................................................... 11
Figure 2.3 Cohesion and Internal Friction as a Function of Binder Content ................... 11
Figure 2.4 Relationship between Mixture Cohesion and Binder High-Temperature PG-
Grade ......................................................................................................................... 12
Figure 2.5 Plot of Rut Depth to 1 Million ESALs as a Function of Cohesion ................ 13

vi
Figure 2.6 Relationship between Mixture Cohesion and IDT Strength........................... 13
Figure 2.7 Mohr’s Circle for IDT Strength Test .............................................................. 14
Figure 2.8 Effect of Compaction Temperature on VMA................................................. 16
Figure 2.9 Effect of Asphalt Binder Content on SGC Compaction Properties ............... 17
Figure 2.10 Effect of Aggregate Gradation on SGC Compaction Slope ......................... 17
Figure 2.11 Effect of Aggregate Angularity on SGC Compaction Slope........................ 18
Figure 2.12 Relationship between High Temperatures Mix Properties and Compaction
Slope.......................................................................................................................... 18
Figure 2.13 N-SRmax Determined Using 2nd Order Polynomial Curve Fit....................... 19
Figure 3.1 Gradation Curve for 9.5 mm NMAS .............................................................. 27
Figure 3.2 Gradation Curve for 19 mm NMAS ............................................................... 27
Figure 3.3 Typical Rut Depths ......................................................................................... 33
Figure 3.4 Indirect Tensile Strength Test a) loading mode, b) failure plane ................... 34
Figure 3.5 IDT Strength Test Setup and Failure Plane .................................................... 35
Figure 4.1 Relationship between CAR Force and Rutting Potential ............................... 39
Figure 4.2 Relationship between IDT Strength and Rutting Potential ............................ 42
Figure 4.3 Relationship between Rutting Potential and IDT Strength, with Influence of
Binder Type............................................................................................................... 44
Figure 4.4 Influence of Binder Content on Rutting Potential.......................................... 44
Figure 4.5 Influence of Aggregate Characteristics on Rutting Potential......................... 45
Figure 4.6 Influence of Sand and Gradation on Rutting Potential................................... 46
Figure A1 Plot of Load versus Deformation - IDT Strength............................................ 60
Figure A2 Plot of CAR Force versus Deformation .......................................................... 61
LIST OF TABLES
Table 2.1 Guidelines for Evaluating Rut Resistance Using IDT Strength ....................... 10
Table 2.2 Description of Variables and Levels................................................................. 22
Table 3.1 Experimental Variables and Levels .................................................................. 25
Table 3.2 Experimental Matrix –Half Fractional Factorial .............................................. 25 *Shaded cells are the mixes that were tested..................................................................... 25
Table 3.3 Specific Gravity of the Blend ........................................................................... 28
Table 3.4 Mixing and Compaction Temperatures ............................................................ 29

vii
Table 3.5 Randomization for APA Testing ...................................................................... 32
Table 4.1 Comparison of Volumetric Properties .............................................................. 36
Table 4.2 Average Rut Depths and Percent Air Voids ..................................................... 38
Table 4.3 CAR Test Results.............................................................................................. 39
Table 4.4 Effect of Factors on Rut Depth and IDT Strength............................................ 41
Table 4.5 Regression Analysis of Rutting Potential with IDT Strength and Main
Experimental Factors. ............................................................................................... 43
Table 4.6 Regression Analysis of Rutting Potential versus IDT Strength, VMA and k... 47
Table 4.7 Regression Analysis of Rutting Potential versus IDT Strength, and k ............. 47
Table A1 Blend Gradation – 9.5mm NMAS - Coarse..................................................... 54
Table A2 Blend Gradation – 9.5mm NMAS – Fine ........................................................ 54
Table A3 Blend Gradation - 19mm NMAS - Coarse ...................................................... 55
Table A4 Blend Gradation - 19mm NMAS - Fine .......................................................... 55
Table A5 9.5 mm NMAS - 0% Natural Sand .................................................................. 56
Table A6 9.5 mm NMAS - 40% Natural Sand ................................................................ 56
Table A7 19 mm NMAS – 0% Sand ............................................................................... 57
Table A8 19 mm NMAS – 40% Sand ............................................................................. 57
Table A9 Description of Mixes........................................................................................ 58
Table A10 Computations for Compaction Slope ............................................................. 59
Table B1 ANOVA for Rut Depth.................................................................................... 62
Table B2 ANOVA for IDT Strength ................................................................................ 64

1
CHAPTER 1: INTRODUCTION
1.1 BACKGROUND
In recent years, rutting of hot mix asphalt (HMA) pavements on some roadways
with a high truck volume has resulted in premature failure. On the other hand, some
roadways constructed of HMA have carried large volumes of truck traffic with very little
rutting. Evaluation of the rutting potential of HMA is considered an important mix
design problem to further the development and application of HMA.
Rutting is the formation of twin longitudinal depressions in the wheel paths due to
a progressive accumulation of permanent deformation in one or more of the pavement
layers [Anani, 1990]. The rate and magnitude of rutting depend on external and internal
factors. External factors include load and volume of truck traffic, tire pressure,
temperature and construction practices. Internal factors include properties of the binder,
the aggregate and mix properties, and the thickness of the pavement layers.
In 1988, the Strategic Highway Research Program (SHRP) was started in USA.
The major funds of the SHRP research program were allocated to establish new mix
design procedure for asphalt pavements. The research program was completed in 1993
producing the Superpave mix design method.
The original Superpave mix design method was envisioned to include three levels
of sophistication for the design of mixes, dependent on the traffic level of the pavement.
The simplest Superpave level used only volumetric procedures and parameters in the mix
design process. The other levels of Superpave called for sophisticated testing and
evaluation of the mix to evaluate performance parameters. Due to the cost and
sophistication of the analysis required in levels 2 and 3, only the volumetric Superpave
procedures have been implemented at this time.
In addition to the volumetric parameters, Superpave requires aggregates meet
consensus properties to provide the internal friction needed to ensure good rutting
performance. The consensus parameters include the coarse aggregate angularity, fine
aggregate angularity, flat and elongated, and sand equivalency requirements. The fine
aggregate angularity requirement has created some controversy in the industry and

2
Jahn [2002] has proposed the use of a compacted aggregate resistance, CAR, test to
replace the fine aggregate angularity requirement.
Although the volumetric Superpave mixture and analysis system has been very
successful in developing durable mix designs, many engineers and technicians feel that a
simple performance, or “proof” test is needed to ensure adequate performance for asphalt
concrete mixtures. Of special concern is resistance to permanent deformation or rutting.
The concern over the lack of a test to evaluate mixture performance has prompted the
National Cooperative Highway Research Program (NCHRP), the Federal Highway
Administration (FHWA) and State Highway Agencies to sponsor projects with the
objective of developing test methods and procedures which can be readily implemented
to evaluate the rutting potential of mixes.
Several projects were initiated by the NCHRP to study the issue of a simple
performance test for permanent deformation evaluation of asphalt mixtures. One such
research by Anderson et al [2003] examines the use of indirect tensile, IDT, strength,
volumetric parameters and Superpave Gyratory Compaction (SGC) properties to predict
rutting potential of an asphalt mixture.
Anderson [2002c] applied the Mohr-Coulomb theory of material behavior to the
evaluation of the rutting potential of HMA. Cohesion was identified as an indicator of
how strongly the asphalt cement binds together the aggregate particles of a given mixture.
The IDT strength test is a measure of tensile strength and a good indicator of mixture
cohesion. IDT strength would provide information on cohesion, specifically asphalt
binder stiffness, but not angle of internal friction provided by the aggregates.
The NCHRP 9-16 research validated that the SGC compaction slope captured
changes in aggregate characteristics, but was insensitive to asphalt binder volume and
stiffness. So it could be expected that compaction slope would provide information on
the angle of internal friction, ø, but not on cohesion, c [Anderson et al, 2003]. Thus the
use of compaction slope, k, along with IDT strength can provide an indicator of rutting
resistance of an asphalt mixture. For aggregates having a low compaction slope, the rut
depth increases at a much greater rate with increasing Voids in the Mineral Aggregate
(VMA), as indicated in Figure 1.1 [Anderson et al, 2003].

3
Figure 1.1 Effect of VMA and Compaction Slope on Rut Depth
Anderson’s work indicated that mixes with high compaction slope are relatively
insensitive to VMA. Compaction slope is an indicator of the internal friction of an
aggregate, but if it is to be used in evaluating the rutting resistance of a mixture, then the
effect of VMA must also be considered. The rutting resistance of asphalt mixtures made
using aggregates with relatively poor internal friction can be substantially improved by
lowering VMA [Anderson et al, 2003].
Anderson determined the IDT strength of asphalt mixtures at a deformation rate
of 3.75 mm/min and a temperature of 34°C, i.e. 20°C below the critical high pavement
temperature for Lexington, KY. Rutting resistance of the asphalt mixture was determined
at 58°C using Repeated Shear Testing at Constant Height (RSCH). Anderson concluded
that rutting potential could be predicted using IDT strength, VMA and compaction slope
from the SGC.
1.2 PROBLEM STATEMENT
Based on Anderson's work, it appears that IDT strength has the potential of
providing valuable information about the rutting potential of HMA. However, the
equipment used by Anderson is not readily available to highway agencies. Extension of
Anderson's work into a procedure that can be readily implemented by state highway
agencies is highly desirable. Under the current Superpave procedures, mix designers

4
evaluate the moisture susceptibility of mixes using a modified Lottman procedure
(AASHTO T283). This procedure uses the Marshall Stabilometer with a modified
loading head to measure the IDT strength of samples. Thus, this type of testing is readily
available in the industry. If IDT strength measured with the Marshall Stabilometer could
be used in lieu of the test used by Anderson, then mix design specifications could be
developed that would incorporate a simple proof test using readily available equipment.
Two critical parameters in testing of HMA are the load rate and the test
temperature. The Marshall Stabilometer uses a load rate of 50 mm/min, where as
Anderson used a load rate of 3.75 mm/min. Typically the Lottman procedure uses a test
temperature of 25°C, where as Anderson used a test temperature of 34°C. The test
temperature can be readily modified. However, due to the design of the Marshall
Stabilometer, the load rate cannot be readily modified.
The RSCH device used by Anderson for evaluating the rutting potential of the
mixes is very sophisticated and has limited availability. Many agencies are using the
Asphalt Pavement Analyzer, APA, to evaluate rutting potential of HMA.
Anderson used the SGC compaction slope as an indicator of the angle of internal
friction of the aggregates. If a mix design specification was developed from this work, it
would require designers to develop mix designs before determining if the aggregate has
adequate internal friction for the mixes. Based on the work of Jahn, it may be possible to
use the CAR test to evaluate the potential internal friction of an aggregate blend in an
asphalt mix as part of the fine aggregate specification.
1.3 OBJECTIVE
Taking into consideration all these criteria, for this research, an experimental
hypothesis was developed: “The rutting resistance of an asphalt mixture, as determined
from the asphalt pavement analyzer, is a function of the compaction parameters as
derived from the SGC, volumetric properties and the IDT strength of the mix, as
evaluated from Marshall Stabilometer”.

5
1.4 SCOPE AND LIMITATIONS
This research is focused on the potential implementation by the West Virginia
Division of Highways, WVDOH. All materials used during the research are typical of
those used in the state. Hence, two Nominal Maximum Aggregate Size (NMAS) 9.5 mm
and 19 mm commonly used by WVDOH were selected for experimentation. Similarly,
two binders PG70-22 and PG76-22 were selected. PG70-22 is typically used in
conjunction with Superpave mixes, PG76-22 has recently been used by WVDOH for
areas with a high rutting potential.
The work was limited to the instruments available in the Asphalt Technology
Laboratory of West Virginia University, Morgantown. Marshall Stabilometer available
in the lab was used to determine the IDT Strength of asphalt mixtures. The APA was
used for evaluating rutting potential of the mixes. All samples were compacted with a
Pine AFGC125X SGC. To evaluate the CAR of the aggregates, a Marshall compactor
was used to compact the samples.
1.5 ORGANIZATION OF THESIS
This report contains five chapters with two appendices. After introducing the objective
of this research in the 1st Chapter, Chapter 2 is a summary of the literature. Here, the
principles of rutting in asphalt mixtures and the theory of Mohr circle as applied to
asphalt mixtures is discussed. Few NCHRP reports that relate rutting potential with
indirect tensile strength and SGC compaction properties are discussed in detail. In
Chapter 3, the methodology adopted and the test procedures followed during the process
of this research is presented. Chapter 4 includes the analysis done using the data in
Chapter 3. In this chapter, rut depth was correlated with indirect tensile strength and
volumetric and compaction properties. Finally, the conclusions that were arrived at are
discussed in Chapter 5.

6
CHAPTER 2: LITERATURE REVIEW
2.1 INTRODUCTION
Rutting, or permanent deformation, is one of the main failure mechanisms for
asphalt concrete pavements. Excessive permanent deformation can occur in mixtures that
lack adequate stiffness and/or strength at high temperatures. Significant rutting normally
only occurs during hot weather, when the surface of flexible pavements can reach a
temperature of 60°C or higher. Furthermore, this mode of distress is also associated with
relatively high traffic levels; the greater the number of vehicles and greater the proportion
of heavy trucks, the greater the potential for permanent deformation. Rutting is a serious
problem for a number of reasons; for example rain or melted snow and ice can pond in
the ruts, increasing the chance for vehicle hydroplaning and subsequent accidents.
Excessive ruts can also reduce the effective thickness of a pavement, reducing the
structural capacity of the pavement and increasing the likelihood of premature failure
through fatigue cracking [Christensen et al, 2000].
The severity of rutting of asphalt concrete pavements can be substantially reduced
by ensuring that: [Sontowski, 1995]
v significant portion of the coarse aggregates have at least one fractured face
v the aggregate gradation has sufficient mineral filler and dust content
v the asphalt cement has a sufficiently high viscosity
v the asphalt film thickness around the particle is sufficient to provide adequate
cohesive strength.
2.2 PRINCIPLES OF RUTTING IN ASPHALT MIXTURES
Rutting in hot-mix asphalt concrete (HMAC) can occur from two types of
mechanical response: viscous flow and plastic deformation. Plastic deformation occurs
as aggregate particles move slightly relative to one another, which is accompanied by
viscous flow in the asphalt cement binding these particles together. These processes,
though conceptually simple, are very difficult to analyze quantitatively.
The behavior of asphalt concrete can be analyzed by the Mohr-Coulomb failure
theory. This theory predicts that the strength of a material such as asphalt concrete
depends upon both cohesion and internal friction. For the case of simple shear loading

7
with an applied normal stress σN, the shear stress at failure τmax is given by the following
equation [Christensen and Bonaquist, 2002]:
φστ tanmax Nc += (2.1)
where
c = cohesion, kPa (or othe r consistent units)
φ = angle of internal friction, degrees
σN = normal stress, Pa
The Mohr-Coulomb theory is often represented graphically by plotting a series of
Mohr’s circles representing stress states at incipient failure under increasing levels of
confining stress and then drawing a tangent to these circles, which represents the Mohr-
Coulomb failure envelope, Figure 2.1 [Christensen et al, 2000]. There are two lines
associated with the failure envelope, the φ line and the Kf line. The φ-line is tangent to
each of the three Mohr’s circles as shown in the sketch, while the Kf line passes through
the maximum shear stress for each Mohr’s circle.
Normal (confining) stress,σN, is the stress normal to the failure plane. Internal
friction is proportional to the applied normal stress. At zero normal stress, shear strength
is equal to the cohesion. As the confining stress increases, the failure stress increases as a
function of the angle of internal friction. The greater the angle of internal friction, the
greater the increase in failure stress. The strength of asphalt concrete should be a
function of both cohesion and internal friction [Christensen and Bonaquist, 2002].
In analyzing strength tests, this theory is simply a way of mathematically
representing the relationship between confining stress and failure stress. The internal
friction is an important parameter, indicating the degree of interaction among particles.
For most engineering applications, including asphalt concrete, a high value of internal
friction is more desirable. An asphalt mixture made of aggregates with relatively poor
internal friction is more susceptible to rutting. The cohesion, c, theoretically represents
the shear strength at zero confining pressure. Cohesion, in asphalt concrete, is a
parameter that indicates how strongly the binder can bind the aggregates together. It is
mostly a function of binder content, binder grade and mix temperature.

8
Note: σ1 and σ3 major and minor principle stresses
Figure 2.1 Mohr-Coulomb Failure Theory
Strength is the ability of a material to resist an applied stress without failure,
while stiffness represents the ratio of applied stress to resulting strain for a given
material. Many methods for analyzing permanent deformation in HMAC have relied
upon stiffness characterizations, the reasoning being that low overall stiffness should be
correlated to low resistance to rutting. However, since rutting consists of small but
permanent changes in the internal arrangement of aggregate particles, which constitutes a
type of damage to the asphalt concrete, the strength of a given mixture should be as good
or even better a predictor of rut resistance. Stiffness testing is generally carried out at
small strains, and is therefore not representative of the relatively large strains, that must
occur during significant accumulation of permanent strains. Strength tests, besides being
simpler and easier to carry out than stiffness tests, fully mobilize the resistance of both
the asphalt binder and the aggregate structure comprising asphalt concrete [Christensen
and Bonaquist, 2002].
According to Christensen and Bonaquist [2002], a simplified method for
determining mixture cohesion and internal friction involves testing asphalt concrete
specimens in indirect tension and unconfined compression. The indirect tension test was
run on a 115 mm high, 150 mm diameter specimen, at a load rate of 3.75 mm/min and at
Shear stress
Normal stress
Failure stress level
Safe stress
levels
σ3 σ1
Angle of internal friction
Cohesion
φ - line Kf line

9
20°C below the maximum 7-day pavement temperature, Tmax. The unconfined test was
run at the same temperature, (Tmax-20°C) but at 7.5 mm/min and used a 150 mm by 150
mm specimen. Both tests were performed on specimens produced by the gyratory
compactor. By analyzing IDT and compression data, c and φ were directly obtained from
the following equations:
UIDTUUC
UIDTUUCaσσ
σσ
2
41 −
−= (2.2)
( )1-1 asin =φ (2.3)
φ
σ
cos
2 1 UIDTac
∗−=
(2.4)
where,
a1 = slope parameter
σUUC = unconfined compressive strength, kPa
σUIDT = indirect tension strength, kPa
The derivation of these equations follows from Mohr-Coulomb theory and the
state of stress existing in the IDT test and the unconfined compression test.
Nijboer performed early research involving triaxial testing of asphalt mixtures.
The pertinent features of Nijboer’s theory on the applications of Mohr-Coulomb
[Christensen et al, 2000] are:
v The cohesion of asphalt concrete, which Nijboer calls the initial resistance, is
composed of three forces: true cohesion, apparent cohesion and interlocking
resistance.
v Internal friction is that portion of the shear resistance proportional to the applied
normal stress.
v Asphalt binders in general have a lubricating effect on aggregates, reducing the
angle of internal friction.
v The stiffer the binder used in a mixture, the lower the angle of internal friction.
v The cohesion increases with increasing binder stiffness.
v Initial resistance, mass viscosity and internal friction all decrease with increasing
air void content.

10
v Increasing filler/binder ratio will increase both initial resistance and mass
viscosity
v Increasing the coarse aggregate content will normally increase all components of
the shear resistance: initial resistance, mass viscosity, interlocking resistance and
internal friction.
A study conducted jointly by The Pennsylvania Transportation Institute (PTI) of
The Pennsylvania State University, and Advanced Asphalt Technologies, LLC (AAT)
evaluated c and φ values determined using tri-axial test, unconfined compression test and
IDT strength test [Christensen et al, 2000]. This research included RSCH tests to
evaluate how well the data related to rut resistance. Limited field rutting data were also
available. Ten mixtures were evaluated. All aggregate gradations passed below the
Superpave restricted zone. A range of aggregate types was represented in the mix
designs. In analyzing the data, a very good correlation between IDT strength and rut
resistance was found, as indicated both by RSCH test results and by observed rutting.
Figure 2.2 [Christensen et al, 2000] shows maximum permanent shear strain (MPSS)
from the RSCH test as a function of IDT strength with an R2-value of 0.80. Using this
relationship and the Asphalt Institute guidelines for interpreting maximum permanent
shear strains from the RSCH test, preliminary guidelines for interpreting IDT strength
tests were developed and are given in Table 2.1 [Christensen et al, 2000]. However,
these guidelines can only be applied to the test conditions that were observed in their
study-a test temperature 20°C below the 7-day average maximum pavement temperature
and a loading rate of 3.75 mm/min.
Table 2.1 Guidelines for Evaluating Rut Resistance Using IDT Strength
RSCH MPSS, % IDT Strength Rut Resistance
< 1.0 > 440 Excellent
1.0 to < 2.0 >320 to 440 Good
2.0 to < 3.0 >200 to 320 Fair
= 3.0 = 200 Poor

11
Figure 2.2 Maximum Permanent Shear Strain from RSCH Test as a Function of
IDT Strength
Significance of Cohesion in obtaining rut resistance: In using the relationship
between strength test data and rutting to design asphalt concrete mixtures, it is important
to understand the significance of mixture cohesion in obtaining good rut resistance.
Increasing binder content, to a point, increases cohesion, but excessive binder content has
no effect on cohesion as seen in Figure 2.3 [Christensen and Bonaquist, 2002]. It can be
observed that, cohesion is zero when no binder is present. The maximums for both
cohesion and internal friction appear to be poorly defined, thus indicating that increasing
binder contents does not affect cohesion.
Figure 2.3 Cohesion and Internal Friction as a Function of Binder Content

12
Figure 2.4 [Christensen et al, 2000] is a plot of mixture cohesion versus PG-grade.
Binder grades used were unmodified PG58-28, PG64-22 and modified PG76-28.
Clearly, mixture cohesion increases with increasing binder high-temperature grade. The
scatter in the plot is due to other factors affecting cohesion, which should include mineral
filler content, binder content, Voids Filled with Asphalt (VFA) and aggregate-binder
interactions
Figure 2.4 Relationship between Mixture Cohesion and Binder High-Temperature
PG-Grade
The obvious substantial increase in rut resistance with decreasing temperature is
clear and convincing evidence that mixture cohesion, rather than internal friction (which
is largely independent of temperature) is the most important factor in determining
mixture rut resistance.
To indicate the relationship between cohesion and field rutting, Figure 2.5
[Christensen et al, 2000] is presented, in which estimated rut depth at 1 million
Equivalent Single Axle Loads (ESALs) is plotted, as a function of cohesion. This was
done by performing linear regression on log- log transforms of rut depth versus traffic
level. The resulting equations were used to estimate the rut depth at a traffic level of 1
million ESALs.

13
Figure 2.5 Plot of Rut Depth to 1 Million ESALs as a Function of Cohesion
The IDT test, being a measure of tensile strength, is in fact a good indicator of
mixture cohesion. This is illustrated in Figure 2.6 [Christensen et al, 2000], in which
mixture cohesion is plotted as a function of IDT strength. The relationship is very strong;
assuming the intercept is zero, the mixture cohesion can be accurately estimated as 1.75
times the IDT strength with an R2 value of 98 percent.
This relationship can be explained theoretically using Mohr-Coulomb circles for
IDT test. In Figure 2.7 [Christensen et al, 2000], the Mohr’s circle farthest to the left
represents the state of stress in tension. s X-IDT represents the tensile stress (horizontal) at
Figure 2.6 Relationship between Mixture Cohesion and IDT Strength
failure, while s Y-IDT represents the compressive (vertical) stress at failure. The stress state
in the IDT test is such that the average normal stress, p= (s Y-IDT + s X-IDT)/2, is close to
zero. Therefore, at this point, the value of the maximum shear stress,

14
q = (s Y-IDT – s X- IDT)/2, will be slightly greater than the mixture cohesion, c. For a
Poisson’s ratio of 0.5 when average normal stress, p = -s X-IDT, maximum shear stress, q =
-2s X-IDT .
Figure 2.7 Mohr’s Circle for IDT Strength Test
Because the average normal stress for the IDT stress state is so close to zero, the
differences in angle of internal friction among typical asphalt concrete mixtures has little
effect on the relationship between cohesion and maximum shear stress during the IDT
strength test; thus, cohesion can be estimated from the IDT strength as c=1.
2.3 COMPACTION SLOPE
During compaction with SGC, compaction slope is calculated as the change in
percentage of theoretical maximum density, % Gmm, as a function of the change in the
number of gyrations from Ninitial to Ndesign i.e.,
( ) ( )100
loglog%%
, ∗−−
=inides
inides
NNGG
kSlopeCompaction (2.5)
where,
% Gmm, Ndes and %G mm, Nini are the percent of maximum theoretical density at the design
and initial compaction levels respectively and can be estimated as follows
ini
desNdesmmNinimm h
hGG ∗= ,%,% (2.6)

15
mm
mbNdesmm G
GG =,% (2.7)
Gmb = Bulk specific gravity
Gmm = Maximum specific gravity
Nini = Design number of gyrations to compact the sample
Ndes= Initial number of gyrations to compact the sample
Hini = Height of the sample at Nini
hdes = Height of the sample at Ndes
Aggregate characteristics (gradation, particle shape and texture) rather than
asphalt binder characteristics (stiffness and volume) dominate the rate of compaction in
the SGC [Anderson et al, 2003].
The SGC operates by applying constant conditions of vertical pressure (600 kPa),
angle of gyration (1.25 deg) and rotational speed (30 rpm) to an asphalt mixture during
the compaction process. SGC compacts HMA samples to produce specimen sizes of
150 mm in diameter and 115±0.5 mm tall. The energy input to the specimen is not
constant, but increases with stiffer asphalt mixtures. Since aggregate characteristics
dominate the rate of compaction, the compaction slope is practically insensitive to
temperature changes, The SGC indicates no apparent sensitivity of mixture density to
changes in compaction temperatures. This was experimentally verified using unmodified
PG64-28 and polymer-modified PG76-28 and five compaction temperatures: 120°C,
135°C, 150°C, 165°C and 180°C. Figure 2.8 [McGinnis et al, 1996] shows that for
PG64-28, air voids and VMA are insensitive to compaction temperatures. The results
have limited applicability because the experiment involved only one design aggregate
structure and two binders. However, the volumetric properties of the mix containing
unmodified binder did not appear to be sensitive to compaction temperature as the same
mixture with modified binder. An experiment with variety of design aggregate structures
and asphalt binders will help understand the effect of compaction temperature better.

16
12
12.5
13
13.5
14
120 130 140 150 160 170 180
Compaction Temperature, C
VM
A, %
PG 64-28
PG 76-28
minimum design criterion
Figure 2.8 Effect of Compaction Temperature on VMA
In the Superpave mix design process, little difference exists in the compaction
slope for different asphalt contents with the same aggregate structure. As shown in
Figure 2.9 [Anderson et al, 2003], the compaction curves are very close to being parallel
lines for blends with the same aggregate structure, but asphalt contents varying by 0.5%.
Here, k is the compaction slope computed using Equation 2.5. By contrast, Figures 2.10
and 2.11 [Anderson et al, 2003] illustrate the effect of aggregate characteristics on
compaction slope. Figure 2.10 illustrates the effect of aggregate gradation (same
aggregate) on compaction slope; k ranges from 6.66 for fine aggregates to 9.93 for coarse
aggregate gradation. Rounded aggregates, with less internal friction, tend to produce
lower
compaction slopes. This is illustrated in Figure 2.11 where the aggregate gradations are
similar for the two mixtures, but the uncrushed river gravel has a compaction slope of
6.14 while the crushed limestone has a compaction slope of 8.84.

17
Figure 2.9 Effect of Asphalt Binder Content on SGC Compaction Properties
Figure 2.10 Effect of Aggregate Gradation on SGC Compaction Slope

18
12.5 mm Nominal Mixture
Figure 2.11 Effect of Aggregate Angularity on SGC Compaction Slope
Attempts to correlate mixture stiffness properties and permanent deformation
resistance to compaction slope of the SGC produced mixed results. In most cases, there
was a general trend indicating that higher compaction slope mixtures had higher shear
stiffness and lower permanent shear strain, i.e., better rutting resistance, as illustrated in
Figure 2.12 [Anderson et al, 2002a].
Figure 2.12 Relationship between High Temperatures Mix Properties and
Compaction Slope

19
Evaluation of the results from the NCHRP 9-16 laboratory experiments indicated
N-SRmax as another compaction parameter related to asphalt mixture shear stiffness and
rutting potential. The N-SRmax parameter is the number of gyrations at which the stress
ratio (shear stress divided by vertical stress) reaches a maximum value. To determine N-
SRmax, stress ratio curve was plotted from 10 gyrations to the maximum (160 gyrations)
on a normal, arithmetic scale. A second-order polynomial was fit to the data. Identifying
the N-SRmax was then a matter of taking the derivative of the equation (dSR/dN) and
setting it equal to zero. This is shown in Figure 2.13 [Anderson, 2002b].
Figure 2.13 N-SRmax Determined Using 2nd Order Polynomial Curve Fit
N-SRmax appears to be suited for either routine mix design or quality control
operations with the following limitations [Anderson, 2002c]:
v The N-SRmax value is insensitive to the stiffness (grade) of the asphalt binder, thus
limiting its use to evaluating mixtures with different aggregate structures or
different asphalt binder contents.
v The N-SRmax value can be used as a general indicator of high temperature mixture
(rutting) performance, but cannot be used to predict an absolute value of rutting.
v The N-SRmax parameter requires equipment modification.

20
2.4 IDT AS AN INDICATOR OF RUTTING POTENTIAL OF ASPHALT
MIXTURES
Accurate prediction of pavement response and performance requires the use of
theoretical models, which closely represent both the pavement structure, and the behavior
of the individual materials within the structure.
The Strategic Highway Research Program (SHRP) concluded with the
introduction of the Superpave mix design and analysis system. As part of Superpave, a
series of mechanical testing procedures were developed by SHRP researchers for
advanced mixture analysis. Unfortunately, the cost of the test equipment, the Superpave
Shear Tester (SST) and Indirect Tensile Tester, was prohibitive for routine use by hot-
mix asphalt contractors and state highway agencies. The high cost of the performance
testing equipment was only one part of the problem faced by users. Of equal importance,
execution of the testing and proper analysis of the results required well- trained,
experienced personnel. As a result, most state highway agencies moved towards
implementation of the Superpave mix design process relying only on analysis of
volumetric and densification properties of the mixture. Unlike the Marshall or Hveem
mix design procedures there was no final “strength” test included in the Superpave mix
design. Many in the asphalt industry believed that a simple performance test should be
included in the Superpave mix design procedure. This would include measurement and
determination of properties related to performance [Roque and Buttlar, 1992].
The key to obtaining appropriate asphalt mixture properties for use in theoretical
models, which closely represent the pavement structure, is to use testing modes, which
induce stress states that are similar to those experienced by the asphalt concrete layer. A
few testing modes that have been used to determine properties of asphalt mixtures in the
laboratory includes indirect tension, uniaxial and triaxial compression and direct tension.
It can be argued that for low temperatures, where thermal stresses become
significant, reasonable estimates of stiffness can be obtained from the indirect tensile
mode. As temperature is reduced, asphalt stiffness increases and the asphalt concrete
behaves more and more as a linearly elastic material. Thus, the materials behavior
becomes much less dependent on stress state, which implies that reasonable estimates of
tensile stiffness can be obtained from measurement within the center of the face of the

21
indirect tension specimen, even though the stress state involves compression as well as
tension. Stiffness measurements have been obtained successfully using the indirect
tensile mode.
The stress state in the vicinity of an indirect tension specimen is longitudinal and
transverse tension combined with vertical compression. Modulus values determined
using strain gauge measurements obtained in this zone of the indirect tension specimen
resulted in excellent predictions of strains and deflections measured on full-scale
pavements at in-service temperatures less than 30°C. Measurements obtained from direct
tension test can only provide an average failure strain or energy. Indirect tension test has
been successfully used to determine failure strain, stress and fracture energy of asphalt
mixtures [Roque and Buttlar, 1992].
Christensen and Bonaquist [2002] concluded that, the IDT test is simple, requires
low loads, and can be done on thin specimens and pavement cores, which is a significant
advantage in QC/QA testing. The IDT strength test appears better suited for routine use
in evaluating the rut resistance of asphalt concrete mixtures. The simplicity of this test is
such that it should be possible to conduct the necessary research relatively quickly
without large expenditures.
2.5 RUTTING POTENTIAL AS ESTIMATED USING SGC PROPERTIES AND
IDT STRENGTH
Anderson et al [2003] extended his research on the NCHRP 9-16 project and the
research conducted by PTI and AAT to examine the possibility of using indirect tensile
strength and SGC properties to predict the rutting potential of an asphalt mixture. The
experimental variables and the levels are indicated in Table 2.2.
During the NCHRP 9-16 research, mix designs were conducted on the sixteen
mixtures to determine the optimum asphalt binder content at Ndesign (100 gyrations). SGC
specimens were compacted using a modified Pine AFG1 SGC, so that conventional SGC
compaction parameters and measured shear stress could be determined. After
compaction, the bulk specific gravity of the specimens was determined and the
volumetric properties of the mixture were calculated including voids in total mix (VTM),
voids in the mineral aggregate (VMA), and voids filled with asphalt (VFA). The

22
Table 2.2 Description of Variables and Levels
Level
Variable Low High
Aggregate (Coarse) River Gravel (Crushed) Kentucky Limestone
Gradation Coarse Fine
Nominal Maximum Size 9.5 mm 19 mm
Natural Sand Percentage 0 % 40 %
Asphalt Binder Grade PG 64 – 22 PG 76 – 22
Asphalt Binder Content Optimum Optimum + 0.8 %
compaction slope and N-SRmax values were also calculated for each specimen. Repeated
shear testing at constant height was conducted at 58°C on the mixtures.
Indirect tensile strength testing was conducted on each specimen following the
recommended procedure from the PTI/AAT research. For this experiment, the IDT
strength test was conducted at 34°C (which is 20°C below the critical high pavement
temperature for Lexington, KY) at a deformation rate of 3.75 mm per minute.
Findings: The average test results reported for the sixteen mixtures included
volumetric properties, SGC compaction data, RSCH rut depth and IDT strength.
The compaction slope appeared sensitive to aggregate angularity (% sand) more
than any other variable. The data indicated that N-SRmax was significantly affected by
asphalt binder volume, where higher asphalt binder content resulted in lower N-SRmax.
IDT strength was affected significantly by asphalt binder grade (stiffness), where the
higher PG asphalt binder resulted in higher IDT strength. This finding supports the
findings of the PTI/AAT research as well as earlier research. Asphalt binder volume did
not have a significant effect on the IDT strength, even when the data were separated by
asphalt content (i.e., PG 64-22 Optimum data compared to PG 64-22 Optimum-Plus
data).
For the sixteen mixtures, the relationship between estimated rut depth from the
RSCH test and compaction slope was non-existent (R2 = 0.03). This was expected since
compaction slope was not affected by asphalt binder grade or volume. The relationship
between estimated rut depth from the RSCH test and N-SRmax was also very weak

23
(R2=0.28) when all data were included. When just the PG 64-22 mixtures were analyzed
in the NCHRP 9-16 research, the relationship was better (R2=0.44), but not nearly good
enough to use as a predictive relationship. For this reason N-SRmax was suggested as a
mixture screening tool rather than as a predictor of rutting potential [Anderson, 2002b].
Using these test data, statistical analysis was performed to develop one or more
models relating estimated rut depth to N-SRmax, compaction slope, IDT strength and
volumetric parameters. The best model statistically used IDT strength, VMA, and
compaction slope, k, as predictor variables with an adjusted R2 of 0.75.
kVMAkVMASRutDepth t ∗−+−= − 337.037.537.40337.0 (2.8)
where,
Rut Depth = Estimated rut depth from RSCH test, mm
St = Indirect tensile strength, kPa
VMA = Voids in mineral aggregate, percent
k = Compaction slope
The negative coefficient for IDT strength indicates that as expected, predicted rut
depth decreases as IDT strength increases. This research showed that, since the data
evaluated included a wide range of aggregates, mixture cohesion alone (as indicated by
IDT strength) was an inadequate indicator of rutting resistance. Thus, only by
simultaneously considering IDT strength, compaction slope, and VMA can an accurate
estimate of rutting resistance be obtained [Anderson et al, 2003].
2.6 CONCLUSIONS
Based on the literature reviewed, the following conclusions can be made:
N-SRmax is insensitive to asphalt grade and it demands equipment modification.
Compaction provides information on the angle of internal friction, ø, but not on cohesion,
c. The IDT strength test, provides information on cohesion, specifically asphalt binder
stiffness, but not angle of internal friction. Hence, to estimate the rutting potential of
asphalt mixtures, it is necessary to consider its cohesion, internal friction, volumetric
properties, and IDT strength. None of these mix properties can by itself make an
accurate estimate of rut resistance.

24
CHAPTER 3: RESEARCH METHODOLOGY
3.1 INTRODUCTION
The main laboratory experiment consisted of determining the effect of compaction
parameters, IDT strength of the asphalt mix, and the volumetric properties on the
permanent deformation of the asphalt mixture.
Previous research, relating IDT strength to rutting potential of asphalt mixtures,
used equipment to estimate IDT strength, which is highly sophisticated and not readily
available by highway agencies. Hence, this research also focused on devising a simple
“proof” test, which can be easily implemented to evaluate the rutting potential of asphalt
mixes. In this research work, Marshall Stabilometer with a modified loading head was
used to determine the IDT strength of mixes.
3.2 EXPERIMENTAL DESIGN
Five variables each at two levels were selected, such that they provide mixtures
with different rutting resistance. Since this research focuses on being implemented by the
WVDOH, all materials used are those typically used in West Virginia. Two nominal
maximum aggregate sizes, 9.5 mm and 19 mm, were used for both a coarse and fine
gradation. The sand percentage chosen was 0 percent and 40 percent. These percentages
are the percent of limestone aggregate, passing the 4.75 mm sieve, which were replaced
with natural sand. The asphalt cement used in the experiments was unmodified PG70-22
and modified PG76-22, and was supplied by Marathon Ashland Petroleum LLC. Two
asphalt contents, optimum and optimum plus 0.5 percent was evaluated. The
experimental variables and their levels are as indicated in Table 3.1.
With 5 variables and 2 levels each, there were a total of 32 combinations. With 6
pills for APA machine and 2 for IDT test for each combination, totally 256 pills were
required. Due to time constraints, the number of pills made was reduced by applying a
half fractional factorial experimental design. The resulting matrix is a 25 half factorial
consisting of 16 cells. The design matrix is shown in Table 3.2. The shaded cells are the
mixes that were tested for rutting and indirect tensile strength of asphalt mixtures.

25
Table 3.1 Experimental Variables and Levels
Levels
Variables Low High
Aggregate Gradation Coarse Fine
NMAS 19 mm 9.5 mm
Sand Content, % 0 % 40%
Binder Content Optimum Optimum plus 0.5%
Binder Grade PG76-22 PG70-22
Table 3.2 Experimental Matrix –Half Fractional Factorial
Gradation Coarse Fine
NMAS 9.5 mm 19 mm 9.5 mm 19 mm
Sand % 0 40 0 40 0 40 0 40
Binder
Grade
Binder
Volume
Opti 1* 2 3 4 5 6 7 8 76-22
Opti+ 9 10 11 12 13 14 15 16
Opti 17 18 19 20 21 22 23 24 70-22
Opti+ 25 26 27 28 29 30 31 32
*Shaded cells are the mixes that were tested

26
3.3 AGGREGATE PREPARATION
All limestone aggregates used in this research work were supplied by J.F. Allen
Company, Buckhannon, WV. The natural sand was obtained from Martin Marietta
Apple Grove quarry, Ohio. The aggregates obtained from the supplier were air dried and
sieved using the following set of sieves: 37.5 mm, 25 mm, 19 mm, 12.5 mm, 9.5 mm,
4.75 mm, 2.36 mm, 1.18 mm, 0.6 mm, 0.3 mm and 0.075 mm. All aggregates larger than
1.18 mm were washed to take off the fines, oven dried and stored in respective bins.
3.3.1 Aggregate Gradation
The aggregate blend used by J. F. Allen Company was used as a starting point and
thereafter blends for 9.5 mm and 19 mm NMAS was designed for both coarse and fine
gradation. The blend was designed such that:
v Gradation curve is within the control points
v Maximum separation is achieved between the coarse and the fine
gradation and
v The gradation could be achieved by blending the stockpiles
v Dust is kept minimum, in order to increase the VMA
Gradation curves for 9.5 mm and 19 mm NMAS are shown in Figure 3.1 and 3.2
respectively, while gradations are summarized in Table A1 to Table A4 in Appendix A.

27
0
10
20
30
40
50
60
70
80
90
100
Sieve size
% P
assi
ng
Original grad Max density Coarse gradFine grad Control point
0.075 0.6 1.18 2.36 4.75 9.5 12.5 19.0 25.0 37.5 50.0
Figure 3.1 Gradation Curve for 9.5 mm NMAS
0
10
20
30
40
50
60
70
80
90
100
Sieve size
% P
assi
ng
Original grad Coarse grad Fine gradMax density Control point
0.075 0.6 1.18 2.36 4.75 9.5 12.5 19.0 25.0 37.5 50.0
Figure 3.2 Gradation Curve for 19 mm NMAS

28
3.3.2 Aggregate Specific Gravity
Specific Gravity and water absorption were measured for Limestone Coarse, fine
and Natural sand (AASHTO T 84 for coarse aggregate and AASHTO T 85 for fine
aggregate). The blending equation was then used to determine the specific gravity of the
aggregate blend.
))/(...)/()/((100
2211 nn GPGPGPG
+++= (3.1)
where,
G = Specific gravity of the blend
G1, G2, G3…Gn = specific gravity values for fractions 1,2,3…n
P1, P2, P3…Pn = weight percentages of fraction 1,2,3…n
The bulk and apparent specific gravity of each blend is given in Table 3.3.
Table 3.3 Specific Gravity of the Blend
Specific Gravity Gsa Gsb
0% sand 2.759 2.615 Coarse
40% sand 2.752 2.619
0% sand 2.747 2.583 9.5 mm
Fine 40% sand 2.736 2.589
0% sand 2.763 2.628 Coarse
40% sand 2.735 2.631
0% sand 2.728 2.607 19 mm
Fine 40% sand 2.690 2.611

29
3.4 MIX PREPARATION
Once the blend gradation was decided and the specific gravity of aggregates was
determined, weigh-out tables were prepared for a trial binder content. The optimum
asphalt content, as obtained by the contractor, was used as the starting binder content.
The required amount of aggregates weighed close to 0.1g was heated to the mixing
temperature in the oven. Asphalt cement was also heated to the same temperature. A
mechanical bucket mixer was used to make the mix. Prior to mixing, the bucket and the
paddle were sufficiently heated. The heated aggregates were added into the bucket,
required amount of binder was also weighed in, and the material was mixed until the
aggregates were uniformly coated with asphalt. Care was taken to see that not more than
5 g of the material was lost in the bucket or the paddle.
With a view of reducing the variability in the way the mix was prepared, the
material for both volumetric pills and that for finding the theoretical maximum specific
gravity was batched and mixed at one time. The mixed material was then quartered and
4800 g was weighed in to pre-heated pans, for volumetric pills and minimum of 1800 g
for the Rice test. These pans were then placed in the oven for two hours, which was
maintained at the maximum compacting temperature. The mix was stirred after one hour.
The mixing and compacting temperatures varies with the binder grade and is as specified
in Table 3.4.
Table 3.4 Mixing and Compaction Temperatures
Mixing Temp, (°C) Compaction Temp, (°C) Binder Grade
Min Max Min Max
PG70 - 22 159 165 148 153
PG76 - 22 156 167 147 158
After curing in the oven for 2 hours, the mix was transferred to a preheated
gyratory mold. The mold was then placed in a gyratory compactor and appropriate
amount of compaction was applied i.e., the machine was set to 100 gyrations for the pills
used for volumetric analysis, while for APA and IDT strength test samples, the mix was
compacted until a height of 75 mm was attained. During the compaction of volumetric

30
pills, the height of the specimen at the 8th (Ninitial) and the 100th (Ndesign) gyration was
noted for computing the compaction slope. When the APA and IDT strength pills were
made, the number of gyrations required in attaining a height of 75 mm was noted.
3.5 VOLUMETRIC ANALYSIS
The pills compacted to 100 gyrations were used for further volumetric analysis.
They were allowed to cool. Weight in air, weight in water and saturated surface dry
weight were taken to compute the bulk specific gravity of the mix (AASHTO T166).
Using the following set of equations, the maximum theoretical specific gravity and the
bulk specific gravity of the mix, the volumetric properties of the asphalt mix were
evaluated.
mm
mbNdesmm G
GG =,%
(3.2)
b
b
mm
bse
GP
G
PG
−
−=
11
(3.3)
( )
−= b
sesb
sbseba G
GGGG
P 100 (3.4)
( )bbabbe PPPP −−= 1 (3.5)
beP
P
Bd
=100
% 200#
(3.6)
mm
mb
GG
VTM −= 1 (3.7)
( )
−−=
sb
bmb
GPG
VMA1
1100 (3.8)
−
=VMA
VTMVMAVFA 100
(3.9)

31
where,
%Gmm,Ndes = Percent of maximum specific gravity at design number of revolutions;
Gmb = Bulk specific gravity;
Gmm = Maximum specific gravity;
Gse = Effective specific gravity of aggregate;
Pb = Percent binder;
Gb = Specific gravity of the binder;
Pba = Percent binder absorbed;
Gsb = Bulk specific gravity of aggregate;
Pbe = Effective percent binder;
%P#200 = Percent of the aggregate blend passing the #200 sieve;
%Gmm,Nini =Percent of maximum specific gravity at initial number of revolutions;
hdes = Height at the design number of revolutions;
hini = Height at the initial number of revolutions;
VTM = Air voids in compacted mixture;
VMA = Volume of voids in mineral aggregates; and
VFA = Voids filled with asphalt.
3.6 COMPACTION SLOPE
Compaction slope was computed after the volumetric pills were compacted in the
SGC. During compaction, the height of the specimen at Nini and Ndes was noted and
compaction slope, k, was computed using the Equation 2.5 through 2.7.
3.7 EVALUATION OF RUTTING POTENTIAL USING APA
Asphalt Pavement Analyzer (Pavement Technology, INC) was used to evaluate
the rutting potential of asphalt mixtures. The weight of material for making the
specimens for the APA machine was obtained from the theoretical maximum specific
gravity, Gmm, of the mix. The weight for the sample was estimated taking into
consideration the volume of the specimen to be compacted. The following equations
were used to estimate the weight required:
cmm VV ∗= 93.0 (3.10)
HRVc ∗∗= 2π (3.11)

32
mmmmm GVW /= (3.12)
where,
Vmm = Volume of the mix;
Vc = Gross volume of the sample;
R = Radius of the mold;
H = Height of the sample;
Wm = Weight of the mix;
Gmm = Theoretical maximum specific gravity of the mix;
Since the target air voids for the APA sample is 7±0.5%, those specimens out of
this air void range were discarded and more specimens were made to replace them.
About 30% of the samples made were discarded due to unacceptable void content.
This research involved 32 mixes. After applying half fractional factorial, 16 of
the 32 mixes were tested. Six specimens of 150 mm diameter and 75 mm tall were made
for each of these 16 combinations. During each run of the machine the six specimens
tested were for one experimental combination as defined in Section 3.2. The order in
which these combinations were tested was randomized and is shown in Table 3.5.
Table 3.5 Randomization for APA Testing
Gradation Coarse Fine
NMAS 9.5 mm 19 mm 9.5 mm 19 mm
Sand % 0 40 0 40 0 40 0 40
Binder Grade
Opti 2 3 8 5 76-22
Opti+ 12 9 14 15
Opti 4 1 6 7 70-22
Opti+ 10 11 16 13
All samples were tested at 60°C with a hose pressure of 100 psi and a wheel load
of 100 lbs. After 8000 load applications, rut depths were measured with a rut depth

33
measurement template and a Digimatic depth gauge, at the front and back of each
specimen. The Digimatic depth gauge can measure a maximum rut depth of 13.66 mm.
In cases where the rut depth was greater than 13.66 mm, a simple bridge, fabricated in the
West Virginia Asphalt Technology laboratory was used. The rut depth of six specimens
belonging to one type of mix was averaged to the nearest 0.1 mm and reported as the rut
depth for that mix. Figure 3.3 shows typical rut depths.
Figure 3.3 Typical Rut Depths
3.8 INDIRECT TENSILE STRENGTH TEST
With a view of maintaining consistency in making the samples, dimensions of the
pills for IDT strength test were kept similar to the APA pills, i.e. 2 specimens of 150 mm
diameter and 75 mm tall were made for each of the 16 mixes using a Superpave Gyratory
Compactor. Based on the theoretical maximum specific gravity of the mix, Gmm, and the
target air voids of 7±0.5%, the weight of material was estimated.
Prior to testing, the samples were heated in a constant temperature water bath at
60?C for one hour and 15 minutes. This time was selected based on the ratio of the
volume of the IDT strength sample to the volume of a Marshall sample multiplied by the
standard conditioning time of one half hour used for Marshall stability testing.
A test temperature of 60°C was selected based on:
v Anderson et al [2002] tested samples at 34°C with a load rate of 3.75
mm/min. Since the Marshall stability tests at 50 mm/min, the test

34
temperature should be greater than that used by Anderson. Time
temperature shift factors could be used to estimate a test temperature for
the stabilometer load rate, but this was not estimated.
v 60°C is the standard temperature for Marshall stability testing.
v Proof testing demonstrated that the Marshall stabilometer could reliably
measure the split tensile strength of the samples at this temperature.
The specimen was taken out of the water bath, and tested immediately in the
Marshall Stabilometer with a modified loading head and at a deformation rate of
50 mm/min. The load was applied parallel to and along the vertical diametral plane.
Figure 3.4 Indirect Tensile Strength Test a) loading mode, b) failure plane
This loading configuration developed a relatively uniform tensile stress
perpendicular to the direction of the applied load and along the vertical diametral plane.
Thus, the specimen failed by splitting along the vertical diameter as shown in
Figure 3.4b. Figure 3.5 shows the laboratory test setup for the IDT strength test.
From the plot of load versus deformation, maximum load carried by the specimen
was found, and Equation 3.13 was used to determine the indirect tensile stress at failure.
IDT stress for the two specimens was averaged and reported as the IDT strength of the
mix. A typical plot of load versus deformation is shown in Figure A1 in Appendix A.
a b

35
dtP
x πσ 2= (3.13)
where,
s x = Horizontal tensile stress at center of specimen, psi;
P = Applied load, lbs;
d = Diameter of the specimen, inches;
t = Thickness of the specimen, inches;
Figure 3.5 IDT Strength Test Setup and Failure Plane
3.9 COMPACTED AGGREGATE RESISTANCE TEST
The samples for the CAR test were prepared to the gradations used for the mix
designs using only the material passing the 2.36 mm sieve. Eleven hundred grams of the
material passing 2.36 mm were weighed to the nearest 0.1 g. This was uniformly mixed
with 3.5 percent water by dry weight of the sample. After 15 to 19 hours of soaking,
these samples were compacted using the Pine Automatic Marshall compactor, giving 50
blows on just one side of the sample. The CAR values were measured using a Pine
Stabilometer. Since none of these mixes demonstrated a peak force, the force at 0.25
inches of penetration was reported as the CAR force. A typical plot of load versus
deformation is shown in Figure A2 in Appendix A

36
CHAPTER 4: RESULTS AND ANALYSIS
The data reported in Chapter 3 was used for analysis. To start with, 16 mixes
involved in the experimental design were evaluated for their volumetric properties. Once
the optimum asphalt content was determined, APA and IDT strength pills were made at
these asphalt contents. Design Expert 6.0 was used to perform the fractional factorial
design and to determine the significant factors that affect rutting and IDT strength of
asphalt mixtures. An attempt was also made to understand if there exists any relationship
between the rutting potential and the indirect tensile strength of asphalt mixtures.
4.1 VOLUMETRIC PROPERTIES
Samples were made for 19 mm and 9.5 mm NMAS, with the original gradation
and contractor specified optimum asphalt content. The results obtained on checking the
volumetrics for this asphalt content are compared with the results reported by the
contractor for the same asphalt content in Table 4.1. The volumetric properties for the
specimens compacted to Ndesign, 100 gyrations, did not meet the specifications. The air
voids was found to be 70 percent below the required 4 percent for 9.5 mm mixes while
close to 38 percent below the criteria for 19 mm mixes. While the VMA was well below
the required minimum value, VFA was on the higher side of the range of 65-75 percent
for both gradations.
Table 4.1 Comparison of Volumetric Properties
NMAS 9.5 mm 19.0 mm
Criteria Contractor WVU lab Criteria Contractor WVU Lab
Pb, % - 5.7 5.7 - 4.8 4.8
VTM, % 4.0 4.0 1.2 4.0 4.0 2.5
VMA, % 15 min 15.5 13.7 13 min 14.0 12.5
VFA, % 65-75 74.0 91.2 65-75 71.0 80.0
Samples were made for various asphalt contents to determine the optimum asphalt
content. However, it was not possible to increase the VMA above the minimum required

37
value. Based on earlier research, an attempt was made to increase VMA, by reducing the
dust content. For mixes with 40 percent natural sand, dust from the sand source was
reduced to increase the VMA. For instance, for 19 mm mix with fine gradation and
0 percent sand, reducing the original dust content from 4.5 to 3.6 percent increased the
VMA from 11.4 to 14.0 percent. For the same mix with 40 percent sand, reducing dust
from the sand source from 1.4 to 0.96 percent increased VMA from 13 to 14.6 percent.
The weight of dust that was removed was compensated for by increasing the amount of
sand on the other sieves. Table A5 through A8 in Appendix A gives a summary of the
various trials made to arrive at the right volumetric properties for 9.5 mm and 19 mm
NMAS.
4.2 RESULTS
4.2.1 APA Rut Results
The rutting potential of asphalt mixtures was determined by testing six specimens
for each of the 16 mixes in the APA. Table 4.2 shows rut depths and percentage air
voids, averaged over six specimens for each of the 16 mixes tested.
4.2.2 IDT Strength Test Results
The IDT strength was determined by testing two specimens for each mix as
explained in Section 3.7. The average of the two specimens was reported as the IDT
strength for that mix. Table 4.2 shows average IDT strength and percentage air voids for
the 16 mixtures tested.
4.2.3 Compaction Slope Computations
Knowing the height of the pill and %Gmm at Nini, (8 gyrations) and Ndes (100
gyrations) compaction slope, k, was computed for the 16 mixtures as discussed in
Section 3.6. The test results are summarized in Table 4.2. Compaction slope
computations are shown in Table A9 in Appendix A.

38
Table 4.2 Average Rut Depths and Percent Air Voids
Mix+ Air voids,
%*
Rut depth,
mm
Air voids,
%**
IDT strength,
psi
Compaction
Slope, k 1 6.9 5.7 6.5 14.8 9.88 4 6.9 5.4 6.6 12.6 8.47 6 7.1 8.1 7.5 10.96 8.88 7 6.7 5.5 6.8 13.88 9.57 10 6.8 8.8 6.9 10.69 8.94 11 6.9 5.5 7.0 15.07 10.19 13 7.3 7.7 7.4 12.97 9.99 16 6.8 10.6 6.9 10.5 8.9 18 7.0 12.9 7.4 9.96 8.95 19 7.2 10.4 7.3 11.78 9.55 21 7.5 12.5 7.2 12.06 10.27 24 6.7 18.1 6.9 8.22 8.88 25 6.8 11.9 6.7 9.96 10.07 28 6.7 12.2 6.5 9.68 9.18 30 7.0 23.2 7.3 6.85 8.92 31 7.0 12.4 6.9 8.86 9.89
+Mixture combinations given in Table 3.2 *Percent air voids for the APA pills **Percent air voids for IDT strength pills
4.2.4 CAR Test Results
For each blend of fine aggregates, three specimens were prepared and tested as
discussed in Section 3.8. The average of these three results was reported as the CAR
value for the mix and is summarized in Table 4.3.
A Plot of CAR force and measured rutting potential is shown in Figure 4.1. There
is a general trend for the rutting potential to decrease as CAR force increases, as would
be expected. However, the quality of the correlation is too poor to permit the
development of predictive equations from this data set.
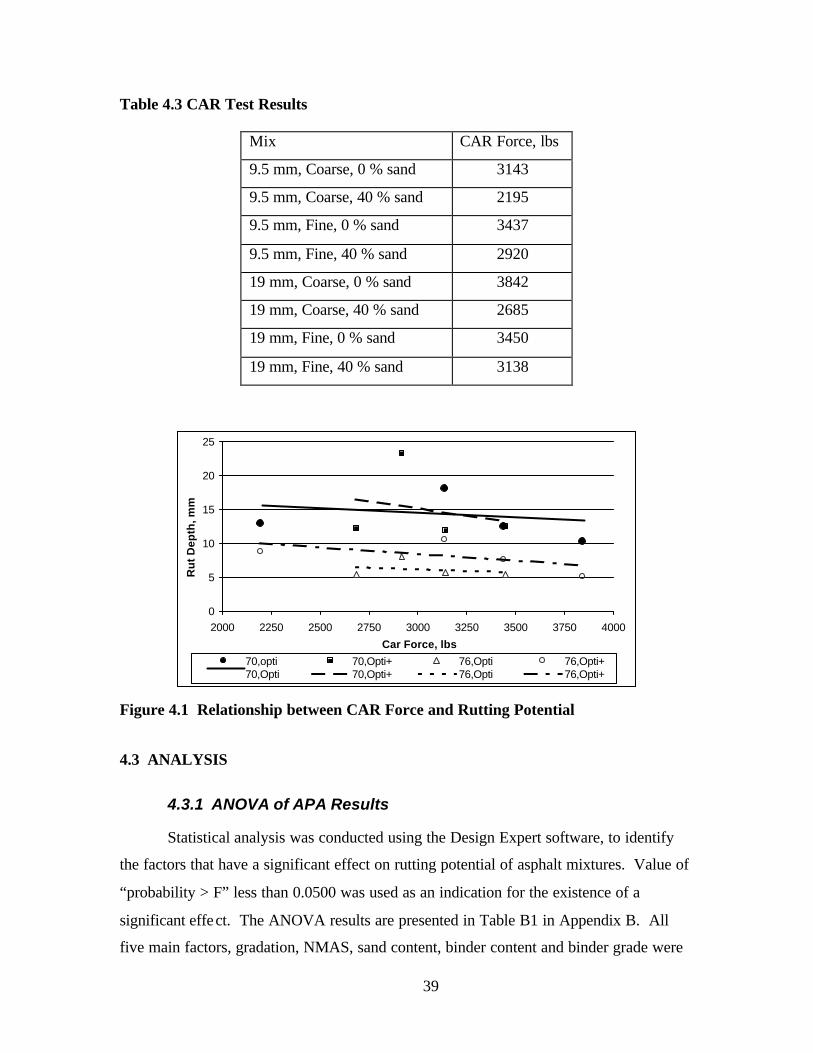
39
Table 4.3 CAR Test Results
Mix CAR Force, lbs
9.5 mm, Coarse, 0 % sand 3143
9.5 mm, Coarse, 40 % sand 2195
9.5 mm, Fine, 0 % sand 3437
9.5 mm, Fine, 40 % sand 2920
19 mm, Coarse, 0 % sand 3842
19 mm, Coarse, 40 % sand 2685
19 mm, Fine, 0 % sand 3450
19 mm, Fine, 40 % sand 3138
0
5
10
15
20
25
2000 2250 2500 2750 3000 3250 3500 3750 4000
Car Force, lbs
Ru
t D
epth
, mm
70,opti 70,Opti+ 76,Opti 76,Opti+70,Opti 70,Opti+ 76,Opti 76,Opti+
Figure 4.1 Relationship between CAR Force and Rutting Potential
4.3 ANALYSIS
4.3.1 ANOVA of APA Results
Statistical analysis was conducted using the Design Expert software, to identify
the factors that have a significant effect on rutting potential of asphalt mixtures. Value of
“probability > F” less than 0.0500 was used as an indication for the existence of a
significant effect. The ANOVA results are presented in Table B1 in Appendix B. All
five main factors, gradation, NMAS, sand content, binder content and binder grade were

40
found to have a significant effect on rutting potential. Interaction of gradation with sand
content, gradation with binder grade, NMAS with binder content and sand content with
binder grade were the most significant among the two factor interactions.
Among the main effects, binder grade had a significant effect on rutting potential
with a “probability > F” value being less than 0.0001. The average rut depth of mixtures
made with PG70-22 asphalt binders was twice as high (14.2 mm) as the average rut depth
of mixtures made with PG76-22 asphalt binder (7.17 mm). The values of
“Probability>F” for the factors that have significant effect on estimated rutting potential
of asphalt mixtures is shown in Table 4.4.
For the estimated rut depth, two factor interactions can be explained as follows:
v Gradation interaction with sand content: For mixtures with 0 percent sand, the
estimated rut depth increased by 2.7 mm, when gradation was changed from
coarse to fine. For mixtures with 40 percent sand, the rut depth increased by
6.7 mm, on using fine gradation instead of a coarse gradation. Hence, the effect
of gradation was much greater when sand was used.
v Gradation interaction with Binder grade : Changing gradation from coarse to
fine increased rut depth by 1.6 mm, when PG76-22 binder was used. But on
using the PG70-22 binder, rut depth increased by 4.7 mm. Hence, the effect of
gradation was greater when PG70-22 was used.
v NMAS interaction with binder content: For mixtures with 9.5 mm NMAS,
increasing the binder content from optimum to optimum + 0.5 percent, increased
the rut depth by 3.1 mm. But, for mixes with 19 mm NMAS, increasing the
binder content by 0.5 percent, did not have a significant effect on rut depth
(0.37 mm). Hence, the effect of NMAS is more significant when optimum+
binder content was used.
v Binder grade interaction with sand content : For mixtures with 0 percent sand,
the estimated rut depth increased by 7.2 mm when a PG70-22 asphalt binder was
used instead of a PG76-22. Whereas, for mixtures with 40 percent sand, there
was a 9.9 mm increase in rut depth, when a PG70-22 binder grade was used
instead of PG76-22.

41
4.3.2 ANOVA of IDT Strength Test Results
Design Expert was run to identify the factors that have a significant effect on the
estimated IDT strength test and the values of “Probability > F” for the factors are shown
in Table 4.4. The ANOVA results are summarized in Table B2 in Appendix B.
Table 4.4 Effect of Factors on Rut Depth and IDT Strength
Prob > F Factors
Rut depth IDT
strength A-Gradation 0.001 0.0087 B-NMAS 0.0453 0.3842* C-Sand Content 0.0006 0.0005 D-Binder Content 0.016 0.0109 E-Binder Grade < 0.0001 0.0002 AC-Gradation & Sand content interaction 0.0089 0.5471* AE- Gradation & Binder grade interaction 0.0255 0.8346* BD-NMAS & Binder content interaction 0.0393 0.1003* CE- Sand content & Binder grade interaction 0.0436 0.1624*
* Non-significant at 95% confidence interval
The following conclusions were made after carrying out the statistical analysis
v Except for NMAS, the other four main factors had a significant effect on
the estimated IDT strength of asphalt mixtures.
v None of the two factor interactions had a significant effect on IDT
strength.
v Reducing the sand content from 40 percent to 0 percent, increased the IDT
strength by 2.5 psi
v IDT strength is significantly affected by asphalt binder grade, where the
use of PG76-22 binder instead of PG70-22 increased the IDT strength by
3.01 psi. This confirms the findings of Anderson et al [2003]
v Binder grade having the most significant effect on IDT strength confirms
the fact that IDT strength test provides information on mixture cohesion,

42
which is a binder property, and not much information on angle of internal
friction, which is an aggregate property.
4.3.3 Regression Analysis
Following the ANOVA, least-square regression analysis was performed using
Microsoft Excel to further explore trends in the data. Figure 4.2 shows the relationship
between rutting potential and indirect tensile strength. The resulting equation, as shown
y = -1.843x + 31.283
R2 = 0.7791
0.0
5.0
10.0
15.0
20.0
25.0
6 8 10 12 14 16
IDT Strength, psi
Rut
dep
th, m
m
Figure 4.2 Relationship between IDT Strength and Rutting Potential
in the Figure shows a significant trend between rutting potential and IDT strength. The
standard error for this equation was 2.36 and the R2 was 0.78. Since the ANOVA
showed that all the main effect factors had a significant effect on rut depth, a regression
model was developed with all of the experiment factors and the indirect tensile strength
as the independent variables. The results of this analysis are shown in Table 4.5.
Figure 4.3 shows the relationship between rutting potential and IDT strength with
the influence of binder type highlighted. It can be observed that the slope for the trend
line for the samples with the PG70-22 binder is similar to the slope for all the data, while
the slope of the samples with the PG76-22 binder is much flatter. In other words, the use
of modified binder minimized the influence of the other factors on rutting potential. It
can also be noted that most of the samples with the modified binder had lower rutting
potential than the samples made with the unmodified binder.

43
Next the influence of binder content was evaluated. As shown on Figure 4.4,
there is no discernable difference between the slope of all the data and the slopes for the
samples with optimum binder content and optimum plus 0.5 percent binder content.
Table 4.5 Regression Analysis of Rutting Potential with IDT Strength and Main
Experimental Factors.
Regression Statistics
Multiple R 0.93
R Square 0.87
Adjusted R Square 0.78
Standard Error 2.25
Observations 16
ANOVA
df SS MS F Significance F
Regression 6 306.56 51.09 10.11 0.001
Residual 9 45.50 5.06
Total 15 352.06
Coefficients Standard Error t Stat
Intercept 16.09 9.59 1.68
IDT -0.48 0.86 -0.57
Gradation -1.27 0.78 -1.61
NMAS -0.59 0.58 -1.03
Sand 1.14 1.20 0.95
Binder Content 0.58 0.76 0.76
Binder Grade -2.79 1.41 -1.98
Based on this graph, it was decided to perform a Student t test on the means of the
optimum and the optimum plus samples. The computed t statistic is 0.71; the critical t
value for an alpha level of 95 percent and 14 degrees of freedom is 2.14. Hence, there is
not sufficient evidence to reject the null hypothesis that the means of the two sample sets
are equal.
The influence of aggregate characteristics on rutting potential is evaluated in
Figure 4.5. The slope of the trend lines for each combination of NMAS, 9.5 mm and
19 mm and gradation, coarse versus fine is similar to the slope of the trend line for all
data.

44
Figure 4.3 Relationship between Rutting Potential and IDT Strength, with
Influence of Binder Type
Figure 4.4 Influence of Binder Content on Rutting Potential
0
5
10
15
20
25
0 2 4 6 8 10 12 14 16
IDT Strength
Ru
t D
epth
PG 76-22 PG 70-22 Linear (PG 76-22) Linear (PG 70-22)
0
5
10
15
20
25
0 2 4 6 8 10 12 14 16
IDT Strength
Ru
t D
epth
Opt+i Opti All Data Opti Opti+

45
Figure 4.5 Influence of Aggregate Characteristics on Rutting Potential
The influence of gradation and sand content is shown on Figure 4.6. The slope of
the trend lines for the combinations of aggregate and sand content appear different from
the trend line for all the data. Since the sand content is known to influence rutting
performance, t tests were preformed to investigate the influence of these parameters. The
results of the t tests were:
t value df t crit
With sand -No sand 1.50 14 2.14
With sand -Binder type -3.02 6 2.45
No sand -Binder type -7.76 6 2.45
The comparison of samples with and without sand indicates there is not sufficient
information to reject the null hypothesis of equal means. However, when the data are
separated by binder type, analysis indicates the null hypothesis can be rejected. In other
words, the main factor of sand content was not significant, but the interaction of sand
content and binder type is significant. The ANOVA found both the main factor and
interaction terms were significant. The difference in conclusions that can be drawn from
the ANOVA and the t test is attributed to the differences in the statistical analysis
methods.
0
5
10
15
20
25
0 2 4 6 8 10 12 14 16
IDT Strength
Ru
t D
epth
Coarse 19 Fine 19 Coarse 9.5
Fine 9.5 Fine 9.5 Fine 19
Coarse 9.5 Coarse 19 All Data

46
Figure 4.6 Influence of Sand and Gradation on Rutting Potential
4.4 EVALUATION OF COVARIANT TERMS
As reviewed in Chapter 2, Anderson et al [2003] found that rutting potential could
be estimated from IDT strength, VMA and k. Since these factors were not directly
controlled in the experimental design, an ANOVA could not be performed. Therefore, a
least-squares regression analysis was performed to evaluate the relationship between
these variables and rutting performance. The results of the regression analysis are
presented in Table 4.6. The t test for the coefficients indicates IDT strength and k were
significant and VMA was not significant at the 95 percent confidence level. Therefore,
the regression was repeated with only IDT and compaction slope, producing the results in
Table 4.7. Figure 4.7 is a plot of the measured and predicted values of rut depths. The
line of equality demonstrates the equation does a reasonable job of prediction. The R2 for
the equation in Table 4.7 is 0.848, which compares favorably with Anderson et al [2003].
The sign of the coefficients, positive for k value and negative for IDT strength
0
5
10
15
20
25
6 8 10 12 14 16
IDT Strength
Rut
Dep
th
Coarse with Sand Coarse No sandFIne with Sand Fine No sandAll Data Fine with SandCoarse no Sand Coarse with SandLinear (Fine No sand)

47
are the same as found by Anderson et al [2003]. It is not possible to compare the
magnitude of the coefficients since the testing methods are different between this
research and the previous literature.
Table 4.6 Regression Analysis of Rutting Potential versus IDT Strength, VMA and k
Regression Statistics Multiple R 0.92 R Square 0.85 Adjusted R Square 0.81 Standard Error 2.11 Observations 16
ANOVA
df SS MS F Significance F Regression 3 298.6 99.54 22.36 3.34E-05 Residual 12 53.4 4.45 Total 15 352.1
Coefficients Standard
Error t Stat
Intercept 10.4 12.63 0.82 k 2.454 1.047 2.34 VMA -0.0030 0.522 <0.10
IDT -2.038 0.274 -7.44
Table 4.7 Regression Analysis of Rutting Potential versus IDT Strength, and k
Regression Statistics Multiple R 0.921 R Square 0.848 Adjusted R Square
0.825
Standard Error
2.027
Observations 16 ANOVA
df SS MS F Significance F Regression 2 298.630 149.315 36.329 <0.001 Residual 13 53.431 4.110 Total 15 352.062 Coefficients Standard
Error t Stat
Intercept 10.36 8.97 1.15 k 2.45 1.01 2.43 IDT -2.04 0.24 -8.51

48
Figure 4.7 Predicted versus Measured Rutting Potential
4.5 SUMMARY OF RESULTS
All the five factors considered in the research had a significant effect on rutting
potential. Binder grade had the most significant effect based on the Prob>F value of the
ANOVA. In addition, the five of the ten two-way interaction effects were significant.
The ANOVA for the IDT strength demonstrated all main effects except for NMAS as
significant. Since binder grade had the most significant effect on IDT strength, this result
agrees with the research presented by Christensen et al [2000] who found that cohesion is
linearly related to IDT strength, Figure 2.6, and that cohesion is largely dependent on
binder properties and is insensitive to aggregate characteristics. However, the
significance of gradation on IDT strength cannot be explained by Christensen's concept
of using Mohr's theory.
Rutting potential of asphalt mixtures, as evaluated with the APA, has a strong
correlation with its IDT strength as estimated using the Marshall Stabilometer.
Anderson et al [2003] found a strong correlation between rutting potential and IDT
strength, VMA, and k. But in this research, VMA was not a significant contributor to
rutting potential. IDT and compaction slope provided a regression equation with good
predictive capability. CAR force indicated a negative slope with rutting potential.
0
5
10
15
20
25
0 5 10 15 20 25
P r e d i c t e d
Mea
sure
d

49
CHAPTER 5:CONCLUSIONS AND RECOMMENDATIONS
5.1 CONCLUSIONS
This research was based on the hypothesis that the rutting potential of asphalt
mixtures evaluated from APA is governed by three main parameters-compaction slope,
VMA and IDT strength. As per Anderson et al [2003], IDT strength provides valuable
information about the rutting potential of asphalt mixtures. Anderson used RSCH to
estimate the rutting potential, which is sophisticated and expensive. APA is widely
available in the industry for evaluating the rutting potential of asphalt mixtures.
Anderson evaluated the IDT strength at a deformation rate of 3.75 mm/min, and not
many state highway agencies have IDT strength measuring equipment that operates at
this deformation rate. For the IDT strength testing procedure to be readily implemented
by state highway agencies, there was a need to extend Anderson’s work to use equipment
readily available to state highway agencies.
The Marshall Stabilometer, with a modified loading head, has a fixed deformation
rate of 50 mm/min and is widely used to measure the IDT strength for evaluating the
stripping behavior of asphalt concrete. The objective of this research was to see if the
IDT strength obtained from a Marshall Stabilometer could be used as a simple proof test.
Since the loading rate (50 mm/min) used in this research was higher than that used by
Anderson (3.75 mm/min), testing was done at a temperature (60?C) higher than that
adopted by Anderson (34?C).
In addition to IDT strength, VMA and compaction slope obtained from SGC were
also evaluated to see if rutting potential could be correlated with these parameters of
asphalt concrete.
Half fractional factorial was applied and factors that have a significant effect on
rut depth and IDT strength were evaluated using Design Expert 6.0. It was found that all
main factors were significant in the analysis of rut depth. NMAS was not a significant
factor in the analysis of IDT strength. Binder grade had “Probability > F” <0.0001 for
both rut depth and IDT strength, indicating that it is the most significant factor. Binder
grade having a significant effect on IDT strength, while NMAS being insignificant, is in
50
argument with Anderson et al’s [2003] assertion that IDT strength is actually an indicator
of mixture cohesion and not internal friction.
Statistical models were developed to evaluate the relationship of rut depth with
IDT strength, VMA, and compaction slope. The best model statistically was the one that
correlated rut depth with IDT strength and compaction slope. In this model, the negative
coefficient for IDT strength indicated that as the IDT strength increases, there is a
decrease in rut depth. The compaction slope had a positive coefficient, indicating that
mixes with more resistance to compaction offer better rutting resistance. Contrary to
Anderson's results, VMA was not selected as an independent variable for the final
equation. Least squares regression with VMA included demonstrated the coefficient was
not statistically significant. This is an apparent contradiction with Anderson's work,
however, it should be noted that the range of VMA for the materials studied in this
research was very limited and in all cases close to the minimum allowable values.
Hence, the failure to find VMA as a significant regression variable could be an artifact of
the mixes studied in this research.
5.2 RECOMMENDATIONS FOR FUTURE STUDY
This preliminary investigation ind icates that the IDT strength of asphalt concrete,
as measured with the Marshall stabilometer at 50mm/min and 60°C, provides valuable
information about the rutting potential of asphalt concrete. However, a considerable
amount of further research is needed before the results of this research should be
implemented.
Sample dimensions and testing protocol were selected based on convenience
rather than scientific principles. In keeping with the requirements that the methodology
is restricted to readily available equipment, the parameters of sample diameter (150 mm)
and loading rate (50 mm/min) should remain fixed. However, research could be
performed to evaluate the selection of other testing parameters, including sample
thickness, air voids, and test temperature. The principle of time-temperature
superposition could be developed to allow interpretation of results across different testing
parameters and there by aid in the selection of loading rate and test temperature.
The inference space of this experiment could be extended by including a wider
range of aggregate types, gradations, and sizes. Based on the work of Jahn [2003], it may

51
be possible to use the CAR test to evaluate the potential internal friction of an aggregate
blend in an asphalt mix as part of the fine aggregate specification. An attempt can be
made to see how well the rutting potential of asphalt mixtures correlate with IDT
strength, and CAR force. By doing this, in a relatively simple way, it might be possible
to evaluate the effect of both cohesion and internal friction on rut resistance.
It has been intrinsically assumed throughout this research that the asphalt
pavement analyzer provides reliable information about the rutting potential of asphalt
concrete mixes. This assumption is not universally embraced by the paving community.
Before the results of this research, or any similar studies of mixture performance, are
used for the developments of standards or specifications, there should be field studies of
mixture performance to validate the laboratory results.

52
REFERENCES
Anani, A. B., “Laboratory and Field Study of Pavement Rutting in Saudi Arabia”, Transportation Research Record, 1259, National Research Council, Washington D.C, 1990, pp 79-90.
Anderson, R.M., Turner, A. P., Peterson, L. R., and Mallick, B. R., “Relationship of Superpave Gyratory Compaction Properties to HMA Rutting Behavior”, NCHRP Report 478, Transportation Research Board, Washington D.C, 2002a, pp 1-16.
Anderson, R.M., “Relationship between Superpave Gyratory Compaction Properties and the Rutting Potential of Asphalt Mixtures”, Asphalt Paving Technology, Association of Asphalt Paving Technologists-Proceedings of the Technical Sessions, Vol – 71, 2002b, pp 207-247.
Anderson, R.M., “Using Superpave Gyratory Compaction Properties to Estimate the Rutting Potential of Asphalt Mixtures”, Asphalt Paving Technology, Association of Asphalt Paving Technologists-Proceedings of the Technical Sessions, Vol – 71, 2002c, pp 725-738.
Anderson, R.M., Christensen, W. D., and Bonaquist, R., “Estimating the Rutting Potential of Asphalt Mixtures Using Superpave Gyratory Compaction Properties and Indirect Tensile Strength”, Association of Asphalt Paving Technologists-Proceedings of the Technical Sessions, Vol – 72, 2003.
Christensen, W. D., Bonaquist, R., and Jack, D.P., “Evaluation of Triaxial Strength as a Simple Test for Asphalt Concrete Rut Resistance”, Final Report, Pennsylvania Department of Transportation, 2000.
Christensen, W. D., and Bonaquist, R., “Use of Strength Tests for Evaluating the Rut Resistance of Asphalt Concrete”, Asphalt Paving Technology, Association of Asphalt Paving Technologists-Proceedings of the Technical Sessions, Vol – 71, 2002, pp 692-711.
Jahn D. W., “Compacted Aggregate Resistance Test”, Presentation at ICAR, May 2003. http://www.seaupg.org/Media/Agg_Issues_DJahn_02.pdf
McGennis, R. B., Anderson, R. M., Perdomo, D., and Turner, A.P., “Issues Pertaining to Use of Superpave Gyratory Compactor”, Transportation Research Record 1543, Transportation Research Board, National Research Council, Washington D.C, 1996, pp 139-144.
Roque, R., and Buttlar, G. W., “The Development of a Measurement and Analysis System to Accurately Determine Asphalt Concrete Properties Using the Indirect Tensile Mode”, Association of Asphalt Paving Technologists-Proceedings of the Technical Sessions, Vol 61, 1992, pp 304 – 328.
Sontowski, P., “Better Roads”, Proceedings of the ICSM, n – 12, Dec 1995, pp 35-36.

53
Specifications and Test Methods
1. Sieve Analysis, ASTM C136, 1984 Specification for Superpave Volumetric Mix Design, AASHTO MP2, 2001.
2. Specific Gravity and Absorption of Fine Aggregate, AASHTO T84, 2000
3. Specific Gravity and Absorption of Coarse Aggregate, AASHTO T85, 2000
4. Bulk Specific Gravity of Compacted Bituminous Mixtures Using Saturated Surface-Dry Specimens, AASHTO T166, 2000.
5. Theoretical Maximum Specific Gravity and Density of Bituminous Paving Mixtures, AASHTO T209, 1999.
6. West Virginia Division of Highways, Standard Specifications, Charleston, West Virginia, 2000.

54
APPENDIX A – TEST RESULTS
Table A1 Blend Gradation – 9.5mm NMAS - Coarse
Material #9 #1 #2 Skid(2002) Blend Sieve size 0% 0% 47% 53% 100%
9.5 100 100 100 94 96.8 4.75 75 99.8 100 2.8 48.5 2.36 2.5 80.9 75.5 1.6 36.3 1.18 1.5 50.9 43 1.5 21.0 0.6 1.4 32.9 23.6 1.4 11.8 0.3 1.3 21.2 12.7 1.3 6.7 0.15 1.3 13.6 7.6 1.3 4.3 0.075 1.2 9.5 6 1.1 3.4
Table A2 Blend Gradation – 9.5mm NMAS – Fine
Material #9 #1 #2 Skid(2002) Blend 32% 25% 23% 20% 100%
12.5 100 100 100 100 100.0 9.5 100 100 100 94 98.8 4.75 75 99.8 100 2.8 72.5 2.36 2.5 80.9 75.5 1.6 38.7 1.18 1.5 50.9 43 1.5 23.4 0.6 1.4 32.9 23.6 1.4 14.4 0.3 1.3 21.2 12.7 1.3 8.9 0.15 1.3 13.6 7.6 1.3 5.8 0.075 1.2 9.5 6 1.1 4.4

55
Table A3 Blend Gradation - 19mm NMAS - Coarse
Material #1 #2 #3 #4 #5 Blend Sieve size 50% 13% 0% 0% 37% 100%
25 100 100 100 100 100 100.0 19 88 100 100 100 100 94.0
12.5 42 100 100 100 100 71.0 9.5 11 96.6 100 100 100 55.1 4.75 2 6.9 75 99.8 100 38.9 2.36 1.9 1.6 2.5 80.9 75.5 29.1 1.18 1.8 1.3 1.5 50.9 43 17.0 0.6 1.7 1.2 1.4 32.9 23.6 9.7 0.3 1.7 1.2 1.3 21.2 12.7 5.7 0.15 1.6 1.2 1.3 13.6 7.6 3.8 0.075 1.5 1 1.2 9.5 6 3.1
Table A4 Blend Gradation - 19mm NMAS - Fine
Material #1 #2 #3 #4 #5 Blend Sieve size 21% 21% 20% 16% 22% 100%
25 100 100 100 100 100 100.0 19 88 100 100 100 100 97.5
12.5 42 100 100 100 100 87.8 9.5 11 96.6 100 100 100 80.6 4.75 2 6.9 75 99.8 100 54.8 2.36 1.9 1.6 2.5 80.9 75.5 30.8 1.18 1.8 1.3 1.5 50.9 43 18.6 0.6 1.7 1.2 1.4 32.9 23.6 11.3 0.3 1.7 1.2 1.3 21.2 12.7 7.1 0.15 1.6 1.2 1.3 13.6 7.6 4.7 0.075 1.5 1 1.2 9.5 6 3.6

56
Table A5 9.5 mm NMAS - 0% Natural Sand COARSE FINE
Original* Lime Stone dust reduced Original LS dust reduced
Trial # Contractor Orig 1 Orig 2 Trial 1 Trial 2 Trial 1 Trial 2 Trial 3
Binder 70 70 76 70 76 70 70 76 70 70
Pb 5.7 5.7 5.4 5.1 5.1 5.8 5.4 5.4 6.0 6.6
VTM 4.0 1.2 3.0 5.4 5.2 4.2 4.4 5.0 5.5 3.7
VMA 15.5 13.7 14.4 14.2 14.0 14.7 13.2 13.6 15.3 14.6
VFA 74.0 91.2 79.2 62.0 62.9 71.4 66.7 63.2 64.1 74.6
Dust % 5.2 5.2 5.2 3.6 3.6 3.4 4.4 4.4 3.8 3.8
D/Pbe - - - 0.92 0.92 0.74 1.16 1.16 0.88 0.81
* with the original gradation and contractor specified optimum asphalt content
Table A6 9.5 mm NMAS - 40% Natural Sand FINE COARSE
Lime stone dust reduced LS dust reduced
Original
LS dust LS dust NS dust NS dust reduced further
Original
LS dust Original NS dust NS dust reduced
Trial # Trial 1 Trial 1 Trial 1 Trial 2 Trial 2 Trial 3 Trial 4 Trial 1 Trial 1 Trial 2 Trial 1 Trial 2
Binder 70 76 70 76 70 76 70 70 70 76 70 76 70 76 70 76 70 76 70 70
Pb 5.0 5.0 5.5 5.5 5.8 5.4 5.7 6.2 6.4 6.6 5.0 5.0 5.0 5.0 5.9 5.9 5.7 5.3 5.7 6.2
VTM 5.5 5.1 5.8 5.2 4.8 4.9 5.7 5.0 5.2 3.8 4.1 4.3 6.2 6.2 3.4 2.5 4.9 5.3 5.5 4.0
VMA 13.7 13.4 15.0 14.4 14.9 14.5 15.3 15.8 17.1 14.7 13.7 13.4 15.4 15.4 14.8 14.3 15.7 15.2 16.3 15.7
VFA 59.9 61.9 61.3 63.9 67.8 66.2 62.7 68.4 69.6 74.1 70.1 67.9 59.7 59.7 77.0 82.5 68.8 65.1 66.3 74.5
Dust % 5.2 5.2 4.4 4.4 3.6 3.6 3.2 3.2 2.8 3.2 4.1 4.1 3.6 3.6 3.6 3.6 3.2 3.2 2.7 2.7
D/Pbe 1.44 1.41 1.07 1.07 0.98 1.02 0.74 0.67 0.52 0.68 1.00 1.03 0.88 0.88 0.72 0.71 0.75 0.84 0.55 0.52

57
Table A7 19 mm NMAS – 0% Sand
COARSE FINE
Original*
Lime Stone dust reduced
Original dust LS dust reduced
Trial # Contractor Orig 1 Trial 2 Trial 3 Trial 4 Trial 1 Trial 2 Trial 1 Trial 2
Binder 70 76 70 76 70 76 70 70 70 76 70 70
Pb 4.8 4.8 5.3 5.3 4.6 4.2 4.8 5.5 4.4 4.3 5.1 5.9
VTM 4.0 2.5 2.2 1.3 3.7 4.0 3.8 1.3 4.2 4.2 5.4 3.7
VMA 14.0 12.5 12.2 11.5 11.6 11.0 12.5 11.3 11.4 11.0 14.1 14.0
VFA 71.0 80.0 82.0 88.7 68.1 63.6 69.6 88.5 63.2 61.8 61.7 73.6
Dust % 4.3 4.3 3.5 3.5 3.5 3.5 3.1 4.5 4.5 4.5 3.6 3.6
D/Pbe - -
- 0.92 0.92 1.13 1.30 0.82 1.10 1.5 1.55 0.95 0.80
* with the original gradation and contractor specified optimum asphalt content
Table A8 19 mm NMAS – 40% Sand
COARSE FINE
Original dust NS* dust reduced Original dust NS dust reduced
Trial 1 Trial 1 Trial 1 Trial 1 Trial 2 Trial 3
Binder 70 76 70 76 70 76 70 76 70 70
Pb 4.6 4.2 4.8 4.8 4.4 4.3 4.8 4.8 5.4 5.9
VTM 1.7 3.0 3.8 3.6 4.6 3.4 6.9 6.1 4.5 4.1
VMA 11.5 11.5 12.7 12.3 12.0 11.4 14.4 13.6 14.6 15.2
VFA 85.2 73.9 70.1 70.7 61.7 70.2 52.1 55.1 69.2 73.0
Dust % 3.5 3.5 2.7 2.7 4.5 4.5 3.1 3.1 3.1 3.1
D/Pbe 0.85 0.97 0.71 0.71 1.36 1.32 0.91 0.94 0.69 0.63
* NS: Natural Sand

58
Table A9 Description of Mixes
Mix Description
1 9.5 mm, Coarse, 0% Sand, PG 76-22, Optimum
4 19 mm, Coarse, 40% Sand, PG 76-22, Optimum
6 9.5 mm, Fine, 40% Sand, PG 76-22, Optimum
7 19 mm, Fine, 0% Sand, PG 76-22, Optimum
10 9.5 mm, Coarse, 40% Sand, PG 76-22, Optimum +0.5%
11
13
19 mm, Coarse, 0% Sand, PG 76-22, Optimum +0.5%
13 9.5 mm, Fine, 0% Sand, PG 76-22, Optimum +0.5%
16
19
19 mm, Fine, 40% Sand, PG 76-22, Optimum +0.5%
18
921
9.5 mm, Coarse, 40% Sand, PG 70-22, Optimum
19 19 mm, Coarse, 0% Sand, PG 70-22, Optimum
21 9.5 mm, Fine, 0% Sand, PG 70-22, Optimum
24
\
19 mm, Fine, 40% Sand, PG 70-22, Optimum
25 9.5 mm, Coarse, 0% Sand, PG 70-22, Optimum +0.5%
28 19 mm, Coarse, 40% Sand, PG 70-22, Optimum +0.5%
30 9.5 mm, Fine, 40% Sand, PG 70-22, Optimum +0.5%
31 19 mm, Fine, 0% Sand, PG 70-22, Optimum +0.5%

59
Table A10 Computations for Compaction Slope
Mix Gmb Gmm hini hdes Nini Ndes %Gmm,des %Gmm,ini k 1 2.379 2.483 130.9 116.1 8 100 95.81 84.98 9.88 4 2.412 2.502 127.7 115.4 8 100 96.40 87.12 8.47 6 2.345 2.450 131.6 118.2 8 100 95.71 85.97 8.88 7 2.393 2.473 130.9 116.7 8 100 96.77 86.27 9.57 10 2.377 2.427 128.8 115.9 8 100 97.94 88.13 8.94 11 2.628 2.489 128.5 114.9 8 100 105.58 94.41 10.19 13 2.369 2.423 131.1 116.4 8 100 97.77 86.81 9.99 16 2.386 2.443 129 116.1 8 100 97.67 87.90 8.90 18 2.354 2.452 129.1 115.9 8 100 96.00 86.19 8.95 19 2.415 2.510 130.4 116.2 8 100 96.22 85.74 9.55 21 2.363 2.453 132.6 117.1 8 1 00 96.33 85.07 10.27 24 2.353 2.454 129.9 116.7 8 100 95.88 86.14 8.88 25 2.379 2.471 131.9 117.1 8 100 96.28 85.47 10.07
28 2.402 2.496 129.0 115.5 8 100 96.23 86.16 9.18 30 2.246 2.433 132.5 117.4 8 100 92.31 81.79 8.92 31 2.382 2.473 130.5 115.8 8 100 96.32 85.47 9.89

60
Figure A1 Plot of Load versus Deformation - IDT Strength

61
Figure A2 Plot of CAR Force versus Deformation

62
APPENDIX B - ANOVA
Table B1 ANOVA for Rut Depth
Response: Rut depth ANOVA for Selected Factorial Model Analysis of variance table [Partial sum of squares] Sum of Mean F Source Squares DF Square Value Prob > F Model Model 345.43 9 38.38 34.71 0.0002 significant A 39.69 1 39.69 35.9 0.001 B 7.02 1 7.02 6.35 0.0453 C 48.51 1 48.51 43.88 0.0006 D 12.18 1 12.18 11.02 0.016 E 197.54 1 197.54 178.67 < 0.0001 AC 16.04 1 16.04 14.51 0.0089 AE 9.64 1 9.64 8.72 0.0255 BD 7.62 1 7.62 6.89 0.0393 CE 7.18 1 7.18 6.5 0.0436 Residual 6.63 6 1.11 Cor Total 352.06 15 The Model F-value of 34.71 implies the model is significant. There is only a 0.02% chance that a "Model F-Value" this large could occur due to noise. Values of "Prob > F" less than 0.0500 indicate model terms are significant. In this case A, B, C, D, E, AC, AE, BD, CE are significant model terms. Values greater than 0.1000 indicate the model terms are not significant. If there are many insignificant model terms (not counting those required to support hierarchy), model reduction may improve your model. Std. Dev. 1.05 R-Squared 0.9812 Mean 10.68 Adj R-Squared 0.9529 C.V. 9.84 Pred R-Squared 0.866 PRESS 47.17 Adeq Precision 20.613 The "Pred R-Squared" of 0.8660 is in reasonable agreement with the "Adj R-Squared" of 0.9529. Adeq Precision measures the signal to noise ratio. A ratio greater than 4 is desirable. Your ratio of 20.613 indicates an adequate signal. This model can be used to navigate the design space.

63
Coefficient Standard 95% CI 95% CI Factor Estimate DF Error Low High VIF
Intercept 10.68 1 0.26 10.04 11.33 A-Gradation -1.57 1 0.26 -2.22 -0.93 1 B-NMAS -0.66 1 0.26 -1.31 -0.019 1 C-Sand content 1.74 1 0.26 1.1 2.38 1 D-Binder Content -0.87 1 0.26 -1.52 -0.23 1 E-Binder Grade -3.51 1 0.26 -4.16 -2.87 1 AC -1 1 0.26 -1.64 -0.36 1 AE 0.78 1 0.26 0.13 1.42 1 BD 0.69 1 0.26 0.047 1.33 1 CE -0.67 1 0.26 -1.31 -0.027 1 Final Equation in Terms of Coded Factors:
Rut depth = 10.68 -1.57 * A -0.66 * B 1.74 * C
-0.87 * D -3.51 * E
-1 * A * C 0.78 * A * E 0.69 * B * D
-0.67 * C * E Final Equation in Terms of Actual Factors: Not available, because this model contains more than 4 categorical equations. Diagnostics Case Statistics
Standard Actual Predicted Student Cook's Outlier Run Order Value Value Residual Leverage Residual Distance t Order
1 7.71 8.12 -0.41 0.625 -0.637 0.068 -0.602 7 2 11.9 12.66 -0.76 0.625 -1.18 0.232 -1.23 6 3 12.43 12.65 -0.22 0.625 -0.349 0.02 -0.322 15 4 5.52 5.82 -0.3 0.625 -0.466 0.036 -0.433 8 5 23.18 22.18 1 0.625 1.545 0.398 1.818 16 6 8.84 8.66 0.18 0.625 0.272 0.012 0.25 4 7 10.62 9.56 1.06 0.625 1.646 0.452 2.029 5 8 12.24 12.77 -0.53 0.625 -0.831 0.115 -0.806 14 9 12.46 12.23 0.23 0.625 0.349 0.02 0.322 11 10 5.7 5.4 0.3 0.625 0.466 0.036 0.433 9 11 5.46 5.05 0.41 0.625 0.637 0.068 0.602 1 12 10.35 9.59 0.76 0.625 1.18 0.232 1.23 10 13 8.08 9.14 -1.06 0.625 -1.646 0.452 -2.029 13 14 12.89 12.35 0.54 0.625 0.831 0.115 0.806 12 15 18.12 19.11 -0.99 0.625 -1.545 0.398 -1.818 3 16 5.42 5.59 -0.17 0.625 -0.272 0.012 -0.25 2

64
Table B2 ANOVA for IDT Strength
Response: IDT Strength ANOVA for Selected Factorial Model Analysis of variance table [Partial sum of squares]
Sum of Mean F Source Squares DF Square Value Prob > F Model Model 73.85 5 14.77 21.41 < 0.0001 significant
A 6.55 1 6.55 9.5 0.0116 B 0.34 1 0.34 0.5 0.4973 C 24.8 1 24.8 35.95 0.0001 D 5.86 1 5.86 8.49 0.0155 E 36.3 1 36.3 52.62 < 0.0001
Residual 6.9 10 0.69 Cor Total 80.75 15
The Model F-value of 21.41 implies the model is significant. There is only a 0.01% chance that a "Model F-Value" this large could occur due to noise. Values of "Prob > F" less than 0.0500 indicate model terms are significant. In this case A, C, D, E are significant model terms. Values greater than 0.1000 indicate the model terms are not significant. If there are many insignificant model terms (not counting those required to support hierarchy), model reduction may improve your model.
Std. Dev. 0.83 R-Squared 0.9146 Mean 11.18 Adj R-Squared 0.8719 C.V. 7.43 Pred R-Squared 0.7813
PRESS 17.66 Adeq Precision 15.714 The "Pred R-Squared" of 0.7813 is in reasonable agreement with the "Adj R-Squared" of 0.8719. Adeq Precision measures the signal to noise ratio. A ratio greater than 4 is desirable. Your ratio of 15.714 indicates an adequate signal. This model can be used to navigate the design space.
Coefficient Standard 95% CI 95% CI Factor Estimate DF Error Low High VIF
Intercept 11.18 1 0.21 10.71 11.64 A-Gradation 0.64 1 0.21 0.18 1.1 1
B-NMAS 0.15 1 0.21 -0.32 0.61 1 C-Sand content -1.25 1 0.21 -1.71 -0.78 1
D-Binder Content 0.6 1 0.21 0.14 1.07 1 E-Binder Grade 1.51 1 0.21 1.04 1.97 1

65
Final Equation in Terms of Coded Factors: IDT Strength =
11.18 0.64 * A 0.15 * B
-1.25 * C 0.6 * D
1.51 * E Final Equation in Terms of Actual Factors: Not available, because this model contains more than 4 categorical equations. Diagnostics Case Statistics
Standard Actual Predicted Student Cook's Outlier Run Order Value Value Residual Leverage Residual Distance t Order
1 12.97 12.54 0.43 0.375 0.659 0.043 0.639 7 2 9.96 10.81 -0.85 0.375 -1.287 0.166 -1.337 6 3 8.86 9.82 -0.96 0.375 -1.458 0.213 -1.559 15 4 15.07 14.11 0.96 0.375 1.462 0.214 1.564 8 5 6.85 7.03 -0.18 0.375 -0.282 0.008 -0.268 16 6 10.69 11.33 -0.64 0.375 -0.971 0.094 -0.968 4 7 10.5 10.34 0.16 0.375 0.244 0.006 0.232 5 8 9.68 8.61 1.07 0.375 1.633 0.267 1.81 14 9 12.06 10.74 1.32 0.375 2.018 0.407 2.486 11 10 14.8 15.03 -0.23 0.375 -0.346 0.012 -0.331 9 11 13.88 14.04 -0.16 0.375 -0.244 0.006 -0.232 1 12 11.78 12.31 -0.53 0.375 -0.803 0.065 -0.788 10 13 10.96 11.26 -0.3 0.375 -0.453 0.021 -0.434 13 14 9.96 9.53 0.43 0.375 0.662 0.044 0.643 12 15 8.22 8.54 -0.32 0.375 -0.484 0.023 -0.464 3 16 12.6 12.83 -0.23 0.375 -0.35 0.012 -0.334 2
Proceed to Diagnostic Plots (the next icon in progression). Be sure to look at the: 1) Normal probability plot of the studentized residuals to check for normality of residuals. 2) Studentized residuals versus predicted values to check for constant error. 3) Outlier t versus run order to look for outliers, i.e., influential values. 4) Box-Cox plot for power transformations. If all the model statistics and diagnostic plots are OK, finish up with the Model Graphs icon.