performance comparison between ib school …...performance comparison between ib school students and...
TRANSCRIPT

Performance Comparison between IB School
Students and Non-IB School Students on the ISA
Presented by Ling Tan
Authored by Ling Tan & Yan Bibby
Australian Council for Educational Research
IB Africa, Europe, Middle East
Regional Conference
The Hague
October 2011

International Schools’ Assessment
(ISA)
• Assess reading, mathematics and
writing (narrative and opinion).
• Assess grade 3 to grade10.
• Mix of multiple choice and open-ended
questions in reading and mathematics
& 2 essays.
• Aligned with OECD's Programme for
International Student Assessment (PISA)
construct.
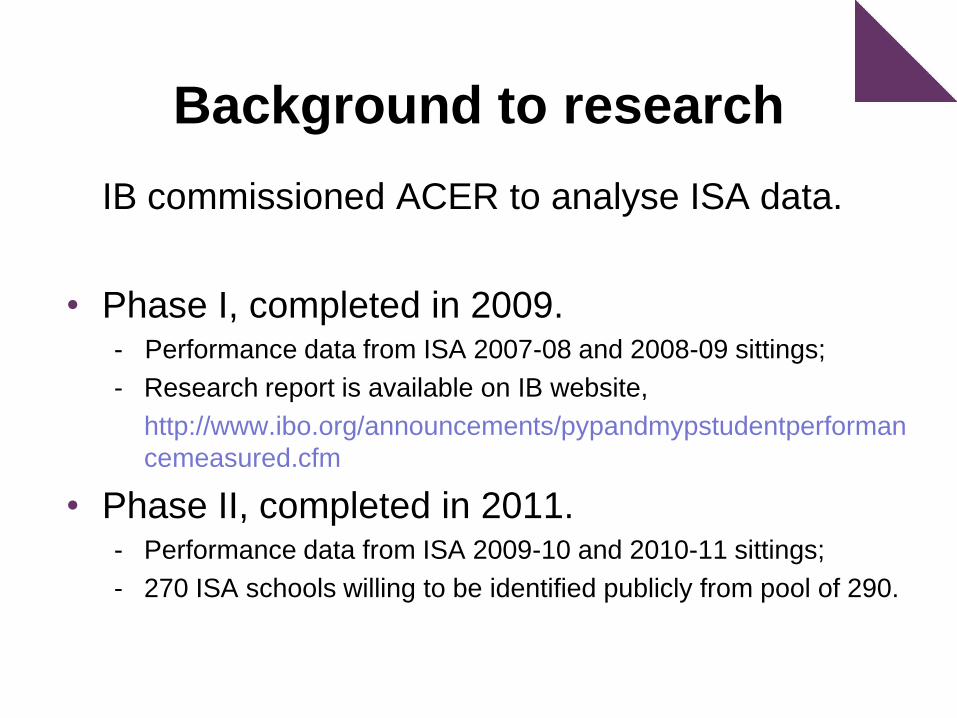
Background to research
IB commissioned ACER to analyse ISA data.
• Phase I, completed in 2009. - Performance data from ISA 2007-08 and 2008-09 sittings;
- Research report is available on IB website,
http://www.ibo.org/announcements/pypandmypstudentperforman
cemeasured.cfm
• Phase II, completed in 2011. - Performance data from ISA 2009-10 and 2010-11 sittings;
- 270 ISA schools willing to be identified publicly from pool of 290.

Background to research
Phase II tasks
• Replication of Phase I using more recent
data.• subject analysis on four ISA assessment areas;
• analysis of strengths and weaknesses within
assessment strands;
• regional analysis;
• country analysis in Asia (new);
• top-performing IB schools analysis;
• PISA benchmark analysis; and
• multilevel analysis of school variance (new).

Background to research
• Closer examination of particular
findings.
– The impact of 1, 2, or 3 programme.
– The length of programme authorization.

Schools Programme Status
CategoryAuthorized IB Programmes
No of Schools Percentage (%)
No IB Programme 80 29.6
PYP Only 18 6.7
MYP Only 1 0.4
DP Only 58 21.5
PYP + MYP + DP 61 22.6
PYP + MYP 10 3.7
MYP + DP 14 5.2
PYP + DP 28 10.4
Total 270 100.0

Background to research
• ACER classified IB cohort at grade level.
IB cohort
A student is either in grade 3 to 5 and in a PYP
school, or in grade 6 to 10 and in a MYP school.
Non-IB cohort
A student is either in grade 3 to 5 but NOT in a
PYP school, or in grade 6 to 10 but NOT in a MYP
school.

IB and Non-IB Schools and Students Distribution
(October 2009 to February 2011)
Number of Schools Number of Students
Grade IB non-IB IB non-IB
3 96 90 6,647 2,927
4 62 78 3,831 2,009
5 99 88 6,960 2,597
6 44 79 3,201 2,039
7 64 60 4,944 2,023
8 48 51 3,704 1,601
9 50 49 3,411 1,717
10 30 35 1,992 1,111
Total n/a* n/a* 34,690 16,024
*Total number of schools is not applicable here as each school may have more than
one grade.

ISA students across regions
(October 2009 to February 2011)
Grade
Asia Europe Africa Americas Oceania Total
IB non-IB IB non-IB IB non-IB IB non-IB IB non-IB IB non-IB
3 3,478 1,973 2,057 354 587 406 456 59 69 135 6,647 2,927
4 2,084 1,282 1,011 262 561 395 109 18 66 52 3,831 2,009
5 3,528 1,717 2,201 332 669 386 472 42 90 120 6,960 2,597
6 1,791 1,282 977 424 346 257 12 30 75 46 3,201 2,039
7 2,446 1,455 1,791 295 380 180 252 39 75 54 4,944 2,023
8 1,993 1,070 1,197 192 400 223 39 116 75 0 3,704 1,601
9 1,729 1,138 1,081 179 321 218 256 182 24 0 3,411 1,717
10 1,198 557 585 285 179 118 0 151 30 0 1,992 1,111
Total 18,247 10,474 10,900 2,323 3,443 2,183 1,596 637 504 407 34,690 16,024

Countries in Geographic RegionsAsia Europe Africa Americas Oceania
Bahrain Austria Botswana Bahamas FijiBangladesh Belgium Congo Chile Papua New GuineaBrunei Czech Republic Egypt MexicoCambodia Denmark Ethiopia Netherlands AntillesChina Finland Ghana Us Virgin IslandsCyprus France Kenya USAHong Kong SAR Germany Malawi VenezuelaIndia Greece MoroccoIndonesia Italy MozambiqueJapan Latvia NigeriaJordan Luxembourg South AfricaKuwait Netherlands SudanMalaysia Norway TanzaniaMyanmar Romania UgandaOman Russian Federation ZimbabwePakistan SpainPhilippines SwedenQatar SwitzerlandRepublic of Korea UkraineSaudi Arabia United KingdomSingaporeSri LankaThailandTurkeyUnited Arab EmiratesUzbekistanVietnam

MethodologySubgroup comparison:
- Statistical difference : t- test
- Practical difference : effect size, independent of sample size.
Symbols:
+ Statistically significant difference (higher), small effect size (0.1 ≤ d < 0.2)
++ Statistically significant difference (higher), medium effect size (0.2 ≤ d < 0.5)
+++ Statistically significant difference (higher), large effect size (d ≥ 0.5)
– Statistically significant difference (lower), small effect size (0.1 ≤ d < 0.2)
– – Statistically significant difference (lower), medium effect size (0.2 ≤ d < 0.5)
– – – Statistically significant difference (lower), large effect size (d ≥ 0.5)

MATHEMATICAL LITERACY

Mathematical Literacy
(Phase I, 2007/2008)
• IB students outperform non-IB
G3, 6, 7 & 10
(Effect size medium or large)
• No difference G4, 8 & 9
• Non-IB outperform IB G5

Mathematical Literacy
• IB students outperform non-IB
G6, 9 & 10
(Effect size medium)
• No difference G4, 5 & 7
• Non-IB students outperform IB
G3 & 8

Performance of IB and Non-IB
Students in Mathematical Literacy
GradeIB Non-IB
Significance
of
Difference
Effect
SizeMean S.D. N Mean S.D. N
3 310 84 6,455 322 90 2,903 – -0.13
4 379 84 3,788 376 89 1,995 0.03
5 425 83 6,872 425 89 2,577 -0.01
6 467 84 3,167 453 97 2,011 + 0.15
7 499 88 4,767 495 95 2,010 0.04
8 517 83 3,653 526 91 1,589 – -0.10
9 551 85 3,227 535 87 1,699 + 0.18
10 570 91 1,948 529 84 1,085 ++ 0.46
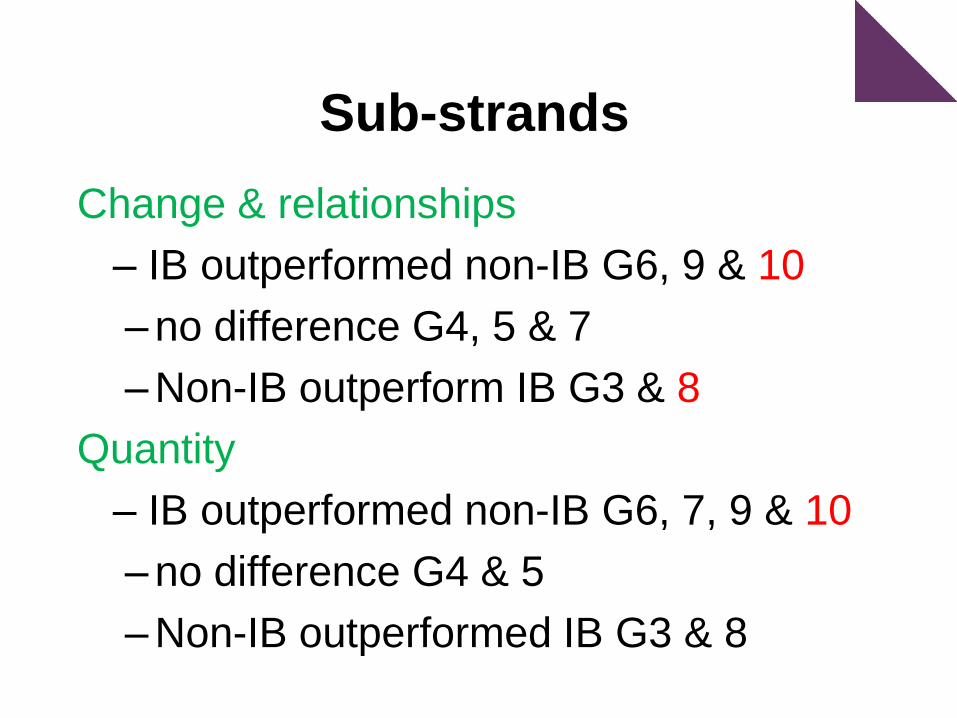
Sub-strands
Change & relationships
– IB outperformed non-IB G6, 9 & 10
– no difference G4, 5 & 7
– Non-IB outperform IB G3 & 8
Quantity
– IB outperformed non-IB G6, 7, 9 & 10
– no difference G4 & 5
– Non-IB outperformed IB G3 & 8
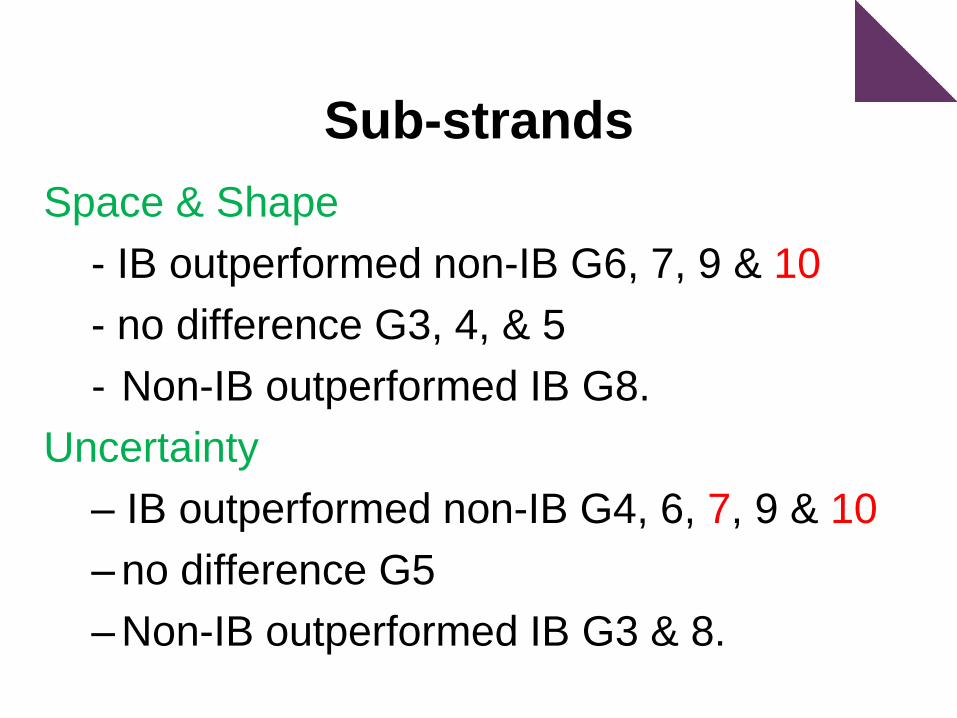
Sub-strands
Space & Shape
- IB outperformed non-IB G6, 7, 9 & 10
- no difference G3, 4, & 5
- Non-IB outperformed IB G8.
Uncertainty
– IB outperformed non-IB G4, 6, 7, 9 & 10
– no difference G5
– Non-IB outperformed IB G3 & 8.

Regional comparison
Americas combined with Europe because of small numbers, and
Oceania combined with Asia for the same reason.
11
64
48
Authorized IB Schools by Region
17
70
24
Non-IB Schools by Region
Africa
Asia & Oceania
Europe & Americas

Asia & Oceania
• IB outperform non-IB at G10
(effect size large)
• no diff G6, 7 & 9
• Non-IB outperform IB G3, 4, 5 & 8
(effect size medium)

Europe & Americas
IB outperform non-IB
• G4, 5, 6, 7, 8, 9 & 10
(effect size medium or large)
No difference G3
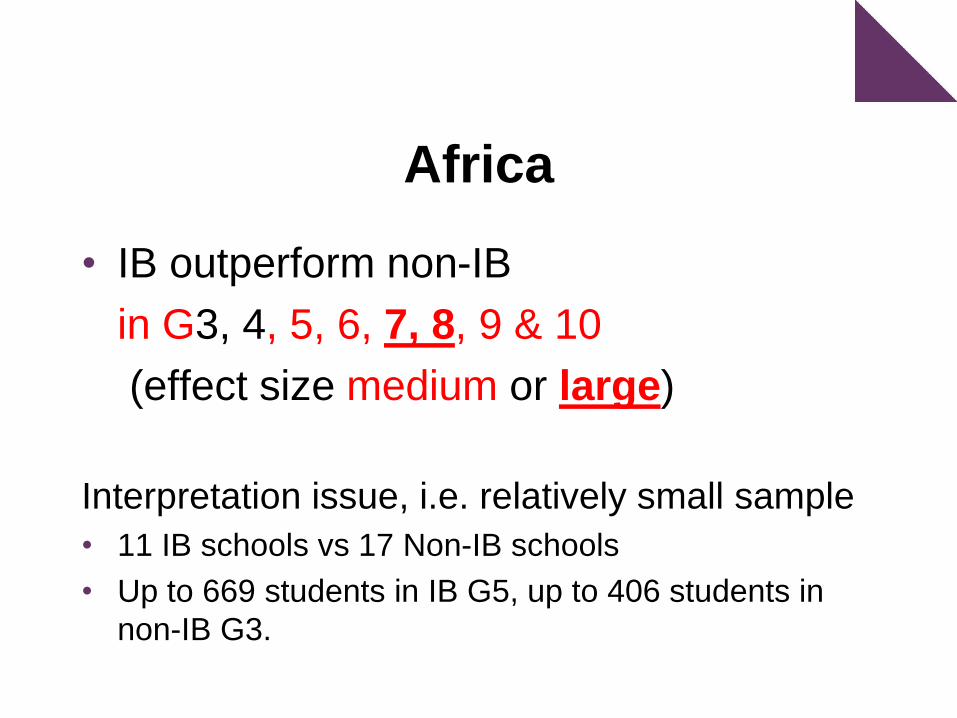
Africa
• IB outperform non-IB
in G3, 4, 5, 6, 7, 8, 9 & 10
(effect size medium or large)
Interpretation issue, i.e. relatively small sample
• 11 IB schools vs 17 Non-IB schools
• Up to 669 students in IB G5, up to 406 students in
non-IB G3.

READING LITERACY

Reading
(Phase I, 2007/2008)
IB students outperform non-IB in all
grades
• G3, 4, 5 ,6, 7, 8, 9 &10
(effect size medium)

Reading
IB students outperform non-IB in all grades
except G8, i.e.
• G3, 4, 5, 6, 7, 9 &10
(effect size medium)
• No difference in G8.

Performance of IB and Non-IB
Students in Reading
GradeIB Non-IB Significance
of
Difference
Effect
SizeMean S.D. N Mean S.D. N
3 253 90 6,523 242 100 2,888 + 0.11
4 323 91 3,771 303 101 1,981 ++ 0.20
5 371 87 6,844 363 96 2,574 + 0.09
6 421 97 3,148 388 108 2,015 ++ 0.31
7 464 97 4,868 446 106 2,004 + 0.18
8 489 86 3,617 489 99 1,570 -0.01
9 533 90 3,352 504 94 1,694 ++ 0.31
10 568 94 1,924 529 100 1,076 ++ 0.40
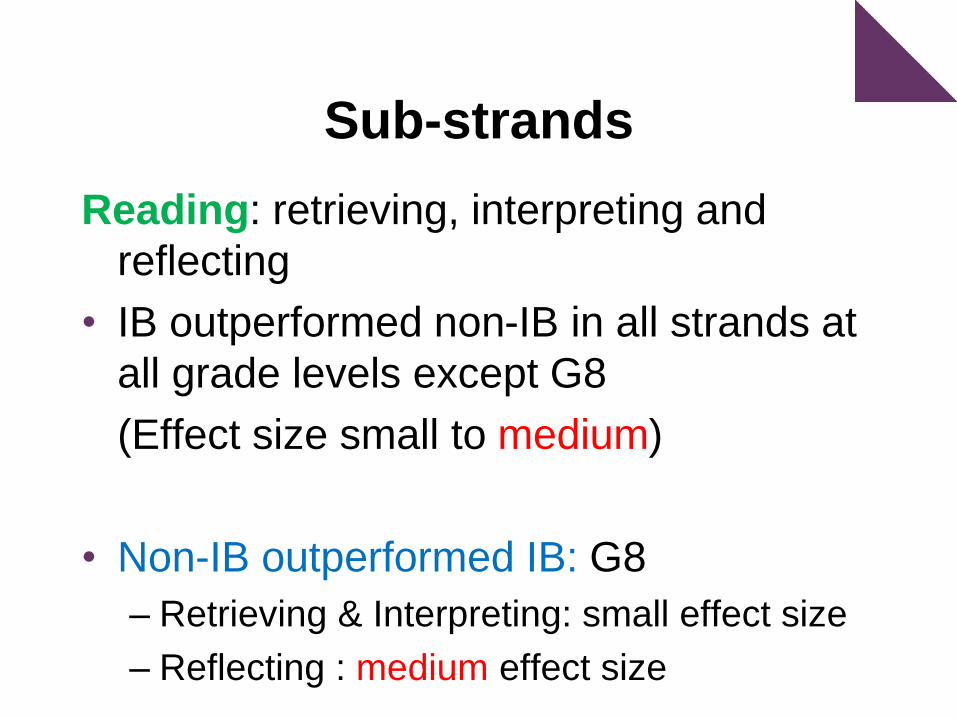
Sub-strands
Reading: retrieving, interpreting and
reflecting
• IB outperformed non-IB in all strands at
all grade levels except G8
(Effect size small to medium)
• Non-IB outperformed IB: G8
– Retrieving & Interpreting: small effect size
– Reflecting : medium effect size

Asia & Oceania
Reading
• IB outperform non-IB
G4, 6, 7, 9 & 10
(effect size medium)
• no difference G3
• Non-IB outperform IB: G5 & 8

Europe & Americas
• IB mainly outperform non-IB
G3, 4, 5, 6, 7, 9, 10
(effect size medium or large)
• No difference G8
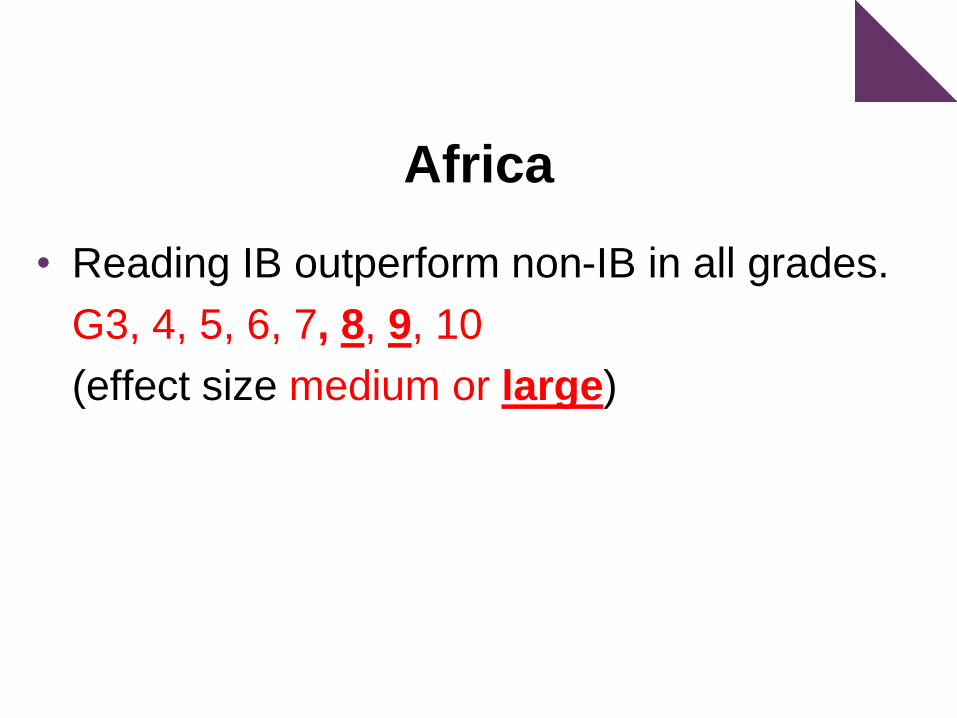
Africa
• Reading IB outperform non-IB in all grades.
G3, 4, 5, 6, 7, 8, 9, 10
(effect size medium or large)

WRITING
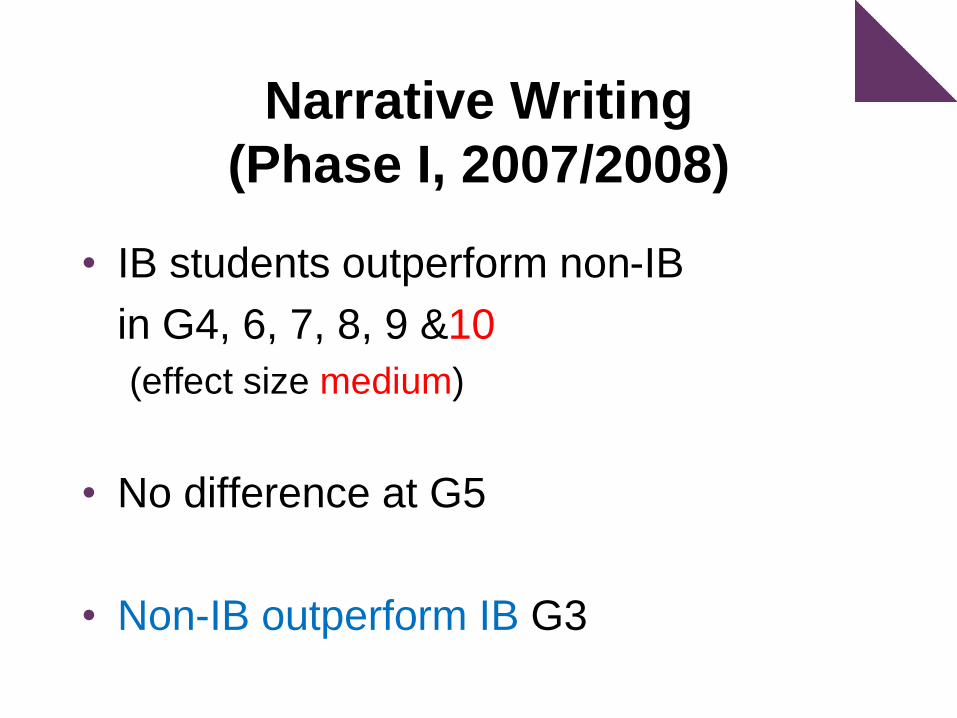
Narrative Writing
(Phase I, 2007/2008)
• IB students outperform non-IB
in G4, 6, 7, 8, 9 &10
(effect size medium)
• No difference at G5
• Non-IB outperform IB G3

Narrative Writing
• IB students outperform non-IB
in G4, 6, 9 &10
(effect size medium)
• No difference at G3, 7 & 8
• Non-IB outperform IB: G5
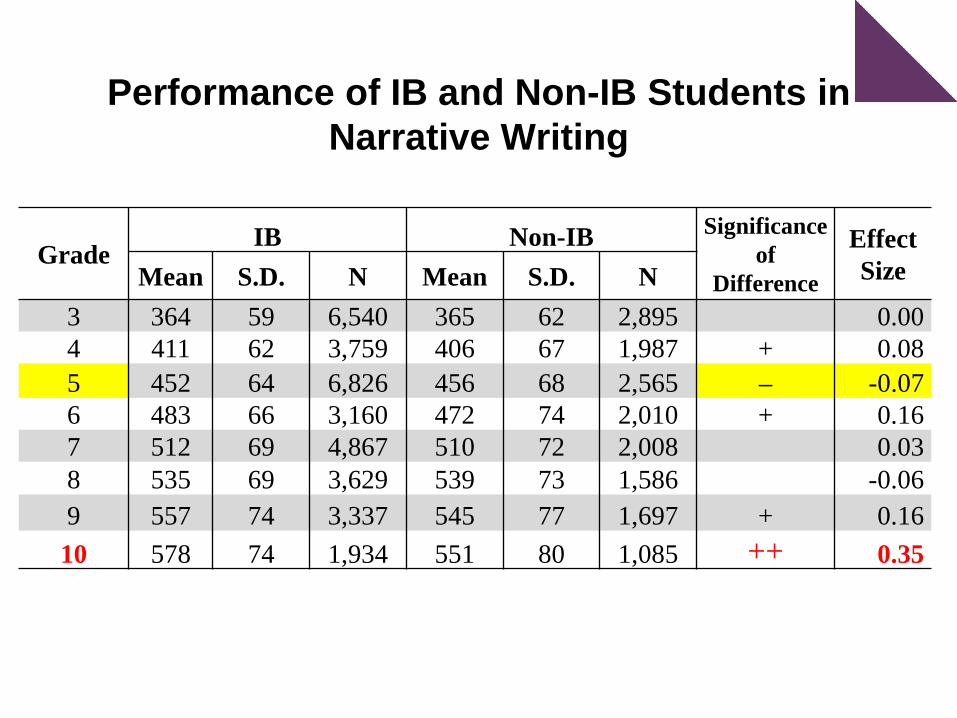
Performance of IB and Non-IB Students in
Narrative Writing
GradeIB Non-IB
Significance
of
Difference
Effect
SizeMean S.D. N Mean S.D. N
3 364 59 6,540 365 62 2,895 0.00
4 411 62 3,759 406 67 1,987 + 0.08
5 452 64 6,826 456 68 2,565 – -0.07
6 483 66 3,160 472 74 2,010 + 0.16
7 512 69 4,867 510 72 2,008 0.03
8 535 69 3,629 539 73 1,586 -0.06
9 557 74 3,337 545 77 1,697 + 0.16
10 578 74 1,934 551 80 1,085 ++ 0.35
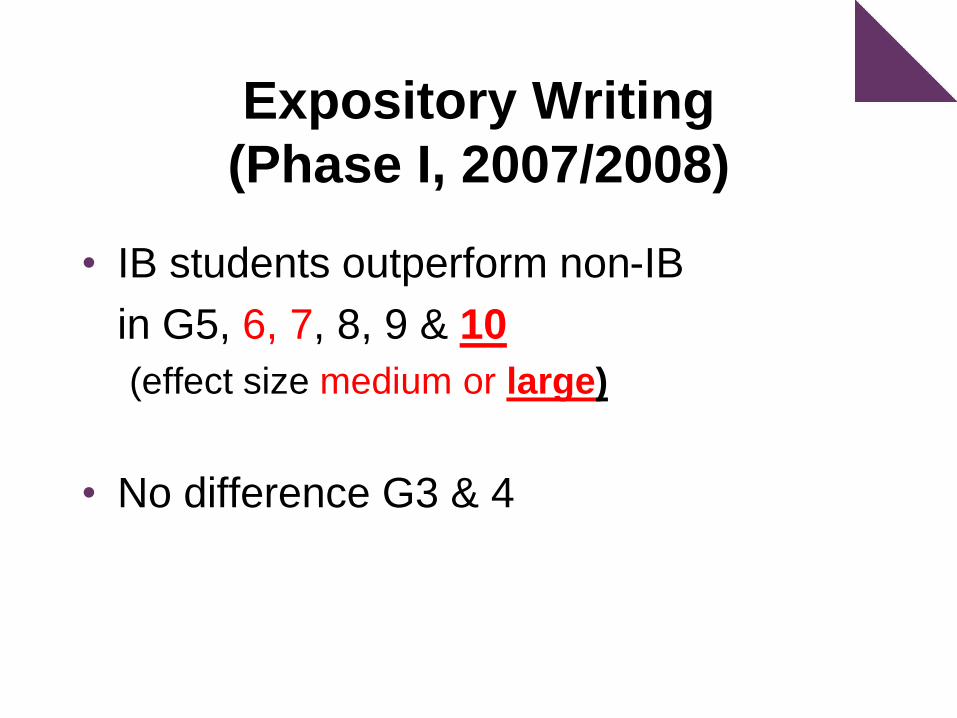
Expository Writing
(Phase I, 2007/2008)
• IB students outperform non-IB
in G5, 6, 7, 8, 9 & 10
(effect size medium or large)
• No difference G3 & 4
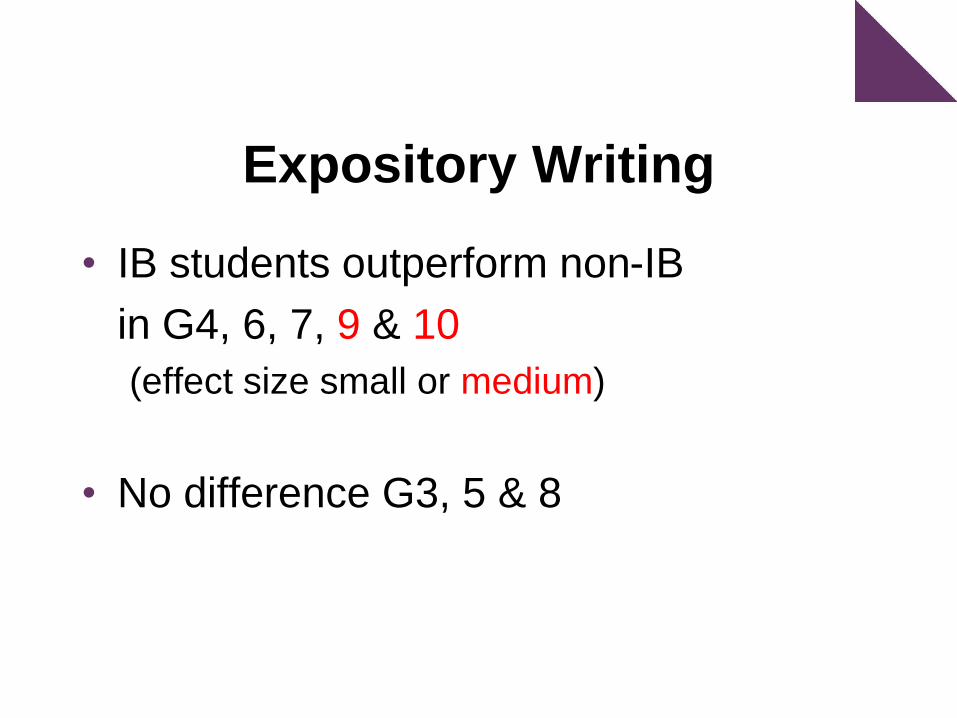
Expository Writing
• IB students outperform non-IB
in G4, 6, 7, 9 & 10
(effect size small or medium)
• No difference G3, 5 & 8

Performance of IB and Non-IB Students in
Expository Writing
GradeIB Non-IB
Significance
of
Difference
Effect
SizeMean S.D. N Mean S.D. N
3 395 50 6,506 394 54 2,879 0.02
4 433 54 3,771 426 60 1,979 + 0.11
5 469 57 6,831 471 62 2,565 -0.04
6 493 59 3,141 486 65 2,019 + 0.11
7 524 61 4,858 517 66 2,002 + 0.10
8 548 62 3,616 551 68 1,570 -0.04
9 571 69 3,341 553 71 1,682 ++ 0.26
10 594 66 1,921 563 81 1,073 ++ 0.43
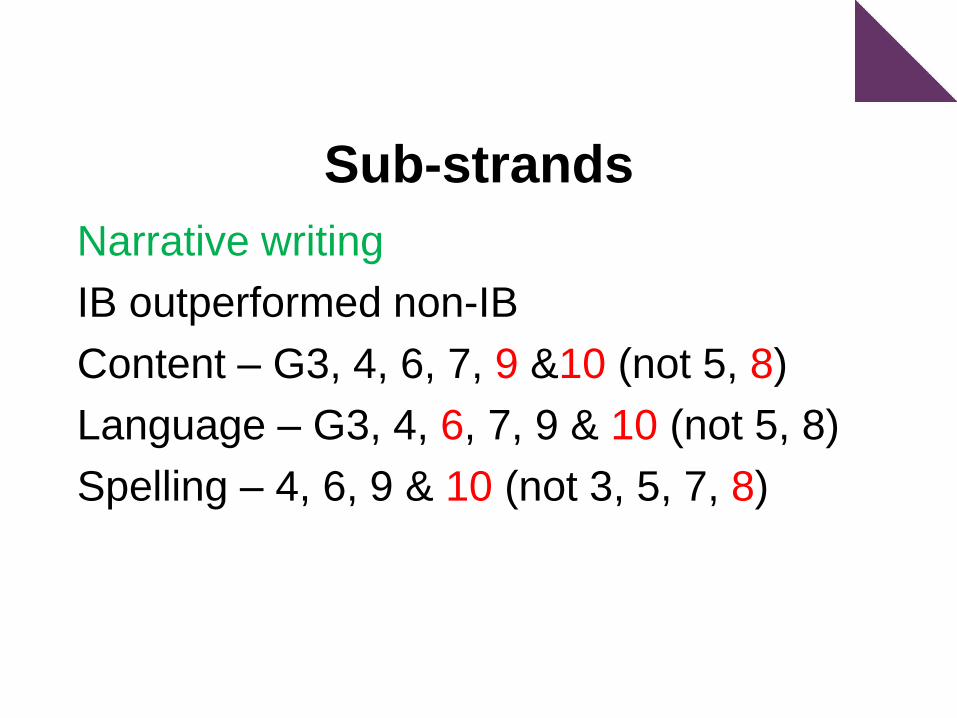
Sub-strands
Narrative writing
IB outperformed non-IB
Content – G3, 4, 6, 7, 9 &10 (not 5, 8)
Language – G3, 4, 6, 7, 9 & 10 (not 5, 8)
Spelling – 4, 6, 9 & 10 (not 3, 5, 7, 8)

Sub-strands
Expository writing:
IB outperformed non-IB
Content – G3, 4, 6, 7, 9, 10 (not 5, 8)
Language – G3, 4, 6, 7, 9, 10 (not 5, 8)
Structure – G4, 7, 9, 10 (not 3, 5, 6, 8)

Asia & Oceania
Narrative writing
IB outperform non-IB G4, 9 & 10
– no diff G3, 6 & 7
– Non-IB outperform IB G5 & 8
Expository writing
– IB outperform non-IB G4, 7, 9 & 10
– no diff G3 & 6
– Non-IB outperform IB G5 & 8
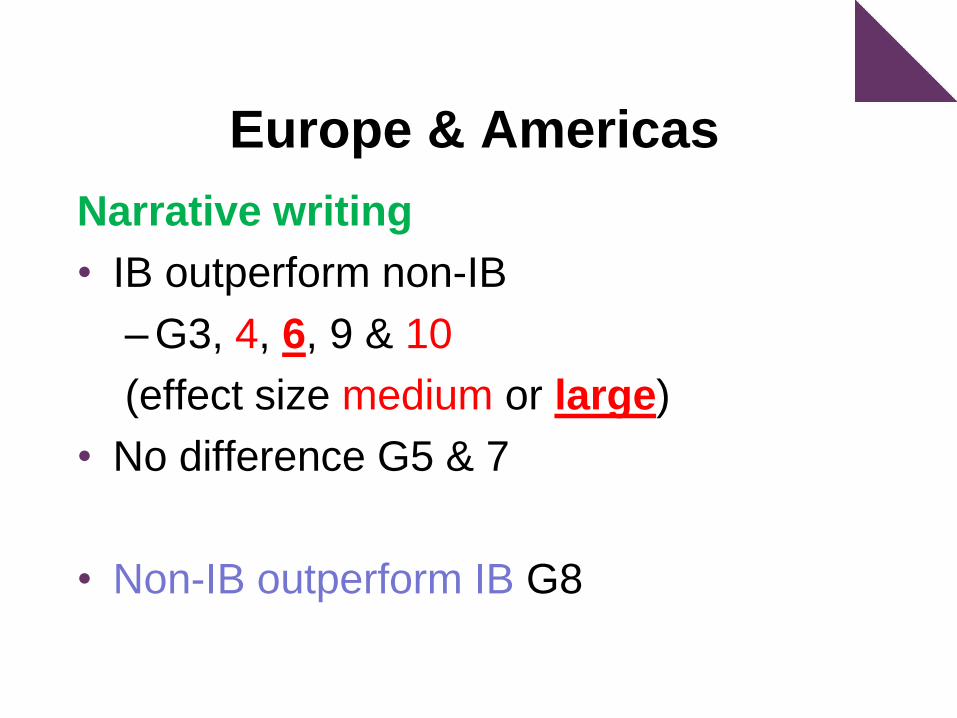
Europe & Americas
Narrative writing
• IB outperform non-IB
– G3, 4, 6, 9 & 10
(effect size medium or large)
• No difference G5 & 7
• Non-IB outperform IB G8

Europe & Americas
Expository writing
• IB outperform non-IB
– G3, 4, 6, 9 & 10
(effect size medium or large)
• No difference G5, 7 & 8

Africa
Narrative writing
• IB outperform non-IB G6, 8, 9 & 10
• no difference in other grades
Expository writing
• IB outperform non-IB G5, 8, 9 & 10
• no difference in other grades

Other Variables
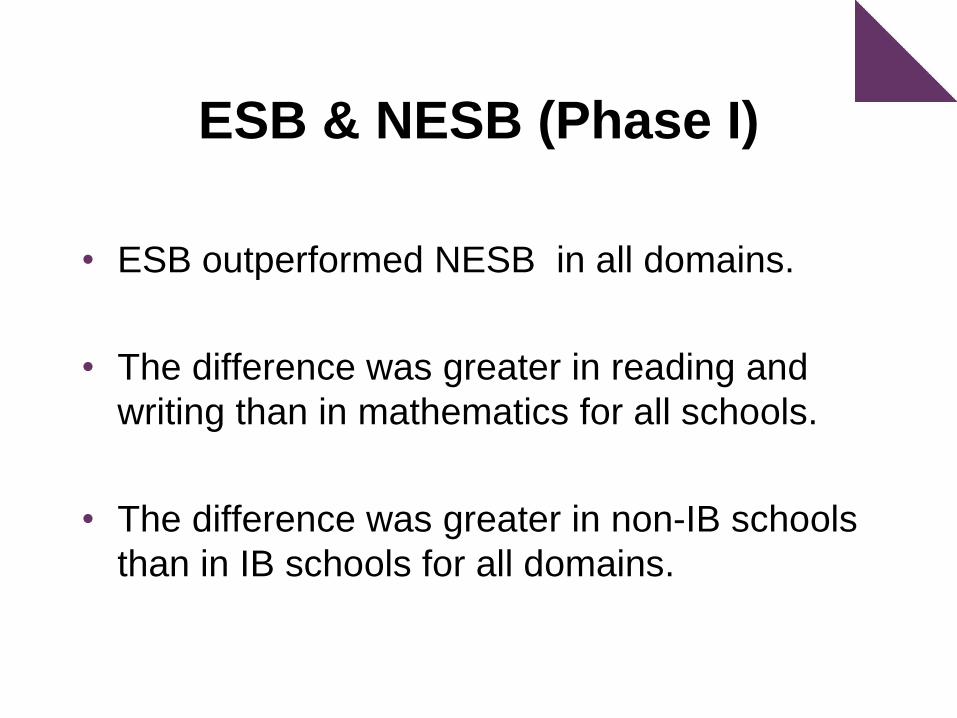
ESB & NESB (Phase I)
• ESB outperformed NESB in all domains.
• The difference was greater in reading and
writing than in mathematics for all schools.
• The difference was greater in non-IB schools
than in IB schools for all domains.

The effect of 1, 2, or 3
Programme
Are there differences in student performance
among 1, 2, or 3 programme?
• continuum vs single
• continuum vs dual
• dual vs single
Is the effect of performance difference related
to year-level appropriate program?
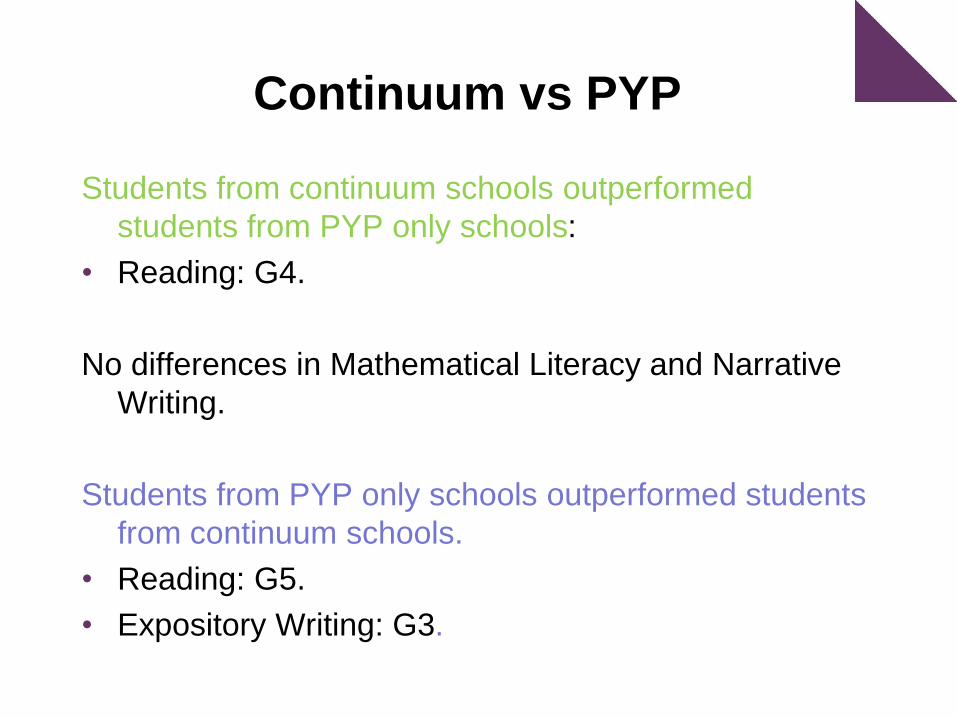
Continuum vs PYP
Students from continuum schools outperformed
students from PYP only schools:
• Reading: G4.
No differences in Mathematical Literacy and Narrative
Writing.
Students from PYP only schools outperformed students
from continuum schools.
• Reading: G5.
• Expository Writing: G3.
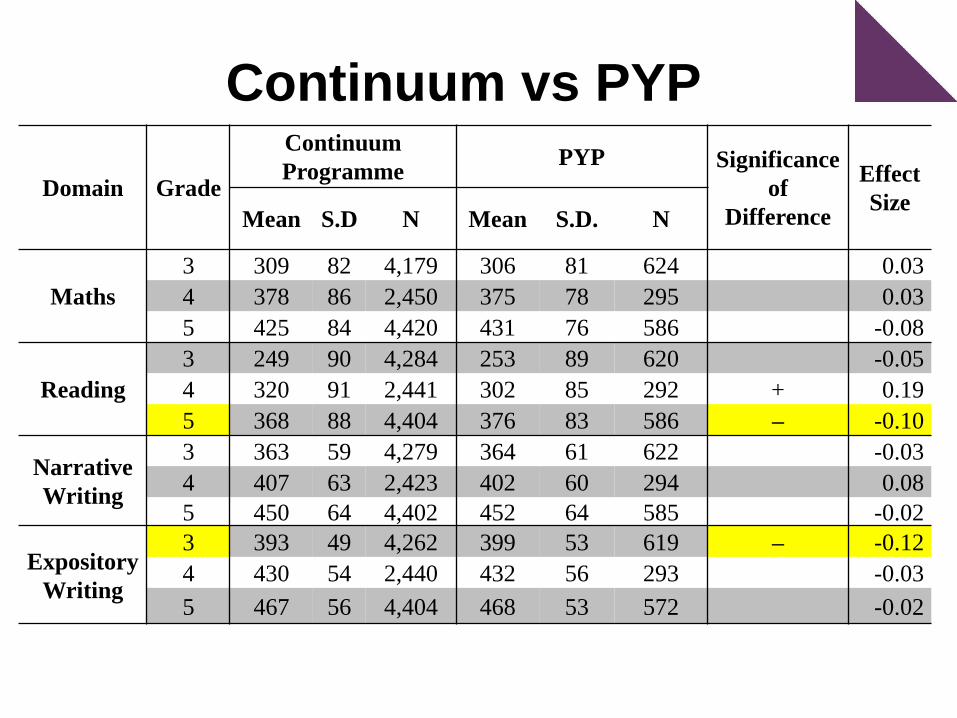
Continuum vs PYP
Domain Grade
Continuum
ProgrammePYP Significance
of
Difference
Effect
SizeMean S.D N Mean S.D. N
Maths
3 309 82 4,179 306 81 624 0.03
4 378 86 2,450 375 78 295 0.03
5 425 84 4,420 431 76 586 -0.08
Reading
3 249 90 4,284 253 89 620 -0.05
4 320 91 2,441 302 85 292 + 0.19
5 368 88 4,404 376 83 586 – -0.10
Narrative
Writing
3 363 59 4,279 364 61 622 -0.03
4 407 63 2,423 402 60 294 0.08
5 450 64 4,402 452 64 585 -0.02
Expository
Writing
3 393 49 4,262 399 53 619 – -0.12
4 430 54 2,440 432 56 293 -0.03
5 467 56 4,404 468 53 572 -0.02

No sufficient sample size to compare
continuum programme to MYP.

Continuum programme vs “PYP & MYP”
Students from PYP & MYP schools outperformed students
from continuum schools.
• Mathematical Literacy: G3, 4, 7 & 8
• Reading: G3, 4, 5, 6, 7 & 8
• Narrative Writing : G4, 6, 7 & 8.
• Expository Writing : G4, 6, 7 & 8.
No difference in other grades.

With year-level appropriate programme
0%
10%
20%
30%
40%
50%
60%
70%
80%
90%
100%
Continuum Programme vsSingle Programme
0%
10%
20%
30%
40%
50%
60%
70%
80%
90%
100%
Continuum Programme vs Dual Programmes
L
N
H

Without year-level appropriate programme
0%
10%
20%
30%
40%
50%
60%
70%
80%
90%
100%
Continnum Programme vs Single Programme
0%
10%
20%
30%
40%
50%
60%
70%
80%
90%
100%
Continnum Programme vs Dual Programme
L
N
H
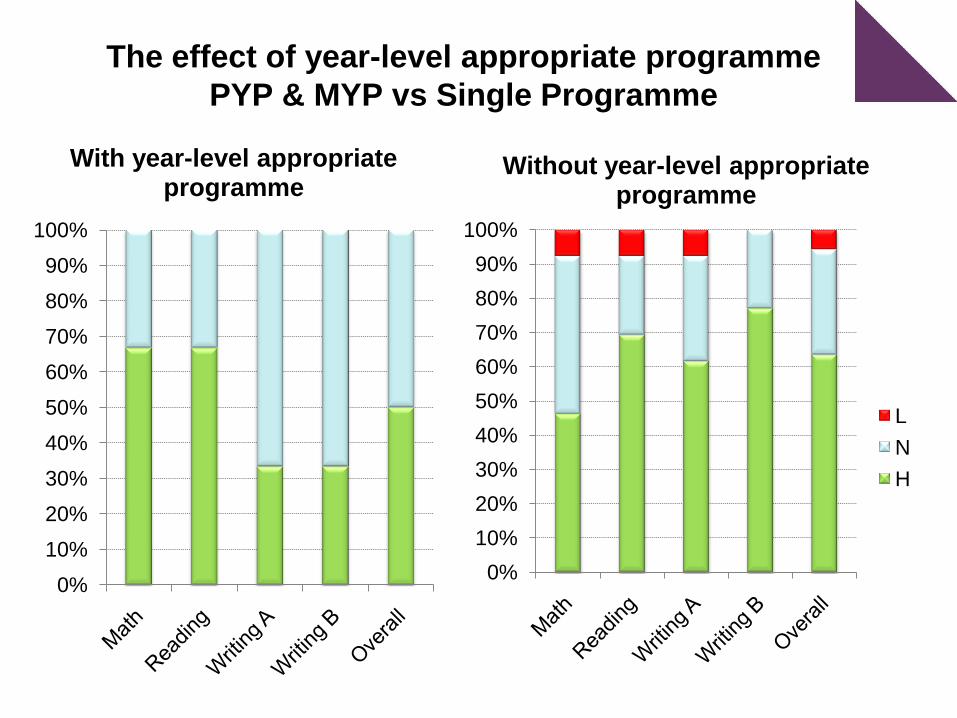
The effect of year-level appropriate programme
PYP & MYP vs Single Programme
0%
10%
20%
30%
40%
50%
60%
70%
80%
90%
100%
With year-level appropriate programme
0%
10%
20%
30%
40%
50%
60%
70%
80%
90%
100%
Without year-level appropriate programme
L
N
H

Statistical terms
Correlation
determines a linear relationship
• 0.1 < r < 0.29 small or weak
• 0.3 < r < 0.69 moderate
• 0.7 < r < 1 large or strong

Length of Implementation
N* Mean Median S.D. Min. Max.33th
Percentile66th
Percentile
MYP Years 390 7.2 6.5 4.4 1.0 18.0 4.0 9.5
PYP Years 455 6.2 5.6 3.6 1.0 13.0 4.0 8.5
N: Number of IB schools and year level.

Length of Implementation
• Weak to moderate positive correlation
between the years of MYP implementation
and ISA performance
– Mathematical Literacy, r = (0.14, 0.34)
– Reading, r = (0.03, 0.29)
• No positive correlation found between the
length of PYP implementation and ISA
performance.

Grade Domain
IB Implementation
Year Domain
IB Implementation
Year
r p< N r p< N
3
Mathematical
Literacy
0.08 0.42 96
Narrative
Writing
0.00 0.98 96
4 0.01 0.94 63 -0.16 0.22 63
5 0.07 0.47 99 0.04 0.71 99
6 0.34 0.02 44 -0.09 0.58 44
7 0.26 0.04 64 0.11 0.39 64
8 0.31 0.03 48 0.12 0.43 48
9 0.14 0.34 50 0.14 0.32 50
10 0.16 0.39 30 0.04 0.82 30
3
Reading
0.11 0.31 96
Expository
Writing
-0.03 0.81 96
4 -0.08 0.55 63 -0.20 0.11 63
5 0.06 0.54 99 0.00 0.98 99
6 0.07 0.66 44 -0.14 0.38 44
7 0.25 0.05 64 0.08 0.53 64
8 0.29 0.05 48 0.01 0.96 48
9 0.03 0.84 50 -0.09 0.53 50
10 0.28 0.14 30 -0.03 0.87 30
Correlation between Length of IB Programme and
ISA Performance

Multilevel Analysis of School Variance
between IB schools and non-IB schools
• The purpose is to examine if the factor of international
curriculum (i.e. IB) influences students' achievement in
the ISA.
• This analysis found that the proportions of between-
school variances among IB schools were smaller than
those among non-IB schools in all four ISA domains.
• This implied that IB schools were more similar to each
other than the non-IB schools were similar to each other
with respect to four domains of ISA performance.

IB G9/10 Students on PISA Benchmark
9 10
Mathematical Literacy

IB G9/10 Students on PISA Benchmark
9 10
Reading

Top-performing IB Schools• Top-performing IB schools (16 schools out of 190 IB
schools) outperform the other schools. Effect sizes
medium or large
– Mathematical Literacy: medium (0.22 to 0.43)
– Reading: medium or large (0.32 to 0.56)
– Narrative Writing: medium or large (0.22 to 0.50)
– Expository Writing: medium (0.22 to 0.46)
• Nine schools (56%) are from Europe, six
schools (38%) are from Asia, and one school (6%)
is from Africa.
• In terms of country, three of these top-performing IB
schools each are located in Germany and in
Switzerland, two schools in China, and one school
in Hong Kong SAR.

Report
ACER & IB will release the Phase II report
of these findings end of 2011.

Thank you !