performance and otloo - · pdf filetransnet agrees on its performance objectives, ... r12,9...
TRANSCRIPT

14th PROOF – 29 JUNE 2015
Shareholder’s CompactEach year, in consultation with the Shareholder, Transnet agrees on its performance objectives, measures and indicators, as well as its annual targets, in line with section 55(2) of the PFMA (1999).
Performance information comparing results for the 2015 reporting year against set targets is set out in the Report of the Directors in the AFS 2015. In measuring its performance against the Shareholder’s Compact KPIs, the Company achieved 60% of targets during the 2015 financial year.
Transnet’s strategic performance commentary at Company and Operating Division level is detailed in the sections that follow. Performance commentary is provided in the context of each of the core MDS strategic imperatives, i.e. financial sustainability, operational excellence, capacity creation and maintenance and market segmentation.
More detailed performance commentary follows for each Operating Division in a subsequent section, where key performance indicators from the Shareholder’s Compact are included for each division. All key performance indicators (KPIs) in the Compact refer to Transnet only. Each section includes the applicable key performance areas and associated KPIs.
Group performance reviewTransnet remains a major investor in the South African economy and has committed to expansion and replacement capital expenditure of R336,6 billion over the next seven years. R146,6 billion is reserved for expansion projects.
In the 2015 financial year, Transnet entered the third year of its implementation of the MDS. The main difference between the 2014 and 2015 performance landscape has been the prolonged impact of the slower-than-anticipated economic recovery. Whereas, in 2014 Transnet pursued
more aggressive demand growth in line with the predicted world economic recovery, in the current year, some of the capacity developments were deferred in line with the expected slower economic recovery. The third year of MDS implementation was, therefore, chiefly a year of planning in which volume targets were realistically adjusted based on validated demand and capital was appropriately allocated and aligned to capacity requirements to maximise value.
Whilst a more gradual, delayed growth is reflected in the year’s performance, the same ‘end-state’ growth requirements – as encapsulated by the MDS when first introduced in 2012 – continue to apply. Further, the continued steady growth during the year is a visible reflection of Transnet’s contributory role towards the National Development Plan and reflects that:
• The Company continues to realise expected long-term volume growth;
• Planned growth in market share continues to be realised; and
• Capacity expansion requirements continue beyond the initial seven-year time frame. The annual escalation in base prices is also evident in the cash flows.
During the year, the Company continued to drive its strategy of increasing rail capacity to satisfy latent demand; switching freight from road to rail; ensuring that port and pipeline capacity remains ahead of demand, as well as targeting aggressive growth in investment, volumes, revenue and profit. In the process, the MDS made important contributions to economic transformation, industrial capability building, skills development, regional integration, energy efficiency and job creation.
Overall, the year proved to be a watershed year in terms of Transnet’s MDS implementation, placing the Company in a strong position to achieve its strategic objectives in the year ahead.
PERFORMANCE AND OUTLOOK
98 | Transnet Integrated Report 2015

14th PROOF – 29 JUNE 2015
Financial sustainability: Group performance
Funding and liquidity
Revenue for the year increased by 8,0% to R61,2 billion (2014: R56,6 billion), mainly as a result of minerals and chrome volumes increasing by 13,5%; and iron ore and manganese volumes increasing by 10,7%. Port bulk and break-bulk volumes increased by 8,1% and petroleum volumes increased by 3,6%.
Operating costs increased by 7,8% to R35,6 billion (2014: R33,0 billion) mainly due to an increase in energy costs of 5,7% as well as an increase in personnel costs of 10,0%. Energy costs increased mainly due to the higher electricity tariffs as well as fuel price increases impacted by foreign exchange volatility. The operating cost increase was limited largely due to numerous cost-reduction initiatives implemented throughout the Company, which resulted in a R1,3 billion saving in planned costs.
Consequently, earnings before interest, taxation, depreciation and amortisation (EBITDA) increased by 8,2% to R25,6 billion (2014: R23,6 billion), while the EBITDA margin remained at 41,8% (2014: 41,8%).
Depreciation, derecognition and amortisation of assets for the year increased by 2,0% to R11,0 billion (2014: R10,7 billion), due to the capital investments for the year as well as the depreciation of revalued port facilities and pipelines partially off-set by an adjustment to the useful lives of assets. This trend is expected to continue in line with the execution of the capital investment programme.
Profit from operations after depreciation and amortisation increased by 13,5% to R14,6 billion (2014: R12,9 billion). Impairment of assets, amounting to R964 million (2014: R107 million) relates primarily to the impairment of trade and other receivables, mainly Passenger Rail Agency of South Africa (Prasa), as well as an impairment of property, plant and equipment.
Post-retirement benefit obligations are actuarially assessed in accordance with IAS 19 Employee
Benefits, and adjusted accordingly. Consequently a cost of R162 million (2014: R388 million) was recognised during the year.
The fair value adjustments amounted to R136 million (2014: R264 million). These adjustments comprise an investment property fair value gain of R315 million, recognised in terms of IAS 40 Investment Property. These gains were off-set by a R115 million loss resulting from the mark to market of derivative financial instruments for the year. More specifically, these losses arose from the mark to market of foreign exchange hedges that Transnet executed to eliminate foreign currency risk and those hedges which have not been hedge accounted in terms of IAS 39 Financial Instruments: Recognition and Measurement. The gains were further off-set by a fair value loss of R64 million raised in terms of IFRS 13 Fair Value Measurement, due to the recognition of credit risk associated with derivative instrument counter parties. Accordingly, net profit from operations before net finance costs increased by 7,7% to R13,7 billion (2014: R12,7 billion).
Net finance costs increased by 9,3% to R6,1 billion (2014: R5,6 billion) in line with expectations, due to increased borrowings to fund the capital investment programme. Capitalised borrowing costs amounted to R2,5 billion (2014: R1,3 billion), an increase of 92,9% due to R33,6 billion being spent on the capital expenditure programme in the financial year.
The taxation charge of R2,3 billion (2014: R2,0 billion) comprises a current taxation credit of R64 million (2014: R59 million) and a deferred taxation charge of R2,4 billion (2014: R2,0 billion). The increase in the deferred taxation charge arose mainly due to an increase in wear and tear allowances and borrowing costs capitalised that are deductible for taxation purposes. The effective taxation rate for the Group is 30,1% (2014: 27,5%).
Profit for the year amounted to R5,3 billion (2014: R5,2 billion), an increase of 2,6% compared to the prior year.
| 99
14th PROOF – 29 JUNE 2015
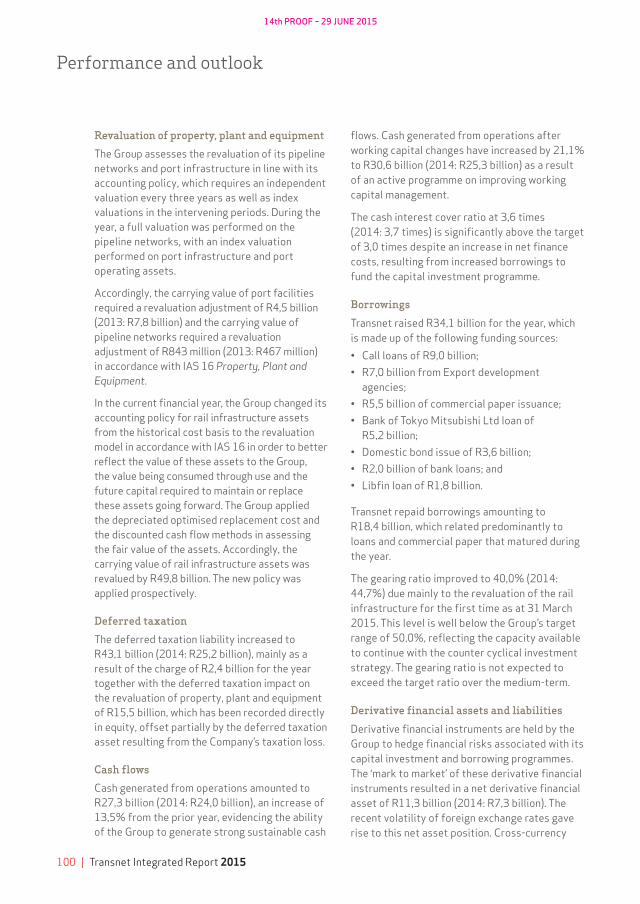
Revaluation of property, plant and equipment
The Group assesses the revaluation of its pipeline networks and port infrastructure in line with its accounting policy, which requires an independent valuation every three years as well as index valuations in the intervening periods. During the year, a full valuation was performed on the pipeline networks, with an index valuation performed on port infrastructure and port operating assets.
Accordingly, the carrying value of port facilities required a revaluation adjustment of R4,5 billion (2013: R7,8 billion) and the carrying value of pipeline networks required a revaluation adjustment of R843 million (2013: R467 million) in accordance with IAS 16 Property, Plant and Equipment.
In the current financial year, the Group changed its accounting policy for rail infrastructure assets from the historical cost basis to the revaluation model in accordance with IAS 16 in order to better reflect the value of these assets to the Group, the value being consumed through use and the future capital required to maintain or replace these assets going forward. The Group applied the depreciated optimised replacement cost and the discounted cash flow methods in assessing the fair value of the assets. Accordingly, the carrying value of rail infrastructure assets was revalued by R49,8 billion. The new policy was applied prospectively.
Deferred taxation
The deferred taxation liability increased to R43,1 billion (2014: R25,2 billion), mainly as a result of the charge of R2,4 billion for the year together with the deferred taxation impact on the revaluation of property, plant and equipment of R15,5 billion, which has been recorded directly in equity, offset partially by the deferred taxation asset resulting from the Company’s taxation loss.
Cash flows
Cash generated from operations amounted to R27,3 billion (2014: R24,0 billion), an increase of 13,5% from the prior year, evidencing the ability of the Group to generate strong sustainable cash
flows. Cash generated from operations after working capital changes have increased by 21,1% to R30,6 billion (2014: R25,3 billion) as a result of an active programme on improving working capital management.
The cash interest cover ratio at 3,6 times (2014: 3,7 times) is significantly above the target of 3,0 times despite an increase in net finance costs, resulting from increased borrowings to fund the capital investment programme.
Borrowings
Transnet raised R34,1 billion for the year, which is made up of the following funding sources: • Call loans of R9,0 billion;• R7,0 billion from Export development
agencies;• R5,5 billion of commercial paper issuance;• Bank of Tokyo Mitsubishi Ltd loan of
R5,2 billion;• Domestic bond issue of R3,6 billion;• R2,0 billion of bank loans; and• Libfin loan of R1,8 billion.
Transnet repaid borrowings amounting to R18,4 billion, which related predominantly to loans and commercial paper that matured during the year.
The gearing ratio improved to 40,0% (2014: 44,7%) due mainly to the revaluation of the rail infrastructure for the first time as at 31 March 2015. This level is well below the Group’s target range of 50,0%, reflecting the capacity available to continue with the counter cyclical investment strategy. The gearing ratio is not expected to exceed the target ratio over the medium-term.
Derivative financial assets and liabilities
Derivative financial instruments are held by the Group to hedge financial risks associated with its capital investment and borrowing programmes. The ‘mark to market’ of these derivative financial instruments resulted in a net derivative financial asset of R11,3 billion (2014: R7,3 billion). The recent volatility of foreign exchange rates gave rise to this net asset position. Cross-currency
100 | Transnet Integrated Report 2015
Performance and outlook
14th PROOF – 29 JUNE 2015
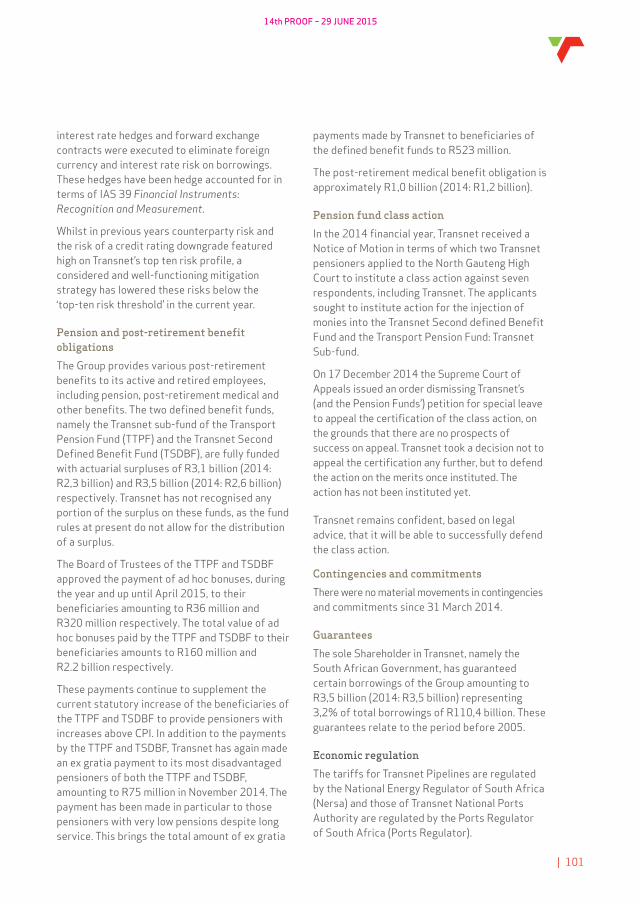
interest rate hedges and forward exchange contracts were executed to eliminate foreign currency and interest rate risk on borrowings. These hedges have been hedge accounted for in terms of IAS 39 Financial Instruments: Recognition and Measurement.
Whilst in previous years counterparty risk and the risk of a credit rating downgrade featured high on Transnet’s top ten risk profile, a considered and well-functioning mitigation strategy has lowered these risks below the ‘top-ten risk threshold’ in the current year.
Pension and post-retirement benefit obligations
The Group provides various post-retirement benefits to its active and retired employees, including pension, post-retirement medical and other benefits. The two defined benefit funds, namely the Transnet sub-fund of the Transport Pension Fund (TTPF) and the Transnet Second Defined Benefit Fund (TSDBF), are fully funded with actuarial surpluses of R3,1 billion (2014: R2,3 billion) and R3,5 billion (2014: R2,6 billion) respectively. Transnet has not recognised any portion of the surplus on these funds, as the fund rules at present do not allow for the distribution of a surplus.
The Board of Trustees of the TTPF and TSDBF approved the payment of ad hoc bonuses, during the year and up until April 2015, to their beneficiaries amounting to R36 million and R320 million respectively. The total value of ad hoc bonuses paid by the TTPF and TSDBF to their beneficiaries amounts to R160 million and R2.2 billion respectively.
These payments continue to supplement the current statutory increase of the beneficiaries of the TTPF and TSDBF to provide pensioners with increases above CPI. In addition to the payments by the TTPF and TSDBF, Transnet has again made an ex gratia payment to its most disadvantaged pensioners of both the TTPF and TSDBF, amounting to R75 million in November 2014. The payment has been made in particular to those pensioners with very low pensions despite long service. This brings the total amount of ex gratia
payments made by Transnet to beneficiaries of the defined benefit funds to R523 million.
The post-retirement medical benefit obligation is approximately R1,0 billion (2014: R1,2 billion).
Pension fund class action
In the 2014 financial year, Transnet received a Notice of Motion in terms of which two Transnet pensioners applied to the North Gauteng High Court to institute a class action against seven respondents, including Transnet. The applicants sought to institute action for the injection of monies into the Transnet Second defined Benefit Fund and the Transport Pension Fund: Transnet Sub-fund.
On 17 December 2014 the Supreme Court of Appeals issued an order dismissing Transnet’s (and the Pension Funds’) petition for special leave to appeal the certification of the class action, on the grounds that there are no prospects of success on appeal. Transnet took a decision not to appeal the certification any further, but to defend the action on the merits once instituted. The action has not been instituted yet.
Transnet remains confident, based on legal advice, that it will be able to successfully defend the class action.
Contingencies and commitments
There were no material movements in contingencies and commitments since 31 March 2014.
Guarantees
The sole Shareholder in Transnet, namely the South African Government, has guaranteed certain borrowings of the Group amounting to R3,5 billion (2014: R3,5 billion) representing 3,2% of total borrowings of R110,4 billion. These guarantees relate to the period before 2005.
Economic regulation
The tariffs for Transnet Pipelines are regulated by the National Energy Regulator of South Africa (Nersa) and those of Transnet National Ports Authority are regulated by the Ports Regulator of South Africa (Ports Regulator).
| 101

14th PROOF – 29 JUNE 2015
Pipelines
On 31 October 2014, Pipelines submitted its 2016 Petroleum Pipeline System Tariff Application to Nersa. Pipelines filed for a revenue requirement of R3 395 million for the 2016 tariff period, which represented a 15,58% increase in revenue. On 12 March 2015, Nersa issued a record of decision granting Pipelines allowable revenue of R3 357 million, an increase of 14,28% for the 2016 financial year.
National Ports Authority
On 1 September 2014, the National Ports Authority submitted its multi-year tariff application to the Regulator. Using the approved multi-year tariff manual, the National Ports Authority’s resultant revenue requirement for the 2016 financial year is R11,2 billion. The average multi-year tariff increase amounted to 9,47%.
On 25 February 2015, the Regulator approved the National Ports Authority’s tariffs and granted a 4,8% increase in average tariffs and adjusted the volume forecast to 4,3% resulting in an allowable revenue of R11,1 billion for the 2016 financial year.
Volume growth
The Company achieved an aggregate volume performance of 98,4%, despite low domestic and global economic growth challenges. While commodity by commodity analysis focuses attention on internal and external constraints – and identifies required performance improvement interventions – it is important to note that in aggregate, Transnet’s group weighted volume performance for total freight volumes on rail, ports and pipelines increased from the prior year’s 95,1% to 98,4%. This improvement is due to positive growth in export iron ore, export coal, total petroleum products, vehicles and break bulk.
The overall operating environment for the year was characterised by lower-than-anticipated economic growth, depressed commodity prices and sporadic labour unrest in some sectors of the
economy. These factors together with power supply challenges experienced by both Freight Rail and its customers negatively impacted Freight Rail volume performance compared to plans. Despite these adverse trading conditions, volume performance increased by 7,7% to 226,6mt (2014: 210,4mt). In line with volume growth, revenue for the period increased by 9,7% to R37,8 million (2014: R34,4 million).
Port Terminals experienced higher bulk and break-bulk volumes, primarily in respect of iron ore, magnetite and manganese exports. These volumes increased by 8,1% to 95,4mt (2014: 88,2mt). Container volumes remained relatively flat, mainly due to lacklustre international growth rates with a 1,5% increase to 4 571 039 TEUs (2014: 4 503 425 TEUs). Automotive volumes decreased by 1,8% to 673 979 units (2014: 686 352 units). National Ports Authority’s revenue from cargo dues increased by 5,0% to R6,1 billion (2014: R5,8 billion) due to an increase in volumes.
Crude and refined petroleum volumes transported for the period increased by 3,6% to 17 186 billion litres (2014: 16 583 billion litres). The positive deviation compared to the prior year is predominantly due to the higher crude volumes transported.
Private Sector Participation
During the year, Transnet continued to demonstrate its commitment to the acceleration of PSPs. Business cases were approved for the East London grain elevator, the Durban agriport and the Durban Dig-Out Port. A transaction scope outline was prepared for the Tambo Springs inland terminal and a technical study initiated for the manganese common user facility. Further, requests for proposals were initiated for the maintenance and operation of the Douglas-Belmont branch line. Other PSP initiatives during the year scoped options for an investment property portfolio, energy supply, and for Operation Phakisa projects in ship repair and related port services.
102 | Transnet Integrated Report 2015
Performance and outlook
14th PROOF – 29 JUNE 2015
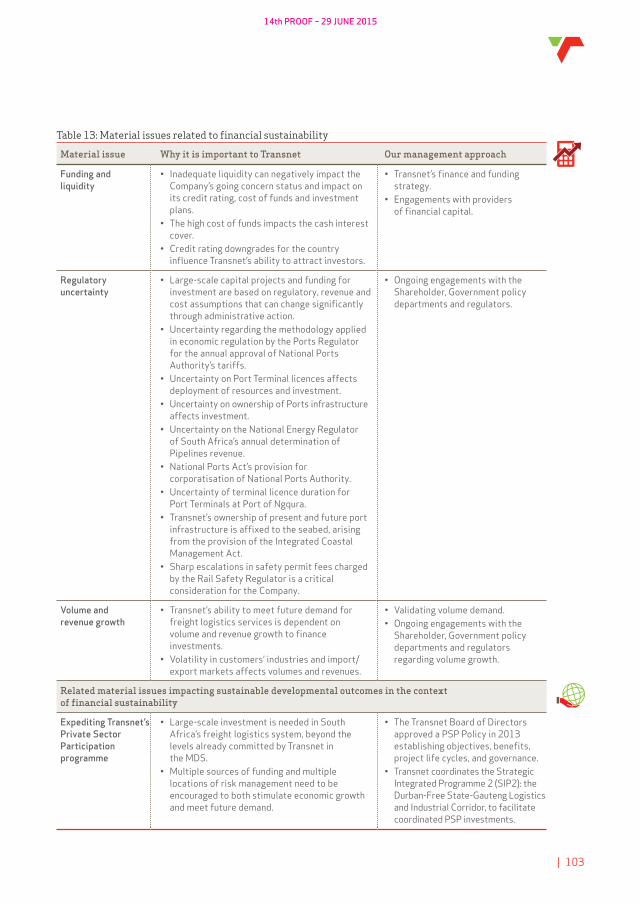
Table 13: Material issues related to financial sustainability
Material issue Why it is important to Transnet Our management approach
Funding and liquidity
• Inadequate liquidity can negatively impact the Company’s going concern status and impact on its credit rating, cost of funds and investment plans.
• The high cost of funds impacts the cash interest cover.
• Credit rating downgrades for the country influence Transnet’s ability to attract investors.
• Transnet’s finance and funding strategy.
• Engagements with providers of financial capital.
Regulatory uncertainty
• Large-scale capital projects and funding for investment are based on regulatory, revenue and cost assumptions that can change significantly through administrative action.
• Uncertainty regarding the methodology applied in economic regulation by the Ports Regulator for the annual approval of National Ports Authority’s tariffs.
• Uncertainty on Port Terminal licences affects deployment of resources and investment.
• Uncertainty on ownership of Ports infrastructure affects investment.
• Uncertainty on the National Energy Regulator of South Africa’s annual determination of Pipelines revenue.
• National Ports Act’s provision for corporatisation of National Ports Authority.
• Uncertainty of terminal licence duration for Port Terminals at Port of Ngqura.
• Transnet’s ownership of present and future port infrastructure is affixed to the seabed, arising from the provision of the Integrated Coastal Management Act.
• Sharp escalations in safety permit fees charged by the Rail Safety Regulator is a critical consideration for the Company.
• Ongoing engagements with the Shareholder, Government policy departments and regulators.
Volume and revenue growth
• Transnet’s ability to meet future demand for freight logistics services is dependent on volume and revenue growth to finance investments.
• Volatility in customers’ industries and import/export markets affects volumes and revenues.
• Validating volume demand.• Ongoing engagements with the
Shareholder, Government policy departments and regulators regarding volume growth.
Related material issues impacting sustainable developmental outcomes in the context of financial sustainability
Expediting Transnet’s Private Sector Participation programme
• Large-scale investment is needed in South Africa’s freight logistics system, beyond the levels already committed by Transnet in the MDS.
• Multiple sources of funding and multiple locations of risk management need to be encouraged to both stimulate economic growth and meet future demand.
• The Transnet Board of Directors approved a PSP Policy in 2013 establishing objectives, benefits, project life cycles, and governance.
• Transnet coordinates the Strategic Integrated Programme 2 (SIP2): the Durban-Free State-Gauteng Logistics and Industrial Corridor, to facilitate coordinated PSP investments.
| 103

14th PROOF – 29 JUNE 2015
By 2043, manufactured freight will represent more than 64% of all goods transported.
Offloading of vehicles
at RORO Terminal,
Port of Durban.
104 | Transnet Integrated Report 2015
Performance and outlook

14th PROOF – 29 JUNE 2015
Summary financial information
Income statement for the year ended
Audited Audited31 March 31 March
(in Rand million) 2015 2014
Continuing operationsRevenue 61 152 56 606Net operating expenses excluding depreciation and amortisation (35 564) (32 967)
Profit from operations before depreciation, derecognition, amortisation
and items listed below (EBITDA) 25 588 23 639Depreciation, derecognition and amortisation (10 951) (10 736)
Profit from operations before items listed below: 14 637 12 903Impairment of assets (964) (107)Post-retirement benefit obligation expense (162) (388)Fair value adjustments 136 264Income from associates and joint ventures 9 14
Profit from operations before net finance costs 13 656 12 686Finance costs (6 287) (5 917)Finance income 221 366
Profit before taxation 7 590 7 135Taxation (2 288) (1 964)
Profit for the year 5 302 5 171
| 105

14th PROOF – 29 JUNE 2015
Statement of comprehensive income
for the year ended
Audited Audited31 March 31 March
(in Rand million) 2015 2014
Profit for the year 5 302 5 171
Other comprehensive income 55 439 9 707
Exchange differences on translation of foreign operations (2) 5Gains on revaluations 55 175 8 269Cash flow hedges 236 1 195Actuarial gain on post-retirement benefit obligations 30 238
Taxation relating to components of other comprehensive income (15 526) (2 719)
Other comprehensive income for the year (net of taxation) 39 913 6 988
Total comprehensive income for the year 45 215 12 159
Headline earnings summarised reconciliation for the year ended
Audited Audited31 March 31 March
(in Rand million) 2015 2014
Profit for the year attributable to the equity holder 5 302 5 171Profit on the disposal of property, plant and equipment (156) (54)Total remeasurements 127 (470)
Investment property fair value adjustments (315) (647)Impairment of property, plant and equipment 442 177
Total taxation effects of adjustments (21) 86
Headline earnings 5 252 4 733
106 | Transnet Integrated Report 2015
Performance and outlook

14th PROOF – 29 JUNE 2015
Statement of financial position as at
Audited Audited31 March 31 March
(in Rand million) 2015 2014
AssetsNon-current assets 305 941 225 062
Property, plant and equipment 287 166 207 322Investment properties 9 074 8 572Intangible assets 1 273 972Investments in associates and joint ventures 113 105Derivative financial assets 7 622 7 346Long-term loans and advances 24 29Other investments and long-term financial assets 669 716
Current assets 22 498 15 011
Inventories 3 343 3 241Trade and other receivables 8 332 7 774Derivative financial assets 3 770 58Other short-term investments 708 67Cash and cash equivalents 6 264 3 633Assets classified as held-for-sale 81 238
Total assets 328 439 240 073
Equity and liabilitiesCapital and reserves 142 328 97 113
Issued capital 12 661 12 661Reserves 129 667 84 452
Non-current liabilities 145 853 117 723
Employee benefits 2 771 2 968Long-term borrowings 93 078 82 995Derivative financial liabilities 25 46Long-term provisions 1 937 1 890Deferred taxation liabilities 43 087 25 209Other non-current liabilities 4 955 4 615
Current liabilities 40 258 25 237
Trade payables and accruals 18 808 14 357Short-term borrowings 17 299 7 449Current taxation liability 38 17Derivative financial liabilities 45 37Short-term provisions 848 816Other current liabilities 3 220 2 561
Total equity and liabilities 328 439 240 073
| 107

14th PROOF – 29 JUNE 2015
Statement of cash flows
for the year ended
Audited Audited31 March 31 March
(in Rand million) 2015 2014
Cash flows from operating activities 23 666 18 709
Cash generated from operations 27 280 24 043Changes in working capital 3 327 1 228
Cash generated from operations after changes in working capital 30 607 25 271Finance costs (6 128) (5 870)Finance income 205 321Taxation paid 91 16Settlement of post-retirement benefit obligations (220) (238)Derivatives settled and raised (889) (791)
Cash flows utilised in investing activities (36 715) (32 067)
Investment to maintain operations (19 297) (18 890)Investment to expand operations (16 847) (14 474)Changes in investments, loans, advances and other investing activities (571) 1 297
Cash flows from financing activities 15 680 14 393
Borrowings raised 34 113 22 380Borrowings repaid (18 433) (7 987)
Net increase in cash and cash equivalents 2 631 1 035Cash and cash equivalents at the beginning of the year 3 633 2 598
Total cash and cash equivalents at the end of the year 6 264 3 633
108 | Transnet Integrated Report 2015
Performance and outlook
14th PROOF – 29 JUNE 2015
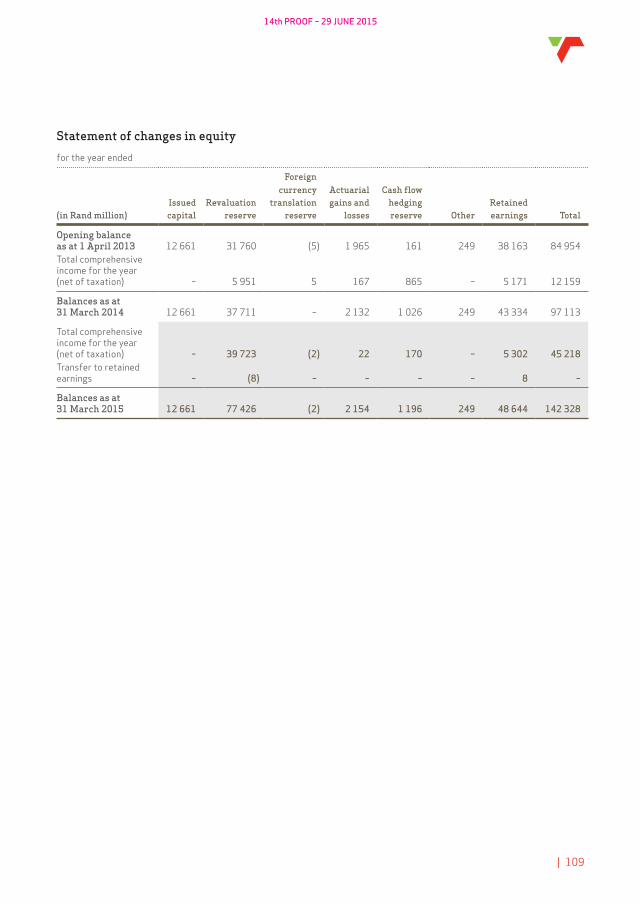
Statement of changes in equity
for the year ended
Foreigncurrency Actuarial Cash flow
Issued Revaluation translation gains and hedging Retained(in Rand million) capital reserve reserve losses reserve Other earnings Total
Opening balance as at 1 April 2013 12 661 31 760 (5) 1 965 161 249 38 163 84 954 Total comprehensive income for the year (net of taxation) – 5 951 5 167 865 – 5 171 12 159
Balances as at 31 March 2014 12 661 37 711 – 2 132 1 026 249 43 334 97 113
Total comprehensive income for the year (net of taxation) – 39 723 (2) 22 170 – 5 302 45 218Transfer to retained earnings – (8) – – – – 8 –
Balances as at 31 March 2015 12 661 77 426 (2) 2 154 1 196 249 48 644 142 328
| 109

14th PROOF – 29 JUNE 2015
Segment information
Freight Rail Engineering National Ports Authority Port Terminals PipelinesTotal
reportable segments Other1Total
TransnetAudited Audited Audited Audited Audited Audited Audited Audited Audited Audited Audited Audited Audited Audited Audited Audited
for the year ended 31 March 31 March 31 March 31 March 31 March 31 March 31 March 31 March 31 March 31 March 31 March 31 March 31 March 31 March 31 March 31 March(in Rand million) 2015 2014 2015 2014 2015 2014 2015 2014 2015 2014 2015 2014 2015 2014 2015 2014
External revenue 37 410 34 111 1 718 1 616 8 489 8 727 9 706 8 531 3 241 3 099 60 564 56 084 588 522 61 152 56 606Internal revenue 348 300 10 652 11 737 1 229 1 190 6 4 5 15 12 240 13 246 (12 240) (13 246) – –
Total revenue 37 758 34 411 12 370 13 353 9 718 9 917 9 712 8 535 3 246 3 114 72 804 69 330 (11 652) (12 724) 61 152 56 606Earnings before interest, taxation, depreciation and amortisation (EBITDA) 16 241 14 424 745 886 6 306 6 680 2 966 2 459 2 304 2 328 28 562 26 777 (2 974) (3 138) 25 588 23 639
Total assets2 168 238 99 733 11 861 11 206 78 325 72 454 18 993 19 042 36 346 32 324 313 763 234 759 14 595 5 076 328 358 239 835Total liabilities 89 354 61 752 7 111 6 774 42 811 38 048 10 358 10 055 21 071 19 373 170 705 136 002 15 406 6 958 186 111 142 960Capital expenditure 25 173 25 115 1 026 975 2 874 1 188 1 237 1 651 2 793 3 377 33 103 32 306 462 (540) 33 565 31 766Cash generated from operations after changes in working capital 13 583 22 131 1 845 1 179 5 981 7 716 2 236 1 291 2 645 1 974 26 290 34 291 4 317 (9 020) 30 607 25 271
1 Other includes other segments, inter-unit eliminations and consolidation adjustments.2 Excludes assets held-for-sale.
110 | Transnet Integrated Report 2015
Performance and outlook

14th PROOF – 29 JUNE 2015
Segment information
Freight Rail Engineering National Ports Authority Port Terminals PipelinesTotal
reportable segments Other1Total
TransnetAudited Audited Audited Audited Audited Audited Audited Audited Audited Audited Audited Audited Audited Audited Audited Audited
for the year ended 31 March 31 March 31 March 31 March 31 March 31 March 31 March 31 March 31 March 31 March 31 March 31 March 31 March 31 March 31 March 31 March(in Rand million) 2015 2014 2015 2014 2015 2014 2015 2014 2015 2014 2015 2014 2015 2014 2015 2014
External revenue 37 410 34 111 1 718 1 616 8 489 8 727 9 706 8 531 3 241 3 099 60 564 56 084 588 522 61 152 56 606Internal revenue 348 300 10 652 11 737 1 229 1 190 6 4 5 15 12 240 13 246 (12 240) (13 246) – –
Total revenue 37 758 34 411 12 370 13 353 9 718 9 917 9 712 8 535 3 246 3 114 72 804 69 330 (11 652) (12 724) 61 152 56 606Earnings before interest, taxation, depreciation and amortisation (EBITDA) 16 241 14 424 745 886 6 306 6 680 2 966 2 459 2 304 2 328 28 562 26 777 (2 974) (3 138) 25 588 23 639
Total assets2 168 238 99 733 11 861 11 206 78 325 72 454 18 993 19 042 36 346 32 324 313 763 234 759 14 595 5 076 328 358 239 835Total liabilities 89 354 61 752 7 111 6 774 42 811 38 048 10 358 10 055 21 071 19 373 170 705 136 002 15 406 6 958 186 111 142 960Capital expenditure 25 173 25 115 1 026 975 2 874 1 188 1 237 1 651 2 793 3 377 33 103 32 306 462 (540) 33 565 31 766Cash generated from operations after changes in working capital 13 583 22 131 1 845 1 179 5 981 7 716 2 236 1 291 2 645 1 974 26 290 34 291 4 317 (9 020) 30 607 25 271
1 Other includes other segments, inter-unit eliminations and consolidation adjustments.2 Excludes assets held-for-sale.
| 111

14th PROOF – 29 JUNE 2015
Five-year summary
Absolute increaseActual % vs 2015
2011 2012 2013 2014 2015 2013 2011
Volumes– GFB (mt) 73,7 81,0 82,6 88,0 90,5 9,6 22,8– Export coal (mt) 62,2 67,7 69,2 68,2 76,3 10,3 22,7– Export iron ore (mt) 46,2 52,3 55,9 54,3 59,7 6,8 29,2Total rail 182,1 201,0 207,7 210,4 226,5 9,1 24,4– Containers (TPT) (‘000 TEUs) 4 017 4 305 4 237 4 503 4 571 7,9 13,8– Petroleum (Ml) 18 025 16 741 15 882 16 583 17 186 8,2 (4,7)
Financials– Revenue (Rm) 37 952 45 900 50 194 56 606 61 152 21,8 61,1– EBITDA (Rm) 15 763 18 882 21 051 23 639 25 588 21,6 62,3– Capex (Rm) 21 504 22 259 27 471 31 766 33 565 22,2 56,1– Total assets (Rm) 167 070 178 005 203 896 240 073 328 443 61,1 96,6– Total debt (non–current +
current liabilities) (Rm) 93 404 98 584 118 942 142 960 172 131 44,7 84,3
Funding and liquidity– Available committed facilities 3 500 2 600 5 000 8 405 16 533 230,7 372,4– Available specific committed
facilities 1 874 3 943 3 000 0 0 (100,0) (100,0)– AB ratio 1,4 1,8– Funded for the year 18 418 11 110 19 800 22 380 34 113 72,3 85,2
Ratios– EBITDA margin (%) 41,5 41,1 41,9 41,8 41,8 (0,1) 0,8– Gearing (%) 41,1 41,9 44,6 45,9 40,0 (10,3) (2,7)– Return on assets (%) * 6,6 7,8 7,7 6,5 6,3 (17,6) (3,1)– Cash interest cover (times) 3,9 4,2 3,7 3,7 3,7 0,0 (5,1)– FFO/Debt (%) 16,5 22,1 19,7 18,1 16,2 (17,5) (1,5)– FFO/cash interest coverage
(times) 2,2 2,5 2,4 2,5 2,2 (10,0) (2,4)
Human capital– Training spend (Rm) 355 548 864 621 644 (25,5) 81,4– Training spend
(% of personnel cost) 3,0 3,9 4,4 3,0 2,8 (36,4) (6,7)Skills development– Artisans (No.) 1 000 854 866 998 613 (29,2) (38,7)– Engineers (No.) 64 378 433 138 255 (41,1) 298,4– Technicians (No.) 356 180 315 339 563 78,7 58,1– Sector-specific (No.) 1 029 2 340 2 160 1 569 3 320 53,7 222,6Employee equity– Black employees (%) 62,5 65,0 67,0 67,9 69,4 3,6 11,0– Coloured employees (%) 9,9 9,7 9,7 9,8 9,9 2,1 –– Indian employees (%) 3,9 3,8 3,7 3,8 3,7 – (5,1)– White employees (%) 23,8 21,5 19,6 18,5 17,0 (13,3) (28,6)– Female employees (%) 20,0 22,0 23,5 24,4 26,5 12,8 32,5– Male employees (%) 80,0 78,0 76,5 75,6 73,5 (3,9) (8,1)– Revenue per employee (Rm) 0,79 0,90 0,95 1,03 1,10 16,3 38,6
112 | Transnet Integrated Report 2015
Performance and outlook

14th PROOF – 29 JUNE 2015
Absolute increaseActual % vs 2015
2011 2012 2013 2014 2015 2013 2011
Safety– DIFR 0,98 0,65 0,74 0,69 0,69 (6,8) (29,6)– Total number of fatalities 12 7 9 7 4 55,6 66,7
iSCM– B-BBEE procurement spend (% of TMPS) 75 80 88 94 105 19,3 40,0– CSDP (%) 50 39 42 37 37 (11,9) (26,0)– Black women–owned (%) 5 8 6 4 10 66,7 100,0– Black-owned (%) 12 12 17 21 22 29,4 83,3– Exempted Micro Enteprise
(EME) (%) 7 7 5 5 7 40 0,0– Qualifying Small Enterprise
(QSE) (%) 11 9 10 9 5 (50,0) (54,5)
Corporate social investment– CSI (Rm) 145 160 132 174 225 70,5 55,2– Enterprise Development
(points) 2,3 6,9 15 15 15 0,0 552,2
| 113

14th PROOF – 29 JUNE 2015
Capacity creation and maintenance: Group performance
Capital investment and progress on major projects
The Group’s capital investment for the year amounted to R33,6 billion. This represents a 5,7% increase from the prior year’s capital investment of R31,8 billion, mainly as a result of accelerating the locomotive, tugs and dredger acquisition programmes. The capital investment for the year represents R14,5 billion invested in the expansion of infrastructure and equipment, while R19,1 billion was invested to maintain capacity in the rail and ports divisions.
Rail infrastructure projects:
Significant volume growth is expected in the short to medium term for the general freight business, which will be driven by an increase in the tractive effort through the acquisition of new rolling stock (locomotives and wagons). In addition, interventions to maintain the fleet are implemented for locomotives, wagons and infrastructure.
Locomotives
Transnet concluded a number of locomotive contracts in the prior year which will result in the acquisition of approximately 1 200 new locomotives for the General Freight Business (GFB).
As at 31 March 2015, R6,9 billion was spent against the above mentioned locomotive contracts for the period, with the spend since inception amounting to R13,7 billion.
93 electric locomotives have been accepted into operations and the remaining two locomotives are in various stages of commissioning. Fault free trips are expected to be in full utilisation by the end of May 2015.
25 diesel locomotives have been delivered and have been accepted into operations, with an expected completion date of July 2015 for the remaining 35 locomotives.
14 electric locomotives for the coal line have been received and are currently undergoing testing. The expected completion date is September 2015, for the remaining 86 locomotives.
The design freeze stage has been achieved by most of the original equipment manufacturers that have been contracted to supply the 465 diesel and 599 electric locomotives for the GFB which reflects a major milestone in the production process.
Wagons
Freight Rail and Engineering have embarked on a programme to build new wagons in support of the MDS. For the year to date, 2 700 wagons have been built and received by Freight Rail resulting in a capital investment of R3,0 billion.
Capitalised maintenance
Total capitalised maintenance for the period amounted to R7,6 billion of which R3,4 billion was invested in interventions to sustain the company’s rail infrastructure, with R4,2 billion invested to maintain rolling stock.
Manganese expansion to 16mtpa
The manganese expansion programme will increase manganese export capacity to 16mtpa by 2019 through the upgrade of the rail network between Hotazel and Ngqura; and the provision of a new bulk terminal in the Port of Ngqura. The project aims to retain South Africa’s position as the leading exporter of high-grade manganese ore.
Phase 1 of the rail upgrade was approved as early works and a total of R466 million has been invested to date. Engineering and construction planning has commenced for the remaining rail and port investments. The expected completion date is April 2017.
Coal line expansion
The coal line is the main channel for export coal, which starts with the mines in Mpumalanga and
114 | Transnet Integrated Report 2015
Performance and outlook

14th PROOF – 29 JUNE 2015
ends at the Port of Richards Bay Coal Terminal (RBCT). Plans are in place to increase rail capacity to 81,0mtpa in the near future and thereafter to 97,5mtpa in the medium to long term. The total expansion and sustaining capital investment for the coal and mineral system programme over the MDS period is currently estimated to be R40,7 billion.
For the current year, R411 million has been invested in the coal line expansion for upgrading yards, lines and electrical equipment. To support the expansion of the export coal line, Transnet is acquiring 100 electric locomotives.
The Company has embarked on a programme to provide rail infrastructure capacity to unlock the Waterberg and Mpumalanga coal reserves for Eskom power stations, domestic industrial users and export markets as well as pursuing various other mineral developments in Limpopo for domestic and export purposes. These products require capacity slots shared on a shared rail infrastructure and additional capacity has to be developed holistically based on aligned commercial strategies and train operating principles. Demand drivers include the growth in demand for seaborne thermal coal and other minerals to be exported to China and India that would sustain the major expansion in global trade, as well as the Eskom rail migration programme that will introduce incremental capacity to 24mtpa.
Iron ore expansion
Transnet’s expansion plan for iron ore exports through the Port of Saldanha is progressing well. The pre-feasibility study for Sishen-Saldanha Corridor Expansion (SSCE) programme has been completed. The expansion programme is targeting a first tranche of rail and port expansion to accommodate a 2014 industry-validated export demand of 71 million tons. This first tranche will unlock a corridor capacity of 75mtpa, up from the current corridor capacity of 60mtpa. The feasibility stage will take approximately 13 months to complete and will begin in the last quarter of 2015. Construction is anticipated to
begin in the second half of 2017, to be completed by 2023.
Rail and port concept designs have been formulated to date for expansion beyond 75mt, in incremental capacity tranches. These decisions will depend on global iron ore market conditions and South African iron ore production and demand.
Pipeline projects:
New Multi-Product Pipeline (NMPP)
The NMPP is a strategic investment to secure the supply of petroleum products from the coastal terminals in Durban to the inland (predominantly Gauteng) market over the long term. It is one of the largest and most complex multi-product pipelines in the world.
R23,9 billion has been invested in the NMPP project since inception, with the investment for the year amounting to R2,5 billion.
Port infrastructure, equipment and floating crafts
As part of the MDS, Port Terminals and National Ports Authority plan to invest in infrastructure and equipment to unlock demand and contribute to the economic development of South Africa. In the current year, Transnet has invested R1,4 billion for the maintenance and acquisition of cranes, dredgers, tugs and straddle carriers.
Broad-based Black Economic Empowerment (B-BBEE) and supplier development
Transnet acknowledges the importance of B-BBEE as a critical component of achieving sustainable and inclusive economic growth. Transnet aims to optimise its contribution to B-BBEE in the execution of its mandate as a State-Owned Company.
As a State-Owned Company, Transnet’s B-BBEE verification covers six of the seven elements of the Generic Transport Public Sector Scorecard, excluding the ownership element. The Rail Charter, Maritime Charter and Property Charter are also
| 115

14th PROOF – 29 JUNE 2015
applied. Transnet was rated a Level 2 B-BBEE contributor in 2014.
Transnet undertakes all its procurement activities in a manner that protects and advances persons, or categories of persons, who have been disadvantaged by past discrimination and ensures that procurement activities are fair, equitable, transparent, competitive and cost-effective. Transnet’s procurement activities contribute directly to the economic transformation of South Africa and as such, have the ability to decrease income inequalities, whilst significantly increasing the number of previously disadvantaged individuals who manage, own and control businesses.
Transnet’s total recognised B-BBEE spend, as per the Department of Trade and Industry Codes (the Codes), is R45,2 billion or 105,1% of Total Measured Procurement Spend of R43,1 billion. During the year, Transnet spent R9,4 billion (21,7% of B-BBEE spend) on black-owned enterprises; R4,1 billion (9,6% of B-BBEE spend) on black women-owned enterprises; R3,0 billion (7,1% of B-BBEE spend) on exempted micro-enterprises; and R2,0 billion (4,6% of B-BBEE spend) on qualifying small enterprises.
Transnet is committed to carrying out Enterprise Development initiatives as outlined in the Broad-Based Black Economic Empowerment
(B-BBEE) Act. Enterprise Development interventions have the specific objective of assisting and accelerating the development, sustainability and ultimate financial and operational independence of small, medium and micro businesses as defined in accordance with the Codes. Transnet has spent R336,6 million or 6,4% of net profit after taxation on Enterprise Development as compared to 3,0% of net profit after taxation as required by the B-BBEE Act. This has been spent on providing both financial and non-financial support to black-owned Small, Micro and Medium Enterprises (SMMEs).
Transnet’s Supplier Development programme promotes skills development and the creation and preservation of jobs. It further encourages the transfer of intellectual property and the localisation of supply; and ultimately promotes industrialisation through contractually obligated supplier development plans. Since inception of the programme, total contract value to date amounts to R46,2 billion (2014: R29,4 billion). Supplier development obligations concluded with suppliers amounts to R17,1 billion or 37,1% of contract value (2014: R10,9 billion or 37,2% of contract value). To date, R10,2 billion or 60,1% (2014: R5,9 billion or 54,3%) of these supplier development obligations have been met.
116 | Transnet Integrated Report 2015
Performance and outlook
14th PROOF – 29 JUNE 2015
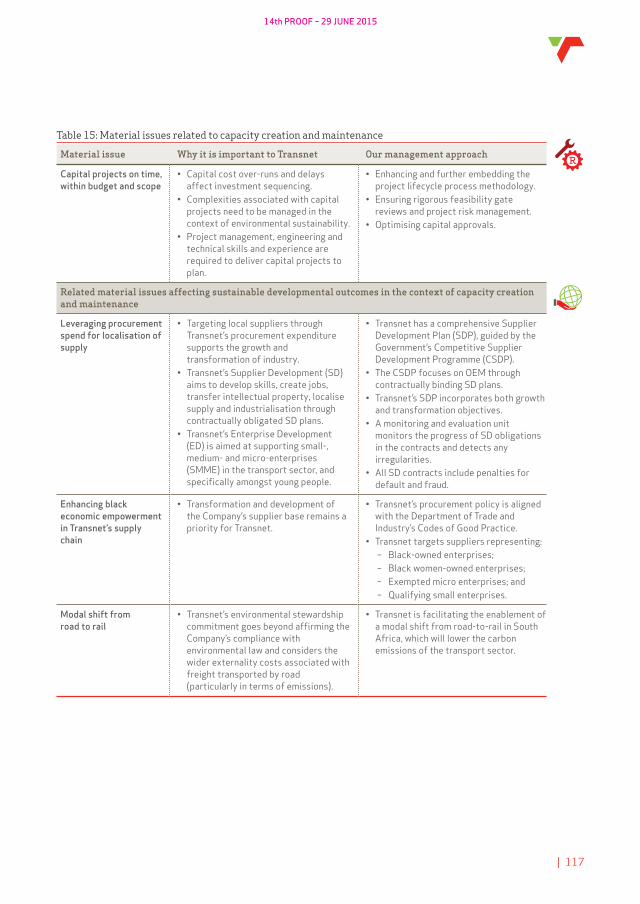
Table 15: Material issues related to capacity creation and maintenance
Material issue Why it is important to Transnet Our management approach
Capital projects on time, within budget and scope
• Capital cost over-runs and delays affect investment sequencing.
• Complexities associated with capital projects need to be managed in the context of environmental sustainability.
• Project management, engineering and technical skills and experience are required to deliver capital projects to plan.
• Enhancing and further embedding the project lifecycle process methodology.
• Ensuring rigorous feasibility gate reviews and project risk management.
• Optimising capital approvals.
Related material issues affecting sustainable developmental outcomes in the context of capacity creation and maintenance
Leveraging procurement spend for localisation of supply
• Targeting local suppliers through Transnet’s procurement expenditure supports the growth and transformation of industry.
• Transnet’s Supplier Development (SD) aims to develop skills, create jobs, transfer intellectual property, localise supply and industrialisation through contractually obligated SD plans.
• Transnet’s Enterprise Development (ED) is aimed at supporting small-, medium- and micro-enterprises (SMME) in the transport sector, and specifically amongst young people.
• Transnet has a comprehensive Supplier Development Plan (SDP), guided by the Government’s Competitive Supplier Development Programme (CSDP).
• The CSDP focuses on OEM through contractually binding SD plans.
• Transnet’s SDP incorporates both growth and transformation objectives.
• A monitoring and evaluation unit monitors the progress of SD obligations in the contracts and detects any irregularities.
• All SD contracts include penalties for default and fraud.
Enhancing black economic empowerment in Transnet’s supply chain
• Transformation and development of the Company’s supplier base remains a priority for Transnet.
• Transnet’s procurement policy is aligned with the Department of Trade and Industry’s Codes of Good Practice.
• Transnet targets suppliers representing: – Black-owned enterprises; – Black women-owned enterprises; – Exempted micro enterprises; and – Qualifying small enterprises.
Modal shift from road to rail
• Transnet’s environmental stewardship commitment goes beyond affirming the Company’s compliance with environmental law and considers the wider externality costs associated with freight transported by road (particularly in terms of emissions).
• Transnet is facilitating the enablement of a modal shift from road-to-rail in South Africa, which will lower the carbon emissions of the transport sector.
| 117
14th PROOF – 29 JUNE 2015
Operational excellence: Group performance
Human resource capability
Transnet’s permanent headcount at 31 March 2015 was 55 506. The Company spent 2,8% of its labour cost on training during the period, focusing on artisans, engineers, and engineering technicians. 255 full-time engineering bursaries were awarded in various disciplines and 563 engineering technician trainees were given workplace experience opportunities. 613 new apprentices joined the Company’s apprenticeship scheme and 201 new graduates-in-training were contracted. Sector-specific skills development continued to focus on maritime, rail and port terminal operations, with 3 320 learners participating in these programmes. Currently, the Company has access to 3 145 apprentices and 534 engineering bursars in its talent pool.
Safety
Safety performance is measured against the industry-recognised rolling 12-month disabling injury frequency rate (DIFR). In this regard, the Company recorded a DIFR performance of 0,69 against the target of 0,75 (2014: 0,69). This is the fourth consecutive year that the Company recorded a DIFR ratio below 0,75.
Tragically, the Company reported four employee fatalities during the year. Two of the employee fatalities were as a result of non-adherence to standard operating procedures and two as a result of motor vehicle accidents while on duty.
Public fatalities decreased by 9% from 106 to 96 when compared to prior year. Trespassers in the rail reserve account for 85% of these fatalities.
Transformation
Transnet has increased the number of black employees (both male and female) in most occupational level categories. Overall representation has increased for both male and female employees. Representation is below that of the National Economically Active Population (NEAP) with black employees representing 83,0% of the employee-base, compared to
the NEAP target of 88,7%. There is however, a significant over-representation of black male employees at semi-skilled and unskilled levels in operations.
The employee race profile for the year was 69,4% black, 9,9% coloured, 3,7% Indian and 17,0% white.
Female employees represent 26,4% of the employee-base, compared to the NEAP target of 46,0%. Female employment has steadily improved at top, senior, professional and skilled technical levels but it remains a challenge to attract and retain women in operations where representation in the semi-skilled and unskilled levels is currently 24,0% and 19,0% respectively.
Women represent 50% of the Group Executive.
During the year, Transnet improved its employment of people with disabilities (PWDs) from 1,6% in 2014 to 2,3% in the 2015 financial period. The employment equity (EE) plan for the 2016 financial year will continue to focus on the elimination of unfair discrimination and implementation of affirmative action measures to achieve an employee-base that reflects the national economically active population of South Africa across all occupational levels.
Security of energy supply
Transnet’s primary energy sources are electricity (62%) and diesel fuel (31%) with the remainder constituting distillate fuel oil, petrol and other sources. Freight Rail uses more than 70% of Transnet’s total electricity and fuel consumption. During the year, energy constituted 18% of Transnet’s total operating costs. The Company is reliant on Eskom for the provision of base-load electricity to power operations. Eskom is, however, experiencing severely constrained generating capacity, low levels of power availability, unplanned outages, maintenance backlogs, high diesel plant utilisation, compounded by liquidity and governance challenges. Load shedding is a frequent occurrence across the country to prevent grid failure and is likely to continue for the next three to five years
118 | Transnet Integrated Report 2015
Performance and outlook

14th PROOF – 29 JUNE 2015
until new power plants and independent power producers are commissioned. Coupled with these challenges is the steep rise of electricity prices above inflation.
The projected mix of energy can be influenced by supply-side factors and the technologies employed in future. Transnet will have the ability to influence this mix by considering the role of costs, carbon emissions and security of supply. Expectations are that Transnet will use more renewables and that natural gas will play a major role in the energy base load of the future. Transnet is also a major transporter of energy in the form of fuels and coal. Any change in mix on the supply side can therefore pose a risk to freight currently transported on rail, pipelines and through the port system as well as promoting new opportunities.
Business interruption and incident management
Transnet continued to refine its Business Continuity Management framework during the year. The framework provides for regular simulations to be conducted to test the effectiveness of the Business Continuity programmes. An integrated simulation was conducted during the reporting period in conjunction with major stakeholders at the Ramatlabama Botswana Border with Freight Rail, Engineering, Botswana Rail, Group Risk Management, Local Authorities (Emergency Medical Rescue and Response Teams) and participation by representatives from other Operating Divisions.
During the year, Freight Rail experienced a train derailment on 18 January 2015 between Eerste River and Strand Station as the train was coming out of the loop into the mainline. Four wagons derailed causing damage to 250 metres of track. The incident is under investigation by the Railway Safety Regulator.
A strike organised by the National Union of Metalworkers of South Africa (Numsa) at Ngqura from 25 April was characterised by several disruptive incidents. The container terminal is a
major container transshipment hub for global shipping companies. It also services the Nelson Mandela Bay metro area’s critical automotive industry and citrus exports. A number of striking Numsa members were arrested and charged with acts of intimidation and violence. This included stoning and petrol-bombing of workers’ houses. However, throughout the strike, the port experienced no delays or congestion as a result of the various interventions in line with the Company’s contingency plans and business continuity management processes implemented. A further contributor to the undisrupted running of operations during the strike was undoubtedly the dedication of non-striking colleagues and the heightened cooperation with major customers. Transnet, through its employee assistance programmes, has undertaken to reintegrate the previously striking colleagues into the Company.
The export iron ore line underwent its annual shutdown from Tuesday, 12 August to 21 August, 2014. The line carries the longest heavy haul production trains in the world, moving an average of 60,5 million tons per annum. During the shutdown specialised infrastructure maintenance and upgrade projects were conducted over the entire section of the 861 kilometre railway line between Sishen in the Northern Cape and Saldanha in the Western Cape. The 10-day shutdown provided an opportunity for the mines, Engineering, Port Terminals and Eskom to maintain their plant and equipment, which could not be done in any other period without disrupting operations. The total cost for the shutdown amounted to approximately R114 million, including the installation work done by contractors, material and labour costs.
Durban Pier 1 was impacted by a lower draft which led to the terminal having to divert a portion of its volumes to other facilities in the Durban area. The terminal has also been impacted by gas emissions from private terminals in the Durban harbour. Furthermore, weather delays have also hampered operations. Despite these setbacks, the terminal recovered well to exceed targeted volumes.
| 119

14th PROOF – 29 JUNE 2015
Enterprise Information Management Services (EIMS)
Transnet’s ICT infrastructure is managed through the EIMS support services department.
During the year, the EIMS function continued to support the Company in achieving its strategic MDS goals by providing enabling technology for value-chain integration; ensuring a stable and secure infrastructure environment; managing cost-effective technology solutions and strategic sourcing; and creating information technology synergies across the Operating Divisions.
Performance for the year encompassed the following:• Transnet entered into an Enterprise License
Agreement with Microsoft covering a three-year period.
• The Information Security Policy was presented at the employee bargain councils, and proposed changes were re-tabled at a subsequent meeting in March 2015.
• A revised Web Application Standards proposal was presented to the Group Executive: EIMS. The implementation of the standards will help to resolve first-level security violation findings.
• Negotiations pertaining to a Network Master Services Agreement (MSA) was finalised with Neotel, with a contract being signed in December 2014. It was agreed that the service transition period would not exceed a maximum of 21 months.
• To support optimal disaster recovery – a prevailing material issue for the organisation – all Transnet financial systems and report solutions are on SAP R3 and BW. Further, the
Fixed Asset Stabilisation (FAS) project has been implemented. Important outcomes of this project are to ensure accurate and timely reporting on capital assets; ensure that allocation processes are correctly followed and that register updates comply with both tax and accounting regulations.
• There are still significant vacancies within the Group EIMS department. During the year, progress was made in filling the security structure. A project has been initiated to align human capital management within the department with the Company’s strategic workforce planning to improve business performance. The department also agreed on a balanced scorecard performance plan with employees.
Corporate social investment
The Transnet Foundation invested R225 million in community upliftment programmes across South Africa, with approximately 46% of the budget committed to comprehensive primary healthcare efforts through the Phelophepa healthcare trains and teenage health programmes. The Phelophepa healthcare trains, through on-board clinics, treated more than 110 902 patients and provided healthcare experiential training to over 1 266 students. Through its community outreach initiatives, the health portfolio reached over 352 429 community members.
The Rural and Farm Schools Sport Programme aims to provide sport training and infrastructure in rural areas to help underprivileged youth reach their true sporting potential. The programme enables rural youth to participate in sport at a
120 | Transnet Integrated Report 2015
Performance and outlook

14th PROOF – 29 JUNE 2015
highly competitive level and to receive the high-performance training they need to improve their natural talent. The SAFA – Transnet School of Excellence posted a 93% matric pass rate.
Steel shipping containers outlive their usefulness as cargo carriers within five years and are typically abandoned in shipyards. The Socio Economic Infrastructure Development (SEID) Programme, previously known as the Container Assistance Programme, recycles these containers to develop a combination of containers and fixed buildings to provide much-needed infrastructure in communities. With Government departments and the South African Police Service as long-standing partners, this unique infrastructure model has transformed numerous communities, bringing Government services closer to the people and effectively enabling people to live healthier, safer and more fulfilling lives. The Transnet sponsored Ntamonde Police station in the Eastern Cape was completed in February 2015.
Through educator and learner support programmes, Transnet is making a tangible difference to the quality of education for both teachers and learners. The Orphan Youth Education development programme provides vulnerable and academically
gifted young people with comprehensive, structured support throughout their school and tertiary education career. Thirty learners were enrolled in the programme during the year, achieving a 100% pass.
The Foundation’s heritage preservation efforts focused on the development of a catalogue of steam locomotive components and a thematic history register of their conservation.
Environmental stewardship
Transnet recorded a 1% decrease in electricity consumption whilst energy efficiency improved by 8,9% compared to the prior year. In electric traction (which is 75% of total Company power consumption), Freight Rail achieved a 4,7% energy efficiency gain. The new 15E and 19E locomotives on the iron ore and coal lines together regenerated approximately 165 753MWh for the year.
The Company’s carbon emission intensity reduced by 7,5% compared to the prior year.
Freight Rail’s top 10 general freight commodities market share gains from road hauliers in the year resulted in carbon emissions savings for the South African transport sector of 479 648 tCO2e.
| 121
14th PROOF – 29 JUNE 2015
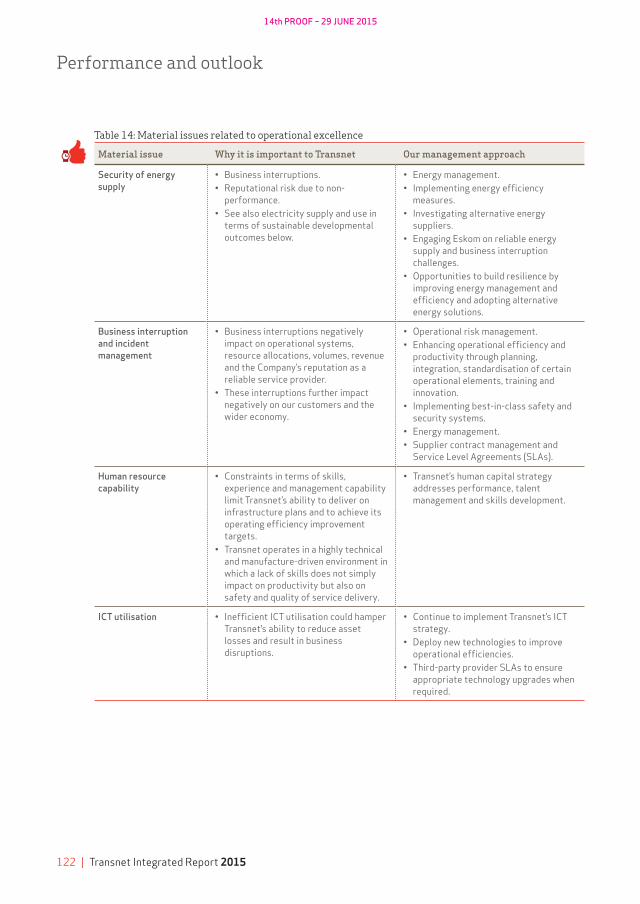
Table 14: Material issues related to operational excellence
Material issue Why it is important to Transnet Our management approach
Security of energy supply
• Business interruptions.• Reputational risk due to non-
performance.• See also electricity supply and use in
terms of sustainable developmental outcomes below.
• Energy management.• Implementing energy efficiency
measures.• Investigating alternative energy
suppliers.• Engaging Eskom on reliable energy
supply and business interruption challenges.
• Opportunities to build resilience by improving energy management and efficiency and adopting alternative energy solutions.
Business interruption and incident management
• Business interruptions negatively impact on operational systems, resource allocations, volumes, revenue and the Company’s reputation as a reliable service provider.
• These interruptions further impact negatively on our customers and the wider economy.
• Operational risk management.• Enhancing operational efficiency and
productivity through planning, integration, standardisation of certain operational elements, training and innovation.
• Implementing best-in-class safety and security systems.
• Energy management.• Supplier contract management and
Service Level Agreements (SLAs).
Human resource capability
• Constraints in terms of skills, experience and management capability limit Transnet’s ability to deliver on infrastructure plans and to achieve its operating efficiency improvement targets.
• Transnet operates in a highly technical and manufacture-driven environment in which a lack of skills does not simply impact on productivity but also on safety and quality of service delivery.
• Transnet’s human capital strategy addresses performance, talent management and skills development.
ICT utilisation • Inefficient ICT utilisation could hamper Transnet’s ability to reduce asset losses and result in business disruptions.
• Continue to implement Transnet’s ICT strategy.
• Deploy new technologies to improve operational efficiencies.
• Third-party provider SLAs to ensure appropriate technology upgrades when required.
122 | Transnet Integrated Report 2015
Performance and outlook

14th PROOF – 29 JUNE 2015
Material issue Why it is important to Transnet Our management approach
Related material issues impacting on sustainable developmental outcomes in the context of operational excellence
Transnet’s ability to create and sustain jobs over the period of the MDS
• The large capital investment and high operational intensity of the MDS offer both significant opportunities and challenges for job creation.
• Transnet must grow its workforce at a pace that the business can sustain, and with an age and skills profile that meet the needs of the Company both for the short- and long-term.
• Transnet’s Human Capital strategy focuses on job creation within the framework of strategic workforce planning to ensure the recruitment and retention of top quality employees.
• Transnet’s talent management and development programme aims to retain talent and ensure robust succession plans for priority and critical positions.
• Leadership and coaching programmes target specific management levels.
Having the right skills at the right time to implement the MDS
• 43% of the workforce is semi-skilled with low skills density levels and limited literacy abilities.
• Managerial competency levels in first line management have an impact on operational efficiencies and delivery.
• There are significant skills shortages for project management, engineering and technical skills in operational requirements.
• The age profile of Transnet employees reflects a high percentage of ageing skills and experience and a rapidly growing percentage of young staff with generally poor education and limited experience.
• Skills clustering – to establish groupings of similar skills and experience.
• Demand simulation – to project future human resource needs in response to fluctuations in operating models.
• Supply simulation – to project skills needs within varying workforce for retirement age, normal attrition rate and early retirement.
• Gap analysis – to identify skills gaps and risk profiles.
• Anchoring – to embed ongoing workforce analysis within annual corporate planning and budgeting.
Increasing representation of black employees, female employees and people with disabilities
• The scale and scope of Transnet’s procurement expenditure has the opportunity to create and empower new industrialists in various sectors.
• Transformation and development of the Company’s supplier base remains a priority.
• Transnet’s Employment Equity (EE) Policy is aligned to the Employment Equity Act, 1998 (Act No. 55 of 1998).
• Transnet adheres to the following Acts: – Promotion of Equality and Prevention
of Unfair Discrimination Act, 2000 (Act No. 4 of 2000);
– The Labour Relations Act, 1995 (Act No. 65 of 1995); and
– The Skills Development Act, 1998 (Act No. 97 of 1998).
• Transnet B-BBEE policy and strategy.
| 123

14th PROOF – 29 JUNE 2015
Material issue Why it is important to Transnet Our management approach
Public safety at level crossings
• Theft of copper, overhead cables and goods in transit, as well as vandalism of the tracks impact the ability to deliver freight reliably and pose safety risks.
• Transnet operates in high risk environments that have the potential to negatively impact customers and the general public.
• Transnet is entrenching a culture of safety and engaging with stakeholders to understand their safety concerns.
• Public safety awareness programmes.
Adherence to standard operating procedures in the workplace
• Transnet operates in high risk environments that have the potential to negatively affect employees and contractors.
• Transnet’s Safety, Health, Environment and Quality (SHEQ) Policy.
• Transnet’s recognition agreements with trade unions are supported by policies, standards, procedures and rules to ensure a safe working environment.
• Various policies, standards procedures and guidelines are implemented to improve safety across the business.
• Safety training is conducted through the Transnet Academy Schools of Rail, Maritime, Pipelines and Security and built into all functional and technical training.
Electricity supply and use
• Transnet’s primary energy source is electricity (62%).
• The Company is fully reliant on Eskom for the provision of base-load electricity to power operations.
• Eskom has severely constrained generating capacity, low levels of power availability, unplanned outages, maintenance backlogs, high diesel plant utilisation, compounded by liquidity and governance challenges.
• Transnet adopted an Energy Policy in November 2014
• The ISO50001 energy management system is being implemented in all Operating Divisions and Transnet Property.
• Guidelines have been established for energy specifications in Transnet procurement and capital projects lifecycle management.
• Energy efficiency initiatives are implemented across the Company.
• The R&D unit in Engineering is investigating new alternative energy technologies.
Measurably improving the quality of life of the communities within which we operate
• Transnet’s activities take place in many South African communities.
• Transnet’s commitment to community-level development finds substantive expression through the Transnet Foundation.
• Transnet’s flagship community development programmes have a strong focus on rural communities situated along the rail network, and investing in those projects with a strong community impact.
• Transnet Foundation’s programmes are focused primarily on health, asset utilisation to support local infrastructure solutions, and education.
Table 14: Material issues related to operational excellence (continued)
124 | Transnet Integrated Report 2015
Performance and outlook
14th PROOF – 29 JUNE 2015
Market segment competitiveness: Group performance
Regional integration of the freight system is a strategic priority and the implementation of the Africa strategy has gathered pace in recent years.
The investment in port, rail and pipeline infrastructure and operations will radically improve the competitiveness and capacity of the national freight system. Key freight system objectives include a significant shift of long-distance freight from road to rail, enhanced maritime connectivity, integration of the regional freight system and the creation of capacity ahead of demand. Transnet has made significant gains in these areas over the past three years and this trend is likely to accelerate as the investments made in recent years start to bear fruit.
Supply-chain exposures
Export coal and iron ore grew substantially by 10% and 12% respectively year-on-year to 76,3mt and 59,7mt. They also performed better by 2% and 3% compared to budget. Product availability improved as key export iron ore
customers recovered from the production constraints of the prior year. Internal resource availability improved through sustained implementation of the capital expenditure programme and the two commodities also benefited from operational efficiency improvements supported by the TVCC initiatives. The protracted trend of declining international coal and export prices in 2015 is negatively affecting the outlook for 2016.
Transnet’s expansion into Africa
One of the overarching objectives for Transnet is to integrate South Africa with the region and the rest of the continent. Regional integration of the freight system and the implementation of an Africa strategy has been a key focus area in recent years. Revenue from cross-border activities has increased from R1,5 billion in 2014 to R2,1 billion in the current year. As a percentage of revenue, the contribution of cross-border activities has grown from 4,2% in 2013 to 4,8% in 2015.
Refer to page 40 in SR 2015 for more detail on Transnet’s Africa Strategy.
> SR
| 125
14th PROOF – 29 JUNE 2015
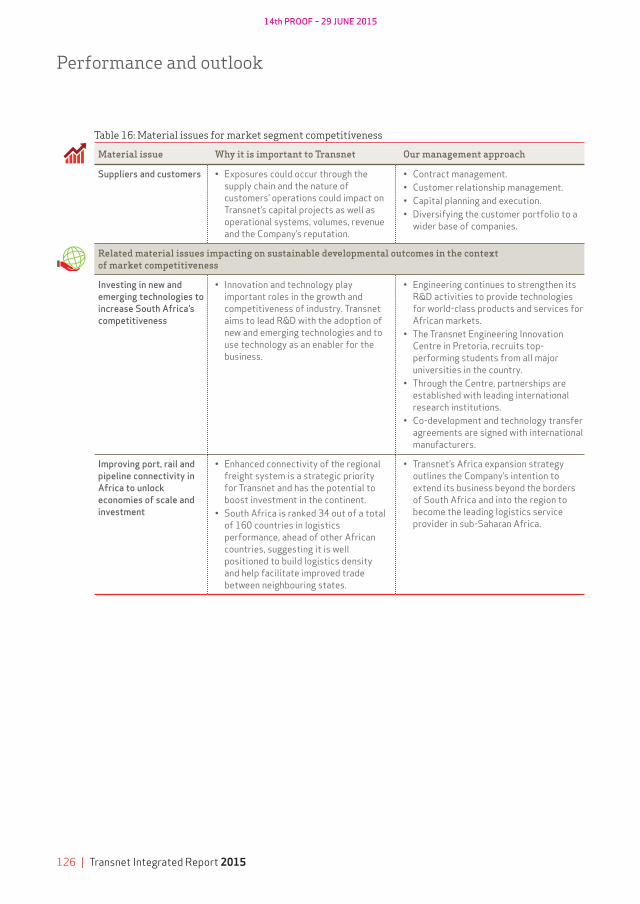
Table 16: Material issues for market segment competitiveness
Material issue Why it is important to Transnet Our management approach
Suppliers and customers • Exposures could occur through the supply chain and the nature of customers’ operations could impact on Transnet’s capital projects as well as operational systems, volumes, revenue and the Company’s reputation.
• Contract management.• Customer relationship management.• Capital planning and execution.• Diversifying the customer portfolio to a
wider base of companies.
Related material issues impacting on sustainable developmental outcomes in the context of market competitiveness
Investing in new and emerging technologies to increase South Africa’s competitiveness
• Innovation and technology play important roles in the growth and competitiveness of industry. Transnet aims to lead R&D with the adoption of new and emerging technologies and to use technology as an enabler for the business.
• Engineering continues to strengthen its R&D activities to provide technologies for world-class products and services for African markets.
• The Transnet Engineering Innovation Centre in Pretoria, recruits top-performing students from all major universities in the country.
• Through the Centre, partnerships are established with leading international research institutions.
• Co-development and technology transfer agreements are signed with international manufacturers.
Improving port, rail and pipeline connectivity in Africa to unlock economies of scale and investment
• Enhanced connectivity of the regional freight system is a strategic priority for Transnet and has the potential to boost investment in the continent.
• South Africa is ranked 34 out of a total of 160 countries in logistics performance, ahead of other African countries, suggesting it is well positioned to build logistics density and help facilitate improved trade between neighbouring states.
• Transnet’s Africa expansion strategy outlines the Company’s intention to extend its business beyond the borders of South Africa and into the region to become the leading logistics service provider in sub-Saharan Africa.
126 | Transnet Integrated Report 2015
Performance and outlook

14th PROOF – 29 JUNE 2015
OutlookThe performance of the global economy has been mixed, but with a marked deterioration in sentiment about the global economic outlook. Forecasts for economic growth have fallen in the first quarter of 2015, as they have every year since 2011, as the much anticipated recovery fails to take hold. The world gross domestic product (GDP) estimate was revised downwards to 3,4% for 2014 and is forecast to grow by 3,5% for 2015.
Growth in sub-Saharan Africa is however expected to remain strong, estimated at 5,0% in 2014 and forecast to decline slightly to 4,5% in 2015 due to the effects of declining commodity prices. Growth will be driven by sustained infrastructure investment, buoyant service sectors and strong agricultural production, even as oil related activities provide less support. With the African continent accounting for close to 30% of South Africa’s merchandise exports, growth in the region will provide an important pillar for the manufacturing and logistics sectors.
South Africa’s economic performance was significantly impacted by strikes in 2014, which were concentrated in the mining and manufacturing sectors. South Africa’s GDP grew by 1,5% in 2014 and is forecast to grow by 2,0% in 2015 and 2,1% in 2016 respectively. The main drivers of improved growth are a pick-up in the global economy from its current lows. Global trade has performed below expectations for a number of years and this has negatively impacted all segments of the shipping market. Global container volumes grew by an estimated 5,0% in 2014 and are forecast to grow by 5,5% in 2015
with the bulk of this driven by intra-Asian trade. For the domestic market a medium-term average annual growth rate of 4,2% per annum is anticipated after a number of years of very low growth.
The per capita rate of steel consumption among key developing economies relative to developed economies indicates that there is still significant potential growth for steel and steel input materials as countries industrialise and urbanise. World trade of iron ore grew by an estimated 8,4% in 2014. Over the medium term, world iron ore trade is projected to increase at an average annual rate of 3,6% to 2019. The South African market remains cost-competitive in the face of rising low-cost iron ore in the seaborne market.
Manganese ore consumption is projected to rise at an average annual rate of 4,3% between 2014 and 2019. Global production of manganese ore is also set to rise at 4,9% over the same period. South Africa, endowed with around 80% of global manganese reserves is set to emerge as a key export hub for manganese over the next few years, gaining market share from other international producers.
Concern about the effect of coal use on the environment has prompted many countries to enact measures to reduce the role of coal in the energy mix, while the growth in the world’s coal use is unlikely to be as rapid as other energy sources, it is still expected to play a large role in the world electricity generation mix. Exports from South Africa are projected to increase at an average annual rate of 6,1% to 98mt in 2019.
| 127