performance analysis of supply chain and value chain of
TRANSCRIPT
Performance Analysis of Supply Chain and Value Chain of Selected Fruits inKhagrachari Hill District
Bisakha DewanLecturer
Department of Agribusiness & MarketingSher-e-Bangla Agricultural University
Dr. Md. Jamal UddinSenior Scientific Officer
RARS, HathazariBangladesh Agricultural Research Institute
Dr. M. Mizanul Haque KazalProfessor
Department of Development and Poverty StudiesSher-e-Bangla Agricultural University
and
Fatema SarkerLecturer
Department of Development and Poverty StudiesSher-e-Bangla Agricultural University

Performance Analysis of Supply Chain and Value Chain of Selected Fruits inKhagrachari Hill District
Bisakha Dewan, Md. Jamal Uddin, M. Mizanul Haque Kazal and Fatema SarkerSher-e-Bangla Agricultural University, Dhaka
Corresponding Author Email: [email protected]
Abstract
The study was conducted at Khagrachari Sadar upozila under Khagrachari Hill District,
to know the existing supply chain of selected fruits, to identify value chain of selected
fruits and to find out constraints in value chain performance of selected fruits. Three local
markets, namely Shapla chattor (town market/baro bazar), Madhupur bazaar and
Shonirvhor bazar and one assemble market in Narikal Bagan were purposively selected
for data collection from both fruit growers and market intermediaries. The selected
samples included 130 fruit growers (mango growers-56, jackfruits growers-34 and litchi
growers-40) and 84 market intermediaries (wholesaler-16, faria-20, bepari-32 and
retailer-16). For value chain development of selected fruits UNIDO’s approach or basic
steps of UNIDO’s approach to agro-value chain analysis and development was followed.
In the study area, nine supply chains was found for mango marketing of which three
supply chain had went out of the region. For jackfruit and litchi marketing six supply
chains was found. For all fruits (mango, jackfruit and litchi), the most important supply
chain, grower to customer was supplied about 34 percent of total fruits supply. In the
study area value was added in some stages. These were grading, cleaning, packaging,
storing and transportation. Highest value was added on grading process which was about
85 percent to 100 percent. For developing value chain in the study area some constraints
like post harvest losses, storage problem, lack of processing center, high packaging cost
etc was found.
1. Introduction
The Chittagong Hill Tracts (CHT) covers an area of 13,295 square kilometers of Himalayan
range hills and hillocks measuring one tenth of Bangladesh. The major hill soils are yellow-
brown to strong brown permeable friable loamy, very strongly acidic and low in moisture
holding capacity. However, soil patterns generally are complex due to local differences in sand,
silt and clay contents of the underlying sedimentary rocks and in the amount of erosion that has
occurred. (Year book, 2011)
The area is becoming a seasonal fruit hub with immense potential for the development of a food-
processing sector. Last year the CHT produced nearly 14 lakh tonnes of fruit, officials said,
while a decade ago production in the region was 6 lakh tones in 2002 (The daily star, 2012). In
Khagrachari Hill District fruit was grown on 3855 acre of land in 2010/11, up from1025 acre in
2006/07 (BBS, 2011).
Fresh tropical fruits are on winning ground in world markets as to recent statistical figures
(Anonymous, 2001). Its production has risen by 7 percent annually since 1997; and the bulk
of these fruits (98percent) are grown in developing countries. Hundreds of farmers in the three
hill districts produce plenty of mango, jackfruit, papaya, pineapple, orange, and banana every
year, but do not get fair prices of the perishable produces only because of lack of proper
marketing facilities.
Khagrachari hill district with an area of 2699.55 square kilometers is bounded by the Indian State
of Tripura on the north, Rangamati and Chittagong districts on the south, Rangamati district on
the east, Chittagong district and the Indian State of Tripura on the west.
The vast area of Khagrachari hill district is suitable for fruits production. From all fruits mango,
jackfruit and litchi is dominant in production in this area. In the year 2010-11, the total area of
mango was 912 acre and total production was 2819 m.tons. During the year, total area of
jackfruits was 3066 acre and total production was 37356m.tons whereas total area of litchi was
273 acre and total production was 1228m.tons. Also the percentage change in yield over 1995/96
to 2010/11 was 153.9mt/ha, 195.48 mt/ha and 140.65 mt/ha for mango, jackfruit and litchi
respectively (BBS, 2011).
Even though fruit is economically and socially important, fruit supply chain and their
characteristics have not yet been studied and analyzed for Khagrachari hill district where great
potential of fruit production (Mango, jackfruit & Litchi) exists.
The changing demand in domestic and international markets for high-value product creates
challenges and opportunities. Small and marginal holders produce majority of the horticultural
commodities like fruits and vegetables, but due to weak and fragmented value-chain, only a
small percentage of the produce reaches the urban market. Appropriate marketing infrastructure
is crucial for efficient marketing of fruits and vegetables. Adequate transportation and product
handling are also important for the trade of agricultural products and important factors in
assuring good prices and poverty alleviation. Investment is required for improved maintenance
of road and port infrastructures. In addition to infrastructure development, modification of
policies and management are also needed to improve appropriate and timely shipping of
perishables (World Bank, 2005).
Fruit production and marketing assume an important place in the agricultural development as
well as cheaper fruit based nutrient supply to the population of the country. Despite the vast
utility of fruits production, its marketing system in hill region is plagued with several
inadequacies. Therefore, the present study was designed to address for identifying value chain
and constraints in value chain performance of selected fruits to drive policy implications for
value chain development of selected fruits in Khagrachari hill district.
2. Methodology
Data: The study was confined to Khagrachari Hill District. Based on higher concentration of
fruits garden, Khagrachari sader upazila was selected purposively for the survey. Three local
markets, namely Shapla chattor (town market/baro bazar), Madhupur bazaar and Shonirvhor
bazar and one assemble market in Narikal Bagan were purposively selected for data collection
from both fruit growers and market intermediaries. The participants involved in fruits (mango,
jackfruit and litchi) production and marketing in the study area were fruit growers, wholesaler,
bepari, faria and retailer. As the population size was not readily available, the fruit growers and
market intermediaries were selected considering availability at the first sight. The selected
samples included 130 fruit growers (mango growers-56, jackfruits growers-34 and litchi
growers-40) and 84 market intermediaries (wholesaler-16, faria-20, bepari-32 and retailer-16).
Primary data were collected during the months of April to July 2014.
Analytical tools: The data were collected from different categories of fruit growers and from
different marketing functionaries. Descriptive statistics were used to summarize the data and
presented in tabular form of market actors. For identifying existing supply chain descriptive
research was done and for value chain analysis UNIDO’s systematic approach to agro-value
chain analysis was followed.
3. Results and discussions
3.1 Existing Supply Chain of Fruits in Khagrachari Hill District
The analysis of supply chains is intended to provide a systematic knowledge of the flow of the
goods and services from their origin (producer) to the final destination (consumer).The mango,
jackfruit and litchi market supply chains, depicted in Table 4.1, 4.2 and 4.3 were constructed
based on the data collected in one main town markets, three local markets and two aratder
markets in Chittagong. The result revealed that there were 9, 6 and 6 major supply chains for
mango, jackfruit and litchi respectively which obtained from traders’ survey. The estimated total
volume of supplied fruits was counted as 100 percent for estimating percentage of fruit supplied
of each growers and traders. Each followed their own supply chains, they are treated separately,
and the result obtained was the following.
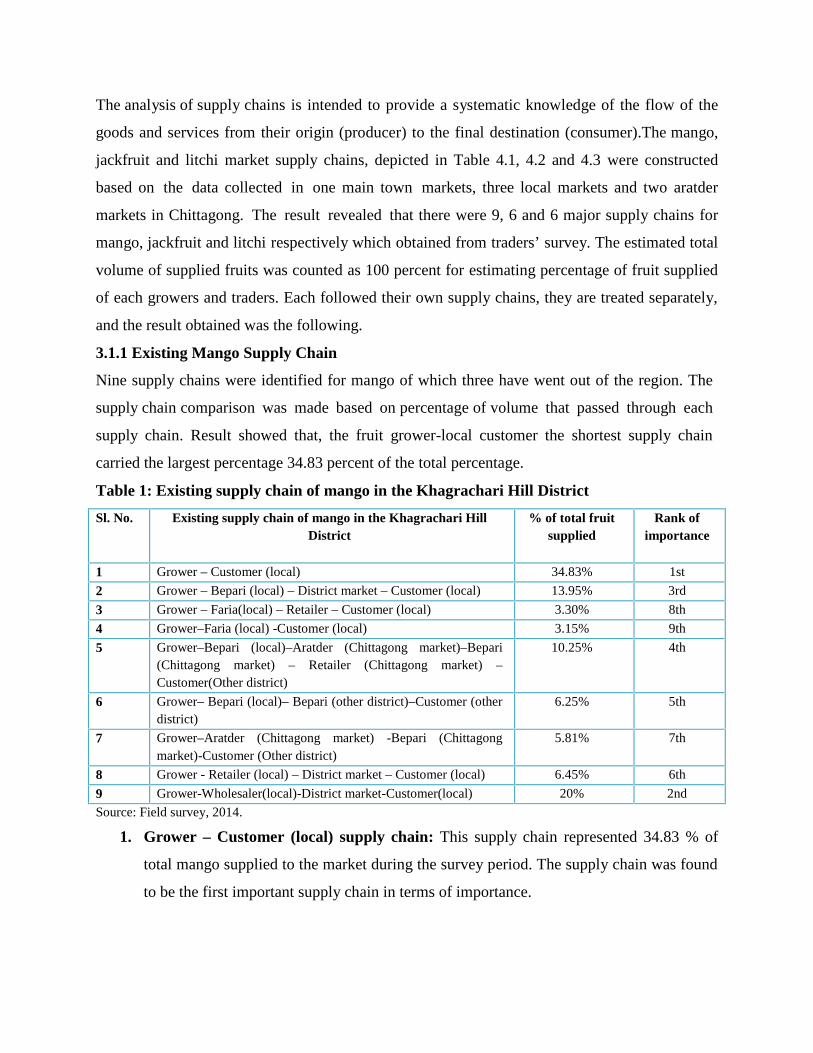
3.1.1 Existing Mango Supply Chain
Nine supply chains were identified for mango of which three have went out of the region. The
supply chain comparison was made based on percentage of volume that passed through each
supply chain. Result showed that, the fruit grower-local customer the shortest supply chain
carried the largest percentage 34.83 percent of the total percentage.
Table 1: Existing supply chain of mango in the Khagrachari Hill District
Sl. No. Existing supply chain of mango in the Khagrachari HillDistrict
% of total fruitsupplied
Rank ofimportance
1 Grower – Customer (local) 34.83% 1st
2 Grower – Bepari (local) – District market – Customer (local) 13.95% 3rd
3 Grower – Faria(local) – Retailer – Customer (local) 3.30% 8th
4 Grower–Faria (local) -Customer (local) 3.15% 9th
5 Grower–Bepari (local)–Aratder (Chittagong market)–Bepari(Chittagong market) – Retailer (Chittagong market) –Customer(Other district)
10.25% 4th
6 Grower– Bepari (local)– Bepari (other district)–Customer (otherdistrict)
6.25% 5th
7 Grower–Aratder (Chittagong market) -Bepari (Chittagongmarket)-Customer (Other district)
5.81% 7th
8 Grower - Retailer (local) – District market – Customer (local) 6.45% 6th
9 Grower-Wholesaler(local)-District market-Customer(local) 20% 2nd
Source: Field survey, 2014.
1. Grower – Customer (local) supply chain: This supply chain represented 34.83 % of
total mango supplied to the market during the survey period. The supply chain was found
to be the first important supply chain in terms of importance.
2. Grower – Bepari (local) – District market – Customer (local): According to survey,
this supply chain accounted for 13.95% of total mango supplied to the market. The
supply chain was found to be third most important mango supply chain in the study area.
3. Grower – Faria(local) – Retailer – Customer (local) : Represented 3.30% of total
mango supplied to market and found to be eight mango supply chain in the survey area.
4. Grower–Faria (local)-Customer (local): This supply chain represented 3.15% of total
mango supplied to the customer and found to be ninth most important mango supply
chain.
5. Grower–Bepari (local)–Aratder (Chittagong market)–Bepari (Chittagong market) –
Retailer (Chittagong market) – Customer(Other district): It accounted 10.25% of
total mango supplied to Chittagong market and placed fourth most important supply
chain in the district.
6. Grower–Bepari (local)–Bepari (other district)–Customer (other district): The supply
chain accounted 6.25 % percent of mango supplied and found fifth most important mango
supply chain.
7. Grower–Aratder (Chittagong market)-Bepari (Chittagong market)-Customer
(Other district): This supply chain placed seventh most important Supply chain of
mango and supplied 5.81% of total supplied.
8. Grower - Retailer (local) – District market – Customer (local): This supply chain
accounted 6.45% of total mango supply during the survey period and it found to be sixth
important mango supply chain in Khagrachari Hill District.
9. Grower-Wholesaler(local)-District market-Customer(local):This supply chain
represented 20% mango supplied in the Survey area and it placed second most important
mango supply chain in the study area.
3.1.2 Existing Jackfruit Supply Chain
Six supply chains were identified for jackfruit of which two have went out of the region. The
supply chain comparison was made based on percentage of volume that passed through each
supply chain. Accordingly, the fruit grower-local customer the shortest supply chain carried the
largest percentage 35.838 percent of the total percentage.

Table 2: Existing supply chain of jackfruit in the Khagrachari Hill District
Sl.No.
Existing supply chain of jackfruit in the Khagrachari HillDistrict
% oftotalfruit
supplied
Rank ofimportance
1 Grower – Customer (local) 35.88% 1st2 Grower – Bepari (local) – District market – Customer (local) 15% 4th3 Grower – Faria(local) – Retailer – Customer (local) 8.78% 5th4 Grower–Wholesaler (local)–Aratder (Other market)–Bepari
(Other market) – Retailer (Other district) – Customer(Otherdistrict)
6.50% 4th
5 Grower–Bepari (local)–Bepari (other district)– Retailer(Other district) -Customer (other district):
15.45% 3rd
6 Grower-Wholesaler(local)-Retailer (local)-District market-Customer(local):
18.48% 2nd
Source: Field survey, 2014.
1. Grower – Customer (local) supply chain: This supply chain represented 35.88 % of
total Jackfruit supplied to the market during the survey period. The supply chain was
found to be the first important supply chain in terms of importance.
2. Grower – Bepari (local) – District market – Customer (local): According to survey,
this supply chain accounted for 15% of total jackfruit supplied to the market. The supply
chain was found to be fourth most important jackfruit supply chain in the study area.
3. Grower – Faria(local) – Retailer – Customer (local) : Represented 8.78% of total
jackfruit supplied to market and found to be fifth jackfruit supply chain in the survey
area.
4. Grower–Wholesaler (local)–Aratder (Other market)–Bepari (Other market) –
Retailer (Other district) – Customer(Other district): It accounted 6.50% of total
jackfruit supplied to other district market and placed fourth most important supply chain
in the district.
5. Grower–Bepari (local)–Bepari (other district)– Retailer (Other district) -Customer
(other district): The supply chain accounted 15.45 % percent of jackfruit supplied and
found third most important jackfruit supply chain.

6. Grower-Wholesaler(local)-District market-Customer(local):This supply chain
represented 18.48% jackfruit supplied in the survey area and it placed second most
important jackfruit supply chain in the study area.
3.1.3 Existing Litchi Supply Chain
Six Supply chain were exhibited in the study areas where all supply chains remained in the
region except one. The supply chain comparison was made based on percentage of volume
that passed through each supply chain. According to the report, the fruit grower-local customer
the shortest supply chain carried the largest percentage 34.23 percent of the total percentage of
litchi supplied.
1. Grower – Customer (local) supply chain: This supply chain represented 34.23 % of
total litchi supplied to the market during the survey period. The supply chain was found
to be the first important supply chain in terms of importance.
2. Grower – Bepari (local) – District market – Customer (local): According to survey,
this supply chain accounted for 20% of total litchi supplied to the market. The supply
chain was found to be second most important litchi supply chain in the study area.
Table 3: Existing supply chain of litchi in the Khagrachari Hill District
Sl.No.
Existing supply chain of litchi in the Khagrachari HillDistrict
% oftotalfruit
supplied
Rank ofimportance
1 Grower – Customer (local) 34.23% 1st2 Grower – Bepari (local) – District market – Customer (local) 20% 2nd3 Grower – Faria(local) – District market – Customer (local) 7.21% 6th4 Grower–Wholesaler (local)- District market – Customer
(local):12.7% 3rd
5 Grower–Bepari (local)–Aratder (Other district market)–Retailer (Chittagong market) – Customer(Other district):
8.42% 5th
6 Grower-Wholesaler(local)-Retailer (local)-District market-Customer(local)
11.11% 4th
Source: Field survey,2014.
3. Grower – Faria(local) – District market – Customer (local) : Represented 7.21% of
total litchi supplied to market and found to be sixth most important litchi supply chain in
the survey area.

4. Grower–Wholesaler (local)- District market – Customer (local): This supply chain
represented 12.7% of total litchi supplied to the customer and found to be third most
important litchi supply chain.
5. Grower–Bepari (local)–Aratder (Other district market)– Retailer (Chittagong
market) – Customer(Other district): It accounted 8.42% of total litchi supplied to other
district market and placed fifth most important supply chain in the district.
6. Grower-Wholesaler (local)-Retailer (local)-District market-Customer(local):This
supply chain represented 11.11% mango supplied in the Survey area and it placed fourth
most important litchi supply chain in the study area.
3.2 UNIDO’s Approach to Value Chain Analysis of selected fruits (Mango, Jackfruit,
Litchi) in Khagrachari district
Selection and prioritization of value chains
The selection and prioritization of value chains to be analyzed are the first steps and they
certainly entail some of the most important decisions to be taken in any value chain
development. The selection of sectors, sub-sectors, products or commodities determines to a
large extent the prospects for a value chain’s impact on socio-economic indicators. (UNIDO,
2009)
Mapping the value chain
Mapping a value chain facility a clear understanding of the sequence of activities and the key
actors and relationships involved in the value chain. In Khagrachari district, for mapping a value
chain of fruits, there involve different actors like; financial institutions, Govt. institutions,
traders, growers and customers. In the whole chain there flows of fruits, knowledge, information.
These flows can be both tangible and in tangible, for instance, product, money, information and
services. Mango was processed into pickle and one packet (5gm) was sold at tk 10. From one kg
of raw mango at tk 30, 20 packets of pickle can be produced and processor gain tk 200. Value
was also added in some stages of marketing like grading, cleaning, packaging and transporting
(Figure 1).
Analyzing value chain technical capacities
This analysis is made in order to assess the value chain production system and tools; evaluate
their technical performance; and determine the principal technical actions that need to be

carried out to upgrade individual enterprises within the chain and to enhance their
competitiveness.
Three aspects of production are to be assessed:
1. Utilization of inputs (raw materials and supplies, labour, water and energy, production
materials, equipment etc.) In Khagrachari district fruit growers are purchase their input
materials from town market. Most of respondents reported that they purchased their own
inputs from town market.
2. The production system (technology and process). This is compared with systems used in
the sector by the main competitors in terms of the utilization of raw materials, labour, etc;
the capacity of the enterprise to provide finished products that meet the needs of
customers in terms of quality, delivery time and cost is also assessed. Respondents
reported that, they transfer technology to each other for improving their fruit production.
Fruit grower all time careful to maintain quality. They adopt new technology hot water
treatment to store fruits for some days without any preservative chemicals.
3. In the study it was observed that for mango marketing fruit growers was personally
involved in mango marketing. They personally carried fruits to market and sold it. Large
size mango growers rested small shop personally and sold their fruits. For jackfruit and
litchi marketing intermediaries were more involved in marketing then fruit growers.
Analyzing the value chain economic performance:
This analysis entails the measuring of economic factors (production cost, margins, added value
etc).In the study area, majority of respondents reported that from all of production cost fertilizer
cost, pesticide cost was so much high. Small fruit growers could not used fertilizer timely
because of lower capital. Also irrigation facilities were lower in the study area. But most of
respondent reported that the production of fruits was better than large decade, it’s because of
value chain performance. Most of fruit growers were practiced grading, packaging etc which
increased their profit.
Formulating an upgrading strategy for the selected value chain
At this stage, upgrading plans are drawn up which describe the interventions required in fruit
value chain, including policy and institutional recommendation. Specific interventions at growers

level was also happened in the study area. Fruit growers were more concerned about their good
quality of fruits. Most of respondents reported that, if Govt. took any initiatives for fruit
production in this area, the production of fruits also increased. Some action taken by local govt.
like formalin usages restriction, free distribution of sampling to fruit growers etc helped to
maintain the good quality of fruits in the study area.
Implementing the upgrading, monitoring and impact assessment
After formulating policy recommendation, all market actors need to implement those policies.
Govt. body should be monitoring the whole value chain process.
Figure 1: Mapping of mango value chain in Khagrachari Hill District
Product and material flow Information and knowledge flow
flow
Value addition stagesServiceprovider
Processing(Pickle) 42%
Transporting, 34%
Cleaning, 28%
Grading, 22%
Sell at garden, 17%
Fruits Production
Packaging, 33%
BADC
HARS
Horticultural center
Agricultural Extension
Financial services
Associations
Machinery and farmequipment suppliers
NGO’s
Input Supply EnterprisesSeeds, fertilizer, insecticide etc
Small scale fruitgrower
Bepari
Wholesaler(Khagrachari district)
Wholesaler (Otherdistrict)
Aratder (otherdistrict)
Retailer
Large scale fruitgrower
Customer
Marketintermediaries
Customer
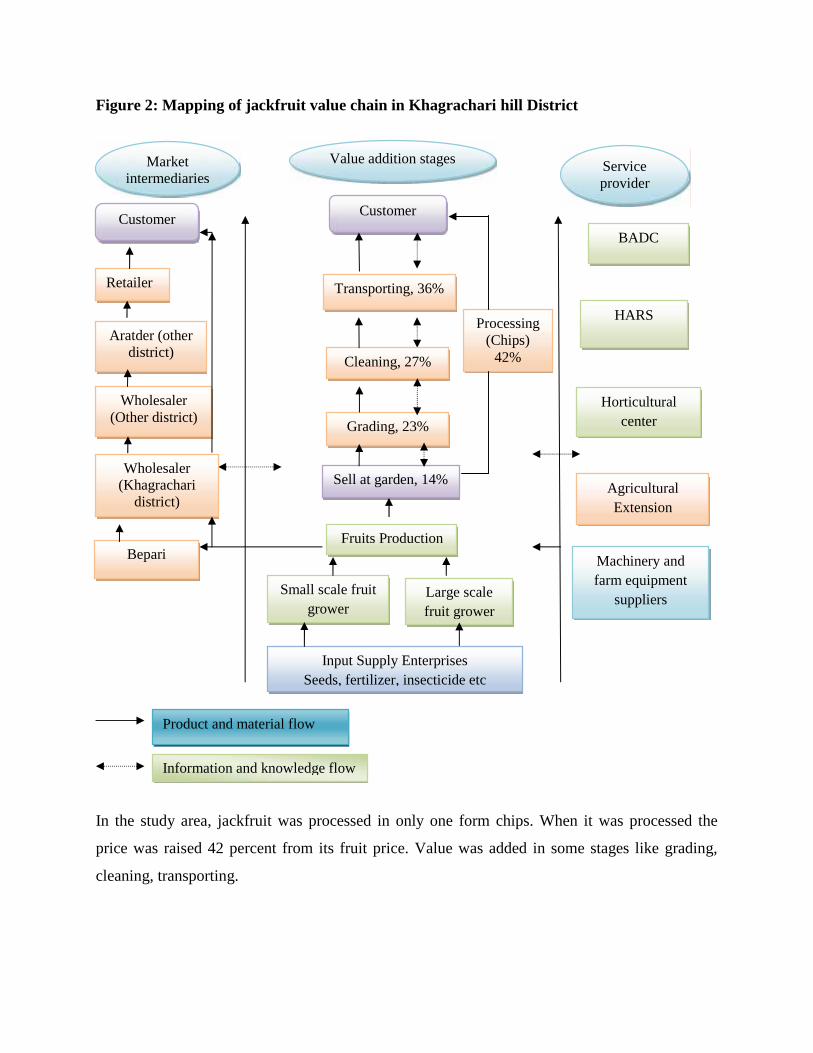
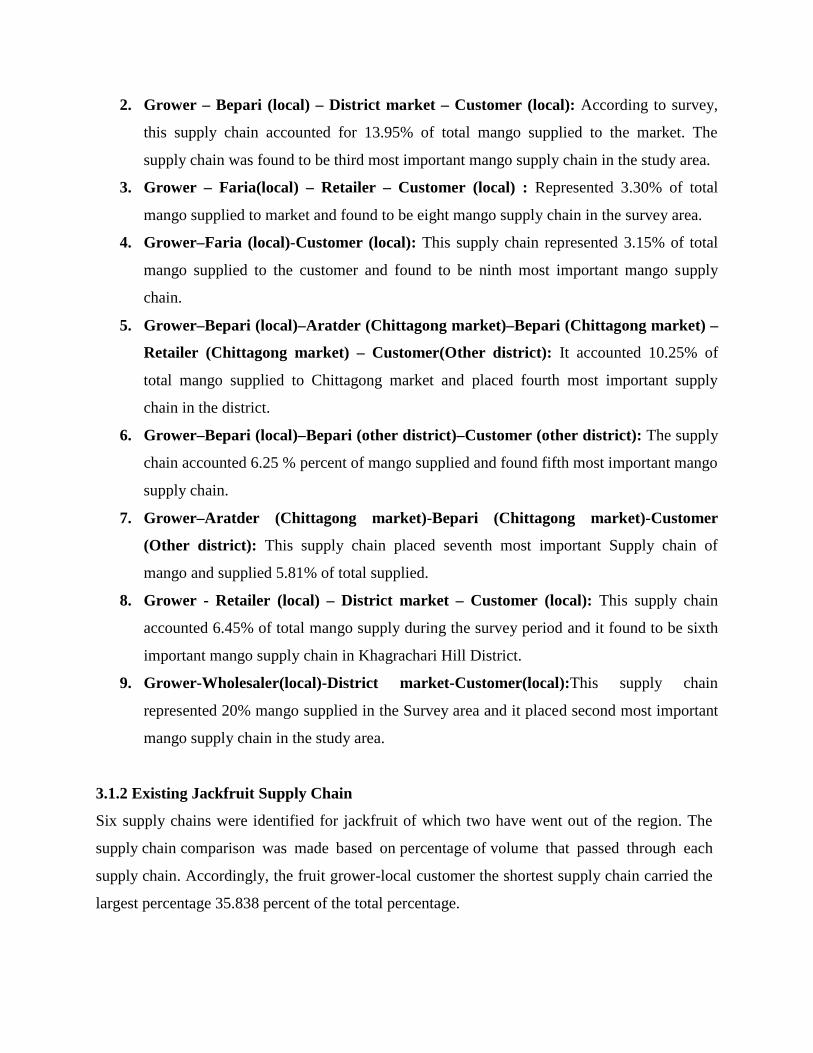
Figure 2: Mapping of jackfruit value chain in Khagrachari hill District
In the study area, jackfruit was processed in only one form chips. When it was processed the
price was raised 42 percent from its fruit price. Value was added in some stages like grading,
cleaning, transporting.
Small scale fruitgrower
Large scalefruit grower
Product and material flow
Information and knowledge flow
flow
Value addition stages Serviceprovider
Processing(Chips)
42%
Transporting, 36%
Cleaning, 27%
Grading, 23%
Sell at garden, 14%
Fruits Production
BADC
HARS
Horticulturalcenter
AgriculturalExtension
Machinery andfarm equipment
suppliers
Input Supply EnterprisesSeeds, fertilizer, insecticide etc
Bepari
Wholesaler(Khagrachari
district)
Wholesaler(Other district)
Aratder (otherdistrict)
Retailer
Customer
Marketintermediaries
etintermediaries
Customer

Figure 3: Mapping of litchi value chain in Khagrachari Hill Districts
In the study area, litchi was not processed in any form. Value was added in different stages’
when litchi was sold in garden the price was tk 3000 per piece and when it was graded the price
was increased 21 percent and after cleaning the price was increased 28 percent. Finally when
litchi was transported the price raised at tk 5000 per 1000 piece.
Small scale fruitgrower
Large scalefruit grower
Product and material flow
Information and knowledge flow
flow
Value addition stages Serviceprovider
Transporting, 34%
Cleaning, 28%
Grading, 21%
Sell at garden, 17%
Fruits Production
BADC
HARS
Horticulturalcenter
AgriculturalExtension
Machinery andfarm equipment
suppliers
Input Supply EnterprisesSeeds, fertilizer, insecticide etc
Bepari
Wholesaler(Khagrachari district)
Retailer
Customer
Marketintermediarie
s
Customer
Financialinstitutions

4. Constrains in Value Chain Development
The main advantages to commercial stakeholders from being part of an effective value chain are
reductions in the costs of doing business, increased bargaining power, and improved access to
technology, information and capital, leading to innovations in production and marketing
processes to gain higher value and provide higher quality to customers. ( AGRICO, 2004)
From a business perspective, ineffective value chain linkages causes for failure among
commercial stakeholders and service providers translates into ineffective value chains. Value
chains are organized linkages among groups of producers, traders, processors and service
providers who join together in order to improve productivity and add value to their activities. By
joining together, the actors in a value chain increase competitiveness and are able to maintain
competitiveness through innovation. The limitations of each single actor in the chain are
overcome by establishing synergies and governance rules aimed at producing higher value.
(AGRICO.2004)
In the study area some constrains were faces during value chain development of selected fruits.
Ranked these problems, the first problem was lack of training facilities and second was post
harvest loss. Lack of processing center was third problem. Also lack of credit facilities, less
institutional support etc was problems in value addition.
Table 4: Problems faced by the market actors for upgrading value chain of selected fruits
Sl. No. Constrains Rank1 Post harvest loss 22 Lack of communication 103 Storage problem 9
4 Lack of processing center 35 Lack of institutional support 56 Credit unavailability 47 Transport problem 68 Lack of rules and regulations 79 High license cost 1110 Packaging cost 811 Lack of training facilities 1Source: Field Survey 2014

5. Conclusions and Policy Implications
Given the large potential for fruit production in the country, their contribution to the total
GDP has been extremely low for many reasons. The most cited reasons include lack of market
oriented production which is too traditional and poorly supported by scientific
recommendations, excessive margin mainly due to inefficient and costly transport, absence of
fruit market information, inadequate government interventions and absence of market
regulations and legislations and its marketing activity is principally attributed to poor actors
skill. As a result, fruit marketing needs due attention in any on-going or future fruit
development plan.
Although comparative rewards such as: suitable agro-ecology, proximity to national market
and cheap provision of labor are opportunities, but declining prices, occurrence of deadly
fungal disease , poor market integration, absence of improved technologies and provision of
extension packages are major factors that hindered production-marketing task of mango,
jackfruit and litchi. With existing prominent organic production the product is not yet certified
in the study area. Constraints hindering the development of mango, jackfruit and litchi are
found in all the stages of the chain. At the farm-level, lack of quality sapling has compelled
fruit growers to use inferior and low yielding materials. Storage facilities and absence of
collective bargaining power has also forced individual fruit growers to accept unfavorable deals.
Therefore, a number of actions need to be undertaken in order to promote the development of
mango, jackfruit and litchi value chain. This particularly includes, capacity building,
technological applications, improved extension and plant breeding activities. Infrastructural
development is also a key to support the sub-sector. In this arena, emphasis should be given
to improved storage and transportation system and offering credit and other services to
improve effective production and marketing of the crops.
6. Recommendations
Provide credit facilities: Govt. may provide credit facilities to market actors and processors to
encourage in developing value chain of fruits. This initiative can help to provide job
opportunities to people as well as to grow entrepreneurship in this area.

Technology dissemination: Both Govt. and NGO’s can help to value chain development by
disseminate technical information for improvement of fruits production and marketing in this
area.
Strengthening research on marketing: Continuous research is crucial to identify mitigate
constrains in value chain development. It can also helps in identifying the potential entrepreneurs
and processors who was already involved in this profession. Capacity strengthening in terms
research on postharvest management and marketing of the important research organizations
including universities (BAU, SAU and BSMRAU) and research organizations (BARI and
BINA) is needed.
Training facilities: Different Govt. and NGO’s can provide training facilities to both market
actors and processors including harvesting, grading, sorting, packaging, transportation, storage
(conventional and modern), processing (small and large-scale) and nutrition is required.
All the market actors in the value chain should be given adequate training.
Transfer of technology: Development of appropriate technology by experts and conduction
of training by appropriate trainers on different aspects of postharvest management
Bangladesh Agricultural University may play a leading role in collaboration with BARC, DAE,
BARI and BSTI.
Introducing affordable packaging system: Packaging sector for perishables has not been
developed in the study area. For long-distance transportation, still voluminous package made
of bamboo baskets and gunny sacks are predominantly used, which result in high spoilage
due to impact, vibration and heat generation. Recently, mango intermediaries adopted plastic
crates in transportation which has created positive impacts in minimizing loss and maintain
quality.
References
AGRICO, 2004. Agribusiness development project, Bangladesh. Final report, volume 1, mainreport, ADB TA. No. 4139- BAN.
BBS. 2011. Bangladesh Bureau of Statistics. Statistics Division, Ministry of Planning,Government of the People’s Republic of Bangladesh.
World Bank. 2005. Bangladesh growth and export competitiveness. Report 31394-BD.,Washington D.C.