peptide monolayers: an electrochemical study
TRANSCRIPT

PEPTIDE MONOLAYERS: AN ELECTROCHEMICAL STUDY
A Thesis Submitted to the College of
Graduate Studies and Research
In Partial Fulfillment of the Requirements
For the Degree of Doctor of Philosophy
In the Department of Chemistry
University of Saskatchewan
Saskatoon
By
GRZEGORZ ARTUR ORLOWSKI
© Copyright Grzegorz Artur Orlowski, August, 2007. All rights reserved.

PERMISSION TO USE
In presenting this thesis in partial fulfilment of the requirements for a Postgraduate
degree from the University of Saskatchewan, I agree that the Libraries of this University
may make it freely available for inspection. I further agree that permission for copying
of this thesis in any manner, in whole or in part, for scholarly purposes may be granted
by the professor or professors who supervised my thesis work or, in their absence, by
the Head of the Department or the Dean of the College in which my thesis work was
done. It is understood that any copying or publication or use of this thesis or parts
thereof for financial gain shall not be allowed without my written permission. It is also
understood that due recognition shall be given to me and to the University of
Saskatchewan in any scholarly use which may be made of any material in my thesis.
Requests for permission to copy or to make other use of material in this thesis in
whole or part should be addressed to:
The Head
Department of Chemistry
University of Saskatchewan
Saskatoon, Saskatchewan
S7N 5C9
i

ii
ABSTRACT
Understanding electron-transfer (ET) processes in proteins is of fundamental
importance. In a series of photophysical studies of well-behaved peptide model
systems, it has become evident that the ET through peptide spacers is greatly influenced
by the separation between the acceptor (A) and the donor (D), the nature of the peptide
backbone, the amino acid sequence, and the resulting flexibility of the peptide
conjugates. In particular, it was suggested in the literature that the presence of H-
bonding will increase the rate of ET, and there is experimental evidence, mostly in
proteins, to suggest that H-bonding indeed increases the rate of ET.
My aim was to develop a potential-assisted deposition method for ferrocene peptide
disulfides onto gold surfaces and investigate the electrochemical properties of these
films. We made use of two classes of Fc-peptides: acylic ferrocenoyl (Fc)-peptide
disulfides and cyclo-1,1’-Fc-peptide disulfides, allowing the preparation of tightly
packed films of cyclic and acylic Fc-peptides on gold surfaces within 30 minutes. This
is a significant benefit compared to the conventional “soaking” method of self-assembly
requiring several days for the assembly of well-packed films. Such films exhibited
considerably improved stability. This electrodeposition method should find wide-spread
applications for the formation of tightly-packed films from disulfides. Our studies
allowed a direct comparison of the electron transfer kinetics of cyclic and acyclic Fc-
peptide disulfide systems. Our results showed faster ET kinetics for films prepared from
cyclic Fc-peptide conjugates compared to the acyclic systems, presumably as a result of

iii
the enhanced rigidity of the Fc-peptide conjugates on the surface and/or an increase of
the number of “conductive peptide wires” to the surface. Following the idea of peptide
dynamics as a major contributor to the observed electron transfer rate in peptides and
peptide conjugates, variable temperature electrochemical studies of Fc-peptide films
were performed. An estimation of the reorganization energy associated with
ferrocene/ferrocenium (Fc/Fc+) redox process allowed us to probe the role of peptide
dynamics. Three counter-ions were tested, exhibiting different strengths of association
with the Fc+ group (BF4- < ClO4
- < PF6-) and the reorganization energies were evaluated
in each case. The highest reorganization energy was obtained for the weakly interacting
anion BF4-. Weakly interacting anions also showed significant broadness in the redox
peaks and emergence of the second oxidation peak which is attributed to phase
separation of the ferrocene group. Ferrocene agglomeration was not observed for any of
the cyclic Fc-peptide conjugates but occurred for some of the acyclic systems. In
particular, for acyclic Val and Leu containing Fc-peptide conjugates agglomeration
were observed and was presumably caused by lateral interactions between the
hydrophobic side-groups of the peptides. Further experiments involving the interaction
of Fc-peptide films with alkali metal ions gave additional evidence that electron transfer
is influenced significantly by peptide dynamics.

iv
ACKNOWLEDGMENTS
I have worked with a number of great people whose contribution in various ways needs
to be acknowledged. It is a pleasure to express my gratitude to all of them in this
humble recognition.
In the first place, I would like to express my gratitude to my supervisor Bernie Kraatz
for his guidance, supervision, and advice throughout my research adventure. Freedom to
play, explore and experiment that he granted, allowed me to developed strong passion
for the research and enormously enriched my experience as a student and scientist. I
will benefit, in years to come, from this acquaintance.
I would like to thank the members of my advisory committee:
Professor A. Baranski for electrochemical instrumentation and electrochemical advice,
Professor David Sanders and Professor Alex Moewes for their advice during the
program.
I am also grateful to past and present members of Kraatz group: Somenath, Amir, Anas,
Song, Demian, Khan, Yitao, Khaled, Mark, Marek Jr, Thara, Kagan, Regan, Armando
and Francis. It was a pleasure to work with you guys !!!
A special gratitude will go to Professor Todd Sutherland for extremely valuable
discussions about chemistry, but not only.
I am also grateful to Alex Boika for interesting discussions about HOT electrodes.
I would also like to acknowledge the people that I was collaborating with:
Gareth Nealon – Gaz, soon we all going to love Australian Possums and beer, believe
me. Maybe you can build a “Sar-cage” to keep one in.
Jorg Schachner, Clinton Lund & Professor Jens Muller – electrochemistry of [1.1]
ferrocenophanes was very entertaining. (I deliberately ate all “umlauts”).
I also would like to acknowledge Department of Chemistry and University of
Saskatchewan for place to work and funding.

v
DEDICATION
I would like to dedicate this work for my dear wife Izabella
For her ongoing Support and Love
vi
TABLE OF CONTENTS page
ABSTRACT…………………..……….………………………….….….……..ii
ACKNOWLEDGMENTS….……….…………………………….……….….iv
LIST OF TABLES......................................................................................... viii
LIST OF ABBREVIATIONS ....................................................................... xiii
1 INTRODUCTION ................................................................................. 1
1.1 Immobilization Methods ............................................................................1 1.2 Electron Transfer Theory ...........................................................................5 1.3 Electron Transfer in Biomolecules.............................................................9 1.4 Ferrocene-containing Monolayers and Peptide Films ..............................15 1.5 Ferrocene-peptide Films...........................................................................19 1.6 Research Objectives .................................................................................24 1.7 References ................................................................................................27
2 ELECTRODEPOSITION OF FERROCENOYL PEPTIDE DISULFIDES ............................................................................................................... 34
2.1 Connecting Text .......................................................................................34 2.2 Introduction and Discussion .....................................................................36 2.3 Notes and References ...............................................................................44 2.4 Supplementary Data .................................................................................46
3 CAGES ON SURFACES: THIOL FUNCTIONALISATION OF Co(III) SARCOPHAGINE COMPLEXES ............................................................... 53
3.1 Connecting Text .......................................................................................54 3.2 Introduction ..............................................................................................55 3.3 Electrodeposition......................................................................................58 3.4 Self-assembly ...........................................................................................59 3.5 Solution Electrochemistry ........................................................................60 3.6 Surface Electrochemistry..........................................................................62 3.7 Conclusions ..............................................................................................70 3.8 References ................................................................................................71
4 EVALUATION OF ELECTRON TRANSFER RATES IN PEPTIDE FILMS: SIMPLIFIED CALCULATION AND THEORY ........................ 73
4.1 Connecting Text .......................................................................................73 4.2 Introduction ..............................................................................................75 4.3 Results and Discussion .............................................................................76 4.4 Evaluation of the Electron Transfer Kinetics ...........................................78 4.5 Summary...................................................................................................83 4.6 References ................................................................................................84

vii
4.7 Supplementary Data .................................................................................86 5 REORGANIZATION ENERGIES OF FERROCENE-PEPTIDE MONOLAYERS ............................................................................................. 87
5.1 Connecting Text .......................................................................................87 5.2 Introduction ..............................................................................................88 5.3 Experimental.............................................................................................92 5.4 Results and Disscussion ...........................................................................94 5.5 Summary.................................................................................................103 5.6 References ..............................................................................................105
6 THE EFFECT OF ALKALI METAL IONS ON THE ELECTROCHEMICAL BEHAVIOR OF FERROCENE-PEPTIDE CONJUGATES IMMOBILIZED ON GOLD SURFACES ..................... 107
6.1 Connecting Text .....................................................................................107 6.2 Introduction ............................................................................................108 6.3 Experimental...........................................................................................112 6.4 Results and Discussion ...........................................................................113 6.5 Summary.................................................................................................121 6.6 References ..............................................................................................122
7 SUMMARY AND CONCLUSIONS ................................................ 124
7.1 Electrodeposition....................................................................................124 7.2 Electron Transfer and Peptide Films ......................................................126 7.3 References ..............................................................................................133

viii
LIST OF TABLES
Table page
Table 2.1 Summary of electrochemical parameters analyzed by CV and CA. Value in parentheses is the standard deviations from 5 electrode measurements..............40
Table 2S.1 Electrochemical parameters calculated from CV experiments using the electrochemical deposition and incubation methods. ..........................................46
Table 2S.2 Electrochemical parameters calculated from CV for the incubation method. This is complementary data to Table 2.1 of the paper.........................................46
Table 2S.3 Chronoamperometric results from monolayers that were electrodeposited. ......48
Table 2S.4 Root-Mean-Square (RMS) roughness of 3 AFM images of Figure 2S.4...........50
Table 3.1 List of synthesized compounds.............................................................................58
Table 3.2 Solution electrochemical data for compounds 4-10. All E1/2 values are referenced to the Ag/AgCl reference electrode. Scan Rate 100 mVs-1. Errors are the standard deviations from five measurements. .........................................62
Table 4.1 Summary of kET values obtained by cyclic voltammetry (CV) at 1000 Vs-1 and chronoamperometry (CA) and of the Fc-peptide surface concentrations.....79
Table 4.2 Parameters of the films obtained from cyclic voltammetry. Slopes are given for 293K...............................................................................................................82
Table 5.1 Comparison of formal potentials, reorganization energies and kET`s of ferrocene peptide conjugates 1 - 11.....................................................................91
Table 6.1 Formal potentials and peak separation values for a series of Fc-peptide films (data presented for CV collected at 100 Vs-1) .....................................................115
Table 6.2 Surface concentrations of compounds 1 – 11 .......................................................116
Table 6.3 Influence of alkaline cations on basic electrochemical parameters of the Fc-peptide film. kET values were determined at a scan rate of 1000 Vs-1 according to the procedure described elsewhere31. .............................................120

ix
LIST OF FIGURES Figure page Figure 1.1 Schematic representation of self-assembly steps of alkenethiols on the gold
surface.60 During the first stage, a few second after immersion, alkenethiols are horizontally oriented on the surface. During the second, the lengthiest step, alkenethiols are self-organizing and attaining vertical orientation on the surface..................................................................................................................3
Figure 1.2 Typical electrochemical response in a form of simple cyclic voltammogram of a surface immobilized ferrocene conjugate.....................................................6
Figure 1.3 DNA charge transfer through “G+. hole” hopping ..............................................10
Figure 1.4 Model systems of the oligoprolines used by Isied1, 45, 68, 69 Giese70 and Meyer71 their ET research. Angles Ψ and Ф are used to define secondary structure of the peptide chain...............................................................................11
Figure 1.5. Various secondary motifs used in the ET studies: α- helical structure, 310 – helical structure, polyproline I and polyproline II. Each of the structures has different Ψ and Φ angles resulting in diverse H-bonding patterns......................13
Figure 1.6 The orientation of phenylene elements of the bridge has tremendous effect on the ET rate78....................................................................................................16
Figure 1.7 π-Electron conjugated systems used in the study by Sikes82, Smalley47 and Fan81 ....................................................................................................................17
Figure 1.8 (Right) Electron transfer rate for buried ferrocene is two orders of magnitude slower then for the exposed one (left).79..............................................................19
Figure 1.9 Major mechanism of ET occurring in surface bound Fc-peptide conjugates: hopping37, peptide mobility and tunneling48........................................................23
Figure 2.1 a) Crystal structure of acyclic [Fc-Gly-CSA]2 (2-a) and cyclic 1,1’-Fc[Gly-CSA]2 (2-c) b) Schematic representation of the resulting Fc-peptide surfaces. c) Cyclic voltammograms of 2-c (solid line) and 2-a (broken line) films on Au microelectrodes (d = 25 µm). 2.0 M NaClO4 supporting electrolyte, scan rate 1000 Vs-1, Pt mesh auxiliary and Ag/AgCl (3.5 M KCl) reference electrode. .............................................................................................................38
Figure 2.2 DPVs of a) cyclo and b) acyclic, FcGly derivatives. Integrated peak currents for cyclo- and acyclic-derivatives are in a 1:2 and 1:1 ratio, respectively, indicating both sulfur atoms of the cyclo derivatives are bound to the Au surface. The hatched lines in the models represent H-bonding patterns found in the crystal structure..........................................................................................42

x
Figure 2S.1 A representative semilog chronoamperometric response from a 400 mV potential jump on an electrodeposited cyclic 1,1’-Fc[GlyCSA]2. 12.5 µm radius Au electrode, 2M NaClO4 supporting electrolyte and a Ag/AgCl/(3.5 M KCl) reference electrode. The RC of 5.7 µs (dotted line) is the time constant of the double layer charging and the linear region (dashed line) is the electron transfer rate at 400 mV overpotential. The inset shows the untransformed data. .............................................................................................47
Figure 2S.2 Linear response of anodic and cathodic peak currents for 3-c and 3-a derivatives, indicating successful surface immobilization. .................................48
Figure 2S.3 Linear response of anodic peak currents for 3-c using both the incubation and electrodeposition methods, indicating successful surface immobilization...49
Figure 2S.4 a) AFM image of Au on Si(100); b) AFM image of Au on Si(100) after 400 cycles (0 V to 1.4 V vs. Ag/AgCl (3.5 M KCl)) in 0.5 M H2SO4; c) AFM image of Au on Si(100) after electrodeposition of cyclo-1,1’-Fc[AlaCSA]2........................................................................................................49
Figure 2S.5 Multiple CVs of cyclo-1,1’-Fc[AlaCSA]2 (3-c) taken every 0.05 seconds for 60 seconds with a 12.5 µm radius Au-modified electrode, 2 M NaClO4 supporting electrolyte and a Ag/AgCl/(3.5 M KCl) reference electrode. ...........50
Figure 2S.6 XPS results for sulfur sp2 for a) electrodeposited, b) incubated compound 1-c. Sulfur population in both cases is virtually identical. The similar results were obtained for other cyclic compounds..........................................................51
Figure 3.1 Trivial nomenclature used throughout this work ................................................55
Chart 3.1 General structures of the compounds prepared showing trivial nomenclature used......................................................................................................................57
Figure 3.2 (a) Solution CVs of compounds 4 and 7 with GC working electrode at pH 7.3, versus Ag/AgCl (100 mVs-1, 0.1M NaClO4) (b) DPVs of the reduction processes (scan rate 20 mVs-1, pulse amplitude 50 mV). ....................................61
Figure 3.3 (a): Plot of repeated CVs versus time for compound 4 immediately after ED and washing (10 Vs-1) (Note: Potential axis reversed for clarity in (a) and (c)); (b): (a) viewed along the current/potential plane; (c): same as (a) but for SA; (d): (c) viewed along the current/potential plane.........................................65
Figure 3.4 Diagram illustrating the possible reorganization process leading to the observed increase in peak current and concomitant sharpening of peaks ...........65
Figure 3.5 (a): CV’s obtained at 50, 100, 150 and 200 Vs-1 for an EDM of compound 4; (b): Plot of peak current versus scan rate for monolayer in (a); (c): As in (a) but for SAM; (d): As in (b) but for the SAM.................................................66

xi
Figure 3.6 Repeated electrochemical cycling for film of compound 4 (100 Vs-1). ..............67
Figure 3.7 (a): XPS of Co 2p3 region; (b): S 2p region ........................................................69
Scheme 4.1 Schematic view of films prepared of [Fc-Gly-CSA]2 and [Fc-Val-CSA]2 on the gold surface....................................................................................................76
Figure 4.2 Left: CV for films of [Fc-Gly-CSA]2 (_____) and [Fc-Val-CSA]2 (……) using a gold microelectrode 25 µm radius, scan rate 1000Vs-1, Ag/AgCl, Pt-mesh counter. Right: iP vs scan rate for [Fc-Gly-CSA]2 (■) and [Fc-Val-CSA]2 (∆). .......................................................................................................................77
Figure 4.3 ln kET ploted vs overpotential η according to Equation 4 at 293K. The slope for positive and negative η’s is described by the symmetry factor α. [Fc-Gly-CSA]2 (■) and [Fc-Val-CSA]2 (∆). kET calculated from CV at 1000 V/s ...........79
Figure 4.4 Left: variable temperature Tafel plot for [Fc-Val-CSA]2 (Temperature from top to bottom: 323K, 313K, 293K, 273K, 263K). Right: Arhenius plot for both monolayers ([Fc-Gly-CSA]2 (■) and [Fc-Val-CSA]2 (∆)) where kET values were obtained from CV at 1000Vs-1.........................................................81
Figure 4S.1 Variable scan rate graph for [Fc-Gly-CSA]2 (2000, 1000, 250, 100 Vs-1) .......86
Figure 5.1 Acyclic and cyclic ferrocene-peptide conjugates used in this study..................91
Figure 5.2 A) Typical cyclic voltammogram of gold microelectrode in 0.5 M H2SO4 obtained during pretreatment step (10 Vs-1 potential versus Pt wire). B) Typical amperometric i-t curve obtained during electrodeposition process. Potential was set to -1.5 V vs. Tungsten wire .....................................................93
Figure 5.3 (―) 313 K, (―) 303 K, (―) 293 K, (―) 283 K, (―) 273 K, A) Variable temperature cyclic voltammetry of surface bound Fc[Ileu-Ileu-CSA]2, 0.1 M NaClO4, 1000 Vs-1B) Tafel plot of lnkET vs η for (11) Fc[Ileu-Ileu-CSA]2 Electron transfer rate dependency on the temperature, calculated at 1000 Vs-
1. C) Arhenius plot for monolayer of Fc[Ileu-Ileu-CSA]2 (11) (■) where kET values were obtained from CV at 1000 Vs-1. D) Arhenius plot for monolayers [Fc-Ala-CSA]2 (2) (■) and Fc[Ala-CSA]2 (6) (■) where kET values were obtained from CV at 1000 Vs-1........................................................95
Figure 5.4 Graphical visualization of the differences in the access areas of the counter ion to ferrocenium. Comparison of [Fc-Ala-CSA]2 (2) with Fc[Gly-Val-CSA]2 (9) ferrocene- peptide films......................................................................99
Figure 5.5 Representation of potential dynamics of the Fc-peptide conjugates on a gold surface. Left: very high mobility and freedom to rotate for monosubstituted Fc-peptide conjguates. Right: limited flexibility reducing the ability to change orientation as a solvent/counter ions approach. ......................................100

xii
Figure 5.6 AC Voltammetry of a) Fc[Ala-CSA]2 (6) b) [Fc-Ala-CSA]2 (2) The capacity change measured at 0 mV and 950 mV for a) ∆C = 0.7 µF/cm2 for b) 5.5 µF/cm2 .......................................................................................................101
Figure 5.7 Cyclic voltammograms of (----) Fc[Ala-CSA]2 (6) and (―) [Fc-Ala-CSA]2 (2). Scan rate 1000 Vs-1 in 0.1 M NaBF4 as a supporting electrolyte. Compound 2 shows significant phase separation (double oxidation peak) and broadened reduction peak....................................................................................101
Figure 5.8 Effect of the counter-ion on the agglomeration of the ferrocene. .......................102
Figure 6.1 Nomenclature and chemical drawings of the acyclic Fc-peptide compounds ....110
Figure 6.2 Nomenclature and chemical drawings of the cyclic Fc-peptide compounds ......111
Figure 6.3 Fc-peptide film behavior in the presence of alkaline metals. CV of 1 [Fc-Gly-CSA]2 and 5 Fc[Gly-CSA]2 in 25 mM XClO4 / 50 mM HClO4 (―) X = Li+ ; (----) X = Rb+..............................................................................................114
Figure 6.4 Right: Cyclic voltammetry recorded at 100 Vs-1 for compound 3 in the presence of Li+ (), Na+ (), and Cs+ () perchlorate. Left: comparison of cyclic voltammograms recorded for compounds 3 and 7 at 100 Vs-1 in Cs+ containing solutions.............................................................................................118
Figure 6.5 Proposed organization of [Fc-Val-CSA]2 (3) and of [Fc-Leu-CSA]2 (4) on the surface caused by cations and counter ion. Hydrophobic “tail” from Val or Leu is oriented toward other hydrophobic groups creating micelle-like structures bringing ferrocene groups close together, which is likely to coexist with non-agglomerated state. After oxidation, ferrocennium groups repel each other creating purely non-agglomerated film..............................................119
Figure 7.1 Comparison of the incubation and electrodeposition methods showing the different conditions and time requirements .........................................................124

xiii
LIST OF ABBREVIATIONS
A ....................................................................................................... Acceptor ACV ..................................................................Alternating current voltammetry AFM ............................................................................. Atomic force microscopy Aib ................................................................................α-Aminoisobutyric acid Ala ......................................................................................................... Alanine B .................................................................................Bridge/linking element CA .....................................................................................Chronoamperometry CV ..................................................Cyclic voltammogram/cyclic voltammetry CSA .....................................................................................................Cystamine d ................................................................................................Distance in Ǻ D ............................................................................................................Donor DPV .................................................................... Differential pulse voltammetry e ..................................................................... elementary charge 1.6*10-19 C E ........................................................................................................Potential E0 .........................................................................................Standard potential E0’ ........................................................................................... Formal potential Ea ..................................................................................... Energy of activation Ep ............................................................................................... Peak potential ∆Ep ................................................................... Difference in the peak potential ∆EDB .........................................................Energy gap between donor and bridge Efwhm ...................................................... Full width of the peak at half maximum ED ..........................................................................................Electrodeposition ET ........................................................................................... Electron transfer ESI ..................................................................... Electronic supplementary data EtOH ......................................................................................................... Ethanol EQCM ...............................................Electrochemical quartz crystal microbalance F .....................................................................Faraday constant 96485 C/mol Fc ......................................................................................................Ferrocene Fc+ ................................................................................................. Ferrocenium ∆G ......................................................................................... Gibbs free energy ∆G# ..............................................................................Free energy of activation G ........................................................................................................ Guanine GC ............................................................................... Glassy carbon electrode Gly ......................................................................................................... Glycine HAD ...................................... Electronic coupling between Donor and Acceptor H0 ...........................................................................Electronic coupling matrix ILIT ..................................................... Indirect laser induced temperature jump kET .................................................................................... Electron transfer rate kf ...................................................................... Forward electron transfer rate kb ....................................................................Backward electron transfer rate k0 ......................................................................Standard electron transfer rate kB .............................................................. Boltzmann constant 1.38*10-23 J/K

xiv
Leu .........................................................................................................Leucine i ..........................................................................................................Current Ile ..................................................................................................... Isoleucine j ..................................................................................Current density A/cm2 OPE ...........................................................................Oligophenyleneethynylene OPV ...............................................................................Oligophenylenevinylene Pro .......................................................................................................... Proline ν ................................................................................Scan rate usually in V/s V ...............................................................................................................Volt Val ........................................................................................................... Valine SA ............................................................................................... Self-assembly SAM ........................................................................... Self-assembled monolayer SCE ......................................................................... Saturated calomel electrode STM ................................................................... Scanning tunneling microscopy T ................................................................................................. Temperature THF ............................................................................................Tetrahydrofuran TRIS .............................................................. tris(hydroxymethyl)aminomethane Trp ................................................................................................... Tryptophan Tyr ........................................................................................................Tyrosine QCM .........................................................................Quartz crystal microbalance UHV ........................................................................................Ultra high vacuum XPS .............................................................. X-Ray photoelectron spectroscopy αLA ............................. Atomic orbital coefficient between bridge and acceptor αDL ..................................Atomic orbital coefficient between donor and bridge β .........................................................................................Attenuation factor Γ .................................................................... Surface concentration mol/cm2 λ ............................................................................ Reorganization parameter ћ ........................................................................Dirac constant1.054*10-34 Js

1
CHAPTER 1 1 INTRODUCTION
Ferrocene (Fc) terminated self-assembled monolayers are one of the most studied
redox-active assemblies on metal surfaces1-10. These films have been extensively used
as suitable ensembles of well-defined composition, structure and thickness. Fc-
terminated films have been often used as model systems to probe electrical double layer
properties and electron transfer. A self-assembled monolayer can be described as a
donor-bridge-acceptor system (D-B-A), which can be correlated to electrode-spacer-
redox couple (Au-B-Fc/Fc+). In this study, I decided to investigate the role of peptides
as a bridging element. Peptide-mediated electron transfer is of extreme importance in
many biological processes like photosynthesis, cellular respiration and metabolism. The
electron transfer in such systems can occur across various peptide chains, which
separate the donor from the acceptor. Folding and functions of some proteins have been
associated with electron transfer events. The secondary structure of peptides11-13 and
hydrogen bonding14-17 are also known to affect efficiency of the ET process.
1.1 Immobilization Methods
In the literature, we can find a large number of references describing the deposition of
sulphur-containing compounds on metal surfaces. Recently, thorough reviews were

2
presented by Whitesides18 and Gooding.19 Finklea20 and Ulman105 reviewed earlier
achievements in this field.
The concept of chemisorption of alkenes on the metal surface was first demonstrated for
dialkyl disulfides by Nuzzo21, even though current scientific reports are mainly
describing thiol compounds. The resulting chemisorbed thiolate anions have a high
value of activation energy of desorption estimated at approximately150 kJ/mol.22 In the
case of a gold surface immersed in a solution of an alkyl thiol, it is generally assumed
that a hydrogen atom is abstracted from a thiol molecule and the resulting radical
species undergoes precipitation on the surface, forming a covalent Au–S bond.
Chemical equation of the deposition of the alkene thiol on the gold surface can be
presented as104:
22/1)0()0( HAuAuSRAuHSR nn +•−−→+−− +− (1.1)
For disulfides deposition can be described as an oxidative addition of S-S bond to the
gold surface:
)0(2)0( nn AuAuSRAuRSSR •−−→+−−− +− (1.2)
Major methods that can be used for the deposition of thiols (RSH) and disulfides
(RSSR) can be summarized as follows:
Less popular method of deposition is the adsorption of thiols and disulfides from the gas
phase in UHV. However, this method suffers mainly from its limited application as

3
many compounds have low volatility and additional chemical modification is often
necessary.23, 24
Adsorption from solution, where a metal substrate is immersed in diluted (1-10 mM)
ethanolic solution of thiol or disulfide, is more versatile.24 The incubation is usually
carried out for a period ranging from minutes for simple alkenethiols, up to a few days
in the case of more complicated disulfide compounds. A dense coverage of the
adsorbate is obtained just after tens of seconds but second step called organization is
much slower (Figure 1.1).
A number of factors can affect the structure of the SAM on the surface prepared this
way like concentration, solvent, temperature, purity of the adsorbate and cleanliness of
Figure 1.1 Schematic representation of self-assembly steps of alkenethiols on the gold surface.60 During the first stage, a few second after immersion, alkenethiols are horizontally oriented on the surface. During the second, the lengthiest step, alkenethiols are self-organizing and attaining vertical orientation on the surface.

4
the substrate, just to mention the most important ones. The formation of the film at
elevated temperatures (above room temperature) can improve quality of the
monolayer.25, 26 Concentration and deposition time are inversely related, the lower the
concentration, the longer immersion time is necessary. There is extensive evidence that
monolayers formed from disulfide and thiols actually result in films that have very
similar structures. Nevertheless disulfides conjugates are less often used mainly due to
their lower solubility.18, 27
In the literature, we can also find minor number of examples where electrochemical
deposition of thiols was used to improve the quality of the deposited film and reduce the
time of deposition. Such method was reported by Porter and coworkers25 for the first
time, but a qualitative description of the formed monolayers was not provided.
Stratman28 showed that a small positive potential can increase the speed of thiol
adsorption to the gold surface. Ron and Rubinstein29 reported rapid deposition of
alkanelthiols with assistance of a highly positive potential +1.5 V vs. SCE. High
positive potential of 1.2 V vs. Ag/AgNO3 was also applied by Ferguson30 for the
deposition of alkanelthiols from THF. In a very recent contribution, Lennox and Ma31
reported very rapid deposition (ca. 15 minutes) of well organized alkanethiol
monolayers when modest (+200-600 mV vs Ag/AgCl) positive potential was applied.
Similar results were reported by Vericat.32,33
Interestingly there is very little known about electrochemically enhanced deposition of
disulfide compounds on the metal surface even though scientific investigation on thiol
chemisorption started from disulfide compounds.21 In the literature electrodeposition of

5
chemically modified disulfides conjugates is practically absent. In my research I
decided to work with disulfide compounds mainly due to availability of cystamine
(H2N-(CH2)2-S-S-(CH2)2-NH2) and simplicity of the synthetic procedures that can be
used for making new bio-conjugate compounds.
1.2 Electron Transfer Theory
A comprehensive understanding of electron transfer (ET) processes is vital for future
development in many fields of technology and science, ranging from molecular
electronics to gaining detailed understanding of some biological enzymes. Over the past
few decades, the development of the systems that helped to probe ET has been
considerably expanded. In particular electrochemical studies on of redox-active films
have contributed much to understanding of the parameters governing interfacial ET.
Many different bridging elements have been proposed for use in investigations on the
nature of electron transfer process but only few so far had biological relevance. Electron
transfer rate can be feasibly obtained by application of various physicochemical
methods ranging from electrochemical methods chronoamperometry (CA), cyclic
voltammetry (CV),9, 34-39 alternating current voltammetry (ACV),35, 40, 41 electrochemical
impedance spectroscopy (EIS)42, 43 through indirect laser induced temperature jump
(ILIT)44 to many photo-physical approaches.45, 46
Chidsay47, 48 was the first one to propose application of Ferrocene-modified monolayers
to assess ET rates through alkane chain.

6
The reduction and oxidation of an electroactive group at a gold electrode can be written:
redeoxb
f
k
k
⎯⎯←⎯→⎯
+ − (1.3)
where ox is the oxidized form of ferrocene (ferrocenium/ Fc+) and red is the reduced
form (ferrocene/Fc). The reaction free energy ∆G0 can be described as:
- ( )00 EEeG −=∆ (1.4)
where e is electron charge, E is the potential of the electrode and E0 is the standard
potential. When E = E0, the forward rate constant kf is equal to the backward rate
constant kb. The net reaction rate constant is expected to increase with decrease of the
reaction free energy. By changing of the potential, kinetics and free energy of the
reaction can be easily controlled.
Figure 1.2 Typical electrochemical response in a form of simple cyclic voltammogram of a surface immobilized ferrocene conjugate.

7
In Figure 1.2, the electrode potential is initially scanned in positive direction through E0
and the oxidation of the ferrocene to ferrocenium is observed. Then potential is scanned
in the negative direction where reduction of the ferrocenium to ferrocene can occur. In
the ideal case for very slow scan rate peak separation should be equal to zero.
According to the Laviron49 formalism, the peak separation is directly related to the
electron transfer rate. However, this approach has many drawbacks (huge sensitivity
toward solution resistance) and usually is suitable for larger peak separations (above
200 mV).
More direct evaluations of the electron transfer kinetics can be achieved by applying
Butler-Volmer formalism.50
( ) ( )⎥⎦
⎤⎢⎣
⎡ −−−+⎥
⎦
⎤⎢⎣
⎡ −=+
TkEEek
TkEEekkk
BBbf
00
00 )1(expexp αα (1.5)
where k0 is the standard rate constant, α is the electron transfer coefficient, kB is the
Boltzmann constant and T is temperature in Kelvin. α is an activation barrier symmetry
parameter.
Marcus and Hush51-53 description provides crucial foundation, by which the rate
constant for intermolecular electron transfer kET in the solution can be related to
thermodynamic factors. The main dependencies are described in equations 1.6 to 1.8.

8
⎟⎟⎠
⎞⎜⎜⎝
⎛ ∆−=
TkG
TkH
kBB
DAET
#2
exp4
2λπ
πh
(1.6)
( )λλ
4
20# +∆=∆
GG (1.7)
( )dHH DA β−= exp0 (1.8)
where λ is the reorganization energy, HDA is the electronic coupling matrix, ∆G0 is the
change in Gibbs free energy accompanying electron transfer, d is the separation
between donor and acceptor, β is the attenuation factor describing the conductivity of
the molecular linker, and ∆G# is the free energy of activation.
A key feature of this theory is the change in the free energy of activation and its
parabolic dependence on the reorganization and free Gibbs energy. The reorganization
energy parameter λ contains contributions from both inner (nuclear) and outer
(solvation) energy term. It can be also easily derived from Equation 1.6 that electronic
coupling matrix HDA should depend on the distance between donor and acceptor and
should decrease exponentially with increasing distance.

9
Super-exchange represents an expansion of the Marcus theory,54-56 in which the electron
transfers from the donor to the acceptor through the path of “virtual” orbitals localized
on the linking element even if bridge itself does not engage as a real intermediary
element in ET process.
DB
LADLDA E
H∆
=αα
(1.9)
where αDL and αLA are atomic orbital coefficients describing coupling between donor
and the first linking element and the last linking element with acceptor. The most
important aspect of this theory is that coupling element HDA can be related to the band
gap (∆EBD) between orbitals on the donor and the bridging element. A large band gap
can be interpreted as weak electronic coupling and thus a slower ET rate. ∆EBD is
determined by the electronic properties of the linking element.
1.3 Electron Transfer in Biomolecules
Although there is significant experimental evidence for the validity of Marcus’
description of electron transfer, recent studies of the long-range ET through DNA57, 58
and long helical peptides37, 59, 60 have shown significant deviations from typical
tunnelling and slow ET was observed which cannot be rationalized by Marcus theory.
To explain the unusually slow ET rate through peptide, DNA linkers and DNA, the

10
discrepancies of the observed distance dependence of the ET rate, a new type of
mechanism called “hopping” was proposed.57, 61, 62 The “hopping” mechanism is widely
recognized as a working route in DNA charge transfer through “G+. hole” hopping. An
electron can hop to and from a guanine base that is operating as an intermediate
donor/acceptor on the bridge (Figure 1.3).62, 63
A
G
A
G
A
G
DONOR
ACCEPTOR
e-
T C T C T C
E
A thorough description of the problems associated with electron transfer in
biomolecules can be found in recent reviews from Benniston,64 Adams,65 Giese,66 and
Kraatz67. Earlier achievements in this field with a detailed description of the
photochemical studies of ET in peptide conjuguates was described by Isied.46
A photophysical solution study performed by Isied and coworkers45, one of the pioneers
of peptide charge transfer, on a series of oligopeptide conjugate systems, showed that
charge transfer through the peptide backbone is significantly affected not only by the
Figure 1.3 DNA charge transfer through “G+. hole” hopping

11
distance between the donor and the acceptor, but also the nature of the amino acid
sequence.1, 45
N
O
N
O
N
O
NH
A
O
HN
D
n
Φ Ψ
More recent results appear to indicate that there is a transition in the ET mechanism
from a super-exchange mechanism to electron hopping with increasing peptide chain
length.1, 69 However this mechanistic interpretation is not widely accepted.
Meyer71, 72 for instance argued that electron transfer rates obtained by Isied could have
been strongly influenced by changes in the orientation and conformation of the
molecules in the bridge. Further evidence that molecular dynamics could significantly
alter ET rates was provided by Ogawa.73 By employing oligoglutamic acid chain in his
Figure 1.4 Model systems of the oligoprolines used by Isied1, 45, 68, 69 Giese70 and Meyer71 their ET research. Angles Ψ and Ф are used to define secondary structure of the peptide chain.
12
study he was able to connect the reorientation of the whole complex in the transition
state with the ET rate and activation energy.
Jones74 studied longer α-helical peptides. In his report, he encountered a wide
distribution of observable ET rates. To explain this unusual result Jones invoked
considerable conformational changes in the structure of “rigid” helical peptides as a
major parameter responsible for significant variations in ET rate.
Newton, Isied11 and co-workers also reported a theoretical study providing an
explanation for differences that were observed in electron transfer kinetics between
peptides of various secondary structures. With the help of oligoproline system, Isied
presented a model in which the ET kinetics are strongly affected by the differences in
the magnitude and directional dipole, occurring along peptide backbone. It is postulated
that the dipole moment can significantly contribute to the total electronic coupling
between the donor and acceptor group │HAD|. Isied’s results showed that there are
major differences between α- and polyproline-II helices and extended β-strand-like
secondary structure. The electronic coupling will be higher for helical structures
compared to the strand-like structure, resulting in a final observation as faster ET in
helices.

13
Similar theoretical results were lately reported by Senthikumar12. He used polyglycine
unit with a different secondary motifs to calculate electron coupling matrix HAB. The
differences in the dihedral angles had immense impact on the charge transfer.
The solution electrochemistry experiments performed on α-aminoisobutyric (Aib)-
homo-oligomers linked to a phthalimide or p-cyanobenzamide donors showed a unusual
picture of the ET process.60 Non-natural peptides containing Aib aminoacid are known
to form very stable 310-helices that have very strong intramolecular hydrogen bonding75.
Figure 1.5. Various secondary motifs used in the ET studies: α- helical structure, 310 – helical structure, polyproline I and polyproline II. Each of the structures has different Ψ and Φ angles resulting in diverse H-bonding patterns.

14
The number of H-bonds increases with the length of the peptide. Maran60 found that the
ET rate exhibits only very weak distance dependence. In some cases, where phthalimide
was used as the donor, the ET rate appears to increase with distance. In order to increase
the driving force and increase energy gap between donor and acceptor thus favor a
hopping mechanism Maran employed p-cyanobenzamide. Interestingly, the distance-ET
rate correlation for both systems was much smaller than expected. Maran rationalized
the obtained results by invoking a super-exchange mechanism in which the peptide
bridge was involved. The evidence, from variable temperature experiments, suggests
that a hopping mechanism is not operative in these systems at all. It has to be
emphasized that even though both groups have studied helical peptides, Isied’s systems
are not able to form in inter- or intramolecular bonds while Maran’s Aib-systems
possess strong intra-molecular hydrogen bonds. The effect of hydrogen bonding and its
impact on electron transfer needs to be investigated in more details.
Giese70 showed that electron transfer through a peptide backbone can be efficient only
when peptides with aromatic rings like tyrosine or phenylealanine were employed. It is
reported that electron directly hops between neighboring phenol rings with a solvent as
a mediator.
Petrov and May76 have provided a solid theoretical foundation for the description of
hopping and super-exchange mechanism. The “hopping” mechanism is also proposed to
explain long range electron transfer through the peptide chain. However, this is still
disputed.70, 77

15
A systematic investigation of the peptide spacer as a bridging element in electron
transfer studies is lacking. In most cases, the research was rather focused on elucidating
the distance dependence of ET though peptide chains. Knowledge about the role of a
single amino acid may be helpful in rationalizing the electrochemical response and
surface behavior of more complex systems.
1.4 Ferrocene-containing Monolayers and Peptide Films
A number of thorough reviews on this subject have been written by Benniston et al. 64
and Adams et al.65 Early achievements in this field have been described by Finklea.20
A convenient way to study interfacial ET and processes associated with it is to measure
kinetics of ET reactions of redox moieties irreversibly attached to the electrode surface
as a part of stable, well-organized structure in a form of a self-assembled monolayer
(SAM). The purpose is to investigate and characterize the role of the chemical
composition and the physical properties of the bridging element in mediating interfacial
electron transfer. There are many reasons why monolayers are so attractive from
research point of view. Firstly, the redox moiety is located at a well-defined distance
from the surface. Secondly, the distance and the composition of the bridge or even the
electrode material can be varied. Diffusive and convective contributions to the ET
process can be neglected48. Consequently such systems are ideal for the study of the
fundamental physical factors that control interfacial ET processes. The electronic
coupling |HAB| between a redox group and the electrode strongly depends on the
chemical nature of the bridge.

16
ET through alkyl spacers has been extensively studied and such systems were used to
create basic theories describing heterogeneous ET processes.9 In addition, extensive
work was done on bridges consisting of conjugated π-electron systems
oligophenylacetylenes or oligophenylvinylenes.44 These studies provided insight into
the distance dependence of the interfacial ET through electron pathways created by π-
electron systems. Smalley and Dudek6, 78 employed phenylene rings in the bridge to
show that molecular orientation and the rigidity can affect the electronic coupling and as
a result be an important parameter controlling ET.
Slow change in the molecular conformation of the neighbouring phenyl groups was
mainly responsible for obtained values of the ET process (Figure 1.6)
Figure 1.6 The orientation of phenylene elements of the bridge has tremendous effect on the ET rate78.

17
The conductivity of oligophenyleneethynylene bridge depends on the slow rotation of
the phenylene rings. Incomplete conjugation between connected phenylene rings will
significantly affect interfacial ET. It was also suggested by Kauffman et al. that solvent
dynamics might strongly affect ET rate and is responsible for conformational changes
of the molecules in the bridge.79, 80
Benniston et al.64 focused on the molecular conformation as one of the major
parameters affecting ET. A continuous medium of overlapping orbitals is necessary to
provide conjugated pathway for effective electron transfer. Fan et al.81 reported similar
observation that electron transfer occurred by conjugated pathway of localized orbitals
in phenylene-ethylynen compounds.
S
Fc
S Fc
S Fc
Figure 1.7 π-Electron conjugated systems used in the study by Sikes82, Smalley47 and Fan81

18
One of the most important issues is how the electronic coupling and pathway can be
modulated by the presence of the covalent bonds and by hydrogen bonding. So far
several studies on SAM’s have shown that H-bonded systems can have significant
contribution to the electronic coupling between Donor and Acceptor.14-16
In the literature we can also find very few examples in which redox induced changes in
the thickness of the films were reported. Uosaki83 studied ferrocene-alkenethiols (Fc-
CO-(CH2)11-SH) immobilized on the gold surface. By combining electrochemical
quartz crystal microbalance (EQCM) and infrared spectroscopy, he was able to observe
changes in the orientation of the ferrocene and fluctuations of thickness during redox
process caused by facile interaction of Fc+ with approaching couter-ions. Similar
observations were reported by Viana et al.84, 85 for shorter chains (Fc-CO-(CH2)n-SH,
where n = 3 - 10) Fc-alkenethiols. Unfortunately, none of these observations were
related to the electron transfer rates and reorganization energies.
Adams et al.65 in his review, focused on describing modern theories describing electron
transfer rate. Electron transfer rate is always closely associated with the movement of
counter-ions. Overall driving force of the charge transfer in many cases can be limited
by kinetics and interactions with counter-ions86. Generation of an ion in a place that is
isolated from the access of counter-ion (like in a case of the ferrocenium groups buried
in alkenethiol) is energetically costly and that cost should be either considered in a form
of additional reorganization energy, or treated as completely separate process. ET rate

19
in the case of buried Fc group is much slower than for the one that is exposed to the
access of anions from the solution (Figure 1.8).
The questions, which will allow us to further understand ET in peptides are: can we
effectively shield the ferrocene group by placing aminoacids containing larger more
hydrophobic groups in close vicinity to the Fc group? What will be the effect of such
shielding in a term of electron transfer rate and counter-ion reorganization energy? Can
this effect be efficiently evaluated by the measurements of the reorganization energy of
the film? Those questions will be tackled further in the main body of the thesis (Chapter
5).
1.5 Ferrocene-peptide Films
Investigations have shown that the ET in peptides can occur across long distances
separating the donor from the acceptor.87 The secondary structure of peptides, as well as
Figure 1.8 (Right) Electron transfer rate for buried ferrocene is two orders of magnitude slower then for the exposed one (left).79

20
the intramolecular hydrogen bonding network are known to affect the ET process.69, 87-89
Electrochemical investigations of peptides immobilized on gold surface have become a
practical way to study the electron transfer processes and to obtain important parameters
like molecular footprint on the surface,90 resistance,91, 92 capacitance, activation and
reorganization energies.35 It was demonstrated by Chidsey48 and others35 that the
solvation energy of the ferrocene significantly contributes to the activation energy and
thus is affecting ET rate. The orientation of molecules on the surface and its vast impact
on the electron rate was described by Mirkin93 and Kaifer.94
Bilewicz and co-workers studied the effect of increasing glycine and alanine amino
acids in Fc-peptide films anchored to the gold electrode. Their STM (scanning-
tunneling microscopy) results indicated that polyglycine films were structurally well
ordered and extremely well packed (specific area ∼30 Å2).95 Similar surface
concentrations were observed for helical polyalanine films.88 In this contribution, the
effect of the dipole on the symmetry of the Tafel plot was addressed. Her results
showed a decrease in kET upon increasing the number of Glycine residues in the peptide.
These changes were attributed to potential changes in the secondary structure of
oligoglycine chain. However, a change in mechanism from a bridge-assisted
superexchange to electron hopping could not be ruled out.
Kimura and coworkers addressed the problem of an electron transfer mechanism by
working on very long helical peptides. By incorporating non-natural amino acids
containing naphthyl96 or ferrocene96-98 residue in the side chain they were trying to find
the theory that will explain the nature of long-range electron transfer. An electron
transfer mechanism by “hopping” of the electron through the peptide immobilized on

21
the surface was proposed.98 Kimura for his α-helical systems suggested that hopping
involves amide to amide ET transfer due to partially double bond nature of the amide
linker14 However, this mechanism is highly debatable as the peptides the he used in his
studies are lacking amino acids (e.g. Tyr, Trp containing π-electron rich peptides that
can work as an electron donor/acceptor groups similarly to guanidine) and do not
display any redox activity in a biologically accessible regime. In a recent STM study,
Kimura and coworkers98 observed that long helical peptides are able to change the
length depending on the applied potential. The conformation of long helical peptides
has changed from 310 to α-helical structure. These observations may suggest that
molecular dynamics of the molecules on the surface should be considered in all attempts
to estimate ET rate. Vast changes in the thickness of Fc-modified double stranded DNA
immobilized on the surface were reported by Demaille.99, 100 Bending motion of the
rigid DNA helix caused by the redox reaction of the ferrocene was responsible for an
unusual electrochemical response that was observed.
The electrochemical properties of helical Fc-oligoprolines were investigated in our
research group.36 Oligoprolines are unable to form intra- or inter-strand H-bonding
patterns and create inflexible structure. This aspect was used to provide some insight
into the complicated mechanism of the ET process, which may imply that molecular
dynamics is less pronounced in rigid systems. In this system a linear relationship
between distance and electron transfer rate was found. In another publication38
collagen-like peptides (Pro-Pro-Gly unit) were used to explain the effect of inter-strand
and intermolecular H-bonding influence on ET process. Interestingly, the effect of the
repulsion between Fc head-groups and resultant changes in film structure were

22
observed. It can be speculated that at least in the case of the Fc-peptide films that
movements of the entire molecule, such as breathing motions of the H-bonding network
or rocking motions of the individual Fc-peptide strands, could be responsible for the
observed electrochemical effect. It was shown by Jones74, 101 that the molecular
dynamics can contribute significantly to the ET rate. In the Fc-peptide conjugates we
can also assume that dynamics is playing an important role in determining the ET rate.
In results presented by Kimura, Bilewicz and from our own work, a significant issue
arises. How can one distinguish a purely electrochemical response from an
electrochemical signal distorted by the molecular motion of the molecules on the
surface? The time scale of the electron movement from the ferrocene to the gold surface
through the peptide spacer in most electrochemical experiments is often slower than the
time scale of molecular motions, especially when external electric field are applied,
forcing charged molecule to align itself within the field gradient. Clearly, the dynamic
properties of the molecules have to be taken into account in order to describe the
electron transfer process correctly. In addition, one part of the puzzle is a proper
description of the reorganization energy of the system and its link to the dynamic
properties of the system. It also critical to understand molecular behavior of the films
under applied potential, effect of H-bonding, interactions with supporting electrolyte,
conformational changes and changes in the orientation of the redox group happening
during electron transfer event. Coupled ion/Fc+ electron transfer mechanism is at
question as well. How neighboring molecules can affect ET rate? Can counter-ion have
direct effect on the ET mechanism or possibly on the molecular dynamics of the
molecules? What is the effect of the rigidity, breathing motion associated with redox
23
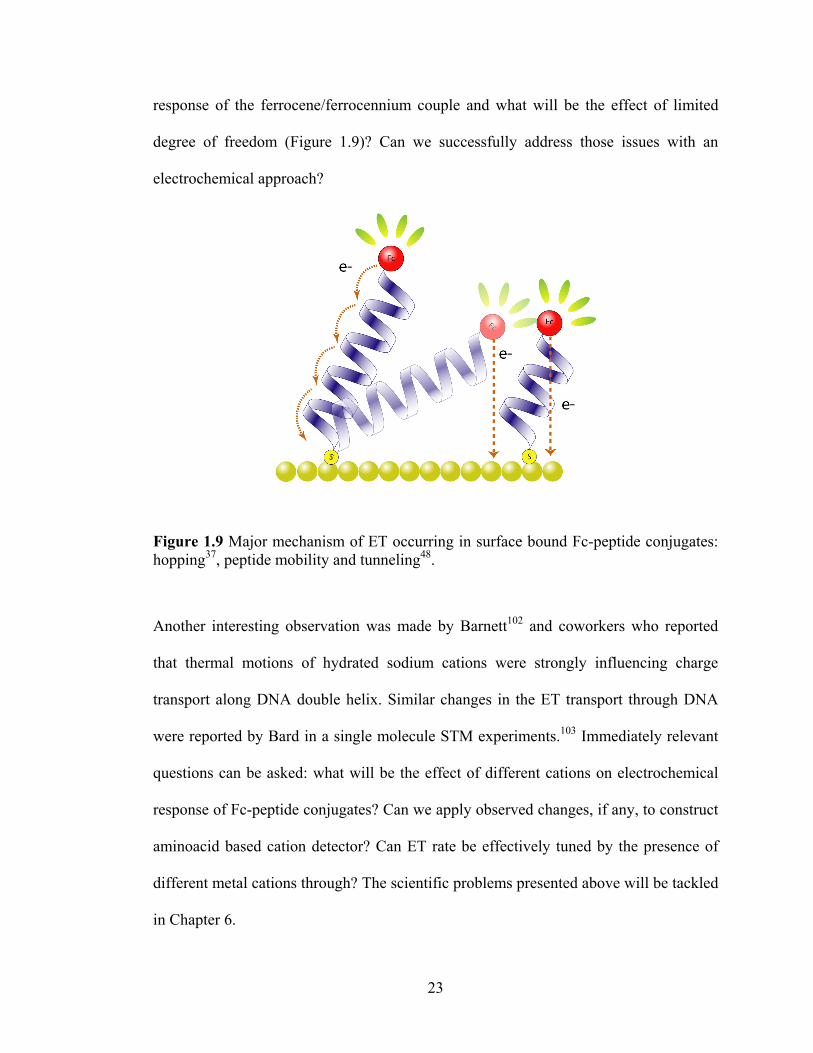
response of the ferrocene/ferrocennium couple and what will be the effect of limited
degree of freedom (Figure 1.9)? Can we successfully address those issues with an
electrochemical approach?
Another interesting observation was made by Barnett102 and coworkers who reported
that thermal motions of hydrated sodium cations were strongly influencing charge
transport along DNA double helix. Similar changes in the ET transport through DNA
were reported by Bard in a single molecule STM experiments.103 Immediately relevant
questions can be asked: what will be the effect of different cations on electrochemical
response of Fc-peptide conjugates? Can we apply observed changes, if any, to construct
aminoacid based cation detector? Can ET rate be effectively tuned by the presence of
different metal cations through? The scientific problems presented above will be tackled
in Chapter 6.
Figure 1.9 Major mechanism of ET occurring in surface bound Fc-peptide conjugates: hopping37, peptide mobility and tunneling48.

24
1.6 Research Objectives
The objective of this work is two-fold:
• To find a suitable method for rapid deposition of compounds containing
redox active disulfide conjugates
• To gain a thorough understanding of the electron transfer process in peptide
films by investigating the chemical and physical parameters affecting it
Ferrocene-modified peptides were used in this study and the film behavior on the
electrified metal surface has been investigated. These studies have been carried out
mainly by application of electrochemical techniques, such as cyclic voltammetry (CV),
alternating current voltammetry (ACV) and chronoamperometry (CA).
Cyclic voltammetry was my primary technique. From the CV response, I am able to
extract direct information about the electron transfer rate. Integration of the current from
CV peaks (Figure 1.2) gave the charge Q, which allowed for calculation of the surface
concentration Γ of Fc-bioconjugates. The current I(E) and surface concentration Γ(E) at
various overpotentials were then related to each other and resulted in easily obtainable
electron transfer rate for forward and backward process (oxidation-reduction of
Ferrocene group). All calculations were done in an Excel® spreadsheet. Relevant
equations are described in detail in Chapter 4.

25
In Chapters 2 and 3, the development of a new method for the preparation of molecular
films on gold by electrodeposition of disulfides from solution is described in detail. The
mechanism of electrochemical deposition of disulfide conjugates onto gold is not
discussed and requires future investigation.
The electrodeposition method was fine-tuned throughout the chapters of the thesis. First
attempts were explained in earlier chapters, where final method is described in details in
latter chapter 6.
Supplementary information given in Chapter 2 contains comparison of the Fc-peptide
films obtained by electrodeposition and typical incubation method. The material
provided in Chapter 2 compares ET rates obtained with chronoamperometry (CA) as
method that directly relates decay in the current with electron transfer rate by ET rates
obtained by CV.
Equation used to obtain ET rate from chronoamperometric experiments is:
I(t) = k Q exp(-kt) (1.7)
where Q is a charge I is a current t is time and k is ET rate.
The stability of electrochemically immobilized Fc-peptide films (by multiple CV
experiments) is depicted in supplementary information of Chapter 2.
Neutral ferrocene-peptide conjugates and cationic cobalt sarcophagine peptide
conjugates were investigated, that allowed the demonstration of the scope of the
method. In the course of the study, several interesting discoveries were made, such as

26
the field-dependent structural changes that occurred in films prepared from cationic
sarcophagine peptide conjugates and the differences that exist in the electron transfer
rates in ferrocene peptide conjuguates. This led to an in depth discussion, in chapter 4,
of a simple method for the evaluation of electron transfer rates by cyclic voltammetric
experiments. In the course of the experiments, it was discovered that the forward and
backward rates are not symmetrical but appear to be influenced by the nature of the
amino acid. In particular, the bulkiness of the amino acid side chain and the penetration
of the supporting electrolyte into the peptide film appear to play a role in the electron
transfer. Clearly, the effect of the supporting electrolyte required additional study, the
details of which are described in Chapter 5. Here, the effect of various anions on the ET
rate of ferrocene peptide films is investigated and major questions about molecular
dynamics (rigidity), ferrocene shielding by a larger hydrophobic groups, ferrocenium
ion-pairing, and their effects on the ET rates and the reorganization energy are tackled.
In the penultimate chapter, the effect of cations is investigated in order to provide a
complete picture of the environmental effects on the ET rates. In the course of the study,
it was discovered that some cations appear to cause significant surface restructuring, an
effect that has previously not been observed in peptide films. Finally, Chapter 7
provides a summary of the research achievements within the context of the reported
research.

27
1.7 References
1. Malak, R. A.; Gao, Z.; Wishart, J. F.; Isied, S. S., J. Am. Chem. Soc. 2004, 126,
13888-13889.
2. York, R. L.; Nguyen, P. T.; Slowinski, K., J. Am. Chem. Soc. 2003, 125, 5948-
5953.
3. Li, C.-Z.; Long, Y.-T.; Kraatz, H.-B.; Lee, J. S., J. Phys. Chem. B 2003, 107,
2291-2296.
4. Fan, F.-R. F.; Yang, J.; Cai, L.; Price, D. W., Jr.; Dirk, S. M.; Kosynkin, D. V.;
Yao, Y.; Rawlett, A. M.; Tour, J. M.; Bard, A. J., J. Am. Chem. Soc. 2002, 124, 5550-
5560.
5. Nitzan, A., Annu. Rev. Phys. Chem. 2001, 52, 681-750.
6. Dudek, S. P.; Sikes, H. D.; Chidsey, C. E. D., J. Am. Chem. Soc. 2001, 123,
8033-8038.
7. Morita, T.; Kimura, S.; Kobayashi, S.; Imanishi, Y., Chem. Lett. 2000, 676-677.
8. Creager, S. E.; Wooster, T. T., Anal. Chem. 1998, 70, 4257-4263.
9. Smalley, J. F.; Feldberg, S. W.; Chidsey, C. E. D.; Linford, M. R.; Newton, M.
D.; Liu, Y.-P., J. Phys. Chem. 1995, 99, 13141-13149.
10. Chidsey, C. E. D.; Bertozzi, C. R.; Putvinski, T. M.; Mujsce, A. M., J. Am.
Chem. Soc. 1990, 112, 4301-4306.
11. Shin, Y.-G. K.; Newton, M. D.; Isied, S. S., J. Am. Chem. Soc. 2003, 125, 3722-
3732.
12. Santhanamoorthi, N.; Kolandaivel, P.; Senthilkumar, K., J. Phys. Chem. A 2006,
110, 11551-11556.
13. Santhanamoorthi, N.; Kolandaivel, P.; Senthilkumar, K., Chem. Phys. Lett.
2007, 440, 302-307.
14. Lewis, P. A.; Smith, R. K.; Kelly, K. F.; Bumm, L. A.; Reed, S. M.; Clegg, R.
S.; Gunderson, J. D.; Hutchison, J. E.; Weiss, P. S., J. Phys. Chem. B 2001, 105, 10630-
10636.
15. Clegg, R. S.; Hutchison, J. E., Langmuir 1996, 12, 5239-5243.
28
16. Terrill, R. H.; Postlethwaite, T. A.; Chen, C.-h.; Poon, C.-D.; Terzis, A.; Chen,
A.; Hutchison, J. E.; Clark, M. R.; Wignall, G.; et al., J. Am. Chem. Soc. 1995, 117,
12537-12548.
17. Clegg, R. S.; Reed, S. M.; Hutchison, J. E., J. Am. Chem. Soc. 1998, 120, 2486-
2487.
18. Love, J. C.; Estroff, L. A.; Kriebel, J. K.; Nuzzo, R. G.; Whitesides, G. M.,
Chem. Rev. (Washington, DC, U. S.) 2005, 105, 1103-1169.
19. Gooding, J. J.; Mearns, F.; Yang, W.; Liu, J., Electroanalysis 2003, 15, 81-96.
20. Meyers, R. A.; Finklea, H. O., Self-assembled monolayers on electrodes. John
Wiley & Sons Ltd.: 2000.
21. Nuzzo, R. G.; Zegarski, B. R.; Dubois, L. H., J. Am. Chem. Soc. 1987, 109, 733-
740.
22. Nuzzo, R. G.; Dubois, L. H.; Allara, D. L., J. Am. Chem. Soc. 1990, 112, 558-
569.
23. Badia, A.; Lennox, R. B.; Reven, L., Acc. Chem. Res. 2000, 33, 475-481.
24. Dubois, L. H.; Nuzzo, R. G., Annu. Rev. Phys. Chem. 1992, 43, 437-463.
25. Weisshaar, D. E.; Lamp, B. D.; Porter, M. D., J. Am. Chem. Soc. 1992, 114,
5860-5862.
26. Cavalleri, O.; Kind, H.; Bittner, A. M.; Kern, K., Langmuir 1998, 14, 7292-
7297.
27. Finklea, H. O., Self-assembled monolayers on electrodes. Meyers, R. A. ed.;
John Wiley & Sons Ltd.: 2000.
28. Rohwerder, M.; de Weldige, K.; Vago, E.; Viefhaus, H.; Stratmann, M., Thin
Solid Films 1995, 264, 240-245.
29. Ron, H.; Rubinstein, I., J. Am. Chem. Soc. 1998, 120, 13444-13452.
30. Hsueh, C.-C.; Lee, M.-T.; Freund, M. S.; Ferguson, G. S., Angew. Chem., Int.
Ed. 2000, 39, 1228-1230.
31. Ma, F.; Lennox, R. B., Langmuir 2000, 16, 6188-6190.
32. Vericat, C.; Vela, M. E.; Gago, J.; Salvarezza, R. C., Electrochim. Acta 2004,
49, 3643-3649.

29
33. Vericat, C.; Vela, M. E.; Benitez, G. A.; Gago, J. A. M.; Torrelles, X.;
Salvarezza, R. C., J. Phys.: Condens. Matter 2006, 18, R867-R900.
34. Forster, R. J.; O'Kelly, J. P., J. Phys. Chem. 1996, 100, 3695-3704.
35. Weber, K. S.; Creager, S. E., J. Electroanal. Chem. 1998, 458, 17-22.
36. Galka, M. M.; Kraatz, H.-B., ChemPhysChem 2002, 3, 356-359.
37. Morita, T.; Kimura, S., J. Am. Chem. Soc. 2003, 125, 8732-8733.
38. Bediako-Amoa, I.; Sutherland, T. C.; Li, C.-Z.; Silerova, R.; Kraatz, H.-B., J.
Phys. Chem. B 2004, 108, 704-714.
39. Yang, Y. J.; Khoo, S. B., Electrochem. Commun. 2004, 6, 87-90.
40. Brevnov, D. A.; Finklea, H. O.; Van Ryswyk, H., J. Electroanal. Chem. 2001,
500, 100-107.
41. Lambert, C.; Kriegisch, V.; Terfort, A.; Zeysing, B., J. Electroanal. Chem.
2006, 590, 32-36.
42. Li, J.; Schuler, K.; Creager, S. E., J. Electrochem. Soc. 2000, 147, 4584-4588.
43. Chang, B.-Y.; Hong, S.-Y.; Yoo, J.-S.; Park, S.-M., J. Phys. Chem. B 2006, 110,
19386-19392.
44. Sikes, H. D.; Smalley, J. F.; Dudek, S. P.; Cook, A. R.; Newton, M. D.; Chidsey,
C. E.; Feldberg, S. W., Science (New York) 2001, 291, 1519-1523.
45. Isied, S. S.; Ogawa, M. Y.; Wishart, J. F., Chem. Rev. (Washington, DC, U. S.)
1992, 92, 381-394.
46. Isied, S. S., Prog. Inorg. Chem. 1984, 32, 443-517.
47. Smalley, J. F.; Finklea, H. O.; Chidsey, C. E. D.; Linford, M. R.; Creager, S. E.;
Ferraris, J. P.; Chalfant, K.; Zawodzinsk, T.; Feldberg, S. W.; Newton, M. D., J. Am.
Chem. Soc. 2003, 125, 2004-2013.
48. Chidsey, C. E. D., Science (Washington, DC, U. S.) 1991, 251, 919-922.
49. Laviron, E., J. Electroanal. and Interf. Chem. 1979, 101, 19-28.
50. Bard, A. J.; Faulkner, L. R., Electrochemical Methods: Fundamentals and
Applications. 2nd ed.; 2001.
51. Marcus, R. A., J. Chem. Phys. 1956, 24, 966-978.
52. Marcus, R. A., J. Chem. Phys. 1957, 26, 872-877.
53. Hush, N. S., Electrochim. Acta 1968, 13, 1005-1023.

30
54. McConnell, H. M., J. Chem. Phys. 1961, 35, 508-515.
55. Naleway, C. A.; Curtiss, L. A.; Miller, J. R., J. Phys. Chem. 1991, 95, 8434-
8437.
56. Redmore, N. P.; Rubtsov, I. V.; Therien, M. J., J. Am. Chem. Soc. 2003, 125,
8769-8778.
57. Meggers, E.; Michel-Beyerle, M. E.; Giese, B., J. Am. Chem. Soc. 1998, 120,
12950-12955.
58. Murphy, C. J.; Arkin, M. R.; Jenkins, Y.; Ghatlia, N. D.; Bossmann, S. H.;
Turro, N. J.; Barton, J. K., Science (Washington, DC, U. S.) 1993, 262, 1025-1029.
59. Felts, A. K.; Pollard, W. T.; Friesner, R. A., J. Phys. Chem. 1995, 99, 2929-
2940.
60. Antonello, S.; Formaggio, F.; Moretto, A.; Toniolo, C.; Maran, F., J. Am. Chem.
Soc. 2003, 125, 2874-2875.
61. Giese, B.; Spichty, M.; Wessely, S., Pure Appl. Chem. 2001, 73, 449-453.
62. Davis, W. B.; Naydenova, I.; Haselsberger, R.; Ogrodnik, A.; Giese, B.; Michel-
Beyerle, M. E., Angew. Chem., Int. Ed. 2000, 39, 3649-3652.
63. Kelley, S. O.; Jackson, N. M.; Hill, M. G.; Barton, J. K., Angew. Chem., Int. Ed.
1999, 38, 941-945.
64. Benniston, A. C.; Harriman, A., Chem. Soc. Rev. 2006, 35, 169-179.
65. Adams, D. M.; Brus, L.; Chidsey, C. E. D.; Creager, S.; Creutz, C.; Kagan, C.
R.; Kamat, P. V.; Lieberman, M.; Lindsay, S.; Marcus, R. A.; Metzger, R. M.; Michel-
Beyerle, M. E.; Miller, J. R.; Newton, M. D.; Rolison, D. R.; Sankey, O.; Schanze, K.
S.; Yardley, J.; Zhu, X., J. Phys. Chem. B 2003, 107, 6668-6697.
66. Giese, B., Bioorg. Med. Chem. 2006, 14, 6139-6143.
67. Long, Y.-T.; Abu-Irhayem, E.; Kraatz, H.-B., Chem.--Eur. J. 2005, 11, 5186-
5194.
68. Issa, J. B.; Salameh, A. S.; Castner, E. W., Jr.; Wishart, J. F.; Isied, S. S., J.
Phys. Chem. B 2007, ACS ASAP.
69. Ogawa, M. Y.; Moreira, I.; Wishart, J. F.; Isied, S. S., Chem. Phys. 1993, 176,
589-600.

31
70. Giese, B.; Napp, M.; Jacques, O.; Boudebous, H.; Taylor, A. M.; Wirz, J.,
Angew. Chem., Int. Ed. 2005, 44, 4073-4075.
71. Striplin, D. R.; Reece, S. Y.; McCafferty, D. G.; Wall, C. G.; Friesen, D. A.;
Erickson, B. W.; Meyer, T. J., J. Am. Chem. Soc. 2004, 126, 5282-5291.
72. Serron, S. A.; Aldridge, W. S., III; Fleming, C. N.; Danell, R. M.; Baik, M.-H.;
Sykora, M.; Dattelbaum, D. M.; Meyer, T. J., J. Am. Chem. Soc. 2004, 126, 14506-
14514.
73. Liu, L.; Hong, J.; Ogawa, M. Y., J. Am. Chem. Soc. 2004, 126, 50-51.
74. Jones, G., II; Zhou, X.; Vullev, V. I., Photochem. Photobiol. Sci. 2003, 2, 1080-
1087.
75. Toniolo, C.; Bonora, G. M.; Barone, V.; Bavoso, A.; Benedetti, E.; Di Blasio,
B.; Grimaldi, P.; Lelj, F.; Pavone, V.; Pedone, C., Macromolecules 1985, 18, 895-902.
76. Petrov, E. G.; Shevchenko, Y. V.; Teslenko, V. I.; May, V., J. Chem. Phys.
2001, 115, 7107-7122.
77. Polo, F.; Antonello, S.; Formaggio, F.; Toniolo, C.; Maran, F., J. Am. Chem.
Soc. 2005, 127, 492-493.
78. Smalley, J. F.; Sachs, S. B.; Chidsey, C. E. D.; Dudek, S. P.; Sikes, H. D.;
Creager, S. E.; Yu, C. J.; Feldberg, S. W.; Newton, M. D., J. Am. Chem. Soc. 2004, 126,
14620-14630.
79. Saleh, N. i.; Kauffman, J. F., J. Phys. Chem. A 2004, 108, 7139-7146.
80. Kauffman, J. F.; Khajehpour, M.; Saleh, N. i., J. Phys. Chem. A 2004, 108,
3675-3687.
81. Fan, F.-R. F.; Lai, R. Y.; Cornil, J.; Karzazi, Y.; Bredas, J.-L.; Cai, L.; Cheng,
L.; Yao, Y.; Price, D. W., Jr.; Dirk, S. M.; Tour, J. M.; Bard, A. J., J. Am. Chem. Soc.
2004, 126, 2568-2573.
82. Sikes, H. D.; Smalley, J. F.; Dudek, S. P.; Cook, A. R.; Newton, M. D.; Chidsey,
C. E. D.; Feldberg, S. W., Science (Washington, DC, U. S.) 2001, 291, 1519-1523.
83. Shen, Y.; Haba, T.; Sato, Y.; Shimazu, K.; Uosaki, K., Phys. Chem. Chem. Phys.
1999, 1, 3653-3659.
84. Viana, A. S.; Jones, A. H.; Abrantes, L. M.; Kalaji, M., J. Electroanal. Chem.
2001, 500, 290-298.

32
85. Viana, A. S.; Abrantes, L. M.; Jin, G.; Floate, S.; Nichols, R. J.; Kalaji, M.,
Phys. Chem. Chem. Phys. 2001, 3, 3411-3419.
86. Sumner, J. J.; Creager, S. E., J. Phys. Chem. B 2001, 105, 8739-8745.
87. Skourtis, S. S.; Beratan, D. N., Adv. Chem. Phys. 1999, 106, 377-452.
88. Sek, S.; Misicka, A.; Swiatek, K.; Maicka, E., J. Phys. Chem. B 2006, 110,
19671-19677.
89. Kraatz, H.-B.; Bediako-Amoa, I.; Gyepi-Garbrah, S. H.; Sutherland, T. C., J.
Phys. Chem. B 2004, 108, 20164-20172.
90. Rowe, G. K.; Creager, S. E., Langmuir 1994, 10, 1186-1192.
91. Creager, S. E.; Rowe, G. K., J. Electroanal. Chem. 1997, 420, 291-299.
92. Weber, K.; Hockett, L.; Creager, S., J. Phys. Chem. B 1997, 101, 8286-8291.
93. Herr, B. R.; Mirkin, C. A., J. Am. Chem. Soc. 1994, 116, 1157-1158.
94. Wang, Y.; Cardona, C. M.; Kaifer, A. E., J. Am. Chem. Soc. 1999, 121, 9756-
9757.
95. Sek, S.; Moszynski, R.; Sepiol, A.; Misicka, A.; Bilewicz, R., J. Electroanal.
Chem. 2003, 550-551, 359-364.
96. Watanabe, J.; Morita, T.; Kimura, S., J. Phys. Chem. B 2005, 109, 14416-14425.
97. Kitagawa, K.; Morita, T.; Kawasaki, M.; Kimura, S., J. Polym. Sci., Part A:
Polym. Chem. 2003, 41, 3493-3500.
98. Kitagawa, K.; Morita, T.; Kimura, S., J. Phys. Chem., ACS ASAP.
99. Wang, K.; Goyer, C.; Anne, A.; Demaille, C., J. Phys. Chem. B 2007, 111,
6051-6058.
100. Anne, A.; Demaille, C., J. Am. Chem. Soc. 2006, 128, 542-557.
101. Jones, G., II; Vullev, V.; Braswell, E. H.; Zhu, D., J. Am. Chem. Soc. 2000, 122,
388-389.
102. Barnett, R. N.; Cleveland, C. L.; Joy, A.; Landman, U.; Schuster, G. B., Science
(New York) 2001, 294, 567-571.
103. Liu, B.; Bard, A. J.; Li, C.-Z.; Kraatz, H.-B., J. Phys. Chem. B 2005, 109, 5193-
5198.
104. Ulman, A. Chem. Rev. 1996, 96, 1533-1554.

33

34
CHAPTER 2 2 ELECTRODEPOSITION OF FERROCENOYL PEPTIDE
DISULFIDES
This chapter is based on the manuscript by G. A. Orlowski, S. Chowdhury, Y.-T. Long,
T. C. Sutherland, H.-B. Kraatz. "Electrodeposition of ferrocenoyl peptide disulfides".
Chem. Commun., 2005, 1330-1332.
I am the main contributor in this manuscript. I have performed all electrochemical
experiments and calculations. S. Chowdhury provided compounds, the synthesis of
which is described elsewhere. Y.-T. Long was responsible for the interpretation of the
XPS data. T.C. Sutherland helped in preparation of the first draft of the manuscript. The
final version of the manuscript was obtained in an iterative writing process with my
supervisor.
2.1 Connecting Text
This chapter outlines the critical first step in my investigations and describes a new
method for the electrochemical deposition of ferrocene-peptide disulfides onto gold
surfaces. Detailed information about electron transfer rates through a series of Fc-
peptide conjugates is presented, together with a discussion of the role of the linker on
the ET process. And a thorough comparison between films prepared by

35
electrodeposition versus the typical incubation method is provided, showing that my
method is a useful route for the immobilization of disulfides onto gold surfaces
resulting in tightly packed films. This chapter lays the foundation for my work
described in the subsequent chapters making use of the film preparation methods
described here.
The manuscript was reproduced with the permission from Royal Society of Chemistry ® 2005. The text
below is a verbatim copy of the published material.

36
2.2 Introduction and Discussion
Self-assembled monolayers (SAMs) have been extensively studied over the last 20
years.1-5 It was shown that the formation of alkylthiol SAMs can be aided by electro-
deposition of the film on the gold surface,6 cutting the time from days to minutes for the
preparation of a monolayer. Additionally, the packing of a monolayer prepared in this
fashion is denser and appears to lack some of the disorder associated with an incomplete
monolayer formation. An electro-deposition step for the corresponding disulfides,
which are often used to prepare SAMs has not been reported and usually takes several
days.7, 8
Our aim was twofold: a) to develop an electro-deposition method for disulfides onto
gold surfaces, b) to investigate the electrochemical properties of these monolayers. We
made use of two classes of Fc-peptides: acylic ferrocenoyl (Fc)-peptide disulfides9 and
cyclic 1,1’-Fc-peptide disulfides,10 which upon deposition onto a gold surface should
give rise to two different structures on the surface, as indicated in Figure 2.1 Acyclic
systems will have the Fc group linked to the surface by a single amino acid linker,
whereas the cyclic system can link the Fc group to the surface using both amino acid
spacers. This would suggest differences in the rigidity of the attached molecule, which
in turn may influence the electron transfer (ET) kinetics of the film.
We investigated the electro-deposition of the acyclic [Fc-CSA]2 (1-a), [Fc-Gly-
CSA]2(2-a), [Fc-Ala-CSA]2 (3-a), [Fc-Val-CSA]2 (4-a) and [Fc-Leu-CSA]2 (5-a)9 and
of the corresponding cyclic 1,1’-Fc[CSA]2 (1-c), 1,1’-Fc[Gly-CSA]2 (2-c), 1,1’-Fc[Ala-

37
CSA]2 (3-c). 1,1’-Fc[Val-CSA]2 (4-c) and 1,1’-Fc[Leu-CSA]2 (5-c)10 and the properties
of the corresponding films.
The electro-deposition was accomplished by placing a freshly oxidized (electrochemical
cycling from 0.2 V to 1.6 V vs. Ag/AgCl in 0.5 M H2SO4) microelectrode (diameter: 25
µm) into a 10 mM ethanolic Fc-peptide disulfide solution and applying -1.3 V for 30
min. Note the absence of supporting electrolyte. Longer applied potential times were
tested, but afforded no change in monolayer coverage and more anodic potentials did
not result in monolayer formation. The large negative potential is known to reduce
disulfides to thiolate anions,11 which readies the system for monolayer formation. We
compared these results with conventional incubation of the microelectrodes in a 1 mM
ethanolic Fc-peptide solution for 5 days at room temperature. The resulting films were
assessed electrochemically by cyclic voltammetry (CV), chronoamperometry (CA) and
differential pulse voltammetry (DPV) (see ESI). The film thickness for the films was
measured by ellipsometry and gave values of 9(3) Å for both electrodeposited and
incubated monolayers (excluding 1-a and 2-a), which compares well with the calculated
value for film thickness of 9(2) Å (nS = 0.25 and KS = 3.46 for the substrate, η = 1.40,
see ESI).

38
The surfaces were also characterized by X-ray photonspectroscopy (XPS) showing
identical signals for both the electrodeposited and incubated film (see supplementary
data 2.4). CV was carried out on a custom-built potentiostat and CA was carried out
using CHInstruments potentiostat model 660B. All electrochemical measurements were
carried out in water using at least 5 different Fc-peptide modified gold microelectrodes
Figure 2.1 a) Crystal structure of acyclic [Fc-Gly-CSA]2 (2-a) and cyclic 1,1’-Fc[Gly-CSA]2 (2-c) b) Schematic representation of the resulting Fc-peptide surfaces. c) Cyclic voltammograms of 2-c (solid line) and 2-a (broken line) films on Au microelectrodes (d = 25 µm). 2.0 M NaClO4 supporting electrolyte, scan rate 1000 Vs-1, Pt mesh auxiliary and Ag/AgCl (3.5 M KCl) reference electrode.

39
to ensure reproducibility (2 M NaClO4 supporting electrolyte, reference electrode:
Ag/AgCl/3.5 M KCl, Pt mesh auxiliary electrode).
The electron withdrawing capability of the amides makes the disubstituted Fc more
difficult to oxidize. All electrochemical parameters are included in Table 2.1.
Integration of the Faradaic current provides the Fc surface concentration,12 from which
a specific area per molecule can be calculated. The theoretical area (calculated from
crystal structure data)9, 10 of the acylic Fc-peptides and 1,1’-cyclo-Fc-peptides are ~30
and ~40 Å2·molecule-1, respectively.
Electro-deposited films of Fc-peptides, gave consistently higher surface concentration
compared to films obtained by conventional incubation, suggesting that electro-
deposition gives a tighter packed film. It is noteworthy that the difference in the
molecular footprint obtained for 1,1’-Fc-peptide films prepared by electro-deposition
and standard incubation are large. For acyclic Fc-peptides this difference is still
significant. The electro-deposition of the 1,1’-cyclo-Fc-peptides results in a 2 to 3 times
greater surface coverage than the incubation method. It appears that packing is
significantly less tight if the films are prepared by incubation.

40
Table 2.1 Summary of electrochemical parameters analyzed by CV and CA. Value in parentheses is the standard deviations from 5 electrode measurements.
Electrodeposition from EtOH
Compound E0’ / mV kET × 103 / s-1 Specific Area /
Å2·molecule-1
Surf. Conc.
× 10-10 / mol·cm-2
1-c 670(7) 9.5 45(7) 3.7
1-a 465(9) 8.0 40(7) 4.2
2-c 688(6) 14.0 47(8) 3.5
2-a 464(6) 13.5 50(8) 3.3
3-c 635(6) 12.0 68(9) 2.4
3-a 490(7) 6.0 36(5) 4.6
4-c 670(7) 12.0 60(9) 2.8
4-a 488(7) 9.5 65(8) 2.6
5-c 686(8) 17.0 60(8) 2.8
5-a 484(7) 11.0 72(8) 2.3
* Error for kET calculations was 1.5 x 10³ s-1
The full-width-at-half-maximum, Efwhm (see ESI), is a useful parameter that assesses the
homogeneity of the Fc environment. The redox signal for all Fc-peptide films prepared
in this study exhibit widths that exceeds the ideal, Efwhm of 90 mV,13 indicating the
presence of some lateral interactions between the molecules in these films. H-bonding
presumably plays an important role as was shown before in films of the acyclic Fc-
peptides.13-18 Interestingly, there is little difference between the films formed from
cyclic and acylic Fc-peptides. However, Fc-peptide films formed by electro-deposition
have a lower Efwhm values (160(10) mV versus 210(20) mV). This difference points to a
more uniform film if electro-deposition is used.

41
The ET kinetics of all films were assessed by CV and CA and are summarized in Table
2.1 and 2.S3 (see ESI). The methods were described before.18 There are two key results
of our kinetic study: a) the kET for films prepared by electro-deposition or by incubation
are the same; b) the kETs for Fc-peptide films of cyclic Fc-peptides are higher compared
to the corresponding acyclic systems. A probable explanation for the faster ET kinetics
for the cyclic systems is their inherent ability to establish two Au-S linkages, allowing
ET to proceed along both peptide spacers. It is also interesting to note that the most
amino acid systems exhibit faster kET compared to compounds 1-a and 1-c having only
a cystamine spacer. The amino acid chain may allow for better packing on the surface
due to intermolecular H-bonding interactions thereby increasing the rigidity of the
linker. Confirmation that both sulfur atoms of the cyclo systems are bound to the gold
comes form reductive desorption experiments. As stated above Fc is a one-electron
redox probe and sulfur is known to undergo a one electron reductive desorption at
sufficiently negative potentials. Thus, DPV experiments were carried out in H2SO4 for
the Fc and KOH for the Au-S reduction due to the instability of Fc at high pH values.

42
The integration of the Fc and sulfur reduction for both the acyclic and cyclo FcGly
derivatives 2-a and 2-c are shown in Figure 2.2. The ratio of the integrated area between
the Fc and sulfur reduction peaks shows that the cyclo system has a 1:2 (Fc:S) ratio and
the acyclic derivative has a 1:1 (Fc:S) ratio which, is evidence that both sulfur atoms of
the cyclo derivatives were bound to the Au surface. The shoulder in Fig. 2b, at ca. -0.45
V, is attributed to the decomposition of Fc at high pH. Additionally, crystal structure
data supports this claim because the cyclo derivatives participate in intramolecular H-
bonding and the acyclic derivatives exhibit intermolecular H-bonding.
In summary, we have presented an electrochemical method to form Fc-peptide
monolayers from Fc-peptide disulfides, giving raise to well-packed monolayers on gold.
This method should find wide-spread applications for the formation of monolayers from
Figure 2.2 DPVs of a) cyclo and b) acyclic, FcGly derivatives. Integrated peak currents for cyclo- and acyclic-derivatives are in a 1:2 and 1:1 ratio, respectively, indicating both sulfur atoms of the cyclo derivatives are bound to the Au surface. The hatched lines in the models represent H-bonding patterns found in the crystal structure.

43
disulfides. Our studies allowed a direct comparison of the ET kinetics of cyclic and
acyclic Fc-peptide disulfide systems. Our results show faster ET kinetics for the cyclic
systems compared to the acyclic systems, which may be result of the enhanced rigidity
of the molecules on the surface. We are now investigating this phenomenon in more
detail and hope to compare our results to the growing number of ET studies on other Fc-
peptide systems18-21 in order to get additional mechanistic insight.
Funding from NSERCC is acknowledged. HBK is the Canada Research Chair in
Biomaterials.

44
2.3 Notes and References
1. M. W. J. Beulen, M. I. Kastenberg, F. van Veggel, and D. N. Reinhoudt,
Langmuir, 1998, 14, 7463-7467.
2. M. T. Lee, C. C. Hsueh, M. S. Freund, and G. S. Ferguson, Langmuir, 2003, 19,
5246-5253.
3. M. D. Porter, T. B. Bright, D. L. Allara, and C. E. D. Chidsey, J. Am. Chem. Soc.,
1987, 109, 3559-3568.
4. B. Rai, P. Sathish, C. P. Malhotra, Pradip, and K. G. Ayappa, Langmuir, 2004, 20,
3138-3144.
5. L. H. Dubois, B. R. Zegarski, and R. G. Nuzzo, Langmuir, 1986, 2, 412-417.
6. L. Cheng, J. P. Yang, Y. X. Yao, D. W. Price, S. M. Dirk, and J. M. Tour,
Langmuir, 2004, 20, 1335-1341.
7. D. J. Campbell, B. R. Herr, J. C. Hulteen, R. P. VanDuyne, and C. A. Mirkin, J.
Am. Chem. Soc., 1996, 118, 10211-10219.
8. C. Naud, P. Calas, and A. Commeyras, Langmuir, 2001, 17, 4851-4857.
9. I. Bediako-Amoa, R. Silerova, and H. B. Kraatz, Chem. Commun., 2002, 2430-
2431.
10. S. Chowdhury, G. Schatte, and H. B. Kraatz, J. Chem. Soc., Dalton Trans., 2004,
1726-1730.
11. H. Ron and I. Rubinstein, J. Am. Chem. Soc., 1998, 120, 13444-13452.
12. S. W. Han, H. Seo, Y. K. Chung, and K. Kim, Langmuir, 2000, 16, 9493-9500.
13. K. Seo, I. C. Jeon, and D. J. Yoo, Langmuir, 2004, 20, 4147-4154.
14. T. Moriuchi, K. Yoshida, and T. Hirao, Organometallics, 2001, 20, 3101-3105.
15. P. Saweczko, G. D. Enright, and H. B. Kraatz, Inorg. Chem., 2001, 40, 4409-
4419.
16. T. Moriuchi, A. Nomoto, K. Yoshida, A. Ogawa, and T. Hirao, J. Am. Chem. Soc.,
2001, 123, 68-75.
17. T. Moriuchi, A. Nomoto, K. Yoshida, and T. Hirao, Organometallics, 2001, 20,
1008-1013.

45
18. I. Bediako-Amoa, T. C. Sutherland, C. Z. Li, R. Silerova, and H. B. Kraatz, J.
Phys. Chem. B, 2004, 108, 704-714.
19. T. Morita, S. Kimura, J. Am. Chem. Soc., 2003, 125, 8732-8733.
20. a) S. Sek, R. Moszynski, A. Sepiol, A. Misicka, R. Bilewicz, J. Electroanal.
Chem. 2003, 550-551, 359-364; b) S. Sek, A. Sepiol, A. Tolak, A. Misicka, R.
Bilewicz, J. Phys. Chem. B 2004, 108, 8102-8105.
21. M.M. Galka, H.-B. Kraatz, ChemPhysChem 2002, 3, 356-359

46
2.4 Supplementary Data
Table 2S.1 Electrochemical parameters calculated from CV experiments using the electrochemical deposition and incubation methods.
Incubation Electrodeposition
∆Ep / mV
Efwhm / mV Ia/Ic
∆Ep / mV
Efwhm / mV Ia/Ic
1-c 90(8) 200(15) 1.00(9) 90(9) 190(10) 0.92(5) 1-a 120(6) 240(15) 1.00(9) 120 (10) 220(10) 1.00(5) 2-c 60(8) 180(10) 0.90(9) 60(7) 170(8) 1.00(5) 2-a 65(5) 195(10) 1.00(9) 140(10) 175(8) 0.92(5) 3-c 85(7) 190(15) 0.90(9) 55(7) 160(8) 0.94(5) 3-a 90(5) 200(15) 1.00(9) 111(10) 190(10) 0.90(5) 4-c 80(7) 210(8) 0.90(5) 55(7) 170(8) 0.98(5) 4-a 85(5) 230(15) 0.90(5) 120(10) 190(10) 1.00(5) 5-c 70(5) 200(10) 0.90(5) 62(7) 157(10) 0.90(3) 5-a 95(7) 210(10) 0.90(5) 110(10) 190(10) 0.90(3)
Table 2S.2 Electrochemical parameters calculated from CV for the incubation method. This is complementary data to Table 2.1 of the paper.
E0’ / mV kET × 103 / s-1 Specific Area / Å2·molecule-1
1-c 660(9) 8.0 120(9) 1-a 473(6) 7.0 50(3) 2-c 682(8) 13.0 150(20) 2-a 445(9) 12.0 78(8) 3-c 624(8) 11.0 141(20) 3-a 468(8) 6.9 53(9) 4-c 665(9) 11.0 130(25) 4-a 484(7) 10.0 70(10) 5-c 680(7) 14.0 220(10) 5-a 476(9) 11.0 101(9)
* Error for kET calculation was 2 x 10³ s-1

47
Background (non-Faradaic current) correction for all CVs was made in custom written
software by fitting a polynomial curve. Pinholes in the film were analyzed by taking the
difference between the gold oxide reduction peak in sulfuric acid CVs of a bare Au
electrode and a Fc-peptide film protected electrode. Only 5-7% of the surface was
oxidized to gold oxide if the film was prepared by electro-deposition compared to 15-
20% of Au was oxidized to gold oxide in films prepared by the incubation method. The
electron transfer kinetics was evaluated according to methods described in reference 18.
Figure 2S.1 A representative semilog chronoamperometric response from a 400 mV potential jump on an electrodeposited cyclic 1,1’-Fc[GlyCSA]2. 12.5 µm radius Au electrode, 2M NaClO4 supporting electrolyte and a Ag/AgCl/(3.5 M KCl) reference electrode. The RC of 5.7 µs (dotted line) is the time constant of the double layer charging and the linear region (dashed line) is the electron transfer rate at 400 mV overpotential. The inset shows the untransformed data.

48
ket values that comes from CA are similar to those obtained from CV.
Table 2S.3 Chronoamperometric results from monolayers that were electrodeposited.
CA electrodeposition Compound kET × 103 / s-1
1-c 7.5 1-a 7.0 2-c 11.0 2-a 12.0 3-c 11.0 3-a 8.0 4-c 10.0 4-a 8.0 5-c 16.0) 5-a 10.5
Error for kET calculation was 1.5 x 10³
Figure 2S.2 Linear response of anodic and cathodic peak currents for 3-c and 3-a derivatives, indicating successful surface immobilization.
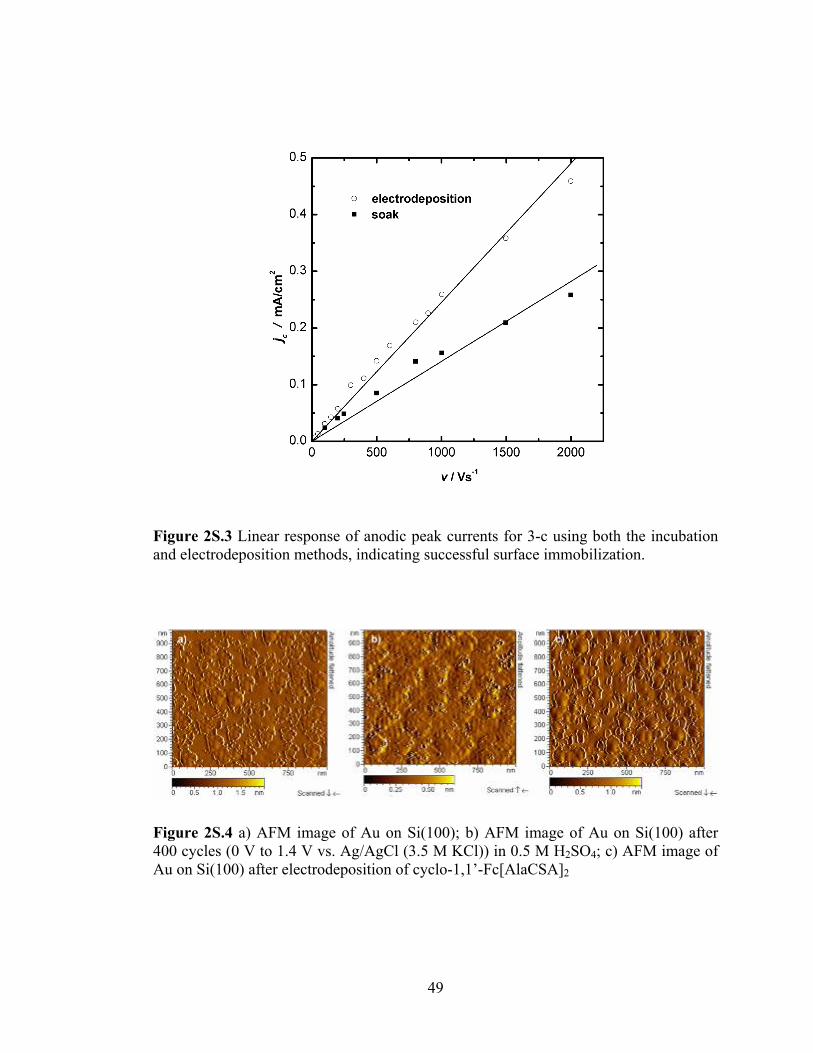
49
Figure 2S.3 Linear response of anodic peak currents for 3-c using both the incubation and electrodeposition methods, indicating successful surface immobilization.
Figure 2S.4 a) AFM image of Au on Si(100); b) AFM image of Au on Si(100) after 400 cycles (0 V to 1.4 V vs. Ag/AgCl (3.5 M KCl)) in 0.5 M H2SO4; c) AFM image of Au on Si(100) after electrodeposition of cyclo-1,1’-Fc[AlaCSA]2

50
Thickness of the monolayers were measured by ellipsometry and gave values 9(3) Å
which is in good agreement with data obtained from x-ray crystallography10 and
molecular simulation in Spartan software.
Table 2S.4 Root-Mean-Square (RMS) roughness of 3 AFM images of Figure 2S.4 RMS (nm)
Left Scan Direction Right Scan Direction
Au on Si(100) 2.139 2.058 Au on Si(100) after 400 cleaning
cycles 1.196 1.240
cyclo-1,1’-Fc[AlaCSA]2. 1.692 1.678
Figure 2S.5 Multiple CVs of cyclo-1,1’-Fc[AlaCSA]2 (3-c) taken every 0.05 seconds for 60 seconds with a 12.5 µm radius Au-modified electrode, 2 M NaClO4 supporting electrolyte and a Ag/AgCl/(3.5 M KCl) reference electrode.

51
Figure 2S.6 XPS results for sulfur sp2 for a) electrodeposited, b) incubated compound 1-c. Sulfur population in both cases is virtually identical. The similar results were obtained for other cyclic compounds.

52
Ellipsometry. Au on Si(100) (Platypus Technologies, Inc) wafers were incubated in a 1
mM Fc-peptide ethanolic solution for 5 days and finally rinsed with EtOH and H2O. A
Stokes ellipsometer LSE (Gaertner Scientific Corporation, Skokie, IL, fixed angle (70°),
fixed wavelength (632.8 nm)) was used, and the data were collected and analyzed using
LGEMP (Gaertner Ellipsometer Measurement Software) on a PC. Ellipsometry
constants were as follows: nS = 0.25 and KS = 3.46 for the substrate and 1.40 was used
as the refractive index of the monolayer.

53
CHAPTER 3 3 CAGES ON SURFACES: THIOL FUNCTIONALISATION OF
Co(III) SARCOPHAGINE COMPLEXES
This chapter is based on the manuscript by J. M. Harrowfield, G. A. Koutsantonis, H-B.
Kraatz, G. L. Nealon, G. A. Orlowski, B. W. Skelton, and A. H. White, Eur. J. Inorg.
Chem. 2007, 263–278.
This is the direct result of a collaborative study between the groups of G.A.
Koutsantonis (U Western Australia), J.M. Harrowfield (U Strassbourg) and H.-B.
Kraatz (U Saskatchewan). I and G. L. Nealon were the main contributors to this
manuscript. G.L. Nealon spent two months at the U Saskatchewan (10/05-11/05).
During this time, I performed all electrochemical experiments and calculations. The
electrochemical part of this manuscript was also written by me. The compounds used in
this study were synthesized by G.L. Nealon at U Western Australia. Although, their
syntheses and characterizations are an integral part of the manuscript, they do not form
part of my work and thus are not included in this chapter. Thus, I am providing a
verbatim copy of the portion of the manuscript to which I made major contributions.
B.W. Skelton and A.H. White were responsible for the crystal structure analysis. The
final version of the manuscript was obtained in an iterative writing process with all
three supervisors: J. M. Harrowfield, G. A Koutsantonis, and H-B. Kraatz.

54
3.1 Connecting Text
Next in my investigations, it was important to elucidate the generality of the
electrodeposition method for disulfides described in Chapter 2. Thus, it was decided to
embark on a collaborative project, working with cationic sarcophagine-peptide disulfide
conjugates. In this chapter, I describe the successful attempts of a potential-assisted
surface immobilization of a series of cobalt sacrophagines, which exhibit a redox
activity at very high potential. In addition, an example of the dynamic properties of
these bioconjugates is described, which will be of relevance in later chapters. Thus, the
electrodeposition method, developed initially for Fc-peptide disulfide comjugates, was
successfully implemented for cationic peptide conjugates. employed.
The manuscript was reproduced with the permission from VCH-Wiley ® 2007, The text below is a verbatim copy of the published material.

55
3.2 Introduction
Reagent immobilization on surfaces is a sophisticated pathway to materials with a wide
range of applications,1, 2 heterogeneous catalysis being one obvious application, such
applications depending on the functionality introduced with the bound reagent, as well
as upon the ease and convenience of the immobilization procedure and the stability of
the final product. Given the remarkable stability and varied electronic, magnetic and
redox properties of metal complexes of the macrobicyclic polyamines known as
"sarcophagines" (Figure 3.1),3 these are species of particular appeal as entities for
attachment to surfaces and for various related applications.4 Reduction potentials for
readily accessible species span a range of 2 V,5 subject to modification in an interfacial
environment,6 and outer-sphere redox processes involving Co complexes, are, for
example, known to be rapid steps in reactions leading to photoinduced hydrogen
production7-10 and the reduction of oxygen to hydrogen peroxide.11 Of practical
importance in relation to immobilization of such complexes is the facile synthesis of the
ligand in forms with reactive "external" functional groups R (Figure 3.1).12
NH NH
NH
NH NH
Co NH2NHR
Cage = sarcophagine = "sar"= 3,6,10,13,16,19-hexa-azabicyclo[6.6.6]icosane
= [Co(R)(NH2)sar]3+
3+
(R = CH3, NH2)
Figure 3.1 Trivial nomenclature used throughout this work

56
Limited earlier work on surface-bound cage complexes has involved modification of
electrodes by impregnation of thin Nafion films on graphite with simple cage
complexes,5 electropolymerisation of a thiophenylmethylamino-cage complex on Pt,12
and carbodiimide coupling of carboxyl groups on partially oxidized graphite to a
diamino-cage complex.13 Amphiphilic cages14, 15 have also proved to have interesting
biological properties, probably associated with their ability to be bound within
membranes.15 As a simple approach to the immobilization of cage complexes on
surfaces, we are currently exploring the use of the well-established surface chemistry of
disulfides1 to form monolayers of cobalt sarcophagine complexes on gold. This is based
on the introduction of peptide substituents associated with cystamine units onto the
cage, a facile synthesis when starting from readily synthesized glycylated derivatives.16
The use of peptide based tethering groups is advantageous as the length of the spacer
between the surface and the cage moiety can be increased incrementally with relative
ease, using common peptide synthetic techniques,17 and tightly packed monolayers can
be formed, presumably aided by extensive hydrogen bonding networks between the
amide groups.18 A similar approach has been applied to the synthesis of ferrocene-
decorated peptides as probes for elucidation of the mechanism(s) of electron transfer in
proteins.19
Our immediate aim in the present work was to synthesize a series of disulfides bearing
peptido-cage complex substituents, evaluate their solution electrochemical
characteristics. and determine a suitable method for their immobilization onto gold
electrodes. Since only a single disulfide substituent is required for surface tethering, our

57
focus has been on obtaining derivatives of the monosubstituted cage complex
[Co(CH3)(NH2)sar]3+, though the more complicated syntheses of monofunctionalised
derivatives of [Co(NH2)2sar]3+ have also been investigated. These Co(III) complexes
exist in stable enantiomeric forms and thus the formation of diastereomeric forms of
their oligopeptide derivatives was anticipated, though prior work suggested that
differences between such diastereomers should be small.[12]
NH NH
NH
NH NH
CoH2
+
NNHRNH
SO
2 (ClO4)x
NH NH
NH
NH NH
CoH2
+
NNHRNH
HN
O
(ClO4)x
SO
2
NH NH
NH
NH NH
CoH2
+
NNHRNH
HN
O
(ClO4)x
SO
2
Gly1 CSA
Gly1
Gly1
Gly2 CSA
CSAAla2
Cage
Chart 3.1 General structures of the compounds prepared showing trivial nomenclature used.

58
NH NH
NH
NH NH
CoHNNHR
R'S
O
2
6+
Table 3.1 List of synthesized compounds. Compound # R Cage R’
2
3
4
5
6
7
8
9
10
-CH3
-CH3
-CH3
-CH3
-CH3
-NH2
-NH2
-NH2
-NH2
racemic
racemic
racemic
racemic
racemic
racemic
Λ-enantiomer
Λ -enantiomer
Λ -enantiomer
-Gly-OH
-N(CH2CO2H)2
-Gly-CSA-
-Gly-Gly-CSA-
-Gly-Ala-CSA-
-Gly-CSA-
-Gly-CSA-
-Gly-Gly-CSA-
-Gly-Ala-CSA-
3.3 Electrodeposition
All electrodeposition experiments were performed using a three electrode cell system
consisting of Au (25 µm diameter) as working electrode, Pt wire as counter electrode
and Ag wire as the reference electrode. Electrodeposition was accomplished by placing
59
a freshly oxidised microelectrode (electrochemical cycling from –0.4 to +1.2 V vs. Pt
wire in 0.5 M H2SO4) into a 1 mM solution of the analyte in 0.1 M NaClO4(aq) and
applying –1.5 V for 30 min. After this period, the electrode was washed with water,
then suspended in a vigorously stirred beaker of water for 10 mins, and then 2 M
NaClO4(aq) for 30 seconds. All electrochemical measurements were performed using a
custom-built potentiostat in 2 M NaClO4(aq) using a three electrode cell system
consisting of Au (25 µm diameter) as working electrode, Pt wire as counter electrode
and Ag/AgCl as the reference electrode, which was placed in a separate cell and
connected to the analyte cell via a salt bridge (KNO3). The electrochemical cell was
enclosed in a grounded Faraday cage, and all electrolytes were degassed with a flow of
N2(g) prior to the experiments, and an N2(g) blanket maintained throughout the course of
the measurements. All electrochemical measurements were performed on at least 5
different microelectrodes to ensure reproducibility.
3.4 Self-assembly
Monolayers were formed by soaking a freshly cleaned electrode (electrochemical
cycling from –0.4 to +1.2 V vs. Pt wire in 0.5 M H2SO4) in a 1 mM aqueous solution of
the complex for 5 days. After this period, the electrodes were treated exactly as above
for the electrodeposited materials.

60
3.5 Solution Electrochemistry
The solution electrochemistry of compounds 2-10 was investigated via Cyclic
Voltammetry (CV) and Differential Pulse Voltammetry (DPV) performed in aqueous
solution using NaClO4 as supporting electrolyte, and selected data are presented in
Table 3..2 depicts typical CV and DPV data for two of the complexes, 4 and 7. The
electrochemical behavior of the compounds was found to be pH sensitive and was often
complicated by adsorption effects, particularly at Au or Pt working electrodes, which is
consistent with previous work performed on the parent cages.20 Adsorption behavior at
an Au electrode was confirmed via quartz crystal microbalance (QCM) measurements,
whereby an increase in mass at the working electrode was observed at the potential
corresponding to the pre-wave attributed to an adsorption phenomenon. In order to
obtain reproducible results, the electrochemistry was performed in aqueous NaClO4
adjusted to pH 7.3 utilizing a tris(hydroxymethyl)aminomethane (TRIS)/HClO4 buffer.
As the data in Table 3.4 show, the compounds display quasi-reversible redox behaviour,
as determined from the ∆E values (>0.059 V) and the peak current ratio Ia/Ic being
lower than unity for most of the compounds. It is known that the E1/2 values for the
cages are sensitive to the nature of the apical substituents20 and this is evident for the
compounds synthesised here. The E1/2 for compound 2 with one glycyl substituent is
shifted by 55 mV to more positive potential than that for compound 3, which is
terminated with an iminodiacetate moiety. The nature of the terminal group in
compounds 4-10 also affects the E1/2 in that there is a significant shift (ca. 60-70 mV) to
more positive potentials when the methyl group at the apex of the cage is replaced by an

61
amino group. It is worth noting, however, that the E1/2 value does not change when
moving from the Gly-CSA to Gly-Gly-CSA and Gly-Ala-CSA derivatives if the group
(-CH3 or -NH2) at the apex is held constant. This implies that changing the nature of the
substituent beyond the initial –Gly- group does not affect the electronic environment
about the Co centre and therefore explains the absence of any significant differences
between diastereomers. The lack of an effect on the resulting E1/2 value is important
when considering the possible use of the complexes as electrocatalysts.
Figure 3.2 (a) Solution CVs of compounds 4 and 7 with GC working electrode at pH 7.3, versus Ag/AgCl (100 mVs-1, 0.1M NaClO4) (b) DPVs of the reduction processes (scan rate 20 mVs-1, pulse amplitude 50 mV).

62
3.6 Surface Electrochemistry
Preparation of gold microelectrodes modified by a film of one of the cage disulfides
was achieved using both conventional “self-assembly” (SAM) by soaking the electrodes
in aqueous solutions of the disulfides for 5 days, and via electrodeposition (EDM).18 All
surface cyclic voltammograms (CVs) were carried out in H2O and in the presence of 2
M NaClO4 as supporting electrolyte in order to minimize the iR drop. Determination of
the surface concentration of the cage was achieved via integration of the Faradaic peak
Table 3.2 Solution electrochemical data for compounds 4-10. All E1/2 values are referenced to the Ag/AgCl reference electrode. Scan Rate 100 mVs-1. Errors are the standard deviations from five measurements. Compound E1/2 (V) ∆E (V) Ia/Ic
2
3
4
5
6
7
8
9
10
-0.552(2)
-0.607(2)
-0.565(3)
-0.562(5)
-0.563(2)
-0.494(6)
-0.497(2)
-0.497(4)
-0.496(5)
0.074(3)
0.073(2)
0.12(1)
0.09(1)
0.09(1)
0.118(5)
0.122(2)
0.116(5)
0.15(1)
1
1
1
1
0.9
0.8
0.8
0.8
0.8

63
currents of the cyclic voltammograms. Some of the characteristics of the film are shown
in Table3.2.
During repeated experiments it became clear that the films that formed immediately
after the electrodeposition and washing steps displayed some unusual characteristics.
CVs performed on the fresh films often displayed very small or unobservable current
peaks corresponding to the cage species, and if they were present, the E1/2 values were
shifted to more negative potentials than the normal “equilibrium” potentials. It was
found that repeated cycling of the potential, at scan rates from 0.1-10 V s-1, for periods
of up to and above 30 min produced CVs that displayed sharper and more intense peak
currents, with a reduction in charging current (Figure 3.3). This effect could be
explained by a random distribution of molecules on the surface at the start of the
electrochemical experiment, which gradually re-arranges to give a more ordered film. It
is worth pointing out that the electrostatic repulsion between the cationic Co-conjugates
is likely to induce an initial disorder in the film as the Co headgroups maximize their
physical separation. Electrochemical cycling might allow greater penetration of the
anions into the film, and the enhanced charge neutrality would promote better packing
within the film. As the film becomes more ordered, the Co centers become more
thermodynamically homogeneous, which helps explain the reduction in peak half-
widths during the experiment. A more ordered film would also help to explain the lower
charging current observed with time, as a more effective “blocking layer” is formed. A
similar effect has been observed in films produced from immobilised Ni(II)/(III) redox
species21 whereby a reduction in capacitive current and sharper Faradaic current peaks
were observed with longer exposure times of the modified electrode to the disulfide

64
solution. To interpret the results, the authors proposed a process whereby an initially
random (disordered) film was replaced by a more ordered and compact film via
replacement of surface molecules present in defective sites with fresh molecules in
solution, whilst the total surface coverage (Γ) remained constant. Whilst replacement of
surface bound molecules with those in solution is clearly not possible here, if a surface
reorganisation effect is taking place, for example via surface migration of the gold
thiolate molecules22 or the potentially slow cleavage of the disulfide bond, the results
between the two experiments would be almost identical. It is worth noting that this
effect was more pronounced for the films produced by ED, when compared to those
prepared by SA, and this phenomenon may be explained by the relative rates at which
the two films are formed. Rapid film formation during ED might not allow the
molecules enough time to orient themselves on the surface, which could be exacerbated
by the negative potential “pulling” the cationic cage units to the surface, whereas the
long time and lack of applied potential in SA would overcome and obviate these effects
(Figure 3.4). Thus, in order to obtain stable and reproducible CVs, all freshly prepared
films were subjected to the above electrochemical treatment before the determination of
the electrochemical parameters shown Table 3.2.
Plotting the peak current against scan rate for monolayers of compound 4 prepared
using both SA and ED shows a linear relationship (Figure 3.5), which is expected for a
surface adsorbed species.23 These results indicate the successful immobilization of
compound 4 onto the gold surface using both ED and SA techniques.

65
Au Au
SS SSCo
CoCo
Co S
Co
S
Co
S
Co
S
Co
ElectrochemicalCycling
Figure 3.3 (a): Plot of repeated CVs versus time for compound 4 immediately after ED and washing (10 Vs-1) (Note: Potential axis reversed for clarity in (a) and (c)); (b): (a) viewed along the current/potential plane; (c): same as (a) but for SA; (d): (c) viewed along the current/potential plane.
Figure 3.4 Diagram illustrating the possible reorganization process leading to the observed increase in peak current and concomitant sharpening of peaks
(a) (b)
(c)
(d)

66
The stability of the monolayers was examined by repeated electrochemical cycling,
from the open circuit potential (ca. –100 mV) to –1000 mV with a scan rate of 100 Vs-1
(Figure 3.6). The signal due to the reduction of the surface-bound Co(III) conjugate
shows virtually no loss in signal intensity upon repeated cycling for 100 s, indicating a
stable monolayer has been formed.
Figure 3.5 (a): CV’s obtained at 50, 100, 150 and 200 Vs-1 for an EDM of compound 4; (b): Plot of peak current versus scan rate for monolayer in (a); (c): As in (a) but for SAM; (d): As in (b) but for the SAM.
(a) (b)
(c) (d)

67
As the data in table 3.3 indicates, the monolayers formed using both the ED and SA
techniques display very similar properties. The experimentally determined values for
both films are virtually identical. Both films exhibit a reversible reduction of the Co(III)
cage at Eº = -619(4) mV vs Ag/AgCl, which is anodically shifted compared to the
solution electrochemistry. The peak separation is non-zero but significantly reduced
compared to the solution electrochemistry, indicating potentially an increase in the
reversibility of the process on the surface.
This also signifies that there is some barrier for electron transfer through the spacer. As
would be expected, the molecular footprint is larger compared to the more compact and
Figure 3.6 Repeated electrochemical cycling for film of compound 4 (100 Vs-1).

68
neutral ferrocene conjugates.18, 24 This can rationalized considering the electrostatic
repulsion between the positively charged Co(III)-sarcophagine conjugates on the
surface, and the large Efwhm of ~ 200 mV is consistent with this, as theoretical
treatments25, 26 predict a broadening of Faradaic peaks when the film consists of
repulsive entities. However it is important to point out that the footprint and thus the
surface concentration for films deposited electrochemically and prepared by self-
assembly are identical. All of the experimentally determined values for E1/2, and
importantly, the surface concentration and the related specific area of the molecule are
in agreement between the two techniques. This shows that both methods can be used to
generate monolayers of the compounds on a gold electrode.
SAMs on Au-coated silicon wafers were also prepared, and the presence of a highly
polar moiety on the surface was demonstrated qualitatively by the higher wettability of
the modified surface with respect to water, compared to a bare unmodified substrate.
Evidence for a monolayer was obtained through the use of ellipsometry, which
indicated a film thickness of (7 ± 1 Å) which is lower than the value expected for a fully
extended molecule of compound 4 (ca. 15 Å). A low value for the film thickness could
be due to the molecules lying at an angle to the surface and/or poor surface coverage,
but it does suggest that the surface is modified by a monolayer and not a multilayer.
An XPS analysis of a SAM prepared on an Au coated silicon substrate of compound 4
was undertaken in order to define the nature of the adsorption of the compound onto the
gold surface. Disulfide chemisorption onto gold is generally believed to occur through a
process in which the disulfide bond is broken to give two chemically independent
molecules on the surface, bound as thiolates.22 Peaks corresponding to S, Co, N, O and

69
C are observed in the XPS spectrum which demonstrates the presence of compound 4
on the substrate. Figure shows the major peak in the S(2p) region at 162 eV, which is
consistent with the formation of an Au-S bond,27 allowing us to conclude that the
compound is bound as a thiolate on the surface. The Co binding energy of 781.5 eV is
higher than the reported binding energy of 780.5 eV for the related [Co(NO2)2sar]Cl328,
but does fall within the range of binding energy values for the Co(III) N6 complexes
[Co(en)3]Cl3 and [Co(NH3)6]Cl3 of 780.2 –781.8 eV28, 29, which indicates the cobalt is
present as Co(III).
Figure 3.7 (a): XPS of Co 2p3 region; (b): S 2p region

70
3.7 Conclusions
In this paper we have described the synthesis and solution electrochemical behavior of a
series of cobalt cage complexes bridged with short disulfide containing peptides. In this
way we have demonstrated the efficacy of this synthetic strategy which will allow us to
tune “tail” length in a number of applications. We have also shown that it is possible, at
least in one case, to immobilize a complex on a gold substrate utilizing the disulfide
linkage present. We believe that this undergoes facile cleavage to give initially species,
which lack ordering, and subsequent electrochemical cycling allows them to attain
thermodynamically stable surface ordering, although this phenomenon requires further
study.
The surface attachment of these peptide tethered sarcophagine complexes has allowed
us to form modified surfaces containing redox active centres and promise entry to an
exciting range of applications.
Acknowledgments
We thank the University of Western Australia for partial funding of this research. GLN
was the holder of an Australian Postgraduate Award.

71
3.8 References
1. Love, J. C.; Estroff, L. A.; Kriebel, J. K.; Nuzzo, R. G.; Whitesides, G. M. Chem.
Rev. 2005, 105, 1103-1169.
2. Daniel, M.-C.; Astruc, D. Chem. Rev. 2004, 104, 293-346.
3. Sargeson, A. M. Pure and Applied Chemistry 1986, 58, 1511-1522.
4. Sargeson, A. M. Coord. Chem. Rev. 1996, 151, 89-114.
5. Jensen, M. H.; Osvath, P.; Sargeson, A. M.; Ulstrup, J. J. of Electroanal. Chem.
1994, 377, 131-141.
6. Hupp, J. T.; Liu, H. Y.; Lay, P. A.; Petri, W. H. F.; Sargeson, A. M.; Weaver, M.
J. J. of Electroanal. Chem. and Interf. Electrochem. 1984, 163, 371-379.
7. Creaser, I. I.; Hammershoei, A.; Launikonis, A.; Mau, A. W. H.; Sargeson, A. M.;
Sasse, W. H. F. Photochem. and Photobiol. 1989, 49, 19-23.
8. Konigstein, C.; Mau, A. W. H.; Osvath, P.; Sargeson, A. M. Chem. Commun.
1997, 423-424.
9. Launikonis, A.; Lay, P. A.; Mau, A. W. H.; Sargeson, A. M.; Sasse, W. H. F. Sci.
Papers I.P.C.R. 1984, 78, 198-205.
10. Mau, A. W.-H.; Sasse, W. H. F.; Creaser, I. I.; Sargeson, A. M. Nouv. J. Chimie
1986, 10, 589-592.
11. Gahan, L. R.; Hambley, T. W.; Sargeson, A. M.; Snow, M. R. Inorganic
Chemistry 1982, 21, 2699-2706.
12. Burnet, S.; Choi, M.-H.; Donnelly, P. S.; Harrowfield, J. M.; Ivanova, I.; Jeong,
S.-H.; Kim, Y.; Mocerino, M.; Skelton, B. W.; White, A. H.; Williams, C. C.; Zeng, Z.-
L. Eur. J. Inorg. Chem. 2001, 1869-1881.
13. Paxinos, A. S.; Gunther, H.; Schmedding, D. J. M.; Simon, H. Bioelectrochem.
Bioenerg. 1991, 25, 425-436.
14. Harrowfield, J. M.; Koutsantonis, G. A.; Nealon, G. L.; Skelton, B. W.; White, A.
H. Eur. J. Inorg. Chem. 2005, 2384-2392.

72
15. Walker, G. W.; Geue, R. J.; Sargeson, A. M.; Behm, C. A. J. Chem Soc., Dalton
Trans. 2003, 2992-3001.
16. Donnelly, P. S.; Harrowfield, J. M.; Skelton, B. W.; White, A. H. Inorg. Chem.
2000, 39, 5817-5830.
17. Bodanszky, M.; Bodanszky, A., The Practice of Peptide Synthesis. Second ed.;
Springer-Verlag: Berlin, 1994.
18. Orlowski, G. A.; Chowdhury, S.; Long, Y.-T.; Sutherland, T. C.; Kraatz, H.-B.
Chem Commun 2005, 1330-1332.
19. Kraatz, H.-B. J. Inorg. Organomet. Polym. Mat. 2005, 15, 83-106.
20. Bond, A. M.; Lawrance, G. A.; Lay, P. A.; Sargeson, A. M. Inorg. Chem. 1983,
22, 2010-2021.
21. Gobi, K. V.; Okajima, T.; Tokuda, K.; Ohsaka, T. Langmuir 1998, 14, 1108-1115.
22. Ulman, A. Chem. Rev. 1996, 96, 1533-1554.
23. Bard, A. J.; Faulkner, L. R., Electrochemical Methods. Second ed.; John Wiley &
Sons: 2001.
24. Bediako-Amoa, I.; Sutherland, T. C.; Li, C.-Z.; Silerova, R.; Kraatz, H.-B. J.
Phys. Chem. B 2004, 108, 704-714.
25. Laviron, E. J. Electroanal. Chem. 1979, 100, 263-270.
26. Matsuda, H.; Aoki, K.; Tokuda, K. J. Electroanal. Chem. 1987, 217, 15-32.
27. Ishida, T.; Choi, N.; Mizutani, W.; Tokumoto, H.; Kojima, I.; Azehara, H.;
Hokari, H.; Akiba, U.; Fujihira, M. Langmuir 1999, 15, 6799-6806.
28. Achilleos, A. A.; Gahan, L. R.; Hambley, T. W.; Healy, P. C.; Weedon, D. M.
Inorganica Chimica Acta 1989, 157, 209-214.
29. Okamoto, Y.; Nakano, H.; Imanaka, T.; Teranishi, S. Bull. Chem. Soc. Jpn. 1975,
48, 1163.

73
CHAPTER 4 4 EVALUATION OF ELECTRON TRANSFER RATES IN
PEPTIDE FILMS: SIMPLIFIED CALCULATION AND THEORY
This chapter is based on the manuscript by G. A. Orlowski, H.-B. Kraatz. "Evaluation
of electron transfer rates in peptide films: Simplified calculation and theory".
Electrochim. Acta, 2006, 51, 2934-2937.
I am the main contributor to the manuscript. I have performed all electrochemical
experiments and calculations. The first draft of the manuscript was also prepared by
me. The final version of the manuscript was obtained in an iterative writing process
with my supervisor.
4.1 Connecting Text
Next in our investigations, it became necessary to extract electron transfer rate
information from the redox active peptide films prepared by electrochemical deposition
as described in the previous chapters. This chapter describes an electrochemical
approach to obtain electron transfer rates and reorganization energies for surface-bound
redox active ferrocene peptide conjugates. Cyclic voltammetry experiments performed

74
at 1000 Vs-1 were used to extract the electron transfer rates at various temperatures and
as a result reorganization energies for two ferrocene-modified peptide films [Fc-Gly-
CSA]2 and [Fc-Val-CSA]2 (CSA = cystamine) were estimated. The asymmetry in the
Tafel-like plot, which is not related to the dipole moment, was observed for the Val-
containing conjugate and suggests some additional effects which are investigated in
subsequent chapters.
The manuscript was reproduced with the permission from Elsevier B.V ® 2006. Text below is a verbatim
copy of the published material.

75
4.2 Introduction
The study of electron transfer processes in biological systems, such as proteins, DNA
and peptides, has received significant attention over the past two decades1-7. Marcus-
Hush theory provides the theoretical foundation for ET processes, which can be
described mathematically by an exponential dependence of the ET rate on the distance
between a donor and an acceptor8,9. Experimental studies of ET in small peptide models
has been studied in solution using photophysical or radiolysis methods to cause electron
transfer between a D-A pair.10-12 More recently solution electrochemical methods were
used to evaluate the dissociative ET in small peptides.13
With the advent of self-assembly of molecules on surfaces, ET from a redox center,
such as ferrocene (Fc), through the molecular spacer material can be probed by a variety
of electrochemical methods: CV14-21,29, CA22,23, ACV24,25, EIS20,21 and finally with
SECM26. For example, the electrochemistry of Fc-peptide films was reported in which
the peptides adopt a hydrogen bonded collagen-like structure. But instead of an
exponential relationship between the separation of the redox center from the electrode
surface, a linear distance dependence was observed, indicating that tunneling is not the
major mechanism in these systems.16,17 We recently reported on the facile formation of
peptide films by electrodeposition of disulfides onto a gold substrates and were able to
evaluate the ET process.14 In this contribution, we would like to outline the
electrochemical approach and draw attention to the asymmetry in the Tafel plots of thin

76
films prepared from the bioorganometallic conjugates [Fc-Gly-CSA]2 and [Fc-Val-
CSA]2 (CSA = cystamine).
4.3 Results and Discussion
In our approach we choose to evaluate film prepared from the Gly conjugate [Fc-Gly-
CSA]2, and the Val conjugate [Fc-Val-CSA]2 according to the electrodeposition method
described earlier.14 The Gly residue is expected to allow more flexibility of the peptide
spacer and potentially for a better film, while steric interactions between neighboring
the isopropyl groups of the Val residue should make for a more disordered film
(Scheme 4.1).
Scheme 4.1 Schematic view of films prepared of [Fc-Gly-CSA]2 and [Fc-Val-CSA]2 on the gold surface.

77
The CVs of films prepared by electrodeposition from 1 mM ethanolic solutions of [Fc-
Gly-CSA]2 and [Fc-Val-CSA]2 are shown in Figure 1. Both films exhibit a fully
reversible one-electron oxidation wave at EF = 460 mV for [Fc-Gly-CSA]2 and 490 mV
for [Fc-Val-CSA]2. The peak current ratios for both films are close to unity. The peak
separation for both systems at 1000 Vs-1 in room temperature is around 65-80 mV. The
peaks are broader than what would be for Nerstian behavior. However, peak broadening
in our case may be attributed to lateral intermolecular interaction, including H-bonding
between the peptide strands, the interaction of the Fc with the solvent or supporting
electrolyte (i.e. ion pairing, ClO4- as a counter ion or even surface roughness effects
(roughness factor in our case 1.1-1.2). In our simplified approach, we assume a near
ideal Nernstian behavior.
Figure 4.2 Left: CV for films of [Fc-Gly-CSA]2 (_____) and [Fc-Val-CSA]2 (……) using a gold microelectrode 25 µm radius, scan rate 1000Vs-1, Ag/AgCl, Pt-mesh counter. Right: iP vs scan rate for [Fc-Gly-CSA]2 (■) and [Fc-Val-CSA]2 (∆).

78
The linearity of a plot of scan rate versus the peak current iP for both films confirms the
absence of diffusive contributions and indicates the presence of surface bound
molecules only.
4.4 Evaluation of the Electron Transfer Kinetics
The Butler-Volmer formalism for surface bound electroactive species is described by:27
)( redboxf kknFAi Γ−Γ= (4.1)
We assume that for an electroactive couple Fc/Fc+ the process is Nernstian. Thus,
RTEEnF
b
f ekk )( 0−
= (4.2)
Ox + e- Red
Where E-E0 = η is overpotential, kf, and kb are the electron transfer rates for the forward
and backward processes.
By combining equation (4.2) with (4.1) equation (4.3) is obtained:
( ) ( )⎟⎟⎟
⎠
⎞
⎜⎜⎜
⎝
⎛ Γ−Γ=
RTnFredf
oxf
e
kknFAEi η
ηη)( (4.3)
Finally equation (4.4), which is the final expression for the calculation of the electron
transfer rate, useful for fast ET processes at a high scan rates.
( ) ( )( )Ek
enFA
Eif
RTnF
redox
=
⎟⎟⎟
⎠
⎞
⎜⎜⎜
⎝
⎛ Γ−Γ η
ηη
)( (4.4)
kf
kb

79
The average value from the oxidation and reduction of the surface bound peptide
provides the electron transfer rate kET.
2bf
ET
kkk
+= (4.5)
Extrapolation of the rate constant to zero overpotential provides kET from the Tafel plot.
Electron transfer rates obtained with this approach are given in Table 3.1.
Table 4.1: Summary of kET values obtained by cyclic voltammetry (CV) at 1000 Vs-1 and chronoamperometry (CA) and of the Fc-peptide surface concentrations.
kET (s-1) [CVat1000Vs-1]
kET (s-1) [CA] 14
Surface conc.[mol/cm2]14
[Fc-Gly-CSA]2 12.5x10³ 12.0x10³ 2.6x10⁻¹⁰ [Fc-Val-CSA]2 10.0x10³ 8.0x10³ 3.3x10⁻¹⁰
* Standard deviation 1.5x10³, room temperature, unoccupied space on electrode monitored by Au-oxidation was found to be 5-7%14.
Figure 4.3 ln kET ploted vs overpotential η according to Equation 4 at 293K. The slope for positive and negative η’s is described by the symmetry factor α. [Fc-Gly-CSA]2 (■) and [Fc-Val-CSA]2 (∆). kET calculated from CV at 1000 V/s
f b

80
We found the Laviron27 method not suitable for our purpose, since the ET
process is very fast (Ep < 200 mV even at 2000 V/s).
In case of [Fc-Gly-CSA]2, the Tafel plot is symmetrical with respect to the oxidation
and reduction (Figure 2), and indicates similar barriers for the forward and backward
electron transfer steps. For [Fc-Val-CSA]2 however, the forward and backward ET steps
are very asymmetric. We suggest the following explanation for this interesting
observation. Upon forward ET, ClO4- anions from the supporting electrolyte are closely
associated with the film and may even migrate into the film. For a well-ordered film it
may be expected that diffusion in and out of the film is not as strongly affected by a
change in the redox potential. For the Val-film, the bulkier, hydrophobic isopropyl
substitutents may not allow diffusion of polar solvent and ions from the solution into the
film, which may play an important role in the ET of the system.
In order to investigate this in more detail and obtain information about a potential
reorganization of the films, variable temperature studies were carried out and evaluated
using the Arrhenius equation (4.6), which related the activation energy for a process to
the rate constant for a particular reaction:
TkE
NAnETb
NAa
eAk,
,
−
= (4.6)
where, Ea,NA is activation energy, An,NA is the frequency factor or Arrhenius prefactor
for non-adiabatic reactions6, kET is standard rate constant for electron transfer reaction,
kb is the Boltzman constant and T is the temperature in Kelvin. With a good
approximation we can state that22:

81
4,λ
=NAaE (4.7)
where λ is the reorganization parameter.
The simplified method described above allow for a quick and convenient description of
important parameters regarding evaluated films on microelectrodes. This is especially
useful for short spacers (i.e. short peptides) and fast ET rates.
A representative series of Tafel plots for the forward and backward electron transfer
reaction for film of [Fc-Val-CSA]2 obtained over a temperature range of 263 – 323 K
are shown in Figure 3. We can observe significant differences in the oxidative and
reductive part of the plot. For example, the reduction of the Fc+ follows the expected
trend, whereas the oxidation reaction shows a kf not at the highest temperature of 323 K,
indicating potentially morphological changes in the film or may be the result of
Figure 4.4 Left: variable temperature Tafel plot for [Fc-Val-CSA]2 (Temperature from top to bottom: 323K, 313K, 293K, 273K, 263K). Right: Arhenius plot for both monolayers ([Fc-Gly-CSA]2 (■) and [Fc-Val-CSA]2 (∆)) where kET values were obtained from CV at 1000Vs-1.
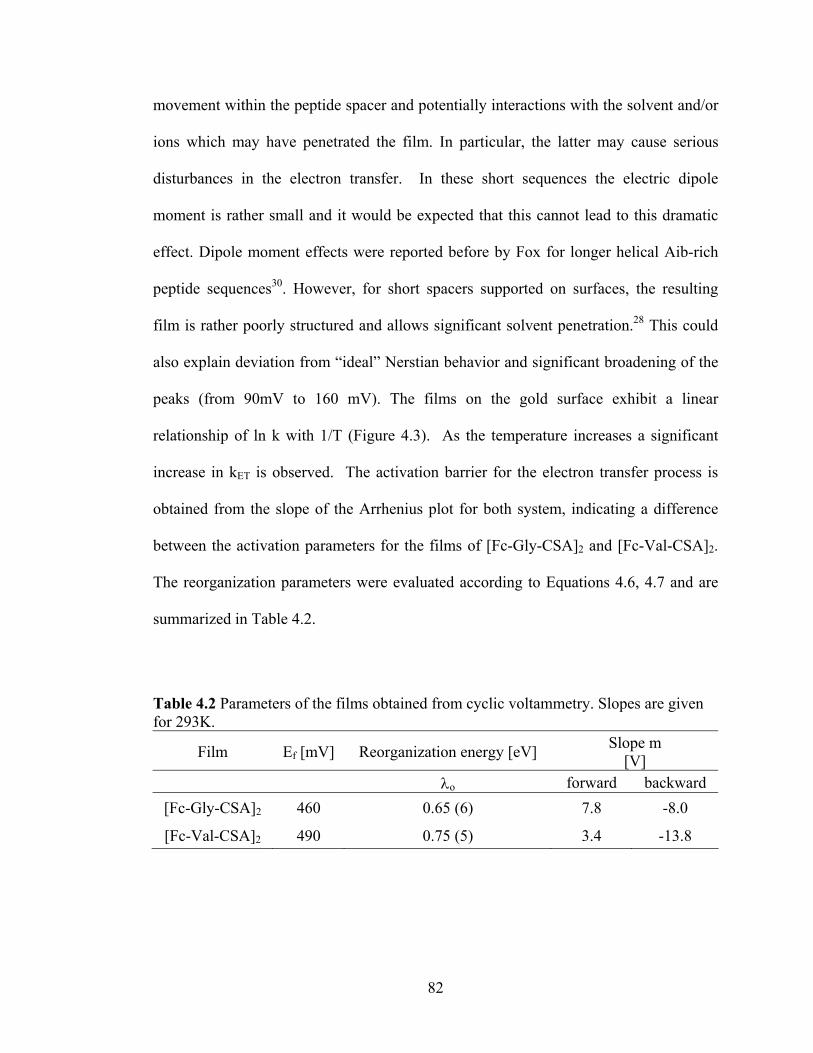
82
movement within the peptide spacer and potentially interactions with the solvent and/or
ions which may have penetrated the film. In particular, the latter may cause serious
disturbances in the electron transfer. In these short sequences the electric dipole
moment is rather small and it would be expected that this cannot lead to this dramatic
effect. Dipole moment effects were reported before by Fox for longer helical Aib-rich
peptide sequences30. However, for short spacers supported on surfaces, the resulting
film is rather poorly structured and allows significant solvent penetration.28 This could
also explain deviation from “ideal” Nerstian behavior and significant broadening of the
peaks (from 90mV to 160 mV). The films on the gold surface exhibit a linear
relationship of ln k with 1/T (Figure 4.3). As the temperature increases a significant
increase in kET is observed. The activation barrier for the electron transfer process is
obtained from the slope of the Arrhenius plot for both system, indicating a difference
between the activation parameters for the films of [Fc-Gly-CSA]2 and [Fc-Val-CSA]2.
The reorganization parameters were evaluated according to Equations 4.6, 4.7 and are
summarized in Table 4.2.
Table 4.2 Parameters of the films obtained from cyclic voltammetry. Slopes are given for 293K.
Film Ef [mV] Reorganization energy [eV] Slope m [V]
λo forward backward [Fc-Gly-CSA]2 460 0.65 (6) 7.8 -8.0
[Fc-Val-CSA]2 490 0.75 (5) 3.4 -13.8

83
4.5 Summary
In summary, we have investigated the electrochemical properties of two Fc-peptide
conjugate films, linked to a gold surface via an Au-S linkage, providing a simplified but
detailed procedure for obtaining kinetic information for the electron transfer process.
We found significant differences in the forward and backward electron transfer steps.
Since the peptides are short, these differences cannot be due to their electric properties
such as the dipole moment. Rather we expect that higher penetration of supporting
electrolyte and of solvent, in addition to solvation effects account for our observations.

84
4.6 References
1. P. Kaden, E. Mayer-Enthart, A. Trifonov, T. Fiebig, H.-A. Wagenknecht,
Angew. Chem., Int. Ed. 2005, 44, 1636.
2. M. K. Cichon, C. H. Haas, F. Grolle, A. Mees, T. Carell, J. Am. Chem. Soc.
2002, 124, 13984.
3. T. Morita, S. Kimura, S. Kobayashi, Y. Imanishi, J. Am. Chem. Soc. 2000, 122,
2850.
4. S. O. Kelley, N. M. Jackson, M. G. Hill, J. K. Barton, Angew. Chem., Int. Ed.
1999, 38, 941.
5. J. N. Richardson, S. R. Peck, L. S. Curtin, L. M. Tender, R. H. Terrill, M. T.
Carter, R. W. Murray, G. K. Rowe, S. E. Creager, J. Phys. Chem. 1995, 99, 766.
6. C. A. Widrig, C. Chung, M. D. Porter, J. Electroanal. Chem. 1991, 310, 335.
7. J. F. Smalley, S. B. Sachs, C. E. D. Chidsey, S. P. Dudek, H. D. Sikes, S. E.
Creager, C. J. Yu, S. W. Feldberg, M. D. Newton, J. Am. Chem. Soc., ACS ASAP.
8. N. S. Hush, Electrochim. Acta 1968, 13, 1005.
9. R. A. Marcus, J. Chem. Phys. 1956, 24, 966.
10. Y.-G. K. Shin, M. D. Newton, S. S. Isied, J. Am. Chem. Soc. 2003, 125, 3722.
11. A. Fedorova, A. Chaudhari, M. Y. Ogawa, J. Am. Chem. Soc. 2003, 125, 357.
12. R. A. Malak, Z. Gao, J. F. Wishart, S. S. Isied, J. Am. Chem. Soc. 2004, 126,
13888.
13. S. Antonello, F. Maran, Chem. Soc. Rev. 2005, 34, 418.
14. G. A. Orlowski, S. Chowdhury, Y.-T. Long, T. C. Sutherland, H.-B. Kraatz,
Chem. Comm. 2005, 1330.
15. S. A. Serron, W. S. Aldridge, III, C. N. Fleming, R. M. Danell, M.-H. Baik, M.
Sykora, D. M. Dattelbaum, T. J. Meyer, J. Am. Chem. Soc. 2004, 126, 14506.
16. H.-B. Kraatz, I. Bediako-Amoa, S. H. Gyepi-Garbrah, T. C. Sutherland, J. Phys.
Chem. B 2004, 108, 20164.

85
17. I. Bediako-Amoa, T. C. Sutherland, C.-Z. Li, R. Silerova, H.-B. Kraatz, J. Phys.
Chem. B 2004, 108, 704.
18. H.-B. Kraatz, Macromolecular Symposia 2003, 196, 39.
19. H. O. Finklea, J. Phys. Chem. B 2001, 105, 8685.
20. S. Sek, A. Sepiol, A. Tolak, A. Misicka, R. Bilewicz, J. Phys. Chem. B 2004,
108, 8102.
21. S. Sek, R. Moszynski, A. Sepiol, A. Misicka, R. Bilewicz, J. Electroanal. Chem.
2003, 550-551, 359.
22. J. F. Smalley, H. O. Finklea, C. E. D. Chidsey, M. R. Linford, S. E. Creager, J.
P. Ferraris, K. Chalfant, T. Zawodzinsk, S. W. Feldberg, M. D. Newton, J. Am. Chem.
Soc. 2003, 125, 2004.
23. J. F. Smalley, S. W. Feldberg, C. E. D. Chidsey, M. R. Linford, M. D. Newton,
Y.-P. Liu, J. Phys. Chem. 1995, 99, 13141.
24. H. O. Finklea, J. Electroanal. Chem. 2001, 495, 79.
25. D. A. Brevnov, H. O. Finklea, J. Electrochem. Soc. 2000, 147, 3461.
26. B. Liu, A. J. Bard, M. V. Mirkin, S. E. Creager, J. Am. Chem. Soc. 2004, 126,
1485.
27. E. Laviron, J. Electroanal. Chem., 1979, 101, 19–28
28. A. S. Viana, M. Kalaji, L. M. Abrantes, Langmuir, 2003, 19, 9542 -9544
29. T. M. Nahir, R. A. Clark, E. F. Bowden, Anal. Chem.; 1994, 66, 2595-2598
30. E. Galoppini, M. A., Fox J. Am. Chem. Soc. 1996, 118, 2299-2300

86
4.7 Supplementary Data
Figure 4S.1 Variable scan rate graph for [Fc-Gly-CSA]2 (2000, 1000, 250, 100 Vs-1)

87
CHAPTER 5 5 REORGANIZATION ENERGIES OF FERROCENE-PEPTIDE
MONOLAYERS
This chapter is based on the manuscript by G. A. Orlowski, S. Chowdhury, H.-B.Kraatz
“Reorganization energies of ferrocene-peptide monolayers”. This manuscript was
recently submitted for publication to Langmuir.
I am the main contributor to the manuscript. I have performed all electrochemical
experiments and calculations. I am also main author of the hypothesis. S. Chowdhury
provided compounds, synthesis of which is described elsewhere.
5.1 Connecting Text
In the previous chapter, the electron transfer rate constants and the reorganizational
energies for two Fc-peptide disulfide films were reported, showing an apparent effect on
the size of the amino acid side chain. There is very little information available as to the
effect of the individual amino acids on the electron transfer and none on their role on
the reorganizational energies in organized peptide films. Thus, to deepen our
understanding of the electron transfer process through the peptide backbone, we have
investigated a series of Fc-peptide conjugates immobilized on gold microelectrodes

88
using the general method described in Chapter 2. Electrochemical studies on these films
were carried out in the presence of a range of counter ions (BF4-, ClO4
-, PF6-), allowing
me to explore a possible connection between peptide film rigidity and reorganization
energy.
5.2 Introduction
Ferrocene terminated self-assembled monolayers are one of the most studied redox-
active assemblies on metal surfaces. These films have been extensively used as
convenient ensembles with well-defined composition, structure and thickness and can
serve as model systems to probe heterogeneous electron transfer (ET).1-4
A self-assembled monolayer with an electro-active headgroup can be described
essentially as a donor-acceptor system that is linked by a spacer. In this particular
arrangement, the electrode and the electro-active headgroup function as the donor
acceptor system separated by a spacer molecule.
Investigations have shown that the ET in peptides can occur across long distances
separating the donor from the acceptor.5, 6 The peptide secondary structure, as well as
the intramolecular hydrogen bonding network are known to affect the ET process.5, 7-9
Electrochemical investigations of peptides immobilized on gold surface have become a
practical way to study the electron transfer processes and to obtain important parameters
like molecular footprint on the surface,10 interfacial resistance,11, 12 capacitance,
activation and reorganization energies.13 It was demonstrated by Chidsay1 and others13
that the solvation energy of the ferrocene significantly contributes to the activation

89
energy and thus is affecting ET rate. The orientation of molecules one the surface and
its vast impact on the electron rate was described by Mirkin14 and Kaifer.15
Bilewicz and co-workers studied the effect of increasing glycine and alanine amino
acids in Fc-peptide films anchored to the gold electrode. Their STM (scanning-
tunneling microscopy) results indicated that poly-glycine films were structurally well
ordered and extremely well packed (specific area ∼30Å2).16 Similar surface
concentrations were observed for helical polyalanine films,17 and effects of the dipole
on the symmetry of the Tafel plot was also addressed.
Kimura and coworkers addressed the problem of an electron transfer mechanism by
working on very long helical peptides. By incorporating non-natural amino acids
containing naphthyl18 or ferrocene4, 19 residue in the side chain they were trying to find
the theory that will explain the nature of long-range electron transfer. “Hopping”
electron transfer mechanism was proposed.20 However, this mechanism is highly
contentious as the peptides lacking specific amino acids (e.g. Tyr, Trp) do not display
any redox activity in a biologically sensible regime. In a recent STM study, Kimura and
coworkers21 observed that long helical peptides are able to change the length depend on
the applied potential.
The electrochemical properties of helical Fc-oligoprolines were investigated in our
research group.22 Oligoprolines are unable to form intra- or inter-strand H-bonding
patterns and create inflexible structure. This aspect was used to provide some insight
into the complicated mechanism of the ET process. In this system a linear relationship
between distance and electron transfer rate was found. In another publication collagen-
like peptides (Pro-Pro-Gly unit), which are structurally related to oligoprolines, were

90
used to explain the effect of inter-strand and intermolecular H-bonding influence on ET
process.23 Interestingly, the effect of the repulsion between Fc head-groups and resultant
changes in film structure were observed. Theoretical investigation of molecular motion
on long helical structures showed that such formations could be extremely flexible.24
In results presented by Kimura, Bilewicz and from our own work, a significant issue
arises. How can one distinguish a purely electrochemical response from an
electrochemical signal distorted by a molecular motion of the molecules on the surface?
The time scale of the electron movement from the ferrocene to the gold surface through
the peptide spacer in most electrochemical experiments is often slower than the time
scale of molecular motions, especially when external electric field are applied, forcing
the molecule to align itself within the field gradient. Clearly, the dynamic properties of
the molecules have to be taken into account in order to describe the electron transfer
process correctly and one part of the puzzle is a proper description of the reorganization
energy of the system and its link to the dynamic properties of the system.
In this contribution, we report the results of a study into the re-organizational
parameters for a series of mono and di-substituted ferrocene-peptide conjugates. The
effect of rigidity of Fc-peptides on the electron transfer rate will be addressed by
evaluation of two types of compounds shown in Figure 5.1. In these systems, the
rigidity of the molecule is largely determined by the number of attachment points on the
gold surface. While the mono-substituted systems [Fc-Gly-CSA]2 (1), [Fc-Ala-CSA]2
(2), [Fc-Val-CSA]2 (3) and [Fc-Leu-CSA]2 (4)will be attached to the surface through
only one podant peptide chain, di-substituted systems Fc[Gly-CSA]2 (5), Fc[Ala-CSA]2
(6), Fc[Val-CSA]2 (7), Fc[Leu-CSA]2 (8), Fc[Gly-Val-CSA]2 (9), Fc[Gly-Ile-CSA]2

91
(10), and Fc[Ile-Ile-CSA]2 (11) will have both peptide chains linked to the Au surface,
enhancing its rigidity. In this study we are describing the results of a series of
electrochemical experiments testing the effects of counter-ions that associate with the
ferrocenium ion to varying degrees in order determine the factors responsible for the
sometimes atypical electron transfer rates that have been reported in the literature.
NH
SS
HN
O
O
HN
NH
O
O
FeFe
R
R
R = H (1) [Fc-Gly-CSA]2 R = Me (2) [Fc-Ala-CSA]2 R = Pr (3) [Fc-Val-CSA]2 R = iBu (4) [Fc-Leu-CSA]2
FeHN
NH
NH
HN
O
O
O
O
R
R
Fe
NH
HN
O
O
O
NHR2
HN
O
NH
HN
O
O
R2
Fc[Gly-Val-CSA]2Fc[Gly-Ile-CSA]2Fc[Ile-Ile-CSA]2
S
S
S
S
R = H (5)R = Me (6)R = iPr (7)R = iBu (8)
Fc[Gly-CSA]2Fc[Ala-CSA]2Fc[Val-CSA]2Fc[Leu-CSA]2
R1 = H, R2 = iPr (9)R1 = H, R2 = iBu (10)R1 = iBu, R2 = iBu (11)
R1
R1
Figure 5.1 Acyclic and cyclic ferrocene-peptide conjugates used in this study

92
5.3 Experimental
All Fc-peptide disulfides were immobilized on gold microelectrodes (diameter: 25 µm)
by modified potential assisted deposition25.
Initially, the microelectrode was pre-treated by cycling in 0.5 M H2SO4 proceeded by a
short oxidation for 0.5 s at 2 V (Figure 5.2). In subsequent stage of the preparation,
electrode was cycled in a negative potential range (-0.6 to -2.3 V) to remove all
remaining surface oxygen and cover the electrode with a layer of hydrogen atoms. The
removal of remaining oxygen is necessary, due to possibility of the reaction between
residual oxygen and disulfide compounds. Sulfonates produced in this instance will be
only weakly physisorbed on the gold surface, lowering total integrity of the deposited
films.
In a deposition step, potential of -1.5 V vs. W (tungsten quasi reference
electrode) was applied for 30 min (Figure 2). An Ag/AgCl reference electrode is not
suitable for the deposition function mainly due to chloride anion leakage, which can
significantly inhibit deposition of disulfide conjugates. 1 to 10 mM ethanolic solution of
Fc-peptide conjugates were used without presence of the supporting electrolyte.
Deposited films were ordered and tightly packed and showed surface concentrations of
the ferrocene in the regime of 2.3 to 4.6 *10-10 mol / cm2, which can be correlated to
the footprint ranging from 45 – 70 Å2 per molecule. An unoccupied surface, estimated
by CV in sulfuric acid, was estimated at 5-7 %.

93
All electrochemical experiments were carried out on a custom-built potentiostat
EDAS 301 (design and production by Prof A. Baranski, University of Saskatchewan)
and CHInstruments CHI660B. Variable temperature studies were conducted with a
custom-built Peltier cooler that allows a temperature control of ± 1 ºC. Tungsten wire
was used as a quasi-reference electrode to avoid film contamination with “leaking”
chlorides ions (potentials given in Table 1 are reported vs. Ag/AgCl) and Pt mesh as an
auxiliary electrode. Synthesis of the Fc-peptide conjugates used in this study is
described elsewhere.26, 27
Comparison of the electron transfer rates, reorganization energies and formal potentials
obtained for all the ferrocene peptide conjugates (1- 11) in different supporting
electrolytes (0.1 M NaClO4, 0.1 M NaBF4 and 0.1M NaPF6) is presented in the main
text of this manuscript.
Figure 5.2 A) Typical cyclic voltammogram of gold microelectrode in 0.5 M H2SO4 obtained during pretreatment step (10 Vs-1 potential versus Pt wire). B) Typical amperometric i-t curve obtained during electrodeposition process. Potential was set to -1.5 V vs. Tungsten wire
A B

94
Films were electrochemically characterized by variable temperature cyclic voltammetry.
Each experiment was repeated at least 5 times to ensure good reproducibility of the
obtained data. Values of electron transfer rates were obtained from CV performed at
1000 Vs-1. Simplified calculations were applied to evaluate reorganization energy.
Methodology used to calculate reorganization energy and electron transfer rates is
described elsewhere28 and is based on the theoretical description introduced by Smalley
et al3.
TkE
nETb
a
eAk−
= (5.1)
where, Ea is activation energy, An is the frequency factor or Arrhenius prefactor for non-
adiabatic reactions6, kET is standard rate constant for electron transfer reaction, kb is the
Boltzman constant and T is the temperature in Kelvin.
The calculations are based on two major assumptions: ET process is non-adiabatic and
electrochemical response is strictly Nerstian.
Equation used to estimate ET rate at 1000 Vs-1 is presented below:
( ) ( )⎟⎟⎟
⎠
⎞
⎜⎜⎜
⎝
⎛ Γ−Γ=
RTnFredf
oxf
e
kknFAEi η
ηη)( (5.2)
Where Γ is surface concentration, kf is a forward ET process, η is overpotential (E-E0).
I, n, F and A have their usual meanings.
5.4 Results and Disscussion
Figure 5.3 shows procedure for obtaining reorganization energies from cyclic
voltammetry at variable temperatures. Figure 5.3a presents typical cyclic
voltammograms (CVs) at five different temperatures. Peak height and broadness is

95
strongly affected signifying possible structural changes in the film. Figure 5.3b shows
the corresponding Tafel plots used to obtain the electron transfer rates. Figures 5.3c and
5.3d represent typical Arrhenius plots used to obtain values for reorganization energy.
Figure 5.3 (―) 313 K, (―) 303 K, (―) 293 K, (―) 283 K, (―) 273 K, A) Variable temperature cyclic voltammetry of surface bound Fc[Ileu-Ileu-CSA]2, 0.1 M NaClO4, 1000 Vs-1B) Tafel plot of lnkET vs η for (11) Fc[Ileu-Ileu-CSA]2 Electron transfer rate dependency on the temperature, calculated at 1000 V/s. C) Arhenius plot for monolayer of Fc[Ileu-Ileu-CSA]2 (11) (■) where kET values were obtained from CV at 1000 Vs-1. D) Arhenius plot for monolayers [Fc-Ala-CSA]2 (2) (■) and Fc[Ala-CSA]2 (6) (■) where kET values were obtained from CV at 1000 Vs-1.
C
A
D
B

96
The peak separation and peak broadness are strongly affected by the temperature. This
effect can be explained by orientation and morphological29 changes within the film. At
higher temperatures, increased molecular motion of the Fc-peptides may allow for more
simultaneous discharge and better ordering of the film (sharper peak and less diversity
within monolayer). We can hypothesize that at lower temperature, there will be less
molecular motion resulting in a number of local environments for the Fc groups, each
contributing to the broadening of the peak. The immobilized molecules will respond
slowly to any changes and the chance of simultaneous redox reaction will be smallest
leading to broad peaks and large peak separations. The films on the gold surface exhibit
a linear relationship of lnk versus 1/T (Figure 5.3d). As the temperature increases a
significant increase in kET is observed. The activation barrier for the electron transfer
process is obtained from the slope of the Arrhenius plot.
In Table 5.1, the formal potentials, the reorganization energies and the average electron
transfer rates in different supporting electrolytes for all Fc-peptide conjugates (1 - 11)
and are presented.

91
Table 5.1 Comparison of formal potentials, reorganization energies and kET`s of ferrocene peptide conjugates 1 - 11.
PF6- ClO4
- BF4-
Compoun
d E0 [mV] lnAn
[s-1] λ[eV] kET * 103
[s-1]
E0 [mV]
lnAn [s-1] λ [eV]
kET * 103
[s-1]
E0 [mV]
lnAn [s-1] λ [eV]
kET * 103
[s-1]
1 462 16.6 0.76 10.0 464 15.4 0.65 8.2 446 13.6 0.52 5.0
2 480 13.5 0.48 6.6 490 15.4 0.71 4.4 450 17.2 0.86 5.9
3 437 16.1 0.76 6.0 488 16.2 0.75 7.1 450 16.0 0.79 5.2
4 504 11.9 0.30 8.0 484 13.7 0.48 7.5 432 14.3 0.59 5.1
5 679 12.3 0.34 8.5 688 14.1 0.52 8.2 716 14.4 0.52 11.0
6 654 11.6 0.28 7.6 635 12.3 0.33 9.0 662 13.3 0.45 7.2
7 654 11.9 0.26 12.0 686 12.3 0.31 10.0 592 14.3 0.52 9.5
8 682 11.0 0.19 9.9 686 12.2 0.29 12.0 667 13.8 0.45 11.4
9 625 14.3 0.52 9.8 658 13.1 0.40 10.0 671 15.4 0.62 10.6
10 661 13.7 0.48 8.2 641 12.4 0.35 8.0 600 15.3 0.65 7.2
11 670 14.6 0.57 8.4 600 14.7 0.59 7.0 636 13.2 0.41 9.6 kET error = 1.0*103 s-1 , λ error = 0.06 eV, E0 error = 8 mV E0 is reported vs. Ag/AgCl, kET
is measured at 295 K
97

98
It is interesting to note that these systems display an unusual distance relationship.
Compared to ferrocene-alkanethiol monolayers in which the electron transfer rate kET is
decreasing exponentially with distance, kET for Fc-peptides investigated here, does not
follow the same distance relationship. For example, comparing the kET for compounds 9
- 11 to those of the shorter Fc-peptides, it is apparent that the rates are similar even
though the distance for these dipeptide conjugates almost doubled from 9 Å for the
shorter Fc-conjugates 1 – 8 to 15 Å (film thickness determined by ellipsometry).
Potentially the difference is caused by more extensive H-bonding in these longer
peptide conjugates.
The reorganization energy mainly depends on anionic solvation of the
ferrocene.30 The strength of the ion-pair created with Fc+ mainly depends on the
hydration level of the counter ion. The interactions with the Fc+ group are decreasing in
the following manner PF6- > ClO4
- > BF4-. The reorganization energy in the case of the
PF6- anion is smaller than that observed for BF4
-, which can suggests that the weakly
associated BF4- anions can easier penetrate deep into the film causing structural changes
and thus increases the reorganization energy of the system. Anions that associate more
strongly with the Fc+ cation, such as PF6-, will not penetrate the film and will maintain
strong interactions with the Fc+ cation, the result is a lower reorganization energy λ for
most systems investigated. The reverse order of the reorganization energy dependence
on counter-ion observed in the case of Gly containing films, it is likely to be caused by
difference in organization of the films. We can speculate that glycine containing Fc-
films are uniform throughout the surface providing H-bond saturated layer efficiently
affecting film response toward approaching counter-ions, where other compounds that

99
has side groups i.e methyl or propyl provide additional separation and limit H-bonding
interactions between neighboring molecules.7,9
λ in the case of the cyclic Fc-conjugates 5 - 8 is on an average lower by 30-50%
when compared to the acyclic Fc-peptide conjugates 1 – 4, containing the same amino
acid linker. Such behavior can be rationalized by evaluating the access of the counter-
ion to the ferrocenium moiety. In the case of cyclic compounds, access to the Fc/Fc+
moiety can be spatially limited thus resulting in lower reorganization energy. Impeded
access of the solvent and counter-ion to the Fc+ moiety provides a possible explanation
(Figure 4). In addition, the cyclic compounds 5 - 11 have limited degrees of freedom,
which reduce their surface dynamics. Especially important seems to be the freedom of
rotation, which is present in the case of conjugates 1 – 4, allowing a better interaction
with the approaching solvent/counter-ion molecules enabling it to change its orientation
Figure 5.4 Graphical visualization of the differences in the access areas of the counter ion to ferrocenium. Comparison of [Fc-Ala-CSA]2 (2) with Fc[Gly-Val-CSA]2 (9) ferrocene- peptide films.
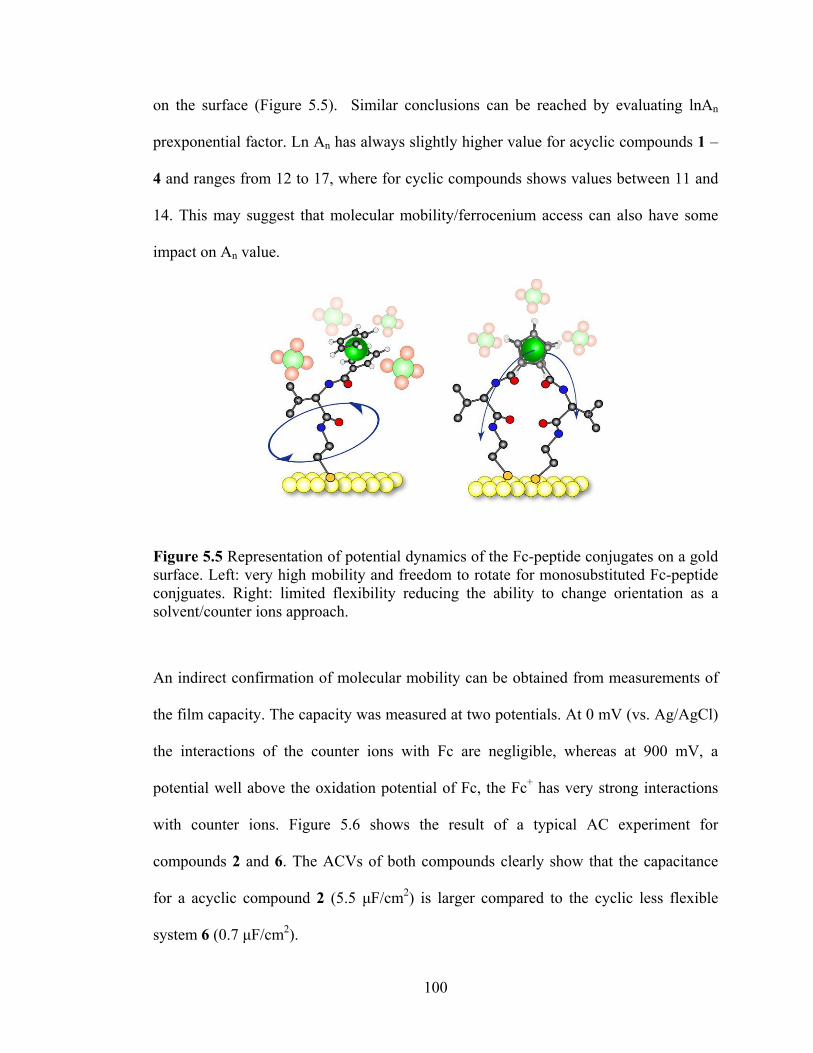
100
on the surface (Figure 5.5). Similar conclusions can be reached by evaluating lnAn
prexponential factor. Ln An has always slightly higher value for acyclic compounds 1 –
4 and ranges from 12 to 17, where for cyclic compounds shows values between 11 and
14. This may suggest that molecular mobility/ferrocenium access can also have some
impact on An value.
An indirect confirmation of molecular mobility can be obtained from measurements of
the film capacity. The capacity was measured at two potentials. At 0 mV (vs. Ag/AgCl)
the interactions of the counter ions with Fc are negligible, whereas at 900 mV, a
potential well above the oxidation potential of Fc, the Fc+ has very strong interactions
with counter ions. Figure 5.6 shows the result of a typical AC experiment for
compounds 2 and 6. The ACVs of both compounds clearly show that the capacitance
for a acyclic compound 2 (5.5 µF/cm2) is larger compared to the cyclic less flexible
system 6 (0.7 µF/cm2).
Figure 5.5 Representation of potential dynamics of the Fc-peptide conjugates on a gold surface. Left: very high mobility and freedom to rotate for monosubstituted Fc-peptide conjguates. Right: limited flexibility reducing the ability to change orientation as a solvent/counter ions approach.

101
Figure 5.6 AC Voltammetry of a) Fc[Ala-CSA]2 (6) b) [Fc-Ala-CSA]2 (2) The capacity change measured at 0 mV and 950 mV for a) ∆C = 0.7 µF/cm2 for b) 5.5 µF/cm2
Figure 5.7 Cyclic voltammograms of (----) Fc[Ala-CSA]2 (6) and (―) [Fc-Ala-CSA]2 (2). Scan rate 1000 Vs-1 in 0.1 M NaBF4 as a supporting electrolyte. Compound 2 shows significant phase separation (double oxidation peak) and broadened reduction peak.
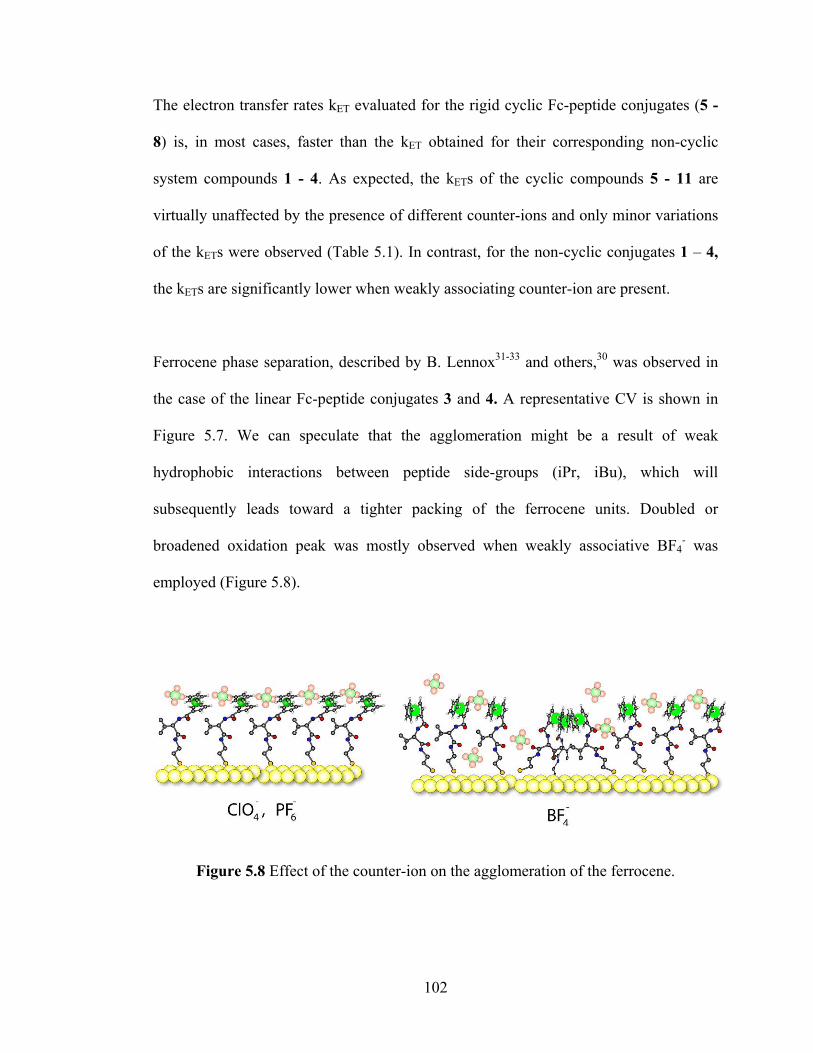
102
The electron transfer rates kET evaluated for the rigid cyclic Fc-peptide conjugates (5 -
8) is, in most cases, faster than the kET obtained for their corresponding non-cyclic
system compounds 1 - 4. As expected, the kETs of the cyclic compounds 5 - 11 are
virtually unaffected by the presence of different counter-ions and only minor variations
of the kETs were observed (Table 5.1). In contrast, for the non-cyclic conjugates 1 – 4,
the kETs are significantly lower when weakly associating counter-ion are present.
Ferrocene phase separation, described by B. Lennox31-33 and others,30 was observed in
the case of the linear Fc-peptide conjugates 3 and 4. A representative CV is shown in
Figure 5.7. We can speculate that the agglomeration might be a result of weak
hydrophobic interactions between peptide side-groups (iPr, iBu), which will
subsequently leads toward a tighter packing of the ferrocene units. Doubled or
broadened oxidation peak was mostly observed when weakly associative BF4- was
employed (Figure 5.8).
Figure 5.8 Effect of the counter-ion on the agglomeration of the ferrocene.

103
Weak interactions of the BF4- counter-ion with Fc+ were not able to disrupt the
aggregation of the Fc-conjugates on the surface. PF6- and ClO4
- anions were strongly
attracted to the Ferrocenium group and as a result more organized films were formed
and thus agglomeration was not possible (see Figure 5.8). An aggregation was not
observed with any of the cyclic Fc-peptide conjugates 5 – 11, suggesting again such
conjugates have limited flexibility/mobility of on the surface. The investigations on the
appearance of the double peak will be pursued further in the future. A possibility to
control aggregation by applying different counter-ion will be also investigated.
5.5 Summary
In this contribution, we have investigated the electron transfer properties of cyclic and
non-cyclic ferrocene-peptide cystamine conjugates, which differ in the number of
podant peptide substitutents and thus in the number of attachment point on the gold
surface. Cyclic systems have two peptide chains linking the Fc group to the surface,
making it more rigid compared to the non-cyclic analogue. We can hypothesize that this
in turn influences the electron transfer process.
In addition, we observed a significant influence in the electron transfer kinetics on the
nature of the counterion and its ability to associate with the ferrocene/ferrocenium
couple. Counterions were chosen for the ability to associate with the redox couple. BF4-
exhibits the weakest association while PF6- has the strongest interaction. The
reorganization energies for the Fc-peptide cystamine films exhibit the highest

104
reorganization trends for the BF4- counterion and the lowest for the PF6
- counterion. The
dynamics of the Fc-peptide cystamine conjugates on the surface as well as more
dramatic changes within the double layer that are associated with improved access of
counterions to the Fc+, were described. It is evident that electron transfer can be
strongly affected by three major parameters: molecular mobility of the peptide
conjugates on the surfaces, the strength of the ion-pair created between Fc+ and counter-
ion, as well as spatial access of the counter-ion to Fc+.
It was intriguing to note the aggregation of some of the Fc-peptide conjugates. This
clearly calls for additional investigations into this behavior since it appears that the
aggregation of the conjugates is potential dependent and can be controlled.
Acknowledgments
This work was supported by the National Science and Engineering Research Council of
Canada. H.-B.K. is Canada Research Chair in Biomaterials.

105
5.6 References
1. Chidsey, C. E. D. Science (Washington, DC, U. S.) 1991, 251, 919-922.
2. Finklea, H. O.; Yoon, K.; Chamberlain, E.; Allen, J.; Haddox, R. J. Phys. Chem.
B 2001, 105, 3088-3092.
3. Smalley, J. F.; Finklea, H. O.; Chidsey, C. E. D.; Linford, M. R.; Creager, S. E.;
Ferraris, J. P.; Chalfant, K.; Zawodzinsk, T.; Feldberg, S. W.; Newton, M. D. J. Am.
Chem. Soc. 2003, 125, 2004-2013.
4. Kitagawa, K.; Morita, T.; Kimura, S. Langmuir 2005, 21, 10624-10631.
5. Beratan, D. N.; Betts, J. N.; Onuchic, J. N. Science 1991, 252, 1285-1288.
6. Beratan, D. N.; Onuchic, J. N.; Winkler, J. R.; Gray, H. B. Science 1992, 258,
1740-1741.
7. Sek, S.; Maicka, E.; Bilewicz, R. Electrochim. Acta 2005, 50, 4857-4860.
8. Ogawa, M. Y.; Moreira, I.; Wishart, J. F.; Isied, S. S. Chem. Phys. 1993, 176,
589-600.
9. Kraatz, H.-B.; Bediako-Amoa, I.; Gyepi-Garbrah, S. H.; Sutherland, T. C. J.
Phys. Chem. B 2004, 108, 20164-20172.
10. Rowe, G. K.; Creager, S. E. Langmuir 1994, 10, 1186-1192.
11. Creager, S. E.; Rowe, G. K. J. Electroanal. Chem. 1997, 420, 291-299.
12. Weber, K.; Hockett, L.; Creager, S. J. Phys. Chem. B 1997, 101, 8286-8291.
13. Weber, K. S.; Creager, S. E. J. Electroanal. Chem. 1998, 458, 17-22.
14. Herr, B. R.; Mirkin, C. A. J. Am. Chem. Soc. 1994, 116, 1157-1158.
15. Wang, Y.; Cardona, C. M.; Kaifer, A. E. J. Am. Chem. Soc. 1999, 121, 9756-
9757.
16. Sek, S.; Moszynski, R.; Sepiol, A.; Misicka, A.; Bilewicz, R. J. Electroanal.
Chem. 2003, 550-551, 359-364.
17. Sek, S.; Tolak, A.; Misicka, A.; Palys, B.; Bilewicz, R. J. Phys. Chem. B 2005,
109, 18433-18438.
18. Watanabe, J.; Morita, T.; Kimura, S. J. Phys. Chem. B 2005, 109, 14416-14425.

106
19. Kitagawa, K.; Morita, T.; Kawasaki, M.; Kimura, S. J. Polym. Sci., Part A:
Polym. Chem. 2003, 41, 3493-3500.
20. Morita, T.; Kimura, S. J. Am. Chem. Soc. 2003, 125, 8732-8733.
21. Kitagawa, K.; Morita, T.; Kimura, S. Angew. Chem., Int. Ed. 2005, 44, 6330-
6333.
22. Galka, M. M.; Kraatz, H.-B. Chem. Phys. Chem. 2002, 3, 356-359.
23. Bediako-Amoa, I.; Sutherland, T. C.; Li, C.-Z.; Silerova, R.; Kraatz, H.-B. J.
Phys. Chem. B 2004, 108, 704-714.
24. Mandal, H. S.; Kraatz, H.-B. Chem. Phys. 2006, 326, 246-251.
25. Orlowski, G. A.; Chowdhury, S.; Long, Y.-T.; Sutherland, T. C.; Kraatz, H.-B.
Chem. Commun. 2005, 1330-1332.
26. Chowdhury, S.; Sanders, D. A. R.; Schatte, G.; Kraatz, H.-B. Angew. Chem., Int.
Ed. Engl. 2006, 45, 751-754.
27. Chowdhury, S.; Schatte, G.; Kraatz, H.-B. J. Soc. Chem. Dalton Trans. 2004,
1726-1730.
28. Orlowski, G. A.; Kraatz, H.-B. Electrochim. Acta 2006, 51, 2934-2937.
29. Sumner, J. J.; Creager, S. E. J. Phys. Chem. B 2001, 105, 8739-8745.
30. Valincius, G.; Niaura, G.; Kazakeviciene, B.; Talaikyte, Z.; Kazemekaite, M.;
Butkus, E.; Razumas, V. Langmuir 2004, 20, 6631-6638.
31. Lee, L. Y. S.; Lennox, R. B. Langmuir 2007, 23, 292-296.
32. Lee, L. Y. S.; Sutherland, T. C.; Rucareanu, S.; Lennox, R. B. Langmuir 2006,
22, 4438-4444.
33. Lee, L. Y. S.; Lennox, R. B. PhysChemPhys 2007, 9, 1013-1020.

107
CHAPTER 6 6 THE EFFECT OF ALKALI METAL IONS ON THE
ELECTROCHEMICAL BEHAVIOR OF FERROCENE-PEPTIDE CONJUGATES IMMOBILIZED ON GOLD SURFACES
This chapter is based on the manuscript by G. A. Orlowski, S. Chowdhury, H.-B.Kraatz
“The Effect Of Alkali Metal Ions On The Electrochemical Behavior Of Ferrocene-
Peptide Conjugates Immobilized On Gold Surfaces”. The manuscript was recently
submitted for publication to Electrochimica Acta.
I am the main contributor to this manuscript. I have performed all electrochemical
experiments and calculations as well as written the first draft of the manuscript. S.
Chowdhury provided all Fc-peptides, the synthesis of which is described elsewhere. The
final version of the manuscript was obtained in an iterative writing process with my
supervisor.
6.1 Connecting Text
In the previous chapter, the interactions of counter-ions with Fc-peptide conjugates
were described together with the reorganizational properties of the Fc-peptide films. In
this chapter effect of cations on the Fc-peptide films is investigated in detail in order to
provide a complete picture of the electrochemical properties of Fc-peptide films on gold
surfaces. Research on the electron transfer in DNA films suggested that cations can

108
significantly change the conductivity of the DNA double-strand. In this chapter, the
impact of different alkali metal cations on the electron transfer in peptide films was
explored. Notable changes in the ET caused by the presence of cations were observed.
Alkaline metals cations are found to affect surface organization of the Fc-peptide films
as well. This chapter completes the study of the electrochemical properties of Fc-
peptide films.
6.2 Introduction
Metal interactions with peptides and proteins are playing a crucial role in controlling
vital cell functions. In particular, interactions of Na+ and K+ are important in this
context. Protein-metal interactions involving Li+ are of pharmacological relevance.
Peptides offer a number of possible binding sites for metal ions. The metal binding
properties of amino acids and peptides are influenced by the steric properties of the
particular amino acid and of neighboring amino acids in the peptide chain[1, 2]. In the
absence of specific metal binding side chains, such as immidazole or carboxylates,
alkali metal ions coordinate to the amide carbonyl oxygens. Ab initial calculations of
the interactions of Gly with alkali metal ions showed that the free binding enthalpy
decreases on going from Li+ to Cs+.3 Alkali metal coordination to peptides can induce
significant conformational changes in the peptide structure, as is the case for K+-binding
to the cyclodepsipeptide valinomycin resulting in the formation of an octahedrally
coordinated K+-peptide complex. Calculations by Ma and Tsang clearly show that K+

109
binding to Gly-Gly and Ala-Ala causes significant structural changes in the dipeptide as
long as the coordination involved amide C=O groups[4].
In our research, we have been interested in exploiting ferrocene (Fc)-modified
peptides for monitoring the interaction with neutral substrates [5]. We recently reported
the interaction of a histidine conjugate with metal ions in solution and shown that
Li+ causes significant changes in the secondary structure of the Fc conjugate,
presumably due to the interaction with the proximal amide C=O [6]. At present, there are
no studies available of surface-bound Fc-peptide conjugates with metal ions. In present
study, we have focused on the investigation of the electrochemical behavior of Fc-
peptide conjugates bound to gold surfaces in the presence of the alkali metal series.
Films prepared from mono- and disubstituted Fc-peptide cystamine (CSA - H2N-
(CH2)2-S-S-(CH2)2-NH2) conjugates were compared: [Fc-Gly-CSA]2 (1), [Fc-Ala-
CSA]2 (2), [Fc-Val-CSA]2 (3), [Fc-Leu-CSA]2 (4), Fc[Gly-CSA]2 (5), Fc[Ala-CSA]2
(6), Fc[Val-CSA]2 (7), Fc[Leu-CSA]2 (8), Fc[Gly-Val-CSA]2 (9), Fc[Gly-Ile-CSA]2
(10), and Fc[Ile-Ile-CSA]2 (11) (see Figures 6.1 and 6.2).

110
NH
SS
HN
O
OHN
NH
O
O
NH
SS
HN
O
OHN
NH
O
O
NH
SS
HN
O
OHN
NH
O
O
NH
SS
HN
O
OHN
NH
O
O
[Fc-Gly-CSA]2 (1)
[Fc-Ala-CSA]2 (2)
[Fc-Val-CSA]2 (3)
[Fc-Leu-CSA]2 (4)
FeFe
FeFe
Fe
FeFe
Fe
Figure 6.1 Nomenclature and chemical drawings of the acyclic Fc-peptide compounds

111
FeHN
NH
NH
HN
O
O
O
OFe
HN
NH
NH
HN
O
O
O
OFe
HN
NH
NH
HN
O
O
O
O FeHN
NH
NH
HN
O
O
O
O
Fe
NH
HN
O
O
O
NH
HN
O
NH
HN
O
O
Fe
NH
HN
O
O
O
NH
HN
O
NH
HN
O
O
Fe
NH
HN
O
O
O
NH
HN
O
NH
HN
O
O
Fc[Gly-CSA]2 (5) Fc[Ala-CSA]2 (6)Fc[Val-CSA]2 (7)
Fc[Leu-CSA]2 (8)
Fc[Gly-Val-CSA]2 (9) Fc[Gly-Ile-CSA]2 (10)Fc[Ile-Ile-CSA]2 (11)
S
S
S
S
S
S
S
S
S
S
S
S
S
S
Figure 6.2 Nomenclature and chemical drawings of the cyclic Fc-peptide compounds
111

112
6.3 Experimental
All electrochemical experiments were carried out on a home-built potentiostat
(production and design Professor A. Baranski, University of Saskatchewan) and a CH
Instruments CHI 660B. Ag/AgCl (BAS) was used as a reference electrode and Pt mesh
as an auxiliary electrode. Synthesis of the compounds used in this study is described
elsewhere 7, 8
Electrodeposition method used in this study9 required a pre-treatment step in
which gold microelectrode was cycled in 0.5 M H2SO4 proceeded by an oxidation for
0.5 s at 2.0 V. In the final preparation step, the electrode was cycled in a negative
potential range (-0.6 to -2.3 V) to reduce all remaining surface oxygen and cover the
electrode with a layer of hydrogen atoms. Fc-peptide cystamine conjugates 1 - 11 were
immobilized on gold microelectrodes (diameter: 25 µm) by electrochemical deposition
method,9 using 10 mM solutions of Fc-peptides 1 – 11 in pure ethanol. A potential of
-1.8 V vs. Ag/Ag+ (quasi reference electrode) in the absence of supporting electrolyte
was applied for 30 min to the gold microelectrode. A silver wire was used as a quasi-
reference electrode instead typical Ag/AgCl reference electrode during the
electrodeposition step to avoid contamination of the gold surface with chlorides.
Presence of the chlorides (leaking from Ag/AgCl electrode) lowered Fc-peptide
concentration on the surface and quite often resulted in complete inhibition of the film
formation. Modified electrodes were washed with copious amounts of ethanol and water
then dried under a stream of nitrogen. Each experiment was repeated at least five times
to ensure high reproducibility. Electrodeposition, as described in reference 9, allowed

113
for fast deposition and provided tightly packed Fc-peptide films (Table 6.2). Fc-peptide
films obtained that way had improved surface organization and reproducibility when
compared to Fc-films obtained by typical “incubation” method.
Electrochemical scans were carried out using the Fc-peptide modified gold
microelectrode (25 µm) as a working electrode. Pt wire was used as a counter electrode
and a Ag/AgCl reference electrode (BAS, 3 M KCl) at a scan rate of 100 V s-1 and 1000
V s-1 in 50 mM HClO4 with the addition of 25 mM alkali metal perchlorate salt (XClO4,
X = Li+, Na+, K+, Rb+, Cs+). The concentration of metal alkali perchlorates was kept
below their respected maximum solubility. Addition of perchloric acid to alkali metal
solutions maintains a constant pH, as well as similar ionic strength throughout all
experiments.
6.4 Results and Discussion
It is well known that Fc immobilized on the surface is highly sensitive to counter
ions used as the supporting electrolyte.10, 11 In order to minimize counter-ion effects, we
kept the counter ions and its concentration approximately constant and varying the
concentration of cations by addition of the alkali metals perchlorates. Our experimental
data shows that the ClO4- concentration has only a small effect on the formal potential
of the Fc-peptide monolayers.

114
In 75 mM HClO4 solution, all Fc-peptide cystamine (CSA) films displayed a
fully reversible one electron oxidation at a scan rate of 100 Vs-1 and 1000 Vs-1
respectively. Figure 3 shows a set of typical CVs for the monosubstituted Fc derivative
[Fc-Gly-CSA]2 (1) and for the 1,n’-disubstituted Fc[Gly-CSA]2 (5). This redox response
is typical for the two monosubstituted Fc conjugates 1 and 2 and for the disubstituted
conjugates 5 – 11. Table 1 summarizes our experimental findings. The monosubstituted
Fc conjugates 1 – 4 exhibit formal potentials E0 between 385 to 415 mV versus
Ag/AgCl with peak separations ∆EP of 15 to 85 mV indicating facile electron transfer.
Figure 6.3 Fc-peptide film behavior in the presence of alkaline metals. CV of 1 [Fc-Gly-CSA]2 and 5 Fc[Gly-CSA]2 in 25 mM XClO4 / 50 mM HClO4 (―) X = Li+ ; (----) X = Rb+

115
Table 6.1 Formal potentials and peak separation values for a series of Fc-peptide films (data presented for CV collected at 100 Vs-1)
H Li Na K Rb Cs
Cm
pd E0 ∆E E0 ∆E E0 ∆E E0 ∆E E0 ∆E E0 ∆E
1 415 50 375 45 400 35 410 60 400 80 395 50
2 390 45 440 55 470 85 450 40 445 75 460 55
3 415 60 385 20 395 40 390 10 400 10 450 100
4 385 15 410 45 370 20 410 35 385 25 460 80
5 610 20 590 110 650 80 595 45 620 105 595 100
6 590 70 585 70 590 65 560 50 560 80 590 60
7 585 80 545 80 570 30 570 35 560 45 580 35
8 570 75 570 90 560 84 580 80 580 85 560 75
9 605 20 570 50 630 30 660 20 635 20 680 20
10 635 70 600 40 635 15 620 40 650 40 620 60
11 610 40 590 45 650 90 655 75 580 40 660 100
Errors: ∆E ±15 mV, E0 ±15 mV
The oxidation of the disubstituted Fc conjugates 5 – 11 is observed at more anodic
potentials as is expected for disubstituted ferrocenes in a potential range of E0 of 570 to
635 mV versus Ag/AgCl with larger peak separations ∆EP of 20 to 110 mV compared
to the monosubstituted systems.
Upon addition of metal perchlorate salts, the redox potentials E0 as well as the
peak shape and peak separation of the oxidation and reduction process are affected (see
Figures 3 and 4). The following changes may indicate structural changes within the film
in addition to changes in the kinetics of the electron transfer through the peptide linker.

116
Such electrochemical response might be also explained by differences in the
electrolyte/cation penetration into the film. Large ∆EP were observed for compounds 5
and 11 in the presence of Cs+.
Table 6.2 Surface concentrations of compounds 1 – 11 Compound Surface concentration
Γ × 10-10 (mol/cm2) 9
1 3.3 2 4.6 3 2.6 4 2.3 5 3.5 6 2.4 7 2.8 8 2.8 9 1.7 10 1.4 11 1.3
Error: ± 0.4 × 10⁻¹⁰ mol/cm2
It is interesting to note that the redox behavior of the two monosubstituted Fc
conjugates [Fc-Val-CSA]2 3 and [Fc-Leu-CSA]2 4 is more complex. Both Fc-
conjguates display a “double oxidation” (see Figure 4). Both conjugates possess bulky
hydrophobic side-chains (isopropyl for 3 and isobutyl for 4). The hydrophobic nature of
the side-chain may be responsible for a specific packing interaction on the surface
minimizing the exposure of these hydrophobic sidechains to water, presumably
resulting in association of these Fc-conjugates on the gold surface, effectively resulting
in a phase separation. Similar redox responses were reported by B. Lennox12-14 , C. E.
D. Chidsey15, Creager16-19 and others20-29 for Fc-alkanenthiols and were related to a
ferrocene agglomeration (similarly to Figure 6.5) occurring on the gold surface where

117
island-like Fc-agglomerated structures were suggested. Usually symmetrical
broadening, or even additional oxidation and reduction peaks were described. An
agglomerated Fc group has a different formal potential when compared with a Fc that it
is in not-agglomerated form, resulting in the appearance of additional second oxidation
and reduction peak. Importantly, the corresponding disubstituted Fc systems do not
exhibit such a redox behavior, presumably due to significantly lower mobility of the
molecules on the surface due to both peptide chains being linked to the Au surface. In
the case of monosubstituted conjugates 3 and 4, the mobility is less restricted allowing
the conjugates to cluster creating island-like features on the surface.
Interestingly cations introduced into the solution have feasible effect on the
electrochemical response. In the presence of alkali metal ions, the two redox signals are
affected differently (Figure 6.4), suggesting that metal ions interact differently with the
two different peptide environments present in the surface agglomerated peptide
conjugates. The presence of these cations in the solvent may even promote aggregation
(Figure 6.4).

118
In contrast to Fc-alkanethiol films, our Fc-peptide films of compounds 3 and 4 exhibit a
single reduction process. A possible explanation for this phenomenon is presented in
Figure 6.5 An agglomerated state is broken when the Fc group is oxidized and
significant repulsion occurs between the Fc+ groups. This repulsion may then result in a
redistribution of Fc-peptides on gold surfaces. We have observed significant repulsion
before in films of Fc-collagen conjugates30. In these systems, three Fc-peptide strands
are forming a supramolecular H-bonded helix, bringing the three Fc groups in close
proximity. Upon oxidation in Fc-collagens, the H-bonding interactions holding the three
individual strands together adjusts in an effort to accommodate the electrostatic
repulsion between the cationic Fc+ groups.30
Figure 6.4 Right: Cyclic voltammetry recorded at 100 Vs-1 for compound 3 in the presence of Li+ (), Na+ (), and Cs+ () perchlorate. Left: comparison of cyclic voltammograms recorded for compounds 3 and 7 at 100 Vs-1 in Cs+ containing solutions.
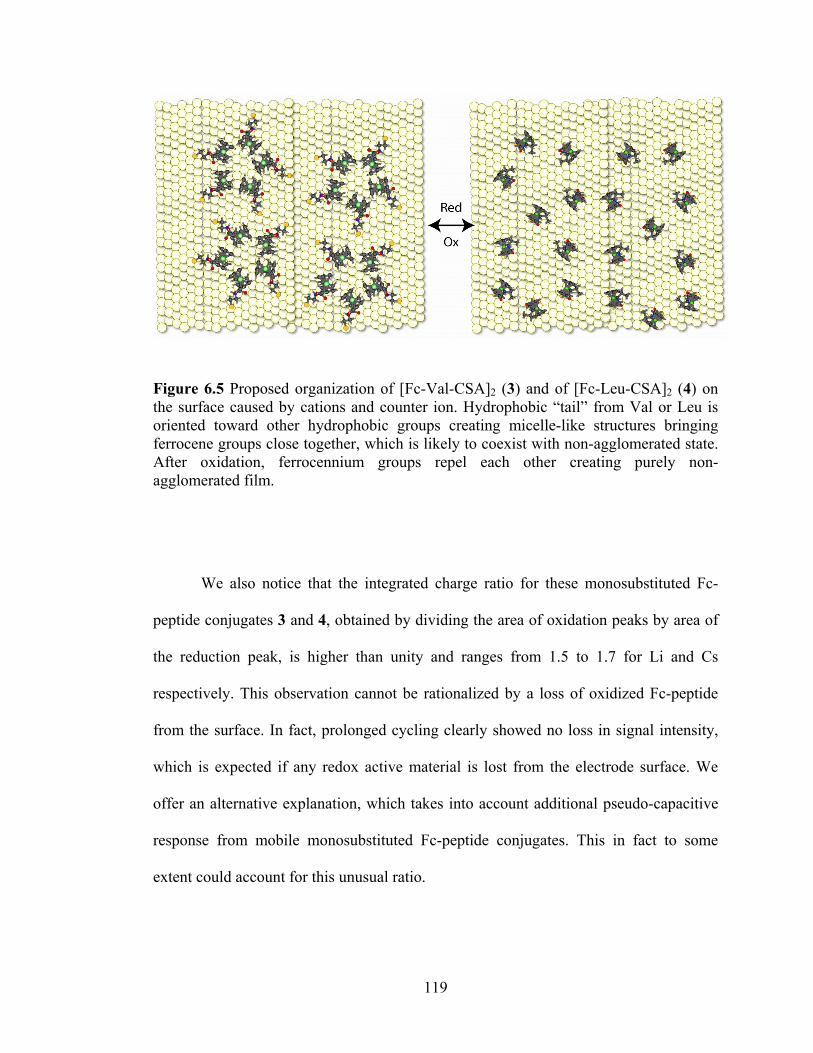
119
We also notice that the integrated charge ratio for these monosubstituted Fc-
peptide conjugates 3 and 4, obtained by dividing the area of oxidation peaks by area of
the reduction peak, is higher than unity and ranges from 1.5 to 1.7 for Li and Cs
respectively. This observation cannot be rationalized by a loss of oxidized Fc-peptide
from the surface. In fact, prolonged cycling clearly showed no loss in signal intensity,
which is expected if any redox active material is lost from the electrode surface. We
offer an alternative explanation, which takes into account additional pseudo-capacitive
response from mobile monosubstituted Fc-peptide conjugates. This in fact to some
extent could account for this unusual ratio.
Figure 6.5 Proposed organization of [Fc-Val-CSA]2 (3) and of [Fc-Leu-CSA]2 (4) on the surface caused by cations and counter ion. Hydrophobic “tail” from Val or Leu is oriented toward other hydrophobic groups creating micelle-like structures bringing ferrocene groups close together, which is likely to coexist with non-agglomerated state. After oxidation, ferrocennium groups repel each other creating purely non-agglomerated film.

120
Current of the second oxidation peak in each case showed linear dependency
with the scan rate. Peak separation between second oxidation wave and reduction ranges
from 100 mV at 100 Vs-1 to more than 300 mV at 1000 Vs-1. First oxidation wave
showed peak separation 10 to 100 mV depending on the peptide linker and cation
(Table 6.1) at 100 Vs-1. Differences in the peak separation were even smaller at 1000 V
s-1 and ranged between 125 and 200 mV.
Small variations in the differential capacity of the Fc-peptide films can be reported.
Lowest capacity of 8 ± 2 µF/cm2 was observed in solutions containing K+ and H+.
Highest capacity of 12 ± 2 µF/cm2 was observed in case of Na+ and Li+.
Table 6.3 Influence of alkaline cations on basic electrochemical parameters of the Fc-peptide film. kET values were determined at a scan rate of 1000 Vs-1 according to the procedure described elsewhere31.
kET [s-1] *103 ±1.5
cations Fc[Gly-CSA]2 Fc[Ile-Ile-CSA]2 H+ 9.0 11.5 Li+ 3.0 11.0 Na+ 4.5 8.0 K+ 7.0 8.0 Rb+ 6.0 12.0 Cs+ 3.5 6.5
Having observed an effect of cations on the electrochemical response for Fc-peptide
conjugates presumably by altering the structure of the Fc-peptides on the gold surface
raises the question if the presence of various cations can alter the electron transfer
kinetics in Fc-peptide films? We measured the electron transfer kinetics for two
disubstituted peptide systems Fc[Gly-CSA]2 (5) and Fc[Ile-Ile-CSA]2 (11). Table 6.2
summarizes the experimental results. Both films show significantly lower kETs in the

121
presence of Cs+. The difference between Rb and Cs cations is striking, showing an
almost twofold decrease in the ET rate for Cs+ compared to Rb+. The size of hydrated
Rb and Cs cation is identical and has an approximate size of 2.28 Å. We rationalize
these results by suggesting that the presence of cations alters the agglomeration and
orientation of the Fc-peptide conjugates on the surface, altering the observed electron
transfer kinetics. To the best of our knowledge, such effect was never observed before.
6.5 Summary
We have immobilized a series of Fc-peptide conjugates and investigated the
electrochemical response of these films in the presence of alkali metal cations Li+ to
Cs+. In some cases, significant changes in the redox responses were observed in the
form of changes in the formal potential E0 (for up to 100 mV) and in changes in the
peak separation ∆EP (up to 90 mV). Observed changes in electrochemical response can
be explained by invoking differences in film penetration by respected cations.
Two of the monosubstituted Fc-peptide systems investigated (3) and (4)
exhibited agglomeration on the surface, presumably due to the hydrophobic amino acids
Val and Leu, which causes association of the Fc-peptide conjugates on the surface to
form clusters and has been observed before for Fc-alkanethiols films. [Fc-Val-CSA]2
(3) and [Fc-Leu-CSA]2 (4) exhibit two oxidation waves but only a single reduction
wave. The appearance of the uncommon single reductive peak is explained by
proposing increased mobility of the monosubstituted Fc-peptide compounds and a
redistribution of the systems on the surface due to electrostatic repulsion between the

122
Fc+ groups. The presence of alkali metal ions alters the ability of the Fc-peptides to
aggregate on the surface or by changes in the orientation of the Fc group in the film,
which in turn affects the observed rate of electron transfer.
Acknowledgement
This work was supported by the National Science and Engineering Research Council of
Canada. H.-B.K. is the Canada Research Chair in Biomaterials.
6.6 References
1. M. Remko, B. M. Rode, J. Phys. Chem. A 2006, 110, 1960-1967.
2. A. H. Eder, S. Saetia, B. M. Rode, Inorg. Chim. Acta 1993, 207, 3-10.
3. S. Hoyau, G. Ohanessian, Chemistry Eur. J. 1998, 4, 1561-1569.
4. C. H. S. Wong, N. L. Ma, C. W. Tsang, Chemistry. Eur. J. 2002, 4909 – 4918.
5. P. Saweczko, G. D. Enright, H.-B. Kraatz, Inorg. Chem. 2001, 40, 4409-4419.
6. S. Chowdhury, G. Schatte, H.-B. Kraatz, Eur. J. Inorg. Chem. 2006, 988-993.
7. S. Chowdhury, D. A. R. Sanders, G. Schatte, H.-B. Kraatz, Angew. Chem., Int.
Ed. 2006, 45, 751-754.
8. S. Chowdhury, G. Schatte, H.-B. Kraatz, Dalton. Trans. 2004, 1726-1730.
9. G. A. Orlowski, S. Chowdhury, Y.-T. Long, T. C. Sutherland, H.-B. Kraatz,
Chem. Commun. 2005, 1330-1332.
10. P. D. Beer, P. V. Bernhardt, J. Chem. Soc., Dalton Trans. 2001, 1428-1431.
11. P. D. Beer, J. J. Davis, D. A. Drillsma-Milgrom, F. Szemes, Chem. Commun.
2002, 1716-1717.
12. L. Y. S. Lee, R. B. Lennox, Phys. Chem. Chem. Phys. 2007, 9, 1013-1020.
13. L. Y. S. Lee, R. B. Lennox, Langmuir 2007, 23, 292-296.

123
14. L. Y. S. Lee, T. C. Sutherland, S. Rucareanu, R. B. Lennox, Langmuir 2006, 22,
4438-4444.
15. C. E. D. Chidsey, C. R. Bertozzi, T. M. Putvinski, A. M. Mujsce, J. Am. Chem.
Soc. 1990, 112, 4301-4306.
16. G. K. Rowe, S. E. Creager, Langmuir 1991, 7, 2307-2312.
17. S. E. Creager, K. Weber, Langmuir 1993, 9, 844-850.
18. G. K. Rowe, S. E. Creager, Langmuir 1994, 10, 1186-1192.
19. G. K. Rowe, S. E. Creager, J. Phys. Chem. 1994, 98, 5500-5507.
20. E. Sabatani, I. Rubinstein, J. Phys. Chem. 1987, 91, 6663-6669.
21. D. M. Collard, M. A. Fox, Langmuir 1991, 7, 1192-1197.
22. K. Uosaki, Y. Sato, H. Kita, Langmuir 1991, 7, 1510-1514.
23. K. Weber, S. E. Creager, Anal. Chem. 1994, 66, 3164-3172.
24. T. Kondo, M. Takechi, Y. Sato, K. Uosaki, J. Electroanal. Chem. 1995, 381,
203-209.
25. J. N. Richardson, S. R. Peck, L. S. Curtin, L. M. Tender, R. H. Terrill, M. T.
Carter, R. W. Murray, G. K. Rowe, S. E. Creager, J. Phys. Chem. 1995, 99, 766-772.
26. J. N. Richardson, G. K. Rowe, M. T. Carter, L. M. Tender, L. S. Curtin, S. R.
Peck, R. W. Murray, Electrochim. Acta 1995, 40, 1331-1338.
27. G. K. Rowe, M. T. Carter, J. N. Richardson, R. W. Murray, Langmuir 1995, 11,
1797-1806.
28. Y. Sato, F. Mizutani, K. Shimazu, S. Ye, K. Uosaki, J. Electroanal. Chem.
1997, 434, 115-119.
29. J. J. Calvente, R. Andreu, M. Molero, G. Lopez-Perez, M. Dominguez, J. Phys.
Chem. B 2001, 105, 9557-9568.
30. I. Bediako-Amoa, T. C. Sutherland, C.-Z. Li, R. Silerova, H.-B. Kraatz, J. Phys.
Chem. B 2004, 108, 704-714.
31. G. A. Orlowski, H.-B. Kraatz, Electrochim. Acta 2006, 51, 2934-2937.
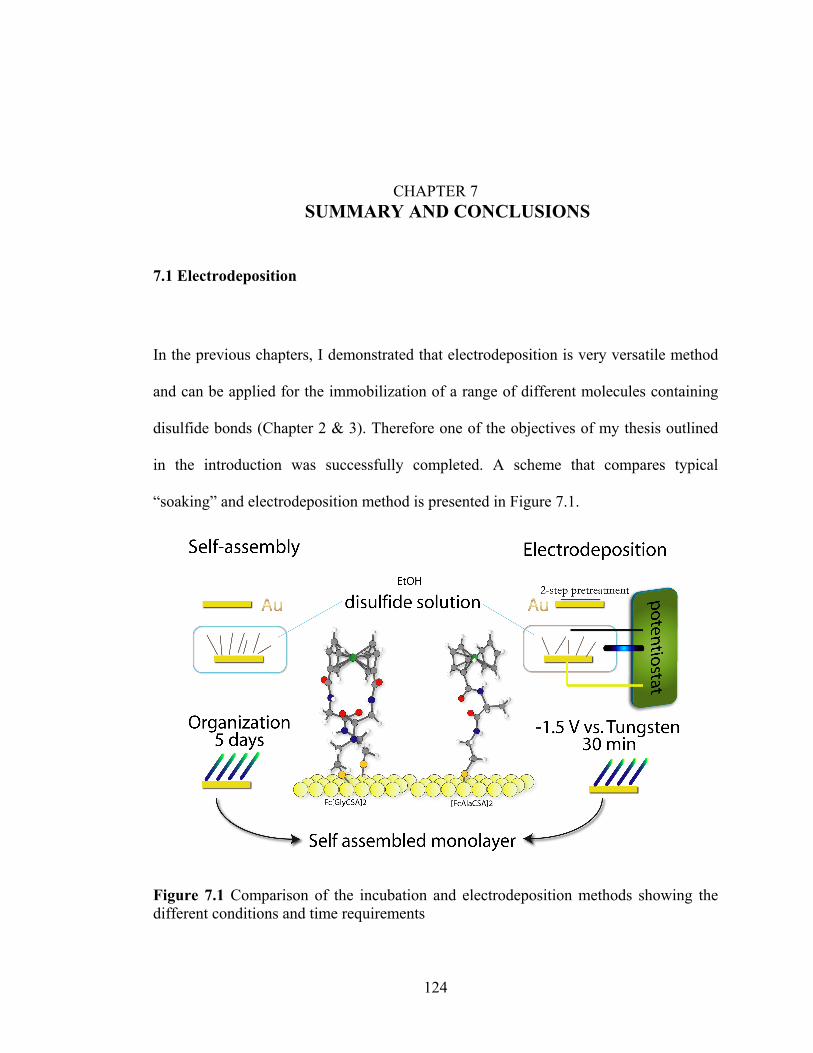
124
CHAPTER 7 7 SUMMARY AND CONCLUSIONS
7.1 Electrodeposition
In the previous chapters, I demonstrated that electrodeposition is very versatile method
and can be applied for the immobilization of a range of different molecules containing
disulfide bonds (Chapter 2 & 3). Therefore one of the objectives of my thesis outlined
in the introduction was successfully completed. A scheme that compares typical
“soaking” and electrodeposition method is presented in Figure 7.1.
Figure 7.1 Comparison of the incubation and electrodeposition methods showing the different conditions and time requirements

125
Films prepared by electrochemical deposition were tightly packed and well ordered.
However, it was also shown in chapters 3 and 4 that the electrodeposition process in
cases of amino acid residues with bulky alkyl chains (valine and leucine) can cause
additional structural changes and lack of organization of the film. This method allows
significant time to be saved, especially when compared to the typical self-assembly by
the lengthy immersion of an electrode surface in a disulfide solution. The
electrodeposition method developed for disulfides in this thesis should find widespread
application for the deposition various films derived from disulfides on gold surfaces. In
Figure 7.2, the electrochemical responses of the electrodeposited mixed films are
presented.
Figure 7.2 Two examples of electrochemically deposited mixed monolayers. Left: CV of mixed cyclic Fc[Ala-CSA]2 and acyclic [Fc-Ala-CSA]2. Right: CV of the monolayer composed of Co-sar and [Fc-Ala-CSA]2.

126
Rapid and efficient deposition of the various single and mixed disulfide modified
compounds should enable a completely new section of surface chemistry to become
readily accessible. For example, this method may enable the rapid and efficient
assembly of a range of disulfide-containing molecules onto surfaces that can be
screened for their performance in solar energy conversion. Surface preparation and
screening by traditional incubation methods would not be time efficient. Thus, the
electrodeposition method described in this thesis will help to shorten significantly the
time required and in addition, the films will have improved packing. This may facilitate
research in molecular electronics, biosensing and molecular devices.
7.2 Electron Transfer and Peptide Films
In this thesis, it was successfully established that the current description of ET in
peptides may not be sufficient and further development in this field should take into the
account additional parameters. It was shown that electron transfer is mainly affected by
hydrogen bonds. The effect of hydrogen bonding is mostly detectable in the case of
glycine containing Fc-peptide conjugates. Such compounds are known to engage in
inter- and intramolecular hydrogen bonding.1-3 Both cyclic and acyclic compounds
showed identical ET rate 8.2*103 s-1 when ClO4- was used as the supporting electrolyte
(Chapter 5). These results suggest that H-bonding is one of major parameters affecting
ET, similarly to the observations made by Bielewicz2, 3 and Kraatz.4 H-bonding present
in Fc-Gly systems: Fc[Gly-CSA]2 (two attachments with surface) versus [Fc-Gly-CSA]2
(only single connection with surface) was able to overcome differences in ET

127
originating from the variations in flexibility of the molecules on the surface. A
comparison of the reorganization energies (Chapter 5) for both of these compounds
(0.65 eV in ClO4- and 0.52 eV in BF4
- for acyclic [Fc-Gly-CSA]2 and 0.52 eV in ClO4-
and BF4- for Fc[Gly-CSA]2 ) further supports the hypothesis that H-bonding can affect
ET by actually limiting dynamics of the molecules on the surface. For an immobilized
molecule to change the orientation and engage in interactions with the counter-ion, it
has to overcome H-bonding from the neighboring glycine containing conjugates.
Interestingly, longer Fc-peptide conjugates with a glycine subunit that engage in intra-
molecular H-bonding5 exhibit unusually fast ET rates (1*104 s-1 for Fc[Gly-Val-CSA]2
and 8*103 s-1 for Fc[Gly-Ile-CSA]2). For these longer peptide conjugates, it is expected
that the ET rate will significantly decrease with the distance. However, our
experimental results indicate otherwise. The evidence presented in chapter 5 provides
important auxiliary information that H-bonding may indeed be a major parameter
governing ET in peptides.
It was also shown that the number of the attachments of the Fc-peptide conjugate on a
gold surface has a tremendous effect on the ET rate. The best example to illustrate this
influence is to compare two Fc-peptide conjugates that are containing alanine as a
bridging element. [Fc-Ala-CSA]2 is linked to the gold surface with a single Au-S-
peptide linkage, while the integrity of Fc[Ala-CSA]2 is maintained linking it to the gold
surface with two Au-S-peptide linkages The electron transfer rate for Fc[Ala-CSA]2,
which is attached with two peptide wires to the gold surface, is more then two times
higher with a kET of 9.0*103 s-1, compared to the kET of [Fc-Ala-CSA]2, which is
4.4*103 s-1 and has only single connection with the gold surface. The effect of

128
rigidity/counter-ion access on the reorganization energy can be also observed in this
example. The reorganizational energy due to the increased freedom to rotate6, 7 and re-
arrange towards the approaching molecules of the counter-ion is always higher in the
case of acyclic compound ([Fc-Ala-CSA]2 0.71 eV versus 0.33 eV for the more
constrained Fc-[Ala-CSA]2). This observation important suggests that the dynamic
properties of the molecules on the surface is affecting to the observed ET rates. The
unusual ET rates can be explained by introducing considering the dynamic properties of
the molecules on the surface as was suggested by other researchers.8, 9
The proximity of the bulky hydrophobic groups is strongly affecting not only the ET
rate but also the reorganization energy. The shielding of the ferrocene is the best
observable for [Fc-Leu-CSA]2 and Fc[Leu-CSA]2. Both compounds have the lowest
reorganization energy of all Fc-conjugates, determined at 0.48 eV and 0.29 eV in ClO4-.
An even smaller reorganization energy was observed in strongly associating counter-ion
PF6- 0.30 eV for acyclic and record low 0.19 eV for cyclic conjugate. Interestingly
electron transfer rates were one of the fastest observable 8.0*103 and 1.2*104 s-1 for
cyclic conjugate. This result seems to indicate that counter-ions are one of factor
influencing the ET rate. The effect on the ET of the buried, in alkene chains, ferrocene
groups was reported before.10 The results presented in chapter 5 strongly suggest that
not only exposure of the ferrocene to the incoming counter-ions is important but also
neighboring hydrophobic groups that are able significantly impede Fc-peptide film
penetration by counter-ions and therefore the ET process are of relevance. The
observations described above are significantly enhancing our knowledge about solvent
and counter-ions effect imposed on Fc-conjugated films. This knowledge could be
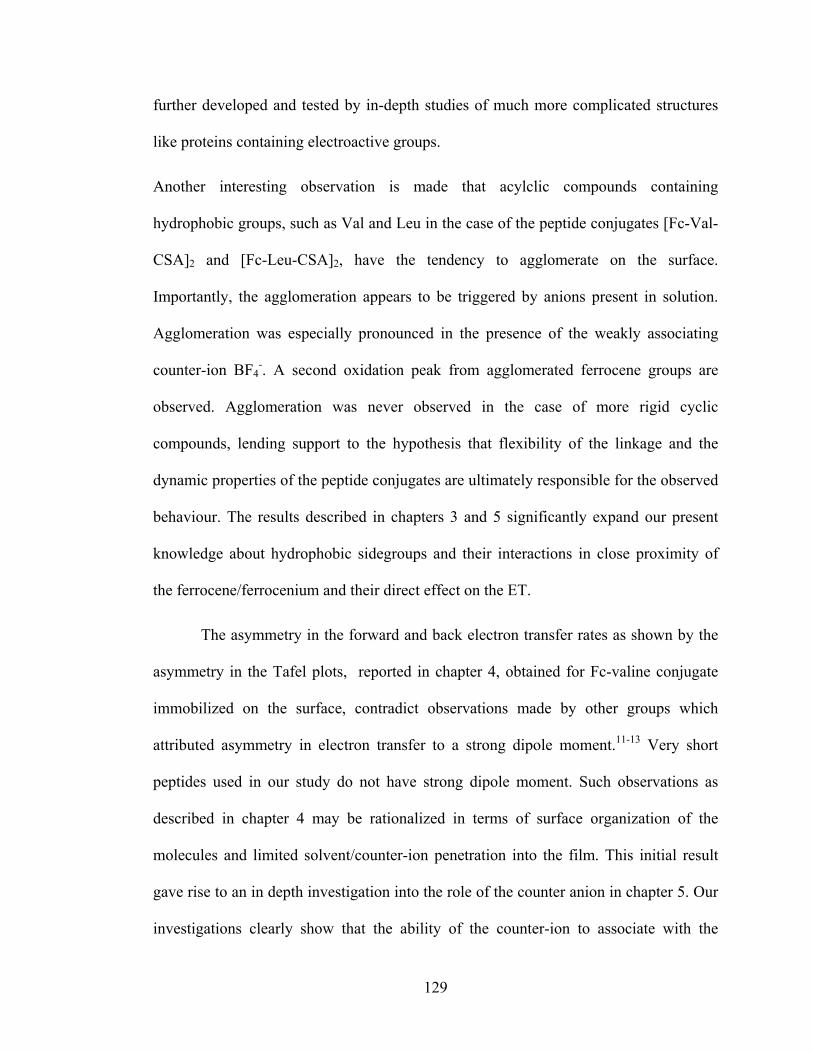
129
further developed and tested by in-depth studies of much more complicated structures
like proteins containing electroactive groups.
Another interesting observation is made that acylclic compounds containing
hydrophobic groups, such as Val and Leu in the case of the peptide conjugates [Fc-Val-
CSA]2 and [Fc-Leu-CSA]2, have the tendency to agglomerate on the surface.
Importantly, the agglomeration appears to be triggered by anions present in solution.
Agglomeration was especially pronounced in the presence of the weakly associating
counter-ion BF4-. A second oxidation peak from agglomerated ferrocene groups are
observed. Agglomeration was never observed in the case of more rigid cyclic
compounds, lending support to the hypothesis that flexibility of the linkage and the
dynamic properties of the peptide conjugates are ultimately responsible for the observed
behaviour. The results described in chapters 3 and 5 significantly expand our present
knowledge about hydrophobic sidegroups and their interactions in close proximity of
the ferrocene/ferrocenium and their direct effect on the ET.
The asymmetry in the forward and back electron transfer rates as shown by the
asymmetry in the Tafel plots, reported in chapter 4, obtained for Fc-valine conjugate
immobilized on the surface, contradict observations made by other groups which
attributed asymmetry in electron transfer to a strong dipole moment.11-13 Very short
peptides used in our study do not have strong dipole moment. Such observations as
described in chapter 4 may be rationalized in terms of surface organization of the
molecules and limited solvent/counter-ion penetration into the film. This initial result
gave rise to an in depth investigation into the role of the counter anion in chapter 5. Our
investigations clearly show that the ability of the counter-ion to associate with the

130
ferrocenium cation has a tremendous effect on the reorganization energy of the system.
Previous reports by Razumas14 and Leech15 described only shifts of the formal potential
without any in dept analysis of the parameters governing the electrochemical response
of the Fc-films. In essence, the stronger the interaction of the counter-ion with the
ferrocenium cation, the lower the organization energy. Values for λ between 0.2 and 0.3
eV for the PF6- and 0.4 - 0.5 eV for weakly associating BF4
- in a case of cyclic Fc-
conjugates were observed. Accordingly, the acyclic compounds had λ value between
0.3 - 0.7 eV for the strongly associating anion PF6- and between 0.5 – 0.9 eV for the
weakly associating anion BF4-. Interestingly, the changes in the reorganization energy
were always higher for the more flexible acyclic molecules. For example, for. [Fc-Ala-
CSA]2 λ increases from 0.48 eV in PF6- to 0.86 eV in BF4
-, while the increases in λ for
the cyclic and more ridig Fc[Ala-CSA]2 are significantly lower (λ = 0.28 eV for PF6-
and 0.45 eV for BF4-). Interestingly, the fastest ET rates were always observed for the
strongly associating PF6- counter-ion. Experimental data presented in this thesis clearly
indicate that the association between the counter-ion and the ferrocenium cations affects
the film dynamics. Based on this result, it can be concluded that the ordering of the
molecules within the film and/or the dynamic properties of the individual molecules
have a direct effect not only on the observed ET rates but also on the reorganization
energy of the system. These results carry enormous importance that should enhance our
understanding of the parameters governing ET in proteins.
In my research described in Chapter 6, I was able to demonstrate that the
presence of different cations can significantly affect the observed ET rate of the system.
Li+ and Cs+, through completely different mechanism, were able to cause major changes

131
in the organization of the Fc-peptide films. Valine and leucine-containing films were
prone to agglomeration in the presence of Li+ or Cs+. The CVs for these Fc-peptide
films exhibit a second oxidation wave characteristic of systems that agglomerate on the
surface. The organization of the molecules agglomeration was affecting the measured
ET rates mainly by affecting dynamic properties of the molecules on the gold surface.
Cyclic compounds showed major changes in the redox potential as well as
oxidation/reduction peak separation. Gaining control over the agglomeration of the
molecules on the surface may provide a method for the construction of “smart”
switchable materials. Clearly, this has to be investigated in more detail but it can be
envisioned that cation-triggered structural changes maybe be a valuable contribution
leading to new stimuli-responsive films.. A more immediate application may be to
exploit this property for the construction of peptide-based cation detectors.
As described in chapters 2, 4, and 5, the interactions that are occurring between
neighboring molecules, like H-bonding between glycine subunits or the agglomeration
of the ferrocenes caused by lateral hydrophobic associations between bulky valine and
leucine side-chains, were responsible in a significant way for the reorganization
energies and ET rates in the Fc-peptide films. This information should guide future
researchers toward better understanding of the dynamic properties of peptide based
films.
The major objectives of this work were achieved, and in summary we can
conclude that in the literature8, 9, 16, 17 some important parameters (peptide
mobility/flexibility, strength of the ion pairing, interactions with neighboring molecules,
cation interactions) that are affecting the ET process in peptides were overlooked. Work

132
described in this thesis provides a deeper understanding of the electron transfer process
through peptide chains and a better understanding of the behavior and properties of Fc-
peptide films. Even a small change in the side-chain of the peptide (-methyl group
exchanged for iso-butyl) can cause dramatic changes not only in the ET rate but also in
the film surface organization. A small change in the concentration or addition of
different cation can be directly responsible for unusual electrochemical response that
was observed.

133
7.3 References
1. Sek, S.; Moszynski, R.; Sepiol, A.; Misicka, A.; Bilewicz, R., J. Electroanal.
Chem. 2003, 550-551, 359-364.
2. Sek, S.; Sepiol, A.; Tolak, A.; Misicka, A.; Bilewicz, R., J. Phys. Chem. B 2004,
108, 8102-8105.
3. Sek, S.; Maicka, E.; Bilewicz, R., Electrochim. Acta 2005, 50, 4857-4860.
4. Bediako-Amoa, I.; Sutherland, T. C.; Li, C.-Z.; Silerova, R.; Kraatz, H.-B., J.
Phys. Chem. B 2004, 108, 704-714.
5. Chowdhury, S.; Sanders, D. A. R.; Schatte, G.; Kraatz, H.-B., Angew. Chem.,
Int. Ed. 2006, 45, 751-754.
6. Viana, A. S.; Jones, A. H.; Abrantes, L. M.; Kalaji, M., J. Electroanal. Chem.
2001, 500, 290-298.
7. Viana, A. S.; Abrantes, L. M.; Jin, G.; Floate, S.; Nichols, R. J.; Kalaji, M.,
Phys. Chem. Chem. Phys. 2001, 3, 3411-3419.
8. Morita, T.; Kimura, S., J. Am. Chem. Soc. 2003, 125, 8732-8733.
9. Malak, R. A.; Gao, Z.; Wishart, J. F.; Isied, S. S., J. Am. Chem. Soc. 2004, 126,
13888-13889.
10. Sumner, J. J.; Creager, S. E., J. Phys. Chem. B 2001, 105, 8739-8745.
11. Fox, M. A.; Galoppini, E., J. Am. Chem. Soc. 1997, 119, 5277-5285.
12. Fujita, K.; Bunjes, N.; Nakajima, K.; Hara, M.; Sasabe, H.; Knoll, W., Langmuir
1998, 14, 6167-6172.
13. Sek, S.; Tolak, A.; Misicka, A.; Palys, B.; Bilewicz, R., J. Phys. Chem. B 2005,
109, 18433-18438.
14. Valincius, G.; Niaura, G.; Kazakeviciene, B.; Talaikyte, Z.; Kazemekaite, M.;
Butkus, E.; Razumas, V., Langmuir 2004, 20, 6631-6638.
15. Ju, H.; Leech, D., Phys. Chem. Chem. Phys. 1999, 1, 1549-1554.
16. Isied, S. S.; Ogawa, M. Y.; Wishart, J. F., Chem. Rev. (Washington, DC, U. S.)
1992, 92, 381-394.
17. Miura, Y.; Kimura, S.; Imanishi, Y.; Umemura, J., Langmuir 1998, 14, 6935-
6940.

134
APPENDIX A 8
135

136

137

138

139

140