labour market measures in poland 2008–13: the … poland 6 t he overall picture of the polish...
TRANSCRIPT

POLAND
AuthorPawel Gajewski
Labour Market Measures in Poland 2008–13:
The Crisis and Beyond

2 POLAND
Copyright © International Labour Organization 2015 First published 2015
Publications of the International Labour Office enjoy copyright under Protocol 2 of the Universal Copyright Convention. Nevertheless, short excerpts from them may be reproduced without authorization, on condition that the source is indicated. For rights of reproduction or translation, application should be made to ILO Publications (Rights and Licensing), International Labour Office, CH-1211 Geneva 22, Switzerland, or by email: [email protected]. The International Labour Office welcomes such applications.
Libraries, institutions and other users registered with a reproduction rights organization may make copies in accord-ance with the licences issued to them for this purpose. Visit www.ifrro.org to find the reproduction rights organ-ization in your country.
Pawel Gajewski
Labour market measures in Poland 2008–13: The crisis and beyond / Pawel Gajewski; International Labour Office, Research Department. – Geneva: ILO, 2015
ISBN 978-92-2-129776-5 (web pdf)
International Labour Office Research Dept.
labour market policy / employment security / unemployment benefit / promotion of employment / wages / employment policy / trend / Poland
13.01.2
Also available for France ISBN 978-92-2-129762-8 (web pdf); Germany ISBN 978-92-2-129770-3 (web pdf); Greece ISBN 978-92-2-129766-6 (web pdf); Italy ISBN 978-92-2-129772-7 (web pdf); Ireland ISBN 978-92-2-129768-0 (web pdf); Netherlands 978-92-2-129782-6 (web pdf); Poland ISBN 978-92-2-129776-5 (web pdf); Spain ISBN 978-92-2-129778-9 (web pdf); Sweden ISBN 978-92-2-129780-2 (web pdf); United Kingdom ISBN 978-92-2-129760-4 (web pdf).
A synthesis report of the above monographs entitled Inventory of labour market policy measures in the EU 2008–13: The crisis and beyond is also available. ISBN 978-92-2-130246-9 (print pdf); ISBN 978-92-2-130247-6 (web pdf)
The designations employed in ILO publications, which are in conformity with United Nations practice, and the pres-entation of material therein do not imply the expression of any opinion whatsoever on the part of the International Labour Office concerning the legal status of any country, area or territory or of its authorities, or concerning the delimitation of its frontiers.
The responsibility for opinions expressed in signed articles, studies and other contributions rests solely with their authors, and publication does not constitute an endorsement by the International Labour Office of the opinions expressed in them.
Reference to names of firms and commercial products and processes does not imply their endorsement by the International Labour Office, and any failure to mention a particular firm, commercial product or process is not a sign of disapproval.
ILO publications and digital products can be obtained through major booksellers and digital distribution platforms, or ordered directly from [email protected]. For more information, visit our website: www.ilo.org/publns or contact [email protected].
This publication was produced by the Document and Publications Production, Printing and Distribution Branch (PRODOC) of the ILO.
Graphic and typographic design, layout and composition, electronic publishing and distribution.
PRODOC endeavours to use paper sourced from forests managed in an environmentally sustainable and socially responsible manner.
Code: WEI
ILO Cataloguing in Publication Data

3Contents POLAND
ContentsIntroduction 6
1. Employment and unemployment trends 81.1 Trends at aggregate level 81.2 Employment developments at sectoral level 121.3 Labour market status of different groups 131.4 Employment and unemployment at regional level 201.5 Part-time and temporary employment 201.6 Overtime 231.7 Firm creation and survival 24
2. Contractual arrangements and Employment Protection Legislation (EPL) 272.1 General background 272.2 Debate on atypical forms of work in the context of employment protection legislation 282.3 Changes in EPL caused by the economic crisis 32
3. Unemployment benefits, social insurance and social assistance 353.1 Unemployment benefit regulations during the crisis period 353.2 Protection of vulnerable unemployed persons 373.3 Additional measures in reaction to the crisis 393.4 Unemployment benefit eligibility and labour market flows 413.5 Social assistance available for the unemployed 43
4. Wages 464.1 General trends 464.2 Wage-fixing mechanism 504.3 Special measures aimed at counteracting the effects of the economic crisis 544.4 Other factors influencing wage changes 55

4Contents POLAND
5. Active labour market policies 575.1 Changes in the ALMP legal framework 575.2 ALMP – general framework and current rules 605.3 Importance and effectiveness of labour market programmes during the crisis period 62
Conclusion 71
References 73

5Abbreviations POLAND
Abbreviations
CEECs Central and Eastern European Countries
CPI Consumer Price Index
CSO/GUS Central Statistical Office
EDP Excessive Deficit Procedure
EPC Specific requirements for collective dismissals
EPL Employment Protection Legislation
EPR Protection of permanent workers against (individual) dismissal
EPRC Protection of permanent workers against individual and collective dismissals
EPT Regulation on temporary forms of employment
HR Human Resources
LAU Local Administrative Units
LFS Labour Force Survey
MPiPS Ministry of Labour and Social Policy
MW Minimum Wage
NACE Nomenclature générale des activités économiques dans la Communauté européenne (Statistical classification of economic activities in the European Community)
NBP National Bank of Poland
NGO Non-Governmental Organization
NRP National Reform Programme
NLI National Labour Inspectorate
PFRON State Fund for Rehabilitation of Disabled Persons
PLN Polish zloty
WIG Warsaw Stock Exchange Index

6Introduction POLAND
The overall picture of the Polish labour market has been shaped by outcomes of the economic tran-
sition, which started in the early 1990s. First, rapid privatization and capital inflows induced remarkable technology and productivity improvements, which gen-erated fast, albeit jobless growth. Second, deindustrial-ization and the collapse of many outdated industries (large parts of the heavy and textile industries, automo-tive production and many more) and quick emergence of the service sector created an environment of rapidly shifting labour demand, to which the labour supply encountered major difficulties in adjusting. Many of the unemployed were lost among the new rules and got discouraged from entering the labour market, while the state offered no aid to help them return to employment. As a consequence, high structural unemployment and a low participation rate have become immanent features of the labour market in the last two decades. At the same time, the social security and pension systems remained “full of holes”, which was widely seen as attractive and a relatively easy way of securing subsistence for those excluded from the labour market.1
For those who were able to adjust to the new rules, as well as for the increasing number of youth, the growing economy offered good opportunities, especially in financial and other commercial services. The EU entry provided another opportunity for youth to seek better jobs outside Poland, notably in the UK and Ireland.
In 2008, Poland was an economy in full swing. Strong growth performance in 2006 and 2007 had its effect on job creation, even though employment dynamics lagged behind GDP growth. Nonetheless, while the 15 per cent growth of employment between 2004 and 2008 reduced the number of unemployed persons by almost 65 per cent, it did not have any visible effect on the his-torically low labour participation rate. On the contrary, 2007 saw its lowest rate in the post-communist era. One of the causes of the shrinking labour supply has been the
1. Pawel Gajewski is a researcher at the Faculty of Economics and Sociology, University of Lodz, Poland.
migration of young, mobile workers to other EU coun-tries. According to Central Statistical Office (GUS) estimates, between 2004 and 2007, 1.27 million people (around 7.5 per cent of the active population) had left Poland. All in all, the impressive decline of the un-employment rate (from 19.1 per cent in 2004 to 7.1 per cent in 2008) started to exert increasing pressure on inflation, which climbed to 4.2 per cent in 2008, well above its official NBP target, despite the sequence of policy rate hikes, initialized in the spring of 2007, and weakening activity in the main trading partners.
The global financial crisis, in its initial phase, only had a limited impact on the Polish economy. At the begin-ning, in the second half of 2008, it could have been tracked mainly in capital markets. Indeed, the long-lasting exchange rate appreciation trend was violently reversed and, by early 2009, the Polish zloty had lost some one-third of its value with respect to the euro. The Warsaw stock exchange was affected even earlier: the WIG index peaked in mid-2007 and then declined by about 70 per cent until the spring of 2009.
Eventually, as the recession spread within the Eurozone in the course of 2009, Polish exports declined, despite the ongoing substantial improvement in its price com-petitiveness. Shrinking external demand and the down-turn in confidence indicators resulted in the slowdown of investment activity in Polish enterprises. The private enterprise sector was further damaged by losses on cur-rency options, which had been commonly misused. In the generally deteriorating environment, private demand remained fairly robust, also due to the con-tinued rise in employment. Since lower exports were more than offset by a slump in the expensive imports, capital formation in the private sector was the strongest component pulling GDP growth down in 2009. The first wave of the crisis was therefore weathered rela-tively well, compared with what was observed in other European economies. The labour market appeared very robust at that time. However, the “green island in the sea of red” status of the Polish economy encouraged some migrants to return home (notably from Ireland
Introduction1

7Introduction POLAND
and the UK, the most popular migration destinations), which pushed the labour supply up and raised the un-employment rate, despite the continued increase in employment.
In terms of value added, the 2009 slowdown mostly affected the financial services sector, which had shown unsustainable growth rates in the previous two years. Interestingly, it did not even harm real estate activities, despite some adjustments in real estate prices, while the growth in the manufacturing sector reduced and construction still flourished. In terms of employment changes, it was in the manufacturing sector where most jobs were lost, as it was still going through strong effi-ciency improvements at that time.
In 2010 and 2011, economic activity in Poland was recovering. Private domestic demand growth was encouraged by improving confidence to the extent that investment activity first stabilized in 2010 and then increased in 2011. Further support came from good export performance. But in the meantime, the labour market situation deteriorated. From 2010, employment stagnated, which, together with the ongoing return migration and increasing participation rate, pushed the unemployment rate up.
The second wave of the crisis did not have such a devas-tating effect from the perspective of the Eurozone, but Polish domestic demand showed much less resistance. Indeed, positive GDP growth over 2012 and 2013 was only secured by the export sector. Domestically, sluggish employment growth and stagnant wages coincided with fiscal consolidation. Consumer confidence worsened, and all these factors hampered the investment activity of enterprises. The economic landscape remained frozen until the second half of 2013, when economic activity showed some signs of acceleration. This time the recovery triggered an improvement in the labour market almost immediately. Employment started to pick up and both unemployment and the unemployment rate declined.
Generally, the impact of the global crisis on the Polish economy has been very specific. The real economy and labour market were not devastated as in many other EU countries and as such, the situation did not call for immediate emergency policy measures. It is therefore no surprise that several influential reports and papers which analysed economic policy during the crisis (also from a comparative perspective) found only modest actions undertaken in Poland to tackle its consequences in the labour market (see, for example Lewandowski and Magda, 2013). That does not mean that no changes were implemented in the labour market regulatory frame-work, but most of them were not motivated by the crisis.
On the sources of data employed to track and analyse labour market developments, it should be admitted that the most useful are various thematic publications of GUS, which are disseminated as readable documents and sometimes as spreadsheets, but do not form compre-hensive time series databases.2 Another useful database is the widely used Eurostat. Some other data used in this report were taken from websites, thematic publications and reports prepared by relevant ministries’ research departments.
2. With some exceptions, such as local databases, which contain various data broken down by territorial units.

81. Employment and unemployment trends POLAND
1.1 Trends at aggregate level
The Polish economy was experiencing robust GDP growth between 2004 and 2008, which increased its level by 30 per cent overall. Due to broad-based efficiency improvements, employment growth was more sluggish, however. The record low unemployment could not have been achieved had it not been for the low labour partici-pation – the biggest structural problem of the nation’s labour market (see figure 1.1). Labour participation started to increase in 2008 and this trend continued in subsequent years, contributing to pessimistic headline unemployment rate statistics. Several factors are respon-sible for the rising labour participation (see NBP, 2011). First, early retirement schemes were limited, which forced older workers to remain in the labour market. Second, the disability pension system was tightened up, which resulted in a gradually declining number
of beneficiaries. At the other end of the age scale, the youngest age group (15–24) became more active in the labour market, following the abolition of military con-scription in 2008. The volume of the active population has also been rising due to returning migration during 2008–10 (see table 1.1), especially from the top two migration destinations since 2007: the UK and Ireland.3
Total employment in Poland was on the rise throughout 2008 and, adjusting for the seasonal component, it peaked in 2009Q1. Positive trends were reversed in the course of 2009, following the recession in the main trading partners and lower, albeit still positive, GDP growth rates in Poland. Since 2010, employment fluc-tuated around 15.5 million and 2013Q2 seems to have started a rebound. It is important to keep in mind the structural break in data, following the adjustment in data generalization after the national population and
3. In 2010, returning migrants from Spain also made an important contribution to this flow.
1Employment and unemployment trends
Figure 1.1 Main aggregates in the Polish labour market
Notes: LFS data. *2010: break in series.
Source: Eurostat.

91. Employment and unemployment trends POLAND
housing census conducted in 2011 and also a methodo-logical change in the LFS survey. This change revised the aggregate employment number downwards by around. 3.5 per cent. Adjusting for this change statistic-ally, total employment would have increased by around 3 per cent between 2008 and 2013 rather than margin-ally declined. While the former figure is pure specula-tion, the latter should also be taken cautiously. Most probably, it can be assumed that employment did not decrease in the period under consideration.
In response to the global crisis, legal provisions for short-time working were introduced, but stimuli for enter-prises to engage in working-time management were rather weak. Consequently, changes in effective working
hours were small (see figure 1.2). A minor reduction in the working time (increased ratio of employed per-sons working less than 40 hours) can be attributed to collective agreements implemented in some large and multinational companies (ETUI, 2010).
Another important characteristic of a labour market is its dynamics. Data on new and destroyed jobs are pro-vided by the GUS “registered unemployment” database, however they are not directly comparable with LFS data on employment due to definition and methodological differences. Nonetheless, they can reliably mirror fluc-tuations in labour market dynamics over time as well as sectoral contributions to the net balance of jobs (see figure 1.3).
Table 1.1 Number and flows of migrants from Poland by destination (thousands)
Country Number of migrants in 2004
Net balance of migrant flows
2005 2006 2007 2008 2009 2010 2011 2012
Total 1 000 +450 +500 +320 –60 –110 –100 +60 +70
EU27 770 +430 +410 +315 –38 –122 –80 +61 +50
UK 150 +190 +240 +110 –40 –55 –15 +45 +12
Ireland 15 +61 +50 +80 –20 –40 –7 –13 –2
Germany 385 +45 +20 +40 0 –35 –25 +30 +30
Source: GUS estimates.
Figure 1.2 Effective weekly working time in 2008 and its changes between 2009 and 2013
Source: LFS, GUS.

101. Employment and unemployment trends POLAND
Figure 1.3 shows that job turnover was in fact elevated in 2010 due to higher new job creation (mostly in ser-vices), but it declined subsequently, only to pick up again in 2013. Meanwhile, these data suggest that 2011 and (especially) 2012 were relatively difficult for “outsiders” in the labour market. Nonetheless, throughout the entire period, more jobs were being created than lost, and services revealed the strongest potential to increase employment. With the exception of 2009, manufac-turing also added positive, albeit small, contributions to net job balance.
The general trends described above were shaping the unemployment rate. Figure 1.4 shows its evolution according to two sources: LFS statistics and “registered unemployment” statistics. The differences between the two are important enough to make a significant distinc-tion in the data.
The fundamental difference between the two databases is that “registered unemployment” data are collected from work offices and the LFS is survey based. LFS is therefore said to be adjusted for the shadow-economy
Figure 1.3 New and destroyed jobs and the contribution of economic sectors to net balance of jobs (thousands)
Notes: New jobs comprise both filled and unfilled jobs (vacancies). *2008 – no data on destroyed jobs.
Source: GUS.
Figure 1.4 Unemployment rate in the LFS and “registered unemployment” statistics
Source: GUS “registered unemployment” and LFS databases.

111. Employment and unemployment trends POLAND
employment. Moreover, LFS data eliminate those who register only to be covered by social insurance, but do not really seek employment (they are classified as in-active in LFS). On the other hand, some (economically) unemployed persons do not register as they do not feel motivated to do so (for example if they would not be entitled to unemployment benefit or if they believe they can find a job quickly).
Figure 1.5 presents a more precise decomposition of annual differences between the numbers of unemployed persons according to the two measures, presented in the report “Diagnoza Społeczna 2013” (Czapiński and Panek, 2014). It shows that around 40 per cent of the unemployed according to “registered unemployment” indeed either work in the shadow economy or do not look for a job at all. The latter group has shrunk some-what since the 2000s, albeit remaining dominant, while the former fluctuates in number. The number of per-sons who are counted as unemployed by the LFS, but are not registered, is also substantial. The balance between these groups has always been positive and seems to be negatively correlated with economic situation. Several arguments can be given to explain this apparent correl-ation, but these should only be treated as hypotheses. First, the blue bar gets smaller during crises as the eco-nomically inactive population shrinks to support their household budgets. Moreover, in the specific case of Poland, returning migrants started looking for jobs and many of them had fallen under this category. The red bar increases when employers push their staff into the shadow economy to cut costs and also abuse their
relatively strong labour market position. The green bar incorporates frictional and voluntary unemployment, which is normally reduced when the labour market deteriorates and workers do not believe that it will only take a short time to find a new job.
Registered unemployment statistics are very useful for analysing some labour market trends (also because they are issued monthly). Figure 1.6 shows some alarming signals in respect of duration of unemployment as well as eligibility for unemployment benefits. First, long-term unemployment (lasting more than 12 months) has been rising since 2009. By 2013, the share of long-term unemployment had increased from 25 to 37 per cent. This trend was accompanied by gradual erosion of the income of the unemployed, as the share of those eligible for benefits dropped to 15 per cent on average in 2013. In fact, quarterly data signal that at the end of 2013 and the beginning of 2014, this share was already only about 13.5 per cent. The problems of unemployment benefit eligibility and the subsistence of the unemployed are analysed in detail in Chapter 3.
The general picture of the labour market developments in Poland during the global crisis is mixed. On the one hand, the elevated unemployment rate is largely a conse-quence of rising labour participation rather than falling employment and job destruction processes, as neither of the two phenomena was actually observed. On the other hand, the labour market has shown some signs of inertia in recent years and barriers to find a job might be rising, leaving some vulnerable groups in need of aid.
Figure 1.5 Decomposition of difference between the number of unemployed according to LFS and “registered unemployment” (per cent registered unemployment)
Source: Czapiński and Panek (2014).

121. Employment and unemployment trends POLAND
1.2 Employment developments at sectoral level
The most badly affected sector during the global crisis period (in terms of employment) was manufacturing, suffering from the collapsing external demand, and also caught in the process of ongoing efficiency improve-ments (see figure 1.7). The services sector was much more robust in aggregate, and agricultural employment simply followed the declining trend observed over
a longer period. In late 2010, the manufacturing employment adjustment came to an end and, after some stabilization lasting until end of 2012, it started rising again. Throughout 2013 it provided the strongest support for aggregate employment growth. In the ser-vices sector, transportation and logistics, the financial industry and consulting were among those branches that showed increased employment, while many public service activities (including education) cut jobs.
Figure 1.6 Share of the unemployed entitled to unemployment benefits and unemployment duration (annual average)
Source: GUS registered unemployment statistics.
Figure 1.7 Sectoral employment dynamics (2008Q1 = 1)
Notes: LFS data. Data seasonally adjusted using TRAMO/SEATS. *Agriculture includes forestry and fishing; 2010Q1 – break in series.
Source: Eurostat.

131. Employment and unemployment trends POLAND
The gradual shift between the private and public sector has been more general, as illustrated by figure 1.8. Between 2010 and 2012 the public sector cut 148,000 jobs, only to add 8,000 in 2013. In the same period, the private sector generated nearly 400,000 new jobs. Self-employment, which was fluctuating around 2.95 mil-lion jobs since the beginning of the crisis, shrank somewhat in 2012 and 2013. In order to track the rea-sons for this decline, some caveats must be presented. First, self-employment in Poland is sometimes invol-untary – imposed by a former employer to reduce costs and circumvent labour law. When in need, enterprises find it easier and less costly to terminate contracts with such “independent entities” than lay off regular staff workers. Second, some of the self-employed were in fact individual farmers, whose numbers dropped due to structural changes in agriculture. Finally, the inflow of EU-cofunded subsidies declined, which eliminated those entrepreneurs relying on them.
1.3 Labour market status of different groups
1.3.1 Gender
Historically, most of the recessions and slowdowns have tended to drive down employment in sectors dominated by men, while women’s employment has been less sensi-tive to economic cycles (see Hogarth et al., 2009).
Further analysis of men’s and women’s employment in Poland during the global crisis is necessary as it may
be misleading to ignore the break in series in 2010.4 Figure 1.9 shows employment dynamics separately, according to the two methodologies. Since the 2010 change led to adjustment to the levels rather than growth rates, the dynamics (along with contributions) look similar in six overlapping quarters.
The global crisis drove employment dynamics down in 2009 and even made it negative in two quarters. As expected, this burden was borne by men, who were losing jobs in manufacturing, even though some of the unemployed were absorbed by the services sector. Nonetheless, growth in the services sector pulled even more women into employment, which made their situ-ation relatively favourable for a couple of quarters. Subsequently, the rebounding manufacturing sector started to increase men’s employment in 2011, while the services sector lost its dynamism, contributing to stagnation in women’s employment.
In the second wave of the crisis, which was more broad-based and symmetric across sectors, labour market performance was completely different from the gender perspective. In fact it was women who found themselves in a more difficult situation in the first half of 2013, but they also gained most of the jobs in the remaining part of that year, when employment started to pick up again.
4. Downloading employment data from Eurostat, for example, produces merged series that should not be analysed as they are.
Figure 1.8 Decomposition of average annual employment by ownership sectors
Notes: Total employment excluding contributing family workers.
Source: LFS, GUS.

141. Employment and unemployment trends POLAND
Data on job tenure (illustrated in figure 1.10) reveal that average job duration increased by more than half a year until 2013 and there were no major differences between genders here. Combined with data on total unemployment, this may add another signal indi-cating strengthening labour market segmentation and the weakening relative power of “outsiders”, including newcomers. In any case, the problem of increasingly disadvantaged outsiders in the labour market can poten-tially pose serious social problems related to the loss of human capital and an increasing share of inactive popu-lation. Problems of youth in the labour market are also burning issues and they will be given much attention throughout this report.
Women’s unemployment rate has traditionally been higher than men’s and this did not change even in early 2010, when men’s employment suffered most (see figure 1.11). Since then, the gap between male and female unemployment has been widening, although the usual seasonality would bring the two rates closer in every first quarter of a year. The gradual accumulation of long-term unemployment was generally observed with similar intensity. Since the beginning of 2013, however, the share of long-term unemployment started to pick up rapidly among men, despite the falling unemployment rate in this group. Meanwhile, women’s long-term un-employment has remained elevated. At the end of 2013, shares of long-term unemployment for both men and women hit their highest levels since 2007.
Figure 1.9 Contributions of numbers of men and women to annual growth rate of employment
Notes: LFS data. 2010 – break in series.
Source: Eurostat.
Figure 1.10 Effective duration of employment between 2008 and 2013 (years)
Source: OECD database.

151. Employment and unemployment trends POLAND
1.3.2 Age
The impact of business cycle fluctuations on the labour market is particularly heterogeneous across different age cohorts. The most vulnerable group consists of the youngest active population, including graduates trying to find their first job. Several factors are responsible for this vulnerability. First, older workers are in a stronger position as they are more qualified and have had more time to achieve permanent contracts, which usually include more job protection. In Poland, older employees also enjoy additional protection5 in pre-retirement age, which puts them in the last group to be laid off. Younger age groups more often perform work on the basis of temporary contracts and civil-law contracts.6 This makes their jobs less protected and minimizes employee ter-mination costs in those groups. Second, business cycle influences inflows in the first place, which means that during recessions and slowdowns labour market entry is more restricted. Third, graduates are often considered less valuable because they lack desirable skills. Employers tend to blame this on an inadequate educational system, which, they claim, does not provide school leavers and graduates with adequate and up-to-date practical know-ledge that could be readily applied in the workplace.
5. Men aged 61 and women aged 56 cannot be laid off unless the employer declares insolvency or the firm is in liquidation.6. More on these forms of employment in Chapter 2.
Figure 1.12 confirms the strong vulnerability of youth in the Polish labour market during the recent slow-down. Despite robust employment in the 25–49 age group and rising older-age employment, the situation of the youth in the labour market deteriorated sub-stantially. Employment in the 15–24 age cohort has dropped by nearly 30 per cent since the first quarter of 2008 and even more jobs were lost among young women. In part, this was associated with tertiary enrol-ment trends. The share of young women in the student population is rising, which shrinks the labour supply in this group. It is difficult to determine causality here, because many young people “escape” to colleges and universities to postpone labour market entry, expecting major difficulties with finding a job, but also hoping for a better start after upgrading their education level. But even adjusting for the group who has decided to upgrade their education, the slowdown has severely damaged the youth labour market, which is unveiled by the youth un-employment statistics (see box 1.1).
Figure 1.11 Unemployment rates and shares of long-term unemployment broken down by gender
Source: GUS, LFS.

161. Employment and unemployment trends POLAND
Box 1.1 Youth unemployment
The youth are the most business-cycle-sensitive group in the labour market and most recessions immediately translate into high youth unemployment rates. As already illustrated, the current global crisis has not treated this vul-nerable group any better, and youth unemployment has surged in most EU countries, with only a few noteworthy exceptions – Germany, the Netherlands and Austria. In Poland, the youth have borne all of the brunt of the labour market adjustment, whereas older employees have been virtually unaffected by it.
Figure B.1 shows that the unemployment rate among the active population aged 15–24 was increasing steadily between 2008 and 2013, even when in the remaining age groups it was rather stable. Young women turned out to be even more vulnerable than young men, which reflects trends in the aggregate unemployment rate, and is related to the rather stable sectoral composition of the second wave shock of the crisis.
One of the problems of the unemployed youth is their over-all scarce eligibility for unemployment benefits (figure B.2). Work experience is, in any case, a necessary condition for eligibility. Meanwhile, only about 5.5 per cent of young un-employed females and 7.1 per cent of young unemployed
males receive unemployment benefits. These shares were respectively two and three times higher in 2008. Moreover, young women do not even benefit from increased job tenure, which is an observed trend in older age groups, but also among young men (see figure B.3).
Figure B.1 Unemployment rate (per cent)
Source: Eurostat.
Figure B.2 Share of unemployed eligible for unemployment benefit (per cent)
Source: GUS.

171. Employment and unemployment trends POLAND
Table B.1 Inactive population aged 15–24 due to discouragement and education
Men (%) Women (%)
2008
Discouraged 1.1 0.6
In education 93.2 87.6
2013
Discouraged 2.1 1.1
In education 92.0 88.9
Source: LFS.
Surprisingly, the youth have been able to adjust to this un-favourable development rather than become discouraged. Table B.1 admittedly shows rising shares of discouraged youth among the inactive population, but they remain small. Women appear more tenacious than men as only 1.1 per cent of the inactive population pointed to discouragement as the reason for their inactivity in 2013. This translates into 17,500 women, while there were also 29,500 discouraged men of this age recorded in 2013.
Another burning problem of the youth in the Polish labour market is linked to the overuse of temporary and part-time contracts in labour relations of youngest age groups, but this issue is discussed in Chapter 2.
Figure B.3 Average job tenure (years)
Source: OECD database.

181. Employment and unemployment trends POLAND
1.3.3 Education
The Polish labour market has been increasingly demanding in terms of the educational levels of job candidates (see figure 1.13). While in part this may reflect progress towards a knowledge-based economy, it is mostly a result of a massive popularization of tertiary education, accompanied by growth of numerous private colleges, while the quality of graduates is highly disput-able. But the entire educational system in Poland was heavily criticized throughout the 2000s for its incom-patibility with the needs of the labour market. The system was blamed for raising structural mismatches as
it failed to adjust labour supply to demand, while the latter in fact evolved rather rapidly.
The problem of causal relationships between educa-tional level and the odds of finding a job has attracted a lot of attention. The NBP (2012) finds that tertiary education improved chances of getting a job only in a favourable labour market situation (in 2008), whilst it did not matter during a slowdown (in 2012). Moreover, the population with primary education as their highest level of educational attainment was found to experience the biggest problems in being hired during a slowdown.
Figure 1.12 Employment dynamics by age groups (2008 = 1)
*2010 – break in series.
Source: LFS, GUS.
Figure 1.13 Employment dynamics by educational attainment (2008Q1 = 1)
*2010 – break in series.
Source: Eurostat.

191. Employment and unemployment trends POLAND
In response to the accusations levelled at the educa-tional system, a debate has been launched on reinforcing vocational education. The Ministry of Education and the Ministry of Economy have both announced pro-grammes to improve the quality of vocational education and encourage the youth to undertake it. The Ministry of Economy is currently preparing (as of August 2014) measures to enhance cooperation between vocational schools and special economic zones, scattered around the country, where mostly industrial enterprises operate.
In any event, rising employment of the more formally educated population is a long-run trend observed in recent decades. Figure 1.14 shows that educated women
increased their share in employment almost twice as fast as men, while the demand shrank for people whose highest level of education is primary and secondary.
1.3.4 Occupation
The rapidly increasing educational attainment of the mostly young working population is mirrored by shifts in occupational structure (see figure 1.15). The most rapidly growing occupational group is “professionals”, which already employs the highest share of working women and has surpassed skilled agricultural profes-sions among men. Meanwhile, elementary occupations and other manual jobs that do not require higher edu-cational attainment lose their importance or are at best
Figure 1.14 Employment shares by educational attainment and gender
Source: Eurostat.
Figure 1.15 Occupational structure of employment and its changes among men and women
(a) Men (b) Women
Source: Eurostat.
201. Employment and unemployment trends POLAND
stagnant. Nonetheless, one caveat must be acknow-ledged. It is noteworthy that some occupations do not require tertiary education to be performed well, yet the rising average level of education crowds out less- qualified candidates from these professions too. Moreover, as (formally) better-educated employees occupy lower-class jobs, the wage premium for higher education in Poland dwindles.7
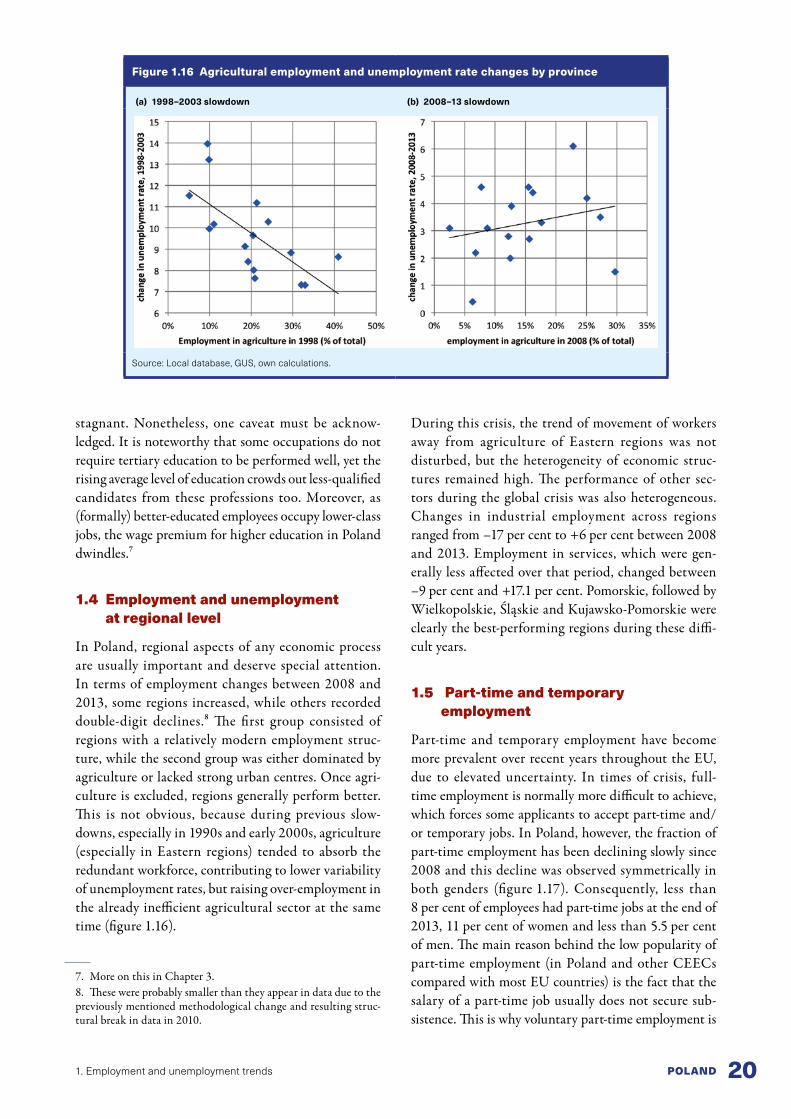
1.4 Employment and unemployment at regional level
In Poland, regional aspects of any economic process are usually important and deserve special attention. In terms of employment changes between 2008 and 2013, some regions increased, while others recorded double-digit declines.8 The first group consisted of regions with a relatively modern employment struc-ture, while the second group was either dominated by agriculture or lacked strong urban centres. Once agri-culture is excluded, regions generally perform better. This is not obvious, because during previous slow-downs, especially in 1990s and early 2000s, agriculture (especially in Eastern regions) tended to absorb the redundant workforce, contributing to lower variability of unemployment rates, but raising over-employment in the already inefficient agricultural sector at the same time (figure 1.16).
7. More on this in Chapter 3.8. These were probably smaller than they appear in data due to the previously mentioned methodological change and resulting struc-tural break in data in 2010.
During this crisis, the trend of movement of workers away from agriculture of Eastern regions was not disturbed, but the heterogeneity of economic struc-tures remained high. The performance of other sec-tors during the global crisis was also heterogeneous. Changes in industrial employment across regions ranged from –17 per cent to +6 per cent between 2008 and 2013. Employment in services, which were gen-erally less affected over that period, changed between –9 per cent and +17.1 per cent. Pomorskie, followed by Wielkopolskie, Śląskie and Kujawsko-Pomorskie were clearly the best-performing regions during these diffi-cult years.
1.5 Part-time and temporary employment
Part-time and temporary employment have become more prevalent over recent years throughout the EU, due to elevated uncertainty. In times of crisis, full-time employment is normally more difficult to achieve, which forces some applicants to accept part-time and/or temporary jobs. In Poland, however, the fraction of part-time employment has been declining slowly since 2008 and this decline was observed symmetrically in both genders (figure 1.17). Consequently, less than 8 per cent of employees had part-time jobs at the end of 2013, 11 per cent of women and less than 5.5 per cent of men. The main reason behind the low popularity of part-time employment (in Poland and other CEECs compared with most EU countries) is the fact that the salary of a part-time job usually does not secure sub-sistence. This is why voluntary part-time employment is
Figure 1.16 Agricultural employment and unemployment rate changes by province
(a) 1998–2003 slowdown (b) 2008–13 slowdown
Source: Local database, GUS, own calculations.

211. Employment and unemployment trends POLAND
largely attributed to people aged 55 or more, who receive some other pension or benefit. In most cases, part-time employment is largely involuntary and in recent years it has been a product of the low bargaining power of the most vulnerable groups, notably the youth.
Figure 1.18 confirms this conclusion. Involuntary part-time employment more than doubled in the age group 15–24 and it also increased substantially among those aged 25–49. While in the latter group men are more affected by this phenomenon (45 per cent of involun-tary part-time workers), women dominate in the former group, representing the youngest workforce (one-third of women aged 15–24 were involuntarily working part-time in 2013).
Part-time employment, while it has become less popular on aggregate, is also more involuntary, imposed on young people seeking employment. Since they are also more educated, there is a positive correlation between educational attainment and dynamics of part-time employment share (see figure 1.19). Among the less-qualified workforce (especially levels 0–2), enter-prises preferred to terminate jobs of part-time workers, which is reflected in the substantial reduction of their total employment, amounting to 32 per cent and 45 per cent among men and women, respectively.
Figure 1.20 offers further evidence of the vulnerability of the young qualified workforce (especially women) who take up jobs in the service sector, but are quite often
Figure 1.17 Share of part-time employment (per cent)
Source: LFS GUS.
Figure 1.18 Share of involuntary part-time employment
Source: LFS GUS.

221. Employment and unemployment trends POLAND
only offered part-time employment. Admittedly, service sector jobs often easily accommodate part-time workers, especially in small enterprises. The drop in aggregate part-time employment is in turn associated with major labour adjustments in the agricultural sector.
Compared with part-time jobs, a more popular form of employment in Poland is fixed-term contracts (see figure 1.21). Around 27 per cent of workers have this type of contract. While this share has been relatively constant in recent years, its gender structure has evolved. In 2008, 27.7 per cent of women and 26.3 per cent of men were working on fixed-term contracts, and by 2013 these proportions were almost reversed. This could be
partly explained by the rising importance of temporary work agencies, which provide temporary staff more often for the male-dominated industrial sectors and less for the service sector.
Similar to the trends of part-time employment, temp-orary jobs are also offered to the youngest candidates. Indeed, figure 1.22 shows that around 70 per cent of employees aged 15–24 work on fixed-term contracts (and the share has been increasing significantly in recent years), while this fraction is much lower and more stable in older-aged employee groups. Fixed-term youth employment has become a widely discussed problem in Poland, along with the overuse of civil-law contracts in
Figure 1.19 Percentage change in part-time employment by education (between 2008 and 2013)
Source: LFS GUS.
Figure 1.20 Contribution of main occupational groups to changes in part-time employment between 2008 and 2013 (thousands of jobs)
Source: Eurostat.

231. Employment and unemployment trends POLAND
their case. It is often argued that the youngest employees (young persons in employment as soon as they can actu-ally find a job) have insufficient stability and are there-fore also cut off from mortgage loans, which ultimately generates social problems (fewer marriages, delayed childbirth decisions) and encourages emigration.
1.6 Overtime
Overtime work in Poland was most frequent during the upturn, which had its peak in 2008. The unemployment rate fell below its natural level during this year and employees commonly reported increasing labour shortages. At the same time, the favourable demand developments might not have been fully anticipated as
long-lasting, which would justify increasing staff num-bers. In this situation, enterprises preferred to motivate their existing personnel with salary increases, while raising the workload as well. Consequently, as many as 16.2 per cent of full-time workers worked on average 50 hours per week or more in 2008 (see figure 1.23). In subsequent years, the share of people working 50 hours per week or more gradually declined towards 2011, when it reached 13.8 per cent. This tendency was mirrored by underemployment, which followed a generally upward trend during this period. This could be partly attributed to labour hoarding. The labour market deterioration is also associated with more people leaving the labour market on sick leave and other forms of temporary paid inactivity, sometimes forced by (usually small) employers.
Figure 1.21 Share of fixed-term employment (per cent of total employment)
Source: Eurostat.
Figure 1.22 Share of fixed-term employment broken down by gender
Source: Eurostat.

241. Employment and unemployment trends POLAND
Having said that, it should be emphasized that over-time has typically been most common among the self-employed. Back in 2008, as many as 46 per cent of self-employed men and 25 per cent of self-employed women worked at least 50 hours per week, and these shares dropped somewhat by 2013 (figure 1.24). Employees, even in the private sector, have worked con-siderably fewer hours in all sectors. Another regularity concerns overtime incidence by gender: regardless of sector, women tend to work significantly fewer hours compared with men, which is indeed also the case in other countries.9
9. According to Eurostat data, men typically work more hours than women in all EU countries.
1.7 Firm creation and survival
The number of firms created each year between 2008 and 2012 is shown in figure 1.25 with squares initial-izing year-specific “survival curves”. It comes as no sur-prise that the most favourable year, 2008, saw the highest number of newly established firms – more than 294,000. In subsequent years, this number fluctuated between 274,000 and 286,000, although correlation with the general economic situation does not seem to be very strong. While strong internal and external demand is a factor which encourages firm creation, other reasons can also play a role. The decision to become self-employed can result from, e.g. losing a job and having poor pro-spects for re-employment, or being associated with EU-funded and internal programmes to support new firms. Indeed, most of the new firms benefited from these programmes and their regulatory frameworks were
Figure 1.23 Decomposition of total employment by average number of hours worked
Source: GUS.
Figure 1.24 Share of the employed working 50 hours or more, broken down by sectors
Source: GUS.

251. Employment and unemployment trends POLAND
subjected to substantial changes, including the eligibility criteria, scale of support and its conditions.
Figure 1.25 suggests that there was variation in the success ratios of firms created over the years analysed. The line describing the number of active firms estab-lished in 2008 forms a curve, indicating their increasing
resilience, but this pattern is less visible in the case of firms established in later years. Of all the years ana-lysed, 2012 seems to have been the most difficult for enterprises, which table 1.2 also suggests. Annual firm survival rates for 2012 are generally the lowest, with one exception of firms created in 2011. This, however, might
Figure 1.25 Creation of new firms and their survival in first years of activity
Source: GUS.
Table 1.2 Survival rates for firms created between 2008 and 2012 (per cent)
Year created 2013/2012 2012/2011 2011/2010 2010/2009 2009/2008 Overall
2012 76.4 76.4
2011 70.7 76.6 54.1
2010 77.0 70.0 77.8 41.9
2009 81.0 73.6 77.6 77.0 35.6
2008 86.2 81.7 80.3 76.3 76.4 33.0
Source: GUS.
Figure 1.26 Total employment in firms created between 2008 and 2012 and still operating in 2013 (thousands)
Source: GUS.

261. Employment and unemployment trends POLAND
be a result of the ongoing support from various pro-grammes and the requirement to keep the new business running for at least 12 months. It is perhaps interesting to note that in general, the survival rates for firms in Poland (and other CEECs) are significantly lower than in EU15 countries (see Annual Report on European SMEs 2012/2013).
In the context of this report, an especially relevant aspect of business demography is the potential of new firms to create new employment. Figure 1.26 illustrates the total number of jobs in companies which have been created since 2008. Overall, as of 2013, around 1.8 million jobs (or 11.5 per cent of total employment) can be attributed to enterprises established between 2008 and 2012.
Figure 1.27 presents the industrial structure of jobs cre-ated in firms established between 2008 and 2012. Most of these jobs are in the market services sector, followed by industry and construction. Of these three broad sec-tors, it is however construction which stands out as most expansive. While it currently employs less than 10 per cent of workforce, around 13 per cent of jobs added by the newly created firms were generated in the construc-tion sector.
At the same time, figure 1.27 does not provide evi-dence of re-industrialization between 2008 and 2012, as new firms were not interested in generating jobs in the industrial sector to the extent of raising its share in employment.
Figure 1.27 Structure of jobs in firms created between 2008 and 2012 and still operating in 2013
Source: GUS.

272. Contractual arrangements and employment protection legislation POLAND
2Contractual arrangements and Employment Protection
Legislation (EPL)
2.1 General background
It has been acknowledged, since Poland started its tran-sition from a centrally planned to a market economy, that the labour market should be deregulated in order to increase its flexibility, and thus, to provide labour market equilibrium with relatively low unemployment.10 The discussion about changes in employment protection legislation, which refers to labour market deregulation, has been of great interest for employers’ representatives and trade unions. In recent years, the discussion has been held within the framework of a concept of flex-icurity, with two different points of view presented by the employers’ representatives and trade unions. While employers’ representatives have been focused mainly on flexibility issues, trade unions have claimed the need to balance flexibility with security.11
It should be emphasized that the discussion about employment protection legislation with regard to labour market flexibility and utilization of non-standard (atypical) forms of employment is present mainly in the private sector. The government is a partner in this discussion mainly through the Tripartite Commission for Socio-Economic Affairs12 – it plays the role of a policymaker and labour market institution, but not an employer. However, there are examples of actions taken by the public administration aimed at the introduction of flexibility schemes into the public administration.13
10. Labour market deregulation in Poland has its proponents and opponents. The opponents point to factors that reduce acceptance of the deregulation process (high value of social security, relatively high poverty rates, unwillingness of the trade unions to cooperate with other stakeholders, among others). However, proponents are also aware that deregulation is not able to solve all labour market issues, including unemployment.11. There have been many seminars and conferences organized, as well as EU co-funded projects, aimed at disseminating the flexicurity idea (some of these projects were conducted by trade unions). Many of these projects were mainly focused on the pillar “flexible and reliable contractual arrangements”, thus flexibility was a key issue to be discussed and analysed, mainly in the context of the use of non-standard forms of work.12. Hereinafter referred to as the Tripartite Commission.13. An example of this is an international project “Restructuring and employment conditions: How to monitor the modernisation of public administration?” Poland was represented by the Chancellery
Many research studies, as well as the analysis of public debates and social partners’ negotiations within the Tripartite Commission, show that no aspect of employment flexibility (e.g. organizational, legal and financial) has been adequately used and fully utilized in Poland. In most cases, employers take advantage of the simplest legal (fixed-term contracts, civil-law contracts) or organizational (overtime hours, furloughs) solutions, focusing on cost-driven issues – the main incentive for employers to use the available atypical solutions is related to economic factors.14 Simultaneously, flexibility aspects related to better work organization, employees’ motivation or innovativeness and competitiveness advancements are of secondary importance15 (Arendt et al., 2009, 181–183; Męcina, 2013, 78–79).
of the Prime Minister. The project linked the role of the public administration as policymaker for employment policies to the role as the employer for the civil service. The main goal was to define a number of indicators to assess the performance of the public admin-istration with regard to the implementation of some flexicurity elements. The project showed that the Polish public administration worked on the implementation of some elements of flexibility – the Ministry of Economy introduced (as a pilot programme) a flexi-time option for employees. This solution posited that an employee who joined the programme might start his work between 7.30 and 9.00 a.m. and finish it between 3.30 and 5.00 p.m., maintaining an 8-hour working day. This solution ensured the presence of all employees between 9.00 a.m. and 3.30 p.m. – periods of time during which intensity of work is highest. The outcomes of this pilot pro-gramme were positive – employees’ satisfaction increased, as well as the perception of the Ministry of Economy as a good employer (more candidates were encouraged to apply for a job in the Ministry).14. In general, the Polish Labour Code allows the use of all avail-able non-standard (atypical) forms of employment (fixed-term employment contracts, leave replacement, temporary-work-agency employment, on-call work, etc.). In 2007, regulations on tele-working were implemented in the amended Labour Code by the Act of 24 August 2007 amending the Labour Code and other acts ( Journal of Laws 2007, No. 181, item 1288). The amendment intro-duced the definition of telework as work exercised regularly outside an enterprise with the use of electronic communication means, as defined in regulations on rendering services in an electronic way. This was supposed to encourage Polish enterprises to make greater use of telework. However, available data have not yet confirmed wider use of this form of employment in Poland.15. The research study “Flexicurity in Poland. Diagnosis and rec-ommendations” commissioned by the Ministry of Labour and Social Policy, which brought recommendations for the flexicurity model that might be implemented in Poland, elaborates on these issues.

282. Contractual arrangements and employment protection legislation POLAND
2.2 Debate on atypical forms of work in the context of employment protection legislation
Nevertheless, as far as social dialogue with regard to the employment relationship is concerned, there has been a clear dichotomy between the points of view of employers’ representatives and trade unions.
Generally, employees and trade unions are against wider utilization of flexible (non-standard) forms of employ-ment.16 The arguments raised are as follows:• it restricts employees’ rights;• it mitigates the sense of employment security;• it may lead to labour market segmentation (usually the
concept of dual labour market is taken into account).
As a result, the scope of utilization of non-standard forms of employment is perceptibly lower in companies in which trade unions operate, in comparison with those companies where trade unions do not exist. As trade unions operate mainly in the public sector and in large and medium privately-owned companies, non-standard forms of employment are mainly used in micro and small enterprises. This in turn may lead to labour market segmentation processes (Męcina, 2013, 79).
This argument is usually raised in public discussions, however there is no research background solid enough to confirm the relationship between the use of non-standard forms of employment (especially civil-law contracts) and labour market segmentation in Poland. The relationship between the use of atypical forms of employment (especially fixed-term contracts) and labour market polarization was analysed by Bednarski and Frieske (2012). They identified the mechanism that may lead to segmentation of the Polish labour market: low-quality formal education leads to per-forming precarious jobs, which, in the long run, petri-fies the unstable position of an individual in the labour market. This creates a “peripheral” sector of the labour market, which individuals usually do not try to leave, but rather undertake actions to secure a good position within this sector – as a result they accept instability of employment. The duality of the Polish labour market with regard to excessive use of civil-law contracts was also studied by Arak et al. (2014).17
16. It applies mainly to fixed-term contracts, especially civil-law contracts.17. In such analyses, the duality of the labour market is often defined as a division of the market into two segments: the first one includes persons with regular (open-ended) employment contracts; the second includes persons with fixed-term contracts.
It is argued that, in countries with strong duality of the labour market, fixed-term contracts are used relatively often by companies. This provides higher flexibility for laying off employees, especially in cases of economic slowdown, when the net change in the number of employees is negative (Wojciechowski, 2011).
The specific feature of the Polish labour market is a relatively high share of fixed-term employment in total employment in comparison with other EU Member States (see figure 2.1). Since Poland joined the European Union, this share has been constantly considerably above the EU and Euro Area average.18 Until 2008, only Spain recorded a higher share of temporary workers in total employees, but since then Poland has surpassed Spain.
This highest share of temporary workers in the EU together with a high in-work poverty rate for temp-orary workers has been pointed out by the European Commission as an important challenge in Poland (European Commission, 2012, 177). Additionally, in most cases temporary employment is not a choice of the employee but is imposed by the employer.19
Changes in the dynamics of the number of employees in Poland, and especially differences between the dynamics of permanent employment and temporary employment that have taken place in recent years, may be explained by institutional factors (related to employment protec-tion legislation) as well as by the labour market tensions.20 In the pre-crisis period in Poland, year-to-year dynamics of the number of regular employees increased, while the dynamics of the number of fixed-term employees decreased steadily (see figure 2.2).
18. A maximum value of 28.2 per cent was recorded in 2007, just before the world crisis.19. At the conference “Typical and atypical work arrange-ments – disadvantages and advantages from the labour market perspective” held in Warsaw on 8–9 April 2013, Koos Richelle, Director General of Employment, Social Affairs and Inclusion, emphasized that around 65 per cent of temporary workers in Poland undertook this form of employment involuntarily. The conference was organized by the Labour Market Observatory of the European Economic and Social Committee and the Ministry of Labour and Social Policy. Poland was chosen for the conference venue just because it had the highest share of temporary workers in the EU Member States (for more information see http://www.eesc.europa.eu/?i = portal.en.events-and-activities-typical-and-atypical-con-tracts-pres)http://www.mpips.gov.pl/aktualnosci-wszystkie/art,5543,6140,konferencja-typowe-i-nietypowe-umowy-o-swiad-czenie-pracy-wady-i-zalety-z-perspektywy-rynku-pracy.html.20. Kwiatkowski and Wlodarczyk (2012), using data for 26 OECD countries for 2008–11, showed that it is reasonable to expect major decreases in employment (accompanied by increases in unemployment) during a crisis in countries where employment pro-tection legislation is either relatively weak or relatively strong. The smallest decreases in employment during the crisis can be expected in countries in which the EPL indicator is close to 2.

292. Contractual arrangements and employment protection legislation POLAND
The reason behind these processes was twofold. On the one hand, the Polish Labour Code limits the number of fixed-term employment contracts signed consecutively by the same employer and the same employee to two. The third subsequent contract automatically becomes an open-ended contract.21 Thus, many employers had to convert fixed-term contracts into open-ended contracts in order to keep the employees within the company. On the other hand, relatively fast economic growth combined with emigration processes resulted in labour shortages in some segments of the labour market. Companies reported increasing problems in hiring suit-ably trained employees. The research done by KPMG in 2007 among enterprises operating in the Polish market
21. Provided that the breaks between these contracts did not exceed one month.
revealed that the lack of a qualified workforce was the biggest barrier to a company’s development (KPMG, 2008). Moreover, it was forecast that this problem may be affecting companies for the next two years (how-ever, due to the economic slowdown triggered by the world financial crisis, this problem appeared not to be as significant as had been anticipated). As a result, employers were forced to offer open-ended contracts to attract potential employees and to minimize the scale of labour turnover.
At the beginning of economic slowdown, employers tried to maintain employment levels, especially in the group of core employees. This led to labour hoarding – Strzelecki et al. (2009) argued that at the beginning of 2009 more than 30 per cent of enterprises were engaged in labour hoarding (mainly those companies that were
Figure 2.1 Percentage of employees with temporary contracts
Source: Eurostat database.
Figure 2.2 Year-to-year dynamics of the number of regular and fixed-term employees in Poland, 2005–13 (per cent)
Source: own calculations based on Eurostat data.

302. Contractual arrangements and employment protection legislation POLAND
expecting rapid improvement of the economic situ-ation). As a result, in 2009 the number of employees grew (by 0.7 per cent), mainly because of the growth in the number of regular employees (by 1.4 per cent), while the number of temporary employees decreased. The anti-crisis package introduced a maximum length of 24 months for subsequent fixed-term employment contracts (in force until the end of 2011) – the recovery of employment numbers in 2011 and, to a lesser extent in 2012, was driven by growth in the number of open-ended employment contracts.
It is worth noticing that the category of fixed-term employees presented in the statistical database includes persons employed on a fixed-term employment contract based on the Labour Code regulations, as well as per-sons hired on civil-law contracts. Civil-law contracts,22 based on Civil Code, are usually fixed-term contracts. The popularity of this type of contract results from the fact that they are beneficial from the employers’ point of view due to a restricted scope of employees’ rights and benefits in comparison with regular employment con-tracts, in particular:• lack of right to holiday leave or sick leave;• lower or no social contribution (depending on the
type of contract) to be covered by the employer.
A more detailed comparison of various forms of employment, including civil-law contracts, is presented in table 2.1. The extensive use of civil-law contracts has a positive impact on labour costs that the employer has to cover. Indeed, as table 2.1 shows, it is cheaper to hire a person on the basis of a civil-law contract than on the basis of a regular open-ended employment contract, which is of great importance, as Polish employers per-ceive non-wage labour costs as excessive.23
Moreover, employers may decrease their operating costs by wider use of civil-law contracts due to the exemption from contribution to the State Fund for Rehabilitation of Disabled Persons (PFRON). The legal regulations state that a company employing more than 25 employees (full-time equivalent) is obliged to
22. Polish civil-law contracts that include “contract of mandate” and “contract to perform a specified task or work” may be classified, according to Eurofound’s categorization, as very atypical forms of work. This category includes three groups of workers: those who have no employment contract, those who report working a very small number of hours (less than 10 hours per week) and those who hold a temporary employment contract of six months or less (see Riso, 2010). Polish civil-law contracts fall into the first category. They are sometimes compared to zero-hours contracts, which are more and more popular in the United Kingdom.23. Some remarks on non-wage labour costs are presented in Chapter 3.
pay a contribution to PFRON, unless the share of dis-abled persons in total employment reaches 6 per cent. Because persons working on civil-law contracts are not counted as employees, small enterprises especially may prefer to sign civil-law contracts instead of employment contracts, keeping the number of employees below the level of reference to take advantage of the exemption.
Polish public statistics (GUS) do not provide separate data for fixed-term employment contracts and civil-law contracts. This is due to the fact that the question in the LFS survey, which is a base for calculating the share of employees with fixed-term contracts, is of a gen-eral nature – it does not specify the type of contract (employment or civil-law contract).24
Nonetheless, because the demand for reliable data on the scale of civil-law contracts in Poland has been reported by many stakeholders, the GUS estimated the number of persons employed in civil-law contracts in 2012. In order to do this, CSO data were combined with data from the Ministry of Finance and the Social Insurance Institution (Zakład Ubezpieczeń Społecznych). The estimates showed that for about 1.35 million persons, the civil-law contract was the only job arrangement they had. This accounted for around 10 per cent of the working population at the end of 2012.
Moreover, inspections in the area of legality of employment carried out by the National Labour Inspectorate in 2012 showed a growing tendency of signing civil-law contracts in situations in which an employment contract should be signed. Because of this tendency, the National Labour Inspectorate planned special activities for 2013–15 that would focus on checking if the civil-law contracts are signed in line with legal regulations. In 2012, NLI Inspectors ana-lysed 37,400 civil-law contracts and found that 16 per cent of them should have been in the form of a regular employment contract. In 2013, 19.4 per cent of the 44,000 civil-law contracts analysed should have been transferred to regular employment contracts (NLI, 2013, 2014).25
As already mentioned, trade unions generally oppose the extensive use of fixed-term contracts (espe-cially civil-law contracts), even during the economic
24. Some authors point out the need to introduce a precise question into the Polish LFS regarding the form of fixed-term contract, with distinctions between employment contracts based on the Labour Code regulations, and civil-law contracts (see Arak et al., 2014).25. The National Labour Inspectorate succeeded in transferring 5,100 civil-law contracts in 2012 and 6,700 in 2013 into regular employment contracts. It confirms the hypothesis that employers use this very atypical form of work excessively.

312. Contractual arrangements and employment protection legislation POLAND
Tabl
e 2
.1 C
omp
aris
on o
f va
riou
s fo
rms
of e
mpl
oym
ent
in P
olan
d
Wor
king
tim
eN
otic
e p
erio
dP
aid
leav
eH
ealt
hcar
e
cont
ribu
tion
(a
nd in
sura
nce)
Pen
sion
co
ntri
buti
onTo
tal c
ost f
or
empl
oyer
(p
er
cent
net
sal
ary)
Num
ber
of w
orke
rs(t
hous
ands
)
200
8Q
320
13
Q3
Labo
ur c
ontr
act
Perm
anen
t40
h o
r les
s2
wee
ks (f
or e
mpl
oym
ent
< 6
mon
ths)
, 1 m
onth
(for
em
ploy
men
t las
ting
6 m
onth
s –
2 ye
ars)
, 3 m
onth
s (fo
r em
ploy
men
t las
ting
> 2
year
s)
20/2
6 da
ys*
Yes
Yes
184
8 93
28
973
Fixe
d-te
rm
(6 m
onth
s or
mor
e)40
h o
r les
s2
wee
ks (o
nly
if co
nclu
ded
for >
6 m
onth
s)20
/26
days
*Ye
sYe
s18
43
387
3 36
1
Pro
batio
n pe
riod
(u
p to
3 m
onth
s)40
h o
r les
s3
days
– 2
wee
ksM
ax. 7
day
sYe
sYe
s18
4
Tem
pora
ryU
pon
agre
emen
tA
s in
per
man
ent c
ontr
act
Max
. 24
days
Yes
Yes
184
+ ag
ency
co
mm
issi
on
Civ
il-la
w c
ontr
acts
Con
trac
t of m
anda
teU
pon
agre
emen
tU
pon
agre
emen
tN
one
Yes
Yes
163
546.
7(e
st. 2
010)
1 35
0(e
st. 2
012)
Con
trac
t for
spe
cific
wor
kU
pon
agre
emen
tN
one
Non
eN
oN
o11
7
Sel
f-em
ploy
men
tS
ole
prop
rieto
rshi
pU
pon
agre
emen
tN
one
Upo
n ag
reem
ent
Not
com
puls
ory
123
2 96
52
897
* 20
wor
king
day
s pe
r ye
ar d
urin
g th
e fir
st 1
0 ye
ars
of e
mpl
oym
ent a
nd 2
6 w
orki
ng d
ays
ther
eaft
er. S
econ
dary
and
tert
iary
edu
catio
n pa
rtia
lly c
ount
s to
war
ds e
mpl
oym
ent t
ime.
Sou
rce:
NB
P (2
011)
and
ow
n.

322. Contractual arrangements and employment protection legislation POLAND
slowdown, emphasizing that employers use these very atypical forms of work excessively. The debate on “junk contracts”26 has recently been an important part of social dialogue in Poland. This strong opposition of the trade unions led to undertaking some initiatives aimed at reducing the scale of “junk contracts” in the Polish labour market.27 Trade unions repeatedly pointed to this issue within Tripartite Commission meetings. In 2012, Solidarność, the biggest nation-wide trade union, launched a nation-wide outdoor and on-line social cam-paign (figure 2.3).
26. The term “junk contracts” became popular and widely used in Poland in 2011, when the report “Youth 2011” was published. “Junk contracts” includes civil-law contracts and self-employment used by employers instead of regular employment (open-ended) contracts. The term is not a synonym for “junk jobs” – the term coined in the United States in the 1970s. However, junk jobs may be provided within junk contracts.27. This is generally in line with European Commission guide-lines – in the Council Recommendation on Poland’s 2013 national reform programme, the Council recommended to “Combat in-work poverty and labour market segmentation through better transition from fixed-term to permanent employment and by reducing the excessive use of civil-law contracts”.
The goal of the campaign was twofold: (a) to raise awareness, especially among the youth, of patho logical and excessive use of civil-law contracts; and (b) to promote the legislative proposal of Solidarność con-cerning legal changes aimed at reducing the scale of utilization of “junk contracts”.28 The campaign referred to the Sisyphean labour myth, arguing that “junk con-tracts” may lead to endless employment on a basis of civil-law contracts without having a chance for regular employment on the open-ended contract.
The main slogan of the campaign was “I do not want to start from scratch every day. Stop junk contracts”. The campaign took advantage of the word-play. Sisyphus in Polish is written as “Syzyf ”. If one hides the letters “yz”, as shown in figure 2.3, it gives the word “Syf ”, which may be translated into English as “junk”. This word-play was supposed to show people that excessive use of “junk contracts” leads to unfavourable treatment of people with such contracts.
In 2013, Solidarność sent an official complaint to the European Commission with regard to the excessive use of fixed-term contracts. As the European Commission’s consultations with the Polish government did not bring satisfactory outcomes in four areas reported by Solidarność, the Commission initiated formal proceedings.29
2.3 Changes in EPL caused by the economic crisis
It should be emphasized that although the recent changes introduced into the legal framework in Poland focus on providing more flexibility (as well as necessary security measures) in order to counteract the negative effects of economic slowdown resulting from the world financial crisis, they had no impact on OECD EPL indicators.30 Generally, regulatory changes in the Polish labour market have been modest compared with most
28. This proposal was presented to the Prime Minister in May 2012.29. In 2014 the Ministry of Labour and Social Policy presented proposal with regard to changes in social security contributions linked to contract of mandate. This change may, potentially, reduce the scale of use of this type of civil-law contract in Poland.30. The values of the EPRC, EPR, EPC and EPT indexes were stable between 2008 and 2013 (measured in line with Version 3 of EPL methodology). Polish labour market experts assess the legal regulations that determine the strictness of employment pro-tection as moderate, which makes the Polish labour market quite flexible in comparison with other OECD countries (see Kryńska, 2007; Kryńska and Kwiatkowski, 2013). In spite of this, there is widespread opinion among employers that in practice the firing of employees on open-ended contracts is very difficult and costly.
Figure 2.3 Campaign poster
Source: http://www.kampaniespoleczne.pl/kampanie,2523,syf_i_syzyf, accessed on 19.07.2014. The campaign video may be found at: http://www.youtube.com/watch?v = -1ET-3q_5ok

332. Contractual arrangements and employment protection legislation POLAND
other EU countries, without major problems that would force immediate policy responses.
The main measures aimed at counteracting the effects of the economic crisis were introduced within the so-called “Anti-crisis package”. The proposals in this package were implemented in December 2008, when the social partners and the government came to the agreement that it was necessary to develop instruments and tools which might stimulate the Polish economy and minimize the impact of the crisis. The proposals were discussed within the social dialogue within the Tripartite Commission. In March 2009, employers’ organizations and trade unions within the process of autonomous dialogue agreed that the package should consist of 13 proposals addressing three areas: wages and welfare benefits, labour and employment relations and economic policy. The package was forwarded to the gov-ernment, which prepared specific legislative solutions. Finally, the main proposals were included in the Act on mitigating the effects of economic crisis on employees and enterprises ( Journal of Laws 2009, No. 125, item 1035) which was passed by parliament on 1 July 2009.31
The Act introduced special measures to counteract the effects of the crisis, with great emphasis on the labour market situation. Out of these measures, in force between 22 August 2009 and 31 December 2011, the following had the biggest influence on labour market flexibility and employment relations:(a) extension of the settlement period32 to 12 months;(b) introduction of individual distribution of working
time, mainly variable working hours, which means that an employee’s work schedule may provide for different hours for starting work;33
(c) defining the maximum cumulative length of sub-sequent fixed-term employment contracts as 24 months. “Regular”, i.e. not anti-crisis, legal regu-lations in Poland do not prescribe the maximum period for which a fixed-term employment con-tract may be entered into, but limit the number
31. See Eurofound (2010, 1–2) for a detailed description of the process of introducing the “Anti-crisis package”.32. According to the Polish Labour Code, a “settlement period” is the measurement for determining whether an employer has ful-filled certain working time obligations. In particular, an employer is obliged to observe an average five-day working week in the adopted settlement period and ensure that the total weekly working time (including overtime hours) does not exceed an average of 48 hours.33. Extended settlement period and flexi-time within the “Anti-crisis package” were introduced by almost 1,100 companies (see: http://www.mpips.gov.pl/aktualnosci-wszystkie/prawo-pracy/art,6470,2lata-uelastycznienie-czasu-pracy.html, accessed 20.07.2014).
of such contracts signed consecutively by the same employer and the same employee to two. The Act on mitigating the effects of economic crisis on employees and enterprises enabled (until the end of 2011) signing an unlimited number of subsequent,34 temporary contracts, provided that their duration was no longer than 24 months;
(d) reduction of working hours by up to half of the usual full-time total for a maximum period of 6 months. Since the wages were lowered propor-tionally, the workers were entitled to receive add-itional benefits from the Guaranteed Employee Benefits Fund. The benefit was capped at no more than 70 per cent of the equivalent of monthly un-employment benefits for the missing hours;
(e) protection against dismissal of an employee during the period in which an employer received subsidies to sustain employment of the employee.
When the anti-crisis measures defined in the Act on mit-igating the effects of the economic crisis on employees and enterprises ceased to be in force, social partners and the government started working on implementing some solutions from the “Anti-crisis package” into the legal framework. These works led to the introduction of the Act of 11 October 2013 on special measures related to the protection of jobs (Journal of Laws 2013, item 1291) and the Act of 12 July 2013 amending the law – the Labour Code and the Act on Trade Unions (Journal of Laws 2013, item 896).
The first change – the Act of 11 October 2013 on spe-cial measures related to the protection of jobs – intro-duced measures addressed to employers who reported a decline in total turnover of not less than 15 per cent for six consecutive months of the year. The Act provides the following solutions:(a) economic downtime – the period of an employee’s
inactivity for reasons not related to the employee, while the employee remains in readiness for work;
(b) reduction of working hours by up to half of the usual full-time total.
Terms and conditions of employment during economic downtime or reduced working hours are to be deter-mined in the collective labour agreement or in con-sultation with the trade unions. If there are no such collective agreements, the employer should consult with employees’ representatives.
34. “Subsequent” means that the interval between the termin-ation of the previous contract and the signing of the next contract does not exceed three months. Should the interval be longer, the 24-month limit was not binding.

342. Contractual arrangements and employment protection legislation POLAND
The other change – that led to the introduction of the amendment to the Labour Code in August 2013 – was related to the area of employment relations and working-time schemes. The consultations within the framework of social dialogue started in February 2012. The Tripartite Commission worked on the issues of new regulations for working-time arrangements and employment relations within the framework of fixed-term employment contracts, civil-law contracts, self- employment and temporary-work-agency employment until the end of 2012. The government proposals in the area of working-time arrangements were not accepted by the trade unions. As a result, the Act of 12 July 2013 amending the law – the Labour Code and the Act on Trade Unions – was passed without the trade unions’ agreement.35 This amendment implemented two meas-ures of the “Anti-crisis package”:(a) possibility of extension of the settlement period to
12 months;(b) use of variable working hours by companies.
To introduce these solutions within a company, an employer is obliged to report this to the National Labour Inspectorate and to obtain the consent of the trade unions operating in the company. The employer should consult with employees’ representatives, if there is no trade union organization in the enterprise.
According to data collected by the National Labour Inspectorate, up until April 2014 the extended settle-ment period had been introduced by 707 companies (569 enterprises decided to take advantage of the maximum extension to 12 months). In most of these companies there were no trade union organizations op-erating, and the agreement was made between employer and employees’ representatives.
In the context of Polish debate related to the employment relationship, excessive use of very atypical forms of work (mainly civil-law contracts) and recent changes intro-duced into the legal framework in order to counteract the effects of economic crisis, it is worth mentioning that discussion has recently started about the poten-tial implementation of a single open-ended contract in Poland. The idea of a single contract, attributed to Tito Boeri (Boeri et al., 2013), has been suggested by the European Commission as a tool that may better align employment protection legislation for permanent
35. It was one of the reasons for suspending the trade unions’ attendance in the Tripartite Commission meetings. This situation has continued up to the time of preparation of this report.
and fixed-term contracts, while at the same time re-ducing the number and typology of available fixed-term contracts.36
This idea has not been seriously analysed in Poland until recently, when the Institute for Structural Research (an independent think-tank) published a policy paper and organized a conference on 17 June 2014 in Warsaw. Both actions were focused on presenting the possible ways of counteracting the duality of the Polish labour market with specific recommendations, one of which is the implementation of a single open-ended contract in Poland. This proposal has been accepted by the Ministry of Labour and Social Policy and employers’ representatives37 as a good starting point for launching a feasibility study and debate on the potential legal regu-lations leading to introduction of single contract.
Another recent change in employment protection has been the so-called “deregulation reform”. It aims to remove or reduce entry barriers to some professions (e.g. licences, exams, fees and other barriers imposed by pro-fessional self-governing bodies), and has been planned in four stages to facilitate access to more than 250 professions. In the first stage, introduced in 2013, 51 professions (including many legal) were “deregulated”. The second stage came into being in August 2014 and added another 96 professions. The expected positive employment effects of these actions are to be revealed in the medium term.
36. http://www.google.pl/url?sa = t&rct = j&q = &esrc = s&source = web&cd = 1&cad = rja&uact = 8&ved = 0CB8QFjAA&url = http%3A%2F%2Fec.europa.eu%2Feurope2020%2Fpdf%2Ft-hemes%2F25_employment_protection_legislation_02.pdf&ei = AZDLU5yWHbL54QT9vIGQCw&usg = AFQjCNFsZNvXTb3q8YSNPyoM2NE6ZTVCUA&bvm = bv.71198958,d.bGE, accessed on 20.07.2014.37. Unfortunately, trade union representatives did not attend the conference even though they were invited – as a result, the trade unions’ attitude towards this proposal is unknown.

353. Unemployment benefits, social insurance and social assistance POLAND
3.1 Unemployment benefit regulations during the crisis period
Basic regulations on unemployment benefits have undergone many amendments over the past two dec-ades. As a result of these changes, the system of un-employment benefits has changed from liberal, with a generous system of granting benefits in 1990, to increas-ingly restrictive in terms of setting conditions for eli-gibility and determining the benefit amount. Changes in the years 2007–13 continued this trend. The Act of 19 December 2008, an amendment to the Act on employment promotion and labour market institu-tions and certain other acts, introduced key changes in the regulation of unemployment benefits. The Act changed the benefit amount and period. A healthy Labour Fund, as well as the relatively small number of people receiving unemployment benefits, were the rea-sons for these changes, according to the explanatory memorandum to the Act. The proposed solutions, on the one hand, rationalized the expenditure incurred by the Labour Fund for the so-called passive forms of sup-port, and on the other hand, they were to encourage the unemployed to seek work and be active. These changes corresponded to the National Reform Programme for the years 2008–11 for the implementation of the Lisbon Strategy (hereinafter NRP 2008–11) adopted by the Council of Ministers on 18 November 2008. The final version of the Programme was established after public
consultation with scientific, academic and business organizations, trade unions and NGOs. However, the work on the programme was carried out in the period before the effects of the global crisis were even felt. This is clearly reflected by the projected values of macroeco-nomic indicators adopted in the NRP 2008–11 (see table 3.1) A report on the implementation of the NRP 2008–11 took into account changes in the situation and drew attention to the fact that, on the one hand, a 20 per cent increase in the amount of benefits received compared with that existing in 2009, introduced by the amendment to the Act on Employment Promotion and Labour Market Institutions on 1 January 2010, would increase social cover for people losing their jobs, and on the other hand, the degression principle included in the benefit would motivate the unemployed to seek employment in the initial period after registration.
The changes are also important for the implementation of flexicurity into the Polish labour market policy and for work on the development of a modern social security system. The Ministry of Labour and Social Policy has initiated a number of research projects in this area. One of these was a project implemented by the Institute of Labour and Social Studies (IPiSS) entitled “Evaluation of the implementation of flexicurity into the Polish labour market policy”. There was wider debate on this project in the scientific community, NGOs and the public employment service.
Unemployment benefits, social insurance
and social assistance 3
Table 3.1 Number of unemployed and unemployment rate, 2007–11: (a) assumed in the National Reform Programme 2008–11; (b) actual
2007 2008 2009 2010 2011
Number of unemployed (end of year, thousands)
(a) 1 747 1 377 1 285 1 209 1 099
(b) 1 746.6 1 473.8 1 892.7 1 954.7 1 982.7
Registered unemployment rate (end of year, %)
(a) 11.4 9.1 8.5 8.0 7.3
(b) 11.2 9.5 12.1 12.4 12.5
Source: NRP 2008–11 for the implementation of the Lisbon Strategy, Ministry of Economy, GUS.

363. Unemployment benefits, social insurance and social assistance POLAND
Tabl
e 3
.2 U
nem
ploy
men
t b
enefi
ts a
nd m
inim
um w
age,
20
07–1
3 (g
ross
, PLN
)
2007
2008
200
920
1020
1120
1220
13
Unt
il 31
May
From
1
Jun
Unt
il31
May
From
1 J
unU
ntil
31 M
ayFr
om
1 Ju
nU
ntil
31 M
ayFr
om1
Jun
Unt
il31
May
From
1
Jun
Unt
il31
May
From
1 Ju
nU
ntil
31 M
ayFr
om1
Jun
Ben
efit,
bas
ic a
mou
nt
(10
0%)
A53
2.90
538.
3055
1.80
575.
0059
5.20
610.
7063
7.00
660.
60
B71
7.00
742.
1076
1.40
794.
2082
3.60
C56
3.00
582.
7059
7.90
623.
6064
6.70
Ben
efit,
incr
ease
d am
ount
(120
%)
A63
9.48
645.
9666
2.16
690.
0071
4.24
732.
8476
4.40
792.
72
B86
0.40
890.
5291
3.68
953.
0498
8.32
C67
5.60
699.
2471
7.48
748.
3277
6.04
Ben
efit,
dec
reas
ed a
mou
nt(8
0%)
A42
6.32
430.
6444
1.44
460.
0047
6.16
488.
5650
9.60
528.
48
B57
3.60
593.
6860
9.12
635.
3665
8.88
C45
0.40
466.
1647
8.32
498.
8851
7.36
Min
imum
wag
e93
6.00
1 12
6.00
1 27
6.00
1 31
7.00
1 38
6.00
1 50
0.00
1 60
0.00
Not
es: A
– A
mou
nt o
f the
ben
efit g
rant
ed b
y 31
Dec
200
9; B
–A
mou
nt o
f the
ben
efit g
rant
ed a
fter
1 J
an 2
010
in th
e fir
st th
ree
mon
ths
of r
ecei
ving
; C –
Am
ount
of t
he b
enefi
t gra
nted
aft
er 1
Jan
201
0, s
tart
ing
from
the
four
th m
onth
.
Sou
rce:
Not
ices
of t
he M
inis
try
of L
abou
r an
d S
ocia
l Pol
icy
on th
e am
ount
of u
nem
ploy
men
t ben
efit (
2006
–13)
and
Gov
ernm
ent r
egul
atio
n on
the
min
imum
sal
ary
(200
6–13
).

373. Unemployment benefits, social insurance and social assistance POLAND
Below is a detailed outline of legal regulations con-cerning unemployment benefits during the period 2007–13. Throughout this period, the unemployed had the right to receive unemployment benefits seven days after registration with the relevant district (in Poland this is known as a powiat) labour office, provided they met both of the following conditions:(1) There was no suitable employment proposal for
them and no training proposals; they had not been referred for intervention works, public works, internships, or vocational training38.
(2) During the 18 months preceding the date of registration, for a total of at least 365 days, they were employed and received pay at least equal to the minimum wage; performed work in other forms established by law (civil contract, economic activity, cooperation within the contracts, cooper-ation within economic activity and other) receiving the income from which they paid contributions for social insurance and Labour Fund calculated from the base at least equal to the minimum wage or paid contributions to the Labour Fund in connec-tion with employment abroad; or were employed within the 18 months prior to registration for at least 365 days abroad and had arrived in Poland as repatriates.
In Poland, the amount of benefits is specified in a uni-form manner for each unemployed person. Throughout the period considered, unemployment benefits were paid in three different amounts, depending on the seni-ority of the unemployed person. Basic allowance repre-senting 100 per cent of unemployment benefit is paid to persons who worked from five to 19 years inclusive. The unemployed with work experience of at least 20 years receive the increased allowance equal to 120 per cent of the basic allowance. The unemployed with work experience up to five years receive a reduced allowance equal to 80 per cent of the basic allowance. In the years 2007–09 the amount of the unemployment benefit did not change during the benefit period. From 1 January 2010 the principle of a one-off degression of the amount of unemployment benefits was introduced in Poland. The allowance is higher in the first three months of the benefit period, and is subsequently decreased. The amount of the benefit is indexed annually on 1 June with average annual prices. Detailed information on the amount of benefits paid in the years 2007–13 is summar ized in table 3.2.
38. See chapter 5 for a more detailed explanation of these forms of employment.
3.2 Protection of vulnerable unemployed persons
In addition to the general regulations, there are some rules targeted at unemployed persons who are identi-fied as being in more difficult situations, but these were also subject to changes in recent years. For example, the benefit period in Poland varies, depending on the place of residence, and the characteristics of individ-uals. In 2007, this period was 6, 12 or 18 months. A basic period of receiving unemployment benefit was six months and it was applied to an unemployed person who, during the benefit period, resided in the powiat with an unemployment rate not exceeding 125 per cent of the national average unemployment rate. The 12-month period extended to the unemployed living in the powiat with an unemployment rate exceeding this threshold. Additionally, the unemployed over 50 years of age and having at least 20 years of unemployment benefit eligibility period, regardless of their place of residence, were eligible to receive the benefits for 12 months. An 18-month benefit period was also provided in 2007 and 2008. Two groups of unemployed persons were entitled to this extended period. The first group were the unemployed who met both the following two conditions:(a) They were residing in the powiat where the un-
employment rate exceeded twice the average un-employment rate in the country.
(b) They had at least 20 years of unemployment benefit eligibility period.
The second group were the unemployed who had at least one dependent child under the age of 15 years, and the spouse of the unemployed person was also unemployed and had forfeited the right to benefits because of the expiry of the period of receiving benefits, after the day of acquiring the right to benefits by the unemployed person.
The rules were amended in 2009. Out of the previous three benefit periods, only two have been left - the 6-month and the 12-month periods. At the same time, the level of the unemployment rate necessary to extend the benefit period has been increased. The six-month right to benefit was granted to the unemployed living in the powiat with an unemployment rate not exceeding 150 per cent of the national average unemployment rate.
At least one of the following conditions had to have been met by the unemployed person to acquire the right to the extended 12-month benefit period. The unemployed person must have:

383. Unemployment benefits, social insurance and social assistance POLAND
(a) resided in the powiat with an unemployment rate exceeding 150 per cent of the national average un-employment rate;
(b) been over 50 years of age and, at the same time, had at least 20 years of unemployment benefit eli-gibility period; or
(c) had at least one dependent child under the age of 15 and the spouse of the unemployed person also been unemployed and have forfeited the right to benefits because of the expiry of the period of receiving benefits, after the day of acquiring the right to benefits by the unemployed person.
In 2014, the list of persons entitled to a 12-month benefit period was extended to include unemployed single parents with at least one dependent child under the age of 15.
In the period analysed there have been no specific solutions targeted at young people, while the so-called pre-retirement benefits were provided for the oldest of the unemployed in the labour market. The rules for granting these benefits were determined by the Act on pre-retirement benefits. Conditions required for granting pre-retirement benefits are classified into two groups. The first group consists of specific conditions, individualized depending on seniority, age, reasons for termination of employment and so on. The other group includes equal conditions for all persons who apply for a pre-retirement benefit.
This benefit could be granted to a person who meets one of the specific conditions laid down in the Act, namely:(1) They were aged at least 56 (women) or 61 (men)
and had an insurance record to receive an old-age pension of at least 20 years for women and 25 years for men and:(a) termination of their employment contract or
service relationship was due to the liquidation or insolvency of the employer by whom they were employed or were in a relationship of sub-ordination for more than six months, or
(b) until bankruptcy, ran, continuously for a period of not less than 24 months, a non-agricultural company and paid social security contributions for that period.
(2) They were aged at least 55 (women) or 60 (men) and had an insurance record to receive an old-age pension of at least 30 years for women and 35 years for men, and termination of their employment contract or service relationship occurred for rea-sons related to the workplace in which they were
employed, or they were in relationship of subordin-ation for more than six months.
(3) They had an insurance record to receive an old-age pension of at least 35 years for women and 40 years for men, and:(a) termination of employment was due to rea-
sons related to the workplace, where they were employed for more than six months, or
(b) termination of their employment contract or service relationship was due to the liquidation or insolvency of the employer by whom they were employed or were in a service relationship for more than six months.
(4) They were at least 55 (women) and 60 (men) and had an insurance record to receive an old-age pen-sion of at least 20 years for women and 25 years for men, and registered with the competent powiat labour office within 30 days from the date of the loss of the entitlement to a disability pension (which was previously granted for more than five years).
The person who met one of the above conditions could receive a pre-retirement benefit if: (1) they had received unemployment benefits for at
least six months;(2) they were still registered as unemployed;(3) within the period of receiving unemployment
benefits they did not refuse, without justified reason, a proposal of suitable employment or other gainful work within the meaning of the Act on the promotion of employment, or employment under intervention works or public works;
(4) they submitted an application for the pre- retirement benefit within 30 days from the date of issue by the powiat labour office of the document certifying the six-month period of receiving the unemployment benefit;
(5) they submitted an application within 14 days of termination of employment, including interven-tion works or public works or other gainful work, if during the period of receiving benefits they performed other gainful work, or were employed under intervention or public works, and the per-formance of one of these works ceased after a six-month period of receiving unemployment benefits. Starting from 1 February 2011, in particularly jus-tified cases, the specified term could be extended by the pension body at the request of the person concerned.

393. Unemployment benefits, social insurance and social assistance POLAND
The amount of the pre-retirement benefit is subject to periodic indexation to the terms and time limits pro-vided for in the pension Act; from 1 March 2013 it became PLN957.78. It is paid by the Social Security Institution. Since 2009, the benefit has been financed from the Labour Fund, while previously it came from budgetary resources.
3.3 Additional measures in reaction to the crisis
The growing concerns about the effects of the crisis resulted in the preparation of the government package of anti-crisis measures, which included the 2009 Act on measures to mitigate the effects of the economic crisis. The Act introduced solutions which could be qualified as protection on account of partial unemployment. The Act allowed employees to receive benefits to: (a) par-tially compensate employee wages during economic downtime, for a period of six months, in the amount of 100 per cent of the benefit; and (b) partially compen-sate for the reduction of working hours, for a period of six months, up to 70 per cent of the benefit. These benefits were paid to employees at the request of the employer. The programme was temporary and ceased on 31 December 2011.
The amendments were designed to increase social pro-tection for the unemployed and enhance motivation for intensive job searching. At the same time, it was expected that spending on unemployment benefits would remain at a similar level globally. The reversal of trends in the labour market made it impossible to achieve the latter
objective. Achieving the first two effects was also threat-ened. On the one hand, an increase in the amount of the benefit after 2010 raised the level of income received during unemployment, but on the other hand, the reduction of the benefit period in the areas affected by particularly high unemployment actually decreased the amount of this income.
Until 2008, Labour Fund expenditures on benefits and allowances had steadily declined, reaching PLN1,911 million, i.e. 33.2 per cent of the total expend-iture of the Labour Fund. The changes introduced in 2009 increased the share of these expenditures to 40.1 per cent and, eventually, to 55.1 per cent in 2012, i.e. PLN5,316.7 million (see table 3.3).
The benefits/wages ratio provides information on the extent to which benefits provide income protection. Taking the minimum wage as a point of reference, table 3.4 compares the relationship of these values. A decline in this relationship is a constant feature of the Polish social benefits system. In 2007, basic allowance accounted for 57 per cent of the minimum wage, in 2010 it was already 45 per cent and in 2013 it dropped further to 41 per cent. Increasing the amount of the allowance and changing the rules for eligibility has raised this rela-tionship since 2010, but only in the first three months of benefit receipt. Starting from the fourth month, its rela-tion to the minimum wage has declined. This regular decline in the ratio of unemployment benefits to the minimum wage is the result of differences in the deter-mination of these two values, and a much faster growth rate of the minimum wage.
Table 3.3 Revenues and expenditures of the Labour Fund, including expenditures on unemployment benefits and allowances
Year Total revenues Labour Fund contribution EU funds (ESF) Total expenditures Benefits and allowances*
(million PLN) (million PLN) (million PLN) (million PLN) (million PLN) %**
2005 6 834.0 6 329.0 273.5 5 550.8 2 997.7 54.0
2006 7 513.4 6 711.6 661.6 5 500.4 2 805.3 51.0
2007 8 395.8 7 669.4 615.9 5 367.2 2 267.8 42.3
2008 9 103.9 8 766.7 189.3 5 753.1 1 911.0 33.2
2009 10 326.7 8 790.9 708.4 11 245.0 4 504.1 40.1
2010 10 970.3 8 587.7 1 562.1 12 376.4 5 013.7 40.5
2011 10 501.0 8 940.8 1 057.1 8 751.4 4 796.2 54.8
2012 11 224.6 9 190.2 645.6 9 641.3 5 316.7 55.1
2013 (planned) 10 482.5 10 052.5 180.0 10 804.0 5 590.0 51.7
Notes: *Pre-retirement benefits and allowances, paid by the Polish Insurance Institution (ZUS), were financed from budgetary resources until 2008; since 2009 they have been financed from the Labour Fund. **Percentage of total expenditures.
Source: Ministry of Labour and Social Policy.

403. Unemployment benefits, social insurance and social assistance POLAND
Tabl
e 3
.4 U
nem
ploy
men
t b
enefi
ts in
rel
atio
n to
min
imum
wag
e (p
er c
ent)
2007
2008
200
920
1020
1120
1220
13
Unt
il 31
May
From
1
Jun
Unt
il31
May
From
1 J
unU
ntil
31 M
ayFr
om
1 Ju
nU
ntil
31 M
ayFr
om1
Jun
Unt
il31
May
From
1
Jun
Unt
il31
May
From
1 Ju
nU
ntil
31 M
ayFr
om1
Jun
Bas
ic a
mou
nt
(10
0%)
A57
5849
4545
4442
41
B54
5655
5351
C43
4443
4240
Incr
ease
d am
ount
(120
%)
A68
6959
5454
5351
50
B65
6866
6462
C51
5352
5049
Dec
reas
ed a
mou
nt(8
0%)
A46
4639
3636
3534
33
B44
4544
4241
C34
3535
3332
Not
es: A
– A
mou
nt o
f the
ben
efit g
rant
ed b
y 31
Dec
200
9; B
–A
mou
nt o
f the
ben
efit g
rant
ed a
fter
1 J
an 2
010
in th
e fir
st th
ree
mon
ths
of r
ecei
ving
; C –
Am
ount
of t
he b
enefi
t gra
nted
aft
er 1
Jan
201
0, s
tart
ing
from
the
four
th m
onth
.
Sou
rce:
Not
ices
of t
he M
inis
try
of L
abou
r an
d S
ocia
l Pol
icy
on th
e am
ount
of u
nem
ploy
men
t ben
efit (
2006
–13)
and
Gov
ernm
ent r
egul
atio
n on
the
min
imum
sal
ary
(200
6–13
).

413. Unemployment benefits, social insurance and social assistance POLAND
A closer look at the replacement rates provides evi-dence that, for the majority of employees, losing a job is associated financially with a very difficult situation and there was no improvement whatsoever in the situ-ation of these individuals between 2008 and 2013 (see figure 3.1). In gross terms, unemployment benefits rep-resent just over 18 per cent of average total salary. Due to the fixed amount of unemployment benefits, replace-ment rates are always higher for lower-paid groups. It should be remembered though, that a large share of the youngest and least-experienced unemployed individ-uals fail to meet eligibility criteria for unemployment benefits, as discussed earlier.
3.4 Unemployment benefit eligibility and labour market flows
As already shown in Chapter 1, a consistent feature of Polish unemployment is that only a small fraction of the unemployed are entitled to receive unemployment benefits, which is due to the relatively short benefit period and the required period of employment prior to the registration of persons applying for this benefit. The share of people eligible for unemployment benefits in 2007 was close to 14 per cent and was strongly differen-tiated by gender (see figure 3.2). The percentage of men was around 17 per cent, and the percentage of women was slightly above 11 per cent. Since 2008, this share has been increasing for both genders, first slowly and then rapidly, reaching a peak in mid-2009. In subsequent
Figure 3.1 Unemployment benefit replacement rates for persons earning minimum salary, average and average for the youth and least-experienced population
Source: GUS.
Figure 3.2 Share of the unemployed eligible for benefits, by gender
Source: Website of Public Employment Services and own calculations.

423. Unemployment benefits, social insurance and social assistance POLAND
periods, the share fell in both cases. The decrease in the fraction of people receiving unemployment benefits in the second half of 2009, despite the upward trend in un-employment, can be attributed to the impact of changes relating to the determination of the benefit period, as discussed above.
In 2007 and 2008 an average of 207,500 persons a month were registering as unemployed, including around 41,500 entitled to unemployment benefits. Subsequent years have seen a significant increase in inflows. In 2009, on average 257,000 persons were reg-istering per month, of which 61,000 were entitled to benefits. This number fell slightly in the following year. Changes in the amount of the allowance introduced in 2010 caused significant growth in the registration of the unemployed in the first few months of that year, following a temporary decline in the last few months
of 2009. Analysis of the dynamics of inflow does not indicate, however, that this change caused any conse-quences in the longer term (see figure 3.3).
During the whole period under study, the total rates of outflow from unemployment among benefit recipients were higher than among the unemployed without the right to benefits (see figure 3.4). The rates of outflow for benefit recipients do not exhibit higher volatility during the period in question. Only the first few months of 2009 saw much stronger declines in this value than in the corresponding months of successive years. The rates of outflow from unemployment for non-benefit recip-ients show a clear downward trend. In practice, the two groups differ in the duration of unemployment. Predominantly, the short-term unemployed receive un-employment benefits, while the long-term unemployed are not entitled to benefits.
Figure 3.3 Inflows to unemployment (quarterly)
Source: Website of Public Employment Services and own calculations.
Figure 3.4 Rate of outflows from unemployment by unemployment benefit eligibility
Source: Website of Public Employment Services and own calculations.

433. Unemployment benefits, social insurance and social assistance POLAND
3.5 Social assistance available for the unemployed
Unemployed persons who have exhausted the un-employment benefit period may apply for social assistance benefits. The Act of 12 March 2004 on social assistance is the legal basis for payment of this benefit. Access to these benefits is income-based and income criteria are subject to indexation every three years. In practice, between 1 October 2006 and 30 September 2012 the income criteria remained at PLN477 net for an unemployed person who runs a single-person house-hold and PLN351 net for a person in a family household. From 1 October 2012, the criteria became PLN542 net and PLN456 net, respectively. An unemployed person can get a temporary allowance; the amount is deter-mined in such a way that the income of a person or of a family is deducted from the amount of the corres-ponding income criterion. The maximum amount of
the allowance may not currently exceed PLN529 (in the case of a person who runs a single-person house-hold). Before 1 October 2012 the maximum allowance was PLN444.
Considering the range of social assistance in Poland, it can be seen that in the years 2007–08 the number of people receiving benefits declined. The decline affected both the total number of persons who were granted social assistance benefits and the number of people receiving temporary benefits. The share of people who obtained benefits because of unemployment declined significantly (see table 3.5). Social expectations were that the coming years would strengthen this trend, which in fact never happened. While it is true that in 2009 the total number of persons who were granted social assistance fell by 1.3 per cent to 1.94 million, in the same period, the number of people receiving temp-orary benefits, as well as the share of those who received
Figure 3.5 Real expenditures on social security (2007 = 1)
Source: Data from Ministry of Labour and Social Policy.
Figure 3.6 Number of beneficiaries of social assistance programmes, by type (2007 = 1)
Source: Data from Ministry of Labour and Social Policy.

443. Unemployment benefits, social insurance and social assistance POLAND
Tabl
e 3
.5 S
ocia
l ass
ista
nce
ben
efici
arie
s an
d b
enefi
ts b
roke
n do
wn
by c
ateg
orie
s
Year
Num
ber
of
per
sons
gr
ante
d a
ben
efit
Tota
l am
ount
of
ben
efits
(t
hous
and
PLN
)
Per
iodi
c b
enefi
tsB
enefi
ts d
ue to
une
mpl
oym
ent r
easo
ns
Num
ber
of
per
sons
gr
ante
d a
ben
efit
Num
ber
of
ben
efits
Am
ount
of
ben
efits
(t
hous
and
PLN
)
Num
ber
of
per
sons
gr
ante
d a
ben
efit
Num
ber
of
ben
efits
Am
ount
of
ben
efits
(t
hous
and
PLN
)
Sha
re in
p
erio
dic
ben
efits
(%
)
Sha
re in
tota
l b
enefi
ts
(%)
Ave
rage
b
enefi
t (t
hous
and
PLN
)
01
23
45
67
8[6
]/[3
][6
]/[1
][8
] / [7
]
2007
2 21
1 22
02
020
326
552
604
3 10
1 32
954
1 10
343
1 27
52
459
847
446
917
7820
181.
69
2008
1 96
5 33
82
160
335
444
683
2 43
2 86
664
7 86
532
9 80
01
808
840
510
407
7417
282.
17
2009
1 93
9 88
32
234
696
459
552
2 41
7 03
864
5 40
335
2 87
31
825
817
512
332
7718
280.
60
2010
1 99
8 52
42
925
719
464
400
2 43
9 07
863
6 85
836
9 91
71
929
282
529
069
8019
274.
23
2011
1 92
7 30
02
913
700
455
606
2 46
3 58
264
3 47
436
8 36
31
984
133
543
446
8119
273.
90
2012
1 91
7 81
73
053
422
479
937
2 56
9 31
872
7 34
938
7 74
62
070
268
611
311
8120
295.
28
2013
1 97
9 29
03
526
065
535
743
3 01
2 86
71
007
061
433
557
2 43
3 82
984
6 02
981
2234
7.61
Sou
rce:
Dat
a fr
om M
inis
try
of L
abou
r an
d S
ocia
l Pol
icy.

453. Unemployment benefits, social insurance and social assistance POLAND
this benefit on account of unemployment, increased. In the years 2009–11, these numbers remained stable. In 2012, and especially in 2013, there was, however, a sharp increase both in real expenditures on total temporary benefits, including temporary benefits paid on account of unemployment (see figure 3.5) and in the number of beneficiaries of these benefits (see figure 3.6).
Work has recently begun on a fundamental reconstruc-tion of the system of social assistance which will take into account the changing conditions of social policy implementation and similar new challenges facing the Polish labour market. Currently the principles of the future reform of the social assistance system are being developed. The main areas of future reform include measures to make beneficiaries of social assistance eco-nomically active, simplifying the benefits system and changing the criteria for access to benefits.

464. Wages POLAND
4Wages
4.1 General trends
Wages in Poland lagged behind labour productivity for the entire period since the transition towards a market economy started in 1990, up until 2007. In 2008, the unemployment rate reached a record low level and this translated into considerable wage pressure. In the mean-time, the increase in labour productivity slowed down and 2008 marked the first year where the wage growth rate exceeded the productivity growth rate (figure 4.1). Subsequently, in 2010 and 2013 both the growth rates were roughly equal, which did not stop the downward trend of wage share in GDP, observed for a longer period. In 2013 it stood at 46.4 per cent, the third lowest in the EU28, after Slovakia and Latvia.
Wages are strongly differentiated by sector and this vari-ation is more pronounced among men than women. As in many other countries, the financial industry was offering the most competitive salaries prior to the crisis. The crisis, however, did not reduce the relative level of competitive salaries. On the contrary, men working in finance in 2012 were earning 114.2 per cent more than
the average salary, up from 108.6 per cent in 2008. The financial industry was also offering the best paid jobs for women, even though their wages were only around 61 per cent above average. Between 2008 and 2012 the financial industry replaced information and communi-cation as the best paying industry for women. Another interesting dynamic was observed in agricultural profes-sions, which started paying significantly higher salaries between 2008 and 2012. This is a result of efficiency improvements in that sector, with considerable contri-butions from EU policies and funds, but concluding that there was a widespread increase in agricultural work incomes would not be correct. After all, the stat-istics only cover enterprises employing nine or more employees, while agriculture is still fragmented in terms of acreage and size of enterprise, with a predominance of individual farmers.
Figure 4.3 confirms that the public sector generally offers higher salaries than the private sector, with the exception of some commercial services (including financial, real estate and communication services). The biggest advantage of the public over the private sector
Figure 4.1 Salary, productivity and wage share dynamics
Source: AMECO database.

474. Wages POLAND
was found in agriculture and industry. In the former case, there was also a large jump in average public sector salaries, which explains what drove its general increase, identified previously in figure 4.2. Industry employees in the public sector benefit from wages 40 per cent higher than in private enterprises. It must be acknow-ledged, however, that public sector industry workers
are relatively scarce; more than 87 per cent of industry workers worked in private firms as of 2013.
Figure 4.4 sheds some more light on gender wage dis-parities in Poland. The salaries of women are lower than those of men regardless of occupational group; salaries only come close to parity among clerical support
Figure 4.2 Wages by NACE sections and gender (deviation from average salary, percentage points)
Note: A = agriculture, forestry and fishing; B = mining and quarrying; C = manufacturing; D = electricity, gas, steam and air con-ditioning supply; E = water supply, sewerage, waste management and remediation activities; F = construction; G = wholesale and retail trade, repair of motor vehicles and motorcycles; H = transportation and storage; I = accommodation and food service activities; J = information and communication; K = financial and insurance activities; L = real estate activities; M = professional, scientific and technical activities; N = administrative and support service activities; O = public administration and defence, compulsory social security; P = education; Q = human health and social work activities; R = arts, entertainment and recreation; S = other service activities
Source: GUS.
Figure 4.3 Average wage by economy and ownership sector and its changes between 2008 and 2013 (average salary = 100)
Source: GUS, own calculations.

484. Wages POLAND
workers. Differences are acute in the managers group, which requires the highest qualifications, but offers much lower rewards for women. Although there are a considerable number of women professionals, their remuneration is significantly less than that of men.
Looking at the private sector only, it appears as though some convergence has occurred in salaries between men and women since 2008, mostly due to a gradual increase in relative wages for women until 2012. Surprisingly, this cannot be said about public sector. After a small step towards equalization in 2009–10, the 2012 data showed that this was reversed entirely. In consequence,
wage disparity in the public sector in 2012 was actually higher than in private enterprises, even though public salaries were higher for both sexes.
Another issue worth mentioning is the development of youth salaries in both sectors. Figure 4.5 shows that wages of young women decreased in both the public and private sectors. Additionally, the wage gap of young women compared with young men is particularly striking in the public sector. Young men employed in the public sector enjoyed robust growth in their average salary in 2010 and even more so in 2012.
Figure 4.4 Wage disparities between men and women across different occupational groups in 2012 (per cent average salary)
Notes: A, managers; B, professionals; C, technicians and associate professionals; D, clerical support workers; E, service and sales workers; F, skilled agricultural, forestry and fishery workers; G, craft and related trades workers; H, plant and machine operators and assembly workers; I, elementary occupations.
Source: GUS.
Figure 4.5 Wage inequality in private and public sector (deviations from average salary, percentage points)
Source: GUS.

494. Wages POLAND
Turning to the private sector, the picture becomes very different. Here, women and men aged 25 or under are disadvantaged to a similar extent. Both also suffered from a relative decline of their salaries between 2008 and 2012. This again confirms that the youth bore the burden of the slowdown, despite the rising level of education of new labour market entrants. In fact, the widespread tertiary education brings smaller returns, as shown in figure 4.6. The easily attainable level 5 is asso-ciated with gradually lower relative (to average) salary to the extent that women with education at this level do not even earn the average salary. Returns from level 6 education have not been observed to follow the same trend so far but the wage disadvantage of women is pro-nounced here as well.
The lower overall level of remuneration of women is not only associated with basic wages. Figure 4.7 shows
that women also receive less in bonuses for their work. Bonuses account for less than 10 per cent of a woman’s salary, while for men, the share of bonuses amounts to around 13 per cent. Interestingly, there is no age-related differentiation of bonuses as the youngest employees earn a similar share of their work incomes in bonuses. Thus, on average, young men receive higher bonuses than even more experienced women.
As shown in figure 4.8, the decile dispersion ratio measures show relatively high relative salaries of the top income decile (D9), who earn four times more than the bottom 10 per cent (D1). However, there is no clear identifiable trend with respect to wage inequality, as the D9/D1 measure declined somewhat between 2008 and 2010, only to pick up again in 2012. What can be observed is a recent increase in wage inequality among men and more stability in the already more equalized
Figure 4.6 Salary return from higher education (in relation to average salary)
Source: GUS.
Figure 4.7 Share of discretionary bonuses in total salary (per cent)
Source: GUS.

504. Wages POLAND
salaries of women. Further insights can be provided by the D9/D5 and D5/D1 inequality measures. The slightly declining aggregate D5/D1 suggests no pres-sure from the “falling bottom” on wage inequality in Poland, which is indeed good news. There are some signs of rising inequality on the other side of the dis-tribution (“flying top” phenomenon), especially among men. What must be emphasized is the relatively high wage dispersion measures in Poland in all the categories. They generally exceed the EU and OECD average levels and come close to levels observed in the United States.
4.2 Wage-fixing mechanism
4.2.1 Minimum wage
The minimum wage in Poland is set in line with regula-tions of the Act of 10 October 2002 on the minimum wage ( Journal of Laws 2009 No. 200, item 1679). Although the Act defines the algorithm of minimum wage increases, the minimum wage is negotiated within a social dialogue every year. The negotiated minimum salary is equal in both the public and private sector. The procedure of minimum-wage setting is as follows. The Council of Ministers presents the proposal of next year’s minimum wage to the members of the Tripartite Commission by 15 June. The Tripartite Commission should agree on the level of minimum wage by 15 July. If agreement is not reached, the Council of Ministers unilaterally sets the minimum wage and announces it to the public by 15 September.39 The algorithm guarantees
39. In this case, the minimum wage cannot be lower than the Council of Ministers’ initial proposal. Since 2010, the Tripartite
that the minimum wage increases by at least the value of anticipated inflation (CPI index). If the minimum wage is below 50 per cent of the average wage, the rate of growth of the minimum wage is additionally increased by two-thirds of the rate of growth of real GDP.40 Although there were no changes to minimum-wage regulations during the economic crisis, the minimum wage has been increasing steadily (table 4.1).
As the minimum/average wage ratio has been below 50 per cent (figure 4.9), in practice the minimum wage during the economic crisis has been increasing faster than inflation. This 50 per cent minimum/average wage ratio, the application of which was suggested in the International Labour Organization’s Minimum Wage Fixing Convention (No. 131), is an important reference point in the debate on the minimum wage in Poland. Reaching this level was one the proposals agreed within the “Anti-crisis package” in 2009. This process has been supported mainly by the trade unions, who prepared a proposal of an amendment of the Act of 10 October 2002 on the minimum wage that was supposed to lead to a gradual increase of the minimum wage to 50 per cent of the average wage. The proposal was presented to
Commission has not reached a consensual agreement as to the scale of minimum wage increases and therefore the minimum wage has been set unilaterally by the Council of Ministers (in 2014 it was unilaterally set due to pending suspension of the trade unions’ attendance in the Tripartite Commission meetings). The minimum wage in 2015 will amount to PLN1,750 (the value is between employers’ representatives and trade unions’ proposals – respec-tively, PLN1,731 and PLN1,797).40. This mechanism was introduced in 2005 by the Act of 1 July 2005 on amendment of the Act on the minimum wage ( Journal of Laws 2005 No. 157, item 1314).
Figure 4.8 Wage decile dispersion ratios by gender
Source: GUS.

514. Wages POLAND
the Parliament in July 2011. In November 2011 another proposal in this area (this time prepared by a group of Parliament deputies from the Democratic Left Alliance party) was presented to the Parliament. This posited that, starting from 2013, the minimum wage cannot be lower than half of the average wage.
Neither of these two proposals have been passed by the Parliament – they are still being discussed. The assess-ment of these proposals differs perceptibly between the social partners. Trade unions support the idea of increasing the minimum wage to 50 per cent of the average wage. The employers’ representatives and the government oppose such an arbitrary proposal, empha-sizing that current solutions (the algorithm of minimum wage indexation described above) are based on ob-jective, economic measures, thus they take into consid-eration the capability of the Polish economy to increase wages, in particular the minimum wage. Moreover, the employers’ representatives and government point out the fact that the same algorithm will lead, in the long
run, to the growth of the minimum wage to 50 per cent of the average wage.41
In March 2014, the Democratic Left Alliance party (in opposition) presented to the Parliament another proposal with regard to the amendment of the Act of 10 October 2002 on the minimum wage. The proposal was aimed at introducing a minimum wage for work performed by persons hired on the basis of civil-law con-tracts (the idea is to define the minimum hourly salary paid in civil-law contracts). The initiative is connected with the aim of the trade unions to reduce the excessive use of civil-law contracts in the Polish economy, and it was therefore assessed positively by the trade unions. However, employers’ representatives, the National Labour Inspectorate and the Supreme Court of the Republic of Poland were very critical of this proposal, arguing that further work on it should be suspended.
41. For details of the debate, see MPiPS (2013); FZZ (2013); Parliament (2011/2012).
Table 4.1 Nominal monthly minimum wage in Poland, 2008–14 *
2008 2009 2010 2011 2012 2013 2014
MW in (PLN) 1 126 1 276 1 317 1 386 1 500 1 600 1 680
MW (€)** 335.99 286.61 317.58 347.34 353.04 368.87 387.31
MW (€, PPP)** 463.04 507.79 546.67 574.89 633.14 675.35 709.12
Notes: * Minimum wage in the second half of year for 2008–13; first half of year for 2014. The Act of 10 October 2002 on the minimum wage enables the lowering of the employee’s wage to 80 per cent of the minimum wage level in the first year of employment. It weakens the impact of the minimum wage on the wage stickiness in the Polish economy (Kryńska and Kwiatkowski, 2013, p. 196).
Source: Ministry of Labour and Social Policy, Eurostat data.
Figure 4.9 Monthly minimum wage as a proportion of average monthly salary (per cent)
Source: Eurostat.

524. Wages POLAND
The minimum wage in Poland is set as a single minimum wage with universal coverage. However, there has been discussion as to how to differentiate the minimum wage by regions. This discussion refers to the OECD policy recommendation which states that the minimum wage should not be increased relative to the average wage but be differentiated across regions, based on local labour market conditions42. Today, the maximum/minimum ratio of salaries by province in Poland stands roughly at 1.5:1 and the minimum salary ranges from 36 to 54 per cent of the average salary in the enterprise sector.43
It should be admitted, however, that the results of research on this issue are inconclusive. Majchrowska and Żółkiewski (2012) argued that minimum wage had an adverse impact on employment in Poland in 1999–2010 (the most adversely affected group was the 15–24-year-olds) and a uniform national minimum wage may be particularly harmful to employment in the poorest provinces. This last conclusion was reinforced by Broniatowska et al. (2013), whose analysis showed that regional differentiation in the ratio of minimum wage to average regional wage varied between 32 per cent (in the Mazowsze region) and 46 per cent (in the Warmia and Mazury, and Podkarpacie regions) in 2012. Dispersion at the district level was even more striking – from 23 per cent to 64 per cent, while in 117 (out of 379) districts the ratio exceeded 50 per cent of average wage.
Results obtained by Rogut and Żółkiewski (2011) showed that no significant adverse effect of minimum wage on employment was demonstrated for total employment or for the low-skilled segment of the labour market. The research study results suggested that minimum-wage legislation is not very important for labour market performance as a whole, while it might be responsible for reducing employment opportunities for young workers.
This issue is related to the argument that relatively high minimum wages lead to lower youth employment rates/higher unemployment rates, because employers find it expensive to offer them their first job. It applies not only to the unskilled youth, but also to those who are highly educated but lack the professional experience that is highly valued by employers – thus, youth product-ivity may be unsatisfactory in comparison with the (minimum) wage that they have to be offered.44 This
42. OECD, 2010.43. As of January 2014, source: GUS.44. The research done by the National Bank of Poland revealed that the wage expectations of young persons are above market wages for this group, which may be one factor relating to the relatively high youth unemployment in Poland (NBP, 2012a).
is taken into account by the Polish legal framework allowing the wage for persons undertaking their first job (for the first year of employment) to be lowered to 80 per cent of the minimum wage.45 The other solution used by employers is to employ young persons on the basis of civil-law contracts – in this case the minimum wage legislation is not applicable.
It should be emphasized that although wage expectations have been growing in response to the minimum-wage increase during the crisis, the wage pressure (defined as growth rate of wages higher than labour productivity) has been stable and moderate in comparison with other countries.46 This low wage pressure is a result of institu-tional changes taking place in Poland – decreasing den-sity of trade unions, decentralized wage bargaining and weaker wage indexations are of key importance (NBP, 2012, 2013).
An important issue which should be taken into account is the actual number of employees on the minimum salary or even lower. Figure 4.10 presents these data, broken down by gender.
Interestingly, the share of workers earning not more than the minimum wage has been rising faster in the case of men, 8.1 per cent of whom were receiving not more than the minimum salary in 2012, up from 4.2 per cent in 2008.
4.2.2 Wage bargaining
Wage bargaining in Poland is decentralized and frag-mented and takes place mostly at the company level.47 The fact that not many of the employers are organized and the decreasing density of trade unions are among the crucial factors of extensive bargaining decentral-ization. Poland is in the group of countries in which the public sector collective-bargaining coverage is not sub-stantially different from the overall economy (European Commission, 2013). The wage-bargaining scheme is perceived as relatively efficient and flexible (Kryńska and Kwiatkowski, 2013, p. 191).
45. This solution has been available since 2006, so is therefore not connected with the crisis.46. In the time of crisis, the wage pressure was recorded in the second half of 2008 (NBP, 2011).47. According to Jelle Visser, the industrial relations system in Poland is classified as a “mixed or transitional” model (Visser, 2008). The model is characterized by low organizational density of actors, few actors, low collective-bargaining coverage at a decentral-ized level and no interaction with state authorities.

534. Wages POLAND
The Polish Labour Code regulates collective bargaining, by which it provides that wages and other benefits shall be fixed in collective labour agreements. If employees are not covered by a collective labour agreement or any multi-establishment collective labour agreement (it applies to companies employing at least 20 employees), the wage conditions should be defined in the “rules of wage setting” document.48
Statistical data confirm a continuous decline in the number of collective labour agreements in Poland. Annual reports published by the National Labour Inspectorate report that in 2008, 154 company collective agreements were registered, along with 1,732 additional protocols amending the agreements; in 2009 the num-bers were 123 and 1,688, respectively; in 2010, 130 and 1,396; in 2011, 136 and 1,291; in 2012, 92 and 1,265; and in 2013, 109 and 1,131. Data presented by the Ministry of Labour and Social Policy on multi-establishment collective labour agreements show (as of 15 April 2014) that 174 such agreements are registered, along with 328 additional protocols amending the agreements, 46 decisions on applying another multi-establishment agreement in entirety or in part, as well as nine add-itional protocols amending the decisions. However, of those numbers, 74 agreements have been revoked, while 12 agreements and 45 decisions on applying another multi-employer agreement in its entirety or in part are to be deemed “defunct”, because they cannot be subject to any change, due to the fact that the signatory on the employer’s part has lost their prerogative to conclude a
48. A document issued by a company according to the regulation of the Labour Code.
multi-establishment agreement. As a consequence, in fact there are only 88 agreements remaining in force.49
The influence of the economic crisis on the institutional dimension of the wage-fixing system in Poland has been minor (although it led to a wage freeze in central gov-ernment units – see below).50 The main institutional change was the repeal of the Act on a negotiation-based system for setting average wage increases in enterprises, with effect from 1 January 2010. The Act constituted the basis for the system of negotiating the average wage growth (in enterprises employing more than 50 persons, the scale of the average wage growth was to be agreed by parties involved in a collective bargaining agreement until the end of February each year). The scale of wage growth had to take two factors into account: financial condition of the enterprise and value of indexes set by the Tripartite Commission. The mechanism guaranteed that wage bargaining at company level took place every year.51 After the above Act was repealed, there has been no obligation to undertake wage bargaining every year,
49. http://w w w.dia log.gov.pl/dia log-krajow y/uk lady-zbi-orowe-pracy/; http://www.eurofound.europa.eu/eiro/studies/tn1402049s/pl1402049q.htm, accessed on 18.07.2014.50. As reported by Czarzasty (2014), since mid-2008 there have been no changes in the wage-setting mechanism in the private sector (with regard to the level of collective bargaining over wages, mechanisms governing coordination between different levels of col-lective wage setting, formal and informal practices of coordination across bargaining units at the same level).51. However, as Zych (2008) argued, the mechanism defined in the Act on the negotiation-based system for setting average wage increases in enterprises had little impact on the wage-setting mech-anism, as there were no sanctions provided for not obeying these regulations.
Figure 4.10 Share of employed men and women earning not more than minimum salary (per cent)
Source: GUS.

544. Wages POLAND
and the bargaining process only takes into consideration the financial condition of the enterprise.
The tight situation of public finances, caused by the effects of the economic crisis, forced the government to introduce austerity measures in the public sector. The need to control the wage bill has been reinforced by the launch of the “Excessive Deficit Procedure” by the European Council.52 Although the indexation mechanism of wages in the public sector has not been formally changed, in 2011 the wage fund was frozen in nominal terms for most general government units.53 This kept the wage bill share of public expenditure at the level of 22.3–22.4 per cent in the period 2011–13.54 Overall, the public wage bill share shrank by 0.86 percentage points of public spending in 2008–13. In 2014, the government decided to prolong this measure to 2016. However, as the current system of wage set-ting permits the managers of individual administrative units to exercise very wide discretion over the wages of individual staff,55 it appeared that although wages were formally frozen, the salaries of public officials have been growing as a result of granting additional bonuses to the “frozen” basic wage.56
52. The Excessive Deficit Procedure does not set a ceiling on the government wage bill, but the wage bill influences the aggregate general government deficit target, and will thus be under control. The wage freeze is connected with implementation of the temp-orary spending rule being in force in 2011–13. According to the rule, an increase in public spending in the following year should not exceed the level determined by CPI inflation (forecast for the year) + 1 per cent, until the Excessive Deficit Procedure is repealed. Korniluk (2013) argued that the temporary spending rule encom-passes narrowing the scope of spending to have substantial impact on public finance stability in Poland. In 2014, a new spending rule was introduced which ensures maintenance of the structural central and local government deficit at the level of the mid-term budgetary objective (MTO).53. Wages were frozen only in central public administration – it was not applied to local government units, teachers, policemen, soldiers or health-care employees.54. Source of data: AMECO database.55. The system, as the World Bank argued, is not efficient in controlling the aggregate wage bill in the public sector in Poland (World Bank, 2013).56. http://serwisy.gazetaprawna.pl/praca-i-kariera/artyku-ly/696568,kryzys_i_zamrozenie_ plac_urzednicy _zarabiaja_coraz_wiecej_pensje_w_administracji_wzrosly_o_800_zlotych.html, accessed on 16.07.2014.
4.3 Special measures aimed at counteracting the effects of the economic crisis
Special measures aimed at counteracting the effects of the economic crisis were implemented mainly within the “Anti-crisis package”. These measures included State support, which was supposed to maintain the employment numbers in companies instead of encour-aging new hirings.
The Act on mitigating the effects of the economic crisis on employees and enterprises introduced compensation to employees’ wages which had been diminished due to economic downtime or to reduced working time, as well as subsidies to employees’ training. These measures were available only to “companies undergoing temporary financial difficulties”.57
In the case of economic downtime, an employee might receive compensation to their salary, amounting to up to 100 per cent of the unemployment benefit. In the case of reduced working time, the compensation was up to 70 per cent of the unemployment benefit. Such support could be given for up to six months and was financed from the Guaranteed Employee Benefits Fund.
The employer undergoing temporary financial difficul-ties in creating a company training fund might apply for a subsidy from the Labour Fund, to cover the cost of training or postgraduate studies of employees (the maximum subsidy for each employee accounted for 80 per cent of the cost of training or postgraduate stud-ies,58 not exceeding 300 per cent of the average monthly salary in Poland).
According to the data published by the Ministry of Labour and Social Policy, employers submitted 195 applications for wage compensation (the total sum of PLN21.84 million for 12,365 employees). However, not all applications were accepted; only 119 agree-ments were signed (the total sum of PLN7.9 million for 7,241 employees). The subsidies granted to companies for training and postgraduate studies accounted for PLN1.98 million and concerned 1,161 employees.
57. A company undergoing temporary financial difficulties was defined as a company that reported a decline in total turnover (by value or sale quantity) of not less than 25 per cent for three con-secutive months after 1 June 2008 in comparison with the same three-month period between 1 July 2007 and 30 June 2008. It meant that in practice, this support was available only to enterprises in the private sector.58. The subsidy could cover the cost of training for a maximum period of six months, and the cost of postgraduate studies for a maximum period of 12 months.

554. Wages POLAND
Since November 2013 additional support has been granted to companies which report a decline in total turnover of not less than 15 per cent for six consecutive months of the year (the Act of 11 October 2013 on spe-cial measures related to the protection of jobs). The Act made it possible for firms to introduce economic down-time and the reduction of working hours by up to half of the usual full-time total in such companies. In cases where both solutions are applied, employees are entitled to receive compensation to their salary, amounting to up to 100 per cent of the unemployment benefit, financed from the Guaranteed Employee Benefits Fund. Such support can last up to six months within the 12-month period, starting on the day of signing of the subsidy agreement. The employer is obliged to pay the employee’s remuneration. The regulations guar-antee that an employee receives in total the equivalent of the minimum wage. The employer who was granted the wage subsidy may also apply for a subsidy from the Labour Fund to cover part of the training costs of employees (the maximum subsidy for each employee accounts for 80 per cent of training costs, not exceeding 300 per cent of the average monthly salary in Poland).
4.4 Other factors influencing wage changes
As mentioned in Chapter 2, the extensive use of civil-law contracts is caused, among other things, by the fact that civil-law contracts generate lower labour costs than employment contracts (table 2.1). The non-wage labour cost related to employment contracts accounts for 38.5–41 per cent of total labour cost (in case of open-ended as well as fixed-term employment contracts). If a person is hired on the basis of a con-tract to perform a specified task or work, the non-wage labour cost amounts only to 9–14.4 per cent. In the case of a contract of mandate, the maximum non-wage labour cost is 37.6–39 per cent59 (Arak et al., 2014). This burden is similar to the non-wage labour cost related to employment contracts, but it can be reduced in quite a simple way – the employer may sign a couple of contracts of mandate for the same period with the same employee. In such a situation, according to the legal regulations, social insurance contributions are required to be paid only for one selected contract - usually the contract with the lowest salary is chosen - and the remaining contracts are not subject to social insurance contributions. This
59. This is the case when the contract of mandate is the only title to social insurance. If a person has more contracts of mandate, the employer does not pay the social insurance contribution for these contracts – only the health insurance contribution is applied.
explains why employers use civil-law contracts exces-sively, especially the contracts of mandate.
In order to counteract this practice, in 2014 the Ministry of Labour and Social Policy presented a proposal with regard to changes in social security contributions linked to contracts of mandate.60 The Ministry proposed that, regardless of the number of contracts of mandate, they would be subject to social insurance contributions up to the equivalent of the minimum wage. This may increase the social security of persons employed on contracts of mandate, and simultaneously reduce the scale of use of this type of civil-law contract in Poland. However, it would also increase the non-wage labour costs, which may have a negative influence on employment.
In order to stimulate employment, the government took some action aimed at decreasing the non-wage labour costs in Poland before and during the economic crisis. The disability pension contribution was decreased in 2007 and 2008 to 10 per cent and 6 per cent respec-tively. However, it was raised to 8 per cent in February 2012. In 2009 the minimum accident insurance rate for employers insuring no more than nine employees was decreased from 1.80 per cent to 1.67 per cent. In the second quarter of 2012 it was raised to 1.93 per cent. It shows that these initiatives have not been long lasting or successful.
Another institutional area which influences disposable income, in terms of wages, is personal income tax regu-lation. In 2007 and 2008 the level of taxable personal income included in particular tax brackets was raised. In 2007 the increase was applied to all tax brackets (from PLN37,024 to PLN43,405 for the first tax bracket, from PLN74,048 to PLN85,528 for the second tax bracket). In 2008 the increase was applied only to the first tax bracket (from PLN43,405 to PLN44,490).
In 2009 the number of personal income tax brackets was reduced from three to two, and new tax rates were introduced for these brackets: the first tax bracket applies to annual income of up to PLN85,528 (around €26,000) with a tax rate of 18 per cent; the other tax bracket applies to income higher than PLN85,528 with a tax rate of 32 per cent. This action was aimed at re-ducing the tax wedge. However, nominal tax brackets have been frozen since 2009, and in April 2014 the government decided to extend the tax bracket freeze to 2017 (Council of Ministers, 2014), which means that the real burden of personal income tax has been and will be constantly increasing.
60. The proposal was accepted by the Council of Ministers on 4 March 2014.

564. Wages POLAND
The wage-setting processes in Poland have also been influenced by the degression of the unemployment benefit in 2010, already discussed in Chapter 3. The amendment of the Act of 20 April 2004 on the pro-motion of employment and labour market institutions, which has been in force since 1 January 2010, intro-duced regulations on two unemployment benefit sums depending on the duration of unemployment. The higher one (basic sum of PLN823.60 in 2014) is granted for the first three months of unemployment; the other is granted for the rest of the period in which a person is entitled to receive unemployment benefits (basic sum of PLN646.70 in 2014). This institutional change was supposed to increase the motivation of the unemployed to more actively seek employment and thus to decrease the length of their duration of unemployment.
Generally, it should be emphasized that the greater flexi-bility of the Polish labour market (which may be partly related to the austerity measures introduced) and HR strategies implemented by the companies resulted in low wage pressure and relatively low unemployment in com-parison with other EU Member States. The “flexibility” measures did not create more labour demand, but rather sustained workplaces during the crisis. Having experi-enced problems with hiring employees, which were still an issue in 2008, many companies engaged in labour hoarding at the beginning of the crisis (and stopped cre-ating new workplaces). To minimize the effects of the crisis, companies reduced the amount of fringe benefits paid (the main method of decreasing labour costs), leaving the basic salary unchanged. In 2010, a smaller share of employers than in 2007 declared that laying off
full-time, core employees was the main measure used to counteract the economic slowdown.61 At the same time, the majority of employers offered lower wages to new employees compared with existing employees62 (NBP, 2011). In 2011, companies tried to maintain this strategy; however, as the economic slowdown persisted, more employers were forced to reduce the payroll (by reducing number of employees and wages – especially in small and medium enterprises) (NBP, 2012). The financial position of the companies has started to sta-bilize since 2012 – many companies returned to labour hoarding, and the risk of losing a job decreased (NBP, 2013). This can be seen in the decreasing number of jobs created and hires by companies (table 4.2).
Extensive use of atypical forms of employment during the crisis resulted in low wage pressure – the analysis of the National Bank of Poland revealed that companies where standard full-time employment contracts domin-ated expected higher wage increases, while enterprises which employed persons mainly on the basis of civil-law contracts reduced wages more often (NBP 2013).
61. Experts at the National Bank of Poland argued that it was a result of the companies’ expectations of the economic situation in Poland being better than anticipated (NBP, 2011a).62. In the case of hiring highly qualified professionals in the manu-facturing industry (mainly engineers), companies had to attract potential employees with higher wages, because of supply shortages in this professional group.
Table 4.2 Jobs, hires and layoffs (thousands)
Year 2008 2009 2010 2011 2012 2013
Jobs created 490.6 521.6 609.3 580.3 465.0 502.4
Jobs lost 138.0 501.4 456.5 429.3 376.5 347.1
Hires 2 100.5 1 525.6 1 614.5 1 818.7 1 587.7 1 606of which:
– employed for the first time 333.6 217.7 224.3 269 223.9 232.7
Layoffs 2 020.1 1 660.5 1 557.8 1 764.8 1 623.9 1 497.7of which:
– due to dissolution of an employment contract by employer
288.7 343.7 272.2 276.2 296.4 248.9
– due to dissolution of an employment contract by employee
364.1 152.2 149.5 160.6 140.1 137.5
– retired or granted disability pension or due to rehabilitation
138.8 82.6 66.8 85 76.8 70.3
Source: GUS.

575. Active labour market policies POLAND
5Active labour market policies (ALMPs)
5.1 Changes in the ALMP legal framework
The legal framework for active labour market policies in the years 2007–13 was subject to frequent changes. While numerous amendments mostly clarified and specified various regulations, major changes were made by the Act of 19 December 200863 as a response to devel-opments in the Polish labour market after 2004. At the time of enforcing this Act, there was a strong decline in unemployment, growing demand for professional qualifications of candidates for jobs and a noticeable shortage of labour. Labour offices were increasingly faced with so-called difficult customers for whom traditional methods of intervention proved to be ineffective. The explanatory memorandum to the proposed amendments pointed to the fact that rules, system solutions and insti-tutions change within the broader social policy and assign new functions and results to actions for employment policies.64 The main objective of the proposed amend-ments was to help the unemployed and jobseekers to start or return to employment. The prepared amend-ments applied equally to all groups in the labour market: young people, the elderly, people with a long break in employment, workers threatened with unemployment, as well as to people returning from emigration.
The amendments introduced by the Act on employment promotion and labour market institutions (2009) were designed to achieve targets in four areas:65 • increase the range of activation of the unemployed,
including the unemployed who were in a special situ-ation on the labour market;
• increase access to labour market services;• give preferential treatment to the implementation of a
lifelong learning process or, more broadly – to invest in human capital; and
• modify the benefit payment system and the use of the Labour Fund.
63. The Act on employment promotion and labour market insti-tutions (2009).64. Explanatory memorandum form 1196.65. Ibid.
The first three areas were directly associated with active labour market policies. In order to increase the range of activation of the unemployed, the Act introduced reform in the organization of labour offices. Separate centres for vocational activation were established in powiat labour offices which implemented measures to activate the unemployed more effectively. The Act integrated the two previously separate specific services: job placement and the European Employment Services (EURES). It also introduced the possibility of having individual action plans for all unemployed persons or jobseekers,66 and it was obligatory to prepare such plans for the unemployed with special difficulties in starting work or taking it up again. In order to encourage the unemployed and jobseekers to actively cooperate with labour offices and participate in activation measures, the Act introduced higher financial incentives in the form of scholarships paid to participants in training, intern-ships, and adults undertaking vocational training or to those continuing their learning within school. The Act also introduced the possibility of referring the un-employed benefiting from social assistance to activation measures implemented not only by the powiat labour offices, but also by the social welfare centres.
Amendments to the Act expanded the catalogue of active labour market policy instruments by introducing special programmes and vocational training of adults instead of the former vocational training programme in the workplace. The amendment also changed the target groups for some programmes, in particular training and internships (see table 5.1).
In the context of the modification of the use of the Labour Fund, the amendment created a new item in expenditures on active labour market pro-grammes – subsidies to specialization and postgraduate internships of doctors, dentists, nurses and midwives. This item does not, however, create a new instrument to
66. Refers to a plan drawn up between the labour office and the individual concerned, outlining actions towards finding employment, scheduled dates of their implementation and dates of contact with labour office employees, as well as terms for the termination of the plan.

585. Active labour market policies POLAND
mitigate the impact of unemployment. The amendment also allowed for a Labour Fund subsidy for the training of young workers, which was associated with changes in the vocational education system.
Subsequent changes in the regulation of active labour market policies were introduced by the Act of 16 December 2010 (Act on employment promotion and labour market institutions, 2010). These changes were not as fundamental as those previously discussed and again concerned the method of implementing training programmes. In accordance with the new law, the unemployed could be referred not only to one but to several courses, as long as their joint completion would improve the chances of finding a job.67 A major limi-tation of the training is its total cost - in a given year it cannot exceed 300 per cent of the average monthly salary in Poland. The new regulations also imposed an obligation to prepare an individual action plan for all persons belonging to the groups in a special situation in the labour market: (a) unemployed persons below the age of 25; (b) unemployed persons over 50 years of
67. Art. 40 paragraph 3 of the Act on employment promotion and labour market institutions (2010).
age; (c) unemployed persons without vocational qualifi-cations; (d) unemployed persons without occupational experience; and (e) unemployed persons who did not take up employment after imprisonment – as long as they remain continuously on the register for a period of at least 180 days from the date of registration.
In the last few years of the period under study, due to the deteriorating economic situation and the resulting situation in the labour market, intensive work continued to prepare the reform of the public employment services and labour market instruments. In addition, the labour market saw the adverse effects of demographic changes. As already mentioned, the Polish labour market is affected by persistent problems of a structural nature, such as low labour participation and low flows from inactivity into the labour market but also high barriers to re-entry to employment for women who decide to start a family, long-term unemployment, low labour vocational and spatial mobility. Other features of the Polish labour market include high seasonality and ter-ritorial differentiation as a result of both the uneven socio-economic development of regions and their geo-graphic location. The new regulations implemented by the Act on employment promotion and labour market
Table 5.1 Groups of persons entitled to principal categories of labour market programmes
Until 2008 Since 2009
Training • Registered unemployed• People receiving training pension• Reserve soldiers
• Registered unemployed• Jobseekers• Working
Internships • Unemployed under 25 years of age• Unemployed graduates under 27 years of age
• Unemployed under 25 years of age• Long-term unemployed who completed a social
contract and women who did not resume employ-ment after having a child
• Unemployed over 50 years of age• Unemployed without vocational qualifications,
occupational experience or secondary education• Unemployed single parents with at least one child
under the age of 18• Unemployed who, after serving a sentence of
imprisonment, did not take up employment• Unemployed people with disabilities
Vocational training in the workplace/adult vocational training
• Unemployed under 25 years of age• Long-term unemployed or women who did not
resume employment after having a child• Unemployed over 50 years of age• Unemployed without vocational qualifications,
vocational experience or secondary education• Unemployed single parents with at least one child
under the age of 18• Unemployed who, after serving a sentence of
imprisonment, did not take up employment• Unemployed people with disabilities
• All registered unemployed• Persons receiving social benefits available during
mining leave • Persons who participate in the activities at the
centre of Social Integration or in individual integra-tion programme, in accordance with the provi-sions of social assistance
• Reserve soldiers• Persons receiving training pension or training
allowance
Source: Notice of the Speaker of the Polish Parliament on 9 April 2008 and 26 March 2013 concerning the announcement of the consolidated text of the Act on employment promotion and labour market, own compilation.

595. Active labour market policies POLAND
institutions (2014) are designed to tackle these problems. The changes introduced by the Act aim primarily to:(a) improve the efficiency of the labour offices by
changing their organization and by making the volume of funds and salaries of labour office employees conditional on the standards and effects of their actions;
(b) improve the quality of services provided to the un-employed according to their needs. In this respect, access to the instruments of active programmes was changed. Profiling of an assistance given to the unemployed was introduced and private operators could be commissioned to perform activation oper-ations. The new approach is to increase the elasticity of the services and labour market instruments;
(c) spread new instruments to support job creation and return the unemployed to employment: grants for teleworking and activation allowances, loans from the Labour Fund to create jobs or start businesses, and regional programmes;
(d) support employers of young workers through new instruments of supporting the employment of young people in the labour market (training vouchers, internship vouchers, employment vouchers, vouchers for settlement), and to help the unemployed gain professional experience through a refund of social security contributions for the un-employed who take up their first jobs; and
(e) support the employers hiring the unemployed aged over 50 and support the employers in upgrading the skills of their workers through the National Training Fund (Government bill amending the law on employment promotion and labour market institutions and certain other acts, 2013).
The changes were only to a small extent related to the effects of the economic crisis; they were rather a response to the current situation and a fairly optimistic view of the near future. Solutions which were directly aimed at mitigating the effects of the crisis were introduced by the Act of 1 July 2009 on measures to mitigate the effects of the economic crisis for employees and entrepreneurs (Act on measures to mitigate the effects of the economic crisis for employees and entrepreneurs, 2009). The programmes introduced by this Act were temporary and ended on 31 December 2011. The Act increased the availability of training and postgraduate studies for employees in businesses in temporary financial difficulties.68 Upon the
68. This term is defined in article 3 of the Act on measures to mitigate the effects of the economic crisis for employees and entre-preneurs (2009).
request of an employer in temporary financial difficulties who had created a training fund, the governor (starosta) could subsidize from the Labour Fund: (a) the cost of training of workers referred for training for a period not exceeding six months; (b) the cost of postgraduate studies of the referred employees for a period not exceeding 12 months, provided that the training or postgraduate studies are justified by the employer’s present or future needs (Category 2 of the OECD classification).69 The amount of the subsidy was up to 80 per cent of the cost of training or postgraduate study for one person, but not more than 300 per cent of the average salary in the preceding quarter. During the period of training or post-graduate studies an employee was entitled to a scholarship financed by the Labour Fund. This scholarship was paid by the employer on the principle of payment of wages for employees during the period of reduced working time – in the amount of 100 per cent of the unemployment benefit, or in the period of economic downtime – up to 100 per cent of the benefit with regard to working time of an employee. It is worth noting that the amount of the schol-arship is based on the amount of the benefit specified in the rules in force until 31 December 2009.
An employer in temporary financial difficulties may apply to the administrator of the Guaranteed Employee Benefits Fund to provide the employees, on the basis of the list of eligible employees, with an allowance to par-tially offset employee wages during economic downtime or to partially offset the reduction in working time. In the first case, the allowance was paid up to 100 per cent of the unemployment benefit with regard to employee working time; in the latter case, up to 70 per cent of the benefit could be paid, depending on the extent of reduction of employee working time. The total benefit period could not exceed six months.70
Another temporary instrument to mitigate the effects of the crisis involved state aid in the repayment of cer-tain housing loans to people who had lost their jobs.71 The programme was in operation from August 2009 to 31 December 2010. Under the programme, an un-employed person entitled to unemployment benefits who had lost their job after 1 January 2008 could apply for aid in the repayment of housing loans. The assistance consisted of repaying capital instalments plus interest from the Labour Fund, in the amount of not more
69. Art. 24 of the Act on measures to mitigate the effects of the economic crisis for employees and entrepreneurs (2009).70. Art. 14 of the Act on measures to mitigate the effects of the economic crisis for employees and entrepreneurs (2009).71. The Act on state aid in the repayment of certain housing loans to people who have lost their jobs.

605. Active labour market policies POLAND
than PLN1,200 for up to 12 months. These amounts were refundable and their repayment would start two years after cessation of the payment of assistance instal-ments and continue for eight consecutive years in equal interest-free monthly instalments.
5.2 ALMP – general framework and current rules
Active labour market policy in Poland is based on ser-vice and labour market instruments. The legal frame-work for active labour market policy is set by the Act of 20 April 2004 on employment promotion and labour market institutions.72 This Act was amended several times. The active forms described below are as of end of 2013. Particular active programme classification is not fully compatible with the OECD classification. Therefore, certain activities are omitted in the statistics of the OECD and some items can be assigned to dif-ferent categories, which makes international compari-sons difficult (see Kryńska, 2009). Therefore, each item is provided with the Eurostat category in brackets.
The basic labour market services include:73(1) Job placement;(2) Vocational counselling and vocational information
(cat. 1);(3) Assistance in active job search (cat. 1);(4) Organization of training (cat. 2).
Training for the unemployed is a programme initiated and organized by the governors (starosta) at the powiat level.74 Training is financed by the starosta from the Labour Fund and takes the form of a course imple-mented according to the teaching plan covering an average of not less than 25 hours per week.75 Training can take up to six months, but the Act also provides for situations in which the training can be extended up to 24 months.76 During training, to which unemployed persons were referred by the starosta, they are entitled to a scholarship in the amount of 120 per cent of the monthly unemployment benefit if the number of hours of training is at least 150 per month.
72. Act on promotion of employment and labour market insti-tutions (2004), as amended in a wording of the consolidated text published on 13 June 2013 (Act on promotion of employment and labour market institutions (2013)).73. Article 35 of the Act on promotion of employment and labour market institutions (2004).74. Article 40 of the Act on promotion of employment and labour market institutions (2004).75. Unless separate provisions are made for shorter training.76. In the case of people with no qualifications and when justified by a training programme in a particular profession.
The starosta, at the request of an unemployed person, may also: (a) refer the person for training of their choice if the cost of the training does not exceed 300 per cent of the average monthly salary in Poland and if the person justifies the desirability of this training; (b) provide a loan to finance the cost of training to the amount of 400 per cent of the average monthly wage in order to enable the person to take up or maintain employment; (c) finance from the Labour Fund expenses payable to the organizer of postgraduate studies, up to 100 per cent, but not more than 300 per cent of the average monthly wage in Poland.
Labour market instruments supporting basic labour market services include:77 • financing of expenses incurred by an unemployed
person while travelling to an employer (cat. 1);• financing of accommodation expenses close to the
workplace of a person who took up employment (cat. 1);
• subsidizing the cost of workplace equipment, start-up business, the costs of legal assistance, consultation and counselling (cat. 4);
• refund of expenses incurred on account of paid social security contributions in connection with the employment of the referred unemployed person;78
• financing of activation allowances (cat. 8);• financing the costs of organized travel of the un-
employed and jobseekers (cat. 1).
The funds to create jobs are the first instrument men-tioned in the Act.79 The Labour Fund can be accessed at the request of the employer (cat. 4) or the unemployed (cat. 7 or cat. 5 in the case of persons with disabilities). At the request of the employer, the starosta may reimburse the cost of equipment or retrofitting the workplace for the referred unemployed person in the amount specified in the contract, but not more than six times the amount of the average monthly salary in Poland. Unemployed persons may apply for one-off funds for starting a busi-ness in an amount not more than six times the amount of the average monthly salary, and if the activity is taken under rules laid down for social cooperatives, the amount of funds granted to the unemployed must not exceed four times the average monthly salary for a founding member of the cooperative and three times
77. Art. 44 of the Act on employment promotion and labour market institutions (2010).78. Art. 47 of the Act on employment promotion and labour market institutions (2010).79. Art. 46 of the Act on employment promotion and labour market institutions (2010).

615. Active labour market policies POLAND
the average monthly salary for a member joining the social cooperative after its formation.
The other labour market instruments include: inter-vention works (cat. 4); internships (cat. 4); vocational training of unemployed adults (cat. 2); public works (cat. 6); socially useful works (cat. 6); and special pro-grammes. These instruments are targeted at the group of unemployed persons in a special situation in the labour market who:80(a) are under 25 years of age;(b) for a long period after the completion of the social
contract did not take up employment, or women who did not resume employment after having a child;
(c) are over 50 years of age;(d) are without vocational qualifications, occupational
experience or secondary education;(e) are single parents of at least one child under the age
of 18;(f) after serving a sentence of imprisonment, did not
take up employment;(g) are people with disabilities.
Intervention works consist of the partial reimbursement of the costs incurred for salaries, bonuses and social security contributions targeted at the unemployed.81 Intervention works for different groups in a special situation in the labour market can be implemented in different working times and at different levels of reim-bursement of expenses. These variants are summarized in table 5.2.
Internship is a programme of practical training on the job without establishing an employment relationship, and usually lasts for a period not exceeding six months. This instrument is targeted at all unemployed persons in a specific labour market situation. However, unemployed persons under 25 years of age and university graduates up to 27 years of age may be referred for internships lasting up to 12 months.82 During the period of intern-ship, an unemployed person is entitled to a scholarship in the amount of 120 per cent of the amount of the un-employment benefit, paid by the starosta, but during the period of the scholarship an unemployed person is not entitled to the unemployed allowance.
80. Art. 49 of the Act on employment promotion and labour market institutions (2010).81. Art. 51 of the Act on employment promotion and labour market institutions (2010).82. Art. 53 of the Act on employment promotion and labour market institutions (2010).
Public works is a programme organized by munici-palities (gminas – NUTS-5 territorial units), public institutions and organizations dealing with issues of culture, education, sport and tourism, health care or social assistance. The basic programme of public works rules out the participation of the unemployed under 25 years of age. Other unemployed groups in a special situ-ation in the labour market can find employment in the programme for up to 12 months.
Adult vocational training takes the form of: (a) on-the-job training to enable adults to take the ex-amination of vocational qualifications or the appren-tice examination; (b) qualification upgrading for adults seeking to gain vocational qualifications or skills ne-cessary to perform specific professional tasks. Adult vocational training is carried out under agreement concluded between the governor (starosta) and the employer or between the starosta, the employer and the training institution. On-the-job training for adults lasts 12–18 months, while qualification upgrading for adults lasts 3–6 months.83 Participants in this programme are entitled to scholarships determined on the same basis as in the case of training.
Special programmes are sets of actions aimed at improving the situation of selected groups of un-employed persons or those at risk of unemployment in the local labour market. The programme provides each participant with various forms of support. The maximum amount of subsidy from the Labour Fund allocated under one special programme for operations per participant has been limited to ten times the average monthly wage in force on the date of commencement of a special programme. The total amount of expenditure incurred for the implementation of special programmes may not exceed 10 per cent of the Labour Fund, deter-mined by an algorithm, granted for financing tasks at the powiat level. Special programmes may last longer than one year.84
The unemployed not entitled to unemployment benefits and receiving social assistance benefits can be referred, at the request of the municipality, to socially useful works. These works are carried out in the municipality in which the unemployed person resides for up to 10 hours a week. An unemployed person is entitled to receive an allowance in the amount of PLN6 per hour. The starosta refunds from the Labour Fund up to 60 per
83. Art. 53 of the Act on employment promotion and labour market institutions (2010).84. Section 13a of the Act on employment promotion and labour market institutions (2010).

625. Active labour market policies POLAND
cent of the minimum amount of this benefit due to an unemployed person.85
The Act also provides for the possibility of reim-bursement of the costs of training of employees at the request of an employer who created a training course, as well as co-funding of training courses organized by employers, if they are attended by a person referred by the employment office (cat. 2).86
5.3 Importance and effectiveness of labour market programmes during the crisis period
85. Art. 73 of the Act on employment promotion and labour market institutions (2010).86. Chapter 14 of the Act on employment promotion and labour market institutions (2010).
The role and importance of individual labour market programmes is diverse. Programmes vary both in the size of funds allocated for their financing and in the number of participants. In order to demonstrate the importance of individual programmes and the changes taking place in the period under study, the Labour Fund expendi-tures on active labour market programmes have been analysed (see table 5.3). The table confirms that during the period there were no significant changes in this area. Most of the expenditures were in fact implemented over the entire period. Expenditures directly related to the financing of anti-crisis measures included state aid in the repayment of certain housing loans implemented in the years 2009–11 and the funds transferred to the Guaranteed Employee Benefits Fund in the amount of PLN960 million in 2009.
Table 5.2 Intervention works – basic regulations
Groups of eligible unemployed Duration Working time
Maximum amount of refund Frequency of refunds
• Under 25 years of age• For a long period after the completion
of the social contract did not take up employment, or women who did not resume employment after having a child
• Over 50 years of age• Without vocational qualifications,
occupational experience or secondary education
• Single parents with at least one child under the age of 18
• After serving a sentence of imprison-ment did not take up employment
• People with disabilities
Up to 6 months
Full • The product of the number of employees in the month in terms of full-time work and unemployment benefit amount in force on the last day of employment of each cleared month and social insurance contributions from the refunded remuneration
Monthly
At least half-time
• Half of the minimum wage and social security contributions from the refunded remuneration for each unemployed person
Up to 12 months
• Minimum wage and social security contri-butions from the refunded remuneration for each unemployed
Every other month
• Under 25 years of age• For a long period after the completion
of the social contract did not take up employment, or women who did not resume employment after having a child
• After serving a sentence of imprison-ment did not take up employment
• People with disabilities
12 months Full • The product of the number of employees in the month in terms of full-time work and unemployment benefit amount in force on the last day of employment of each cleared month and social insurance contributions from the refunded remuneration
Monthly
Up to 18 months
Full • Minimum wage and social security contri-butions from the refunded remuneration for each unemployed
Every other month
• Over 50 years of age 24 months Full • Those who meet the requirements for entitlement to pre-retirement benefits – a refund is granted up to 80 per cent of the minimum wage and social security contribu-tions from the refunded remuneration for each unemployed person
Monthly
Up to 4 years
Full • Those who do not meet the necessary conditions for entitlement to pre-retire-ment benefits – a refund is granted of up to 50 per cent of the minimum wage and social security contributions from the refunded remuneration for each unemployed person
Every other month
Source: Announcement of the Speaker of the Polish Parliament on 26 March 2013 concerning the announcement of the consolidated text of the Act on employment promotion and labour market institutions, own compilation.

635. Active labour market policies POLAND
Table 5.3 Labour Fund expenditures on active labour market programmes, 2006 –13 (million PLN)
2006 2007 2008 2009 2010 2011 2012 2013
Active forms of counteracting unemployment:
2 134 2 725 3 363 6 205 6 627 3 340 3 875 4 650
Training 219 268 279 377 897 134 184 208
Postgraduate studies – – – – – 10 6 8
Intervention works 219 213 195 179 215 185 139 170
Public works 145 178 249 330 477 155 165 219
Socially useful work 25 33 33 37 42 30 35 41
Internships 668 691 917 1350 1452 836 855 1235
Vocational training 201 214 350 126 – – – –
Scholarships for the unemployed continuing learning within the school
6 4 3 4 14 9 4 6
Vocational training of adults – – – – 12 12 6 6
Wages of young workers 153 165 185 197 230 287 220 225
Subsidies for employers for training of young workers
– – – 254 331 290 303 272
Subsidies for specialization and postgraduate internships for doctors, dentists, nurses and midwives
– – – 568 670 718 755 835
Reimbursement of costs of equipping or retrofitting workplace
97 365 385 514 807 181 381 448
One-off funds to take up economic activity
376 536 701 1092 1387 442 708 881
Costs of travel, accommodation and meals
1 43 51 61 68 16 13 21
Care for a child or other dependent 0 0 0 1 2 1 1 1
Refund of social security contributions paid by employers hiring the unemployed
– – 1 1 1 0 0 0
Medical examination of the unemployed
– – 11 13 16 5 8 9
Redemption of loans 25 4 2 1 1 1 1 1
Costs of contracts concluded with the employment agency
– – – – 0 – – –
Restructuring of employment and other
– – – 138 – – – –
Pilot projects – – – – 0 1 5 26
Specific elements of special programmes
– – – – 0 18 86 36
Refund of social security contributions for social cooperatives
– – – – – 0 1 1
State aid in the repayment of certain housing loans to people who have lost their jobs
– – – 2 6 2 – –
Other – 11 – 960 0 6 – –
Source: Reports on implementation of the state budget for the years 2006–13 and own compilation.

645. Active labour market policies POLAND
Table 5.4 Structure of Labour Fund expenditure on ALMP programmes (per cent)
2006 2007 2008 2009 2010 2011 2012 2013
Active forms of counteracting unemployment:
100 100 100 100 100 100 100 100
Training 10.2 9.8 8.3 6.1 13.5 4.0 4.7 4.5
Postgraduate studies – – – – – 0.3 0.1 0.2
Intervention works 10.3 7.8 5.8 2.9 3.2 5.5 3.6 3.7
Public works 6.8 6.5 7.4 5.3 7.2 4.6 4.3 4.7
Socially useful work 1.2 1.2 1.0 0.6 0.6 0.9 0.9 0.9
Internships 31.3 25.3 27.3 21.8 21.9 25.0 22.1 26.6
Vocational training 9.4 7.9 10.4 2.0 – – – –
Scholarships for the unemployed continuing learning within the school
0.3 0.1 0.1 0.1 0.2 0.3 0.1 0.1
Vocational training of adults – – – – 0.2 0.3 0.1 0.1
Wages of young workers 7.2 6.1 5.5 3.2 3.5 8.6 5.7 4.8
Subsidies for employers for training of young workers
– – – 4.1 5.0 8.7 7.8 5.8
Subsidies for specialization and postgraduate internships for doctors, dentists, nurses and midwives
– – – 9.1 10.1 21.5 19.5 18.0
Reimbursement of costs of equipping or retrofitting workplace
4.5 13.4 11.5 8.3 12.2 5.4 9.8 9.6
One-off funds to take up economic activity
17.6 19.7 20.8 17.6 20.9 13.2 18.3 18.9
Costs of travel, accommodation and meals
0.1 1.6 1.5 1.0 1.0 0.5 0.3 0.5
Care for a child or other dependent 0.0 0.0 0.0 0.0 0.0 0.0 0.0 0.0
Refund of social security contributions paid by employers hiring the unemployed
– – 0.0 0.0 0.0 0.0 0.0 0.0
Medical examination of the unemployed
– – 0.3 0.2 0.2 0.2 0.2 0.2
Redemption of loans 1.2 0.1 0.1 0.0 0.0 0.0 0.0 0.0
Costs of contracts concluded with the employment agency
– – – – 0.0 – – –
Restructuring of employment and other
– – – 2.2 – – – –
Pilot projects – – – – 0.0 0.0 0.1 0.6
Specific elements of special programmes
– – – – 0.0 0.6 2.2 0.8
Refund of social security contributions for social cooperatives
– – – – – 0.0 0.0 0.0
State aid in the repayment of certain housing loans to people who have lost their jobs
– – – 0.0 0.1 0.1 – –
Other – 0.4 – 15.5 0.0 0.2 – –
Source: Announcement of the Speaker of the Polish Parliament on 26 March 2013 concerning the announcement of the consolidated text of the Act on employment promotion and labour market institutions, own compilation.

655. Active labour market policies POLAND
The structure of Labour Fund expenditures in the years 2006–08, i.e., before the economic crisis, shows that most resources were spent on internships, one-off grants for starting businesses for the unemployed, training, intervention works, vocational training and public works (see table 5.4). Reimbursement of costs of equipping or retrofitting the workplace was growing during this period. Since 2009, the newly introduced activities: subsidies for specialization and postgraduate internships for doctors, dentists, nurses and midwives, as well as subsidies for employers for training of young workers, became a significant part of the expenditure of the Labour Fund, which limited the funds for the activation of the unemployed. The importance of
intervention works, training and vocational training of adults declined in the structure of expenditure after 2009.
It is difficult to assess the change in the share of expend-iture in various areas of ALMP when the structure of the expenditure itself has changed. This problem can be demonstrated by analysing the dynamics of real expend-iture on specific active programmes (see table 5.5). The increase in total real expenditure on ALMPs varied in the years 2006–07. The highest increase, 78.3 per cent, was recorded for the period from 2008-09. In 2010, this increase was only 4.1 per cent. In comparison with 2006, real expenditures in 2010 were 2.7 times greater. In 2011, expenditures on ALMPs were sharply reduced. The real level of this expenditure was close to the level
Table 5.5 Dynamics of Labour Fund expenditures on selected ALMP programmes (constant prices)
2007 2008 2009 2010 2011 2012 2013
2006 = 100
Active forms of counteracting unemployment: 124.6 147.5 263.0 273.8 132.3 148.0 176.1
Training 119.6 119.7 156.0 361.8 51.8 68.6 77.0
Postgraduate studies – – – – 100.0 54.9 73.1
Intervention works 95.0 83.2 74.0 86.7 71.5 51.8 62.9
Public works 120.0 160.7 206.1 290.1 90.4 92.9 122.4
Socially useful work 129.6 124.7 133.4 147.4 101.5 114.8 131.5
Internships 100.9 128.6 182.8 191.7 105.8 104.3 149.4
Vocational training 103.9 163.1 56.8 – – – –
Scholarships for the unemployed continuing learning within school
61.6 37.6 62.9 198.1 122.0 55.7 72.5
Vocational training of adults – – – 100.0 95.6 45.0 50.4
Wages of young workers 105.4 113.4 116.8 132.8 158.9 117.6 119.1
Subsidies for employers for training of young workers
– – 100.0 127.0 106.9 107.5 95.5
Subsidies for specialization and postgraduate internships for doctors, dentists, nurses and midwives
– – 100.0 115.1 118.1 119.8 131.4
Reimbursement of costs of equipping or retrofitting workplace
368.7 373.8 481.7 736.8 158.5 321.7 374.9
One-off funds to take up economic activity 139.2 174.5 262.9 325.4 99.5 153.6 189.4
Costs of travel, accommodation and meals 3 434.1 3 949.9 4 538.9 4 955.8 1115.7 846.2 1 429.3
Care for a child or other dependent 39.1 46.4 160.6 334.3 126.0 106.2 152.4
Refund of social security contributions paid by employers hiring the unemployed
– 100.0 56.7 42.2 29.2 23.7 22.6
Medical examination of the unemployed – 100.0 115.8 138.1 43.7 64.2 72.3
Redemption of loans 14.6 7.0 2.7 4.1 2.4 3.9 2.4
Source: Announcement of the Speaker of the Polish Parliament on 26 March 2013 concerning the announcement of the consolidated text of the Act on employment promotion and labour market institutions, own compilation.

665. Active labour market policies POLAND
of expenditure in 2007. Internships (25 per cent) and one-off funds to take up economic activity (13.2 per cent) accounted for the largest share of active forms in the structure of expenditure in 2011. The share of other major programmes in the total expenditure was around 5 per cent and comprised the following: intervention works, 5.5 per cent; public works, 4.6 per cent; training, 4.0 per cent, reimbursement of costs of equipping or ret-rofitting workplaces, 5.4 per cent (see table 5.4). Nearly 40 per cent of all funds in 2011 were allocated to two activities: measures for young workers and specialization and postgraduate internships of health care workers. In the years 2012–13 expenditure on ALMPs increased, but their structure remained relatively stable.
The number of participants in the main active labour market programmes changed during the period (see table 5.6) and these changes were not uniform. A com-parison of the number of participants in 2007 and in 2013 reveals that most programmes reported declines.
The exceptions were internships (12.2 per cent increase) and funds to undertake economic activity by the un-employed (0.2 per cent increase). The largest decrease in the number of participants affected training (–52.3 per cent).
In the years 2009–10, i.e., during the period of the highest expenditure on ALMPs, the number of partici-pants in all programmes was increasing. The strongest increase was in the area of public works and internships and the least increase was in intervention works and socially useful works. A change in expenditure and in the number of participants translated into a unit cost of participation in particular programmes (see table 5.7). The most expensive programmes throughout the period involved the funds for the unemployed and employers to create jobs. The amount of these funds is usually a multiple of the average wage, so the cost of participation follows changes in wages in the economy. Among other forms of activation, the highest cost of participation
Table 5.6 Number of participants in the selected ALMP programmes
Activation programme 2007 2008 2009 2010 2011 2012 2013
Training Persons 178 089 168 336 168 334 182 363 53 805 80 684 84 919
%* 100.0 94.5 94.5 102.4 30.2 45.3 47.7
%** – 94.5 100.0 108.3 29.5 150.0 105.2
Intervention works Persons 59 096 46 032 40 348 43 151 28 490 31 779 33 932
%* 100.0 77.9 68.3 73.0 48.2 53.8 57.4
%** – 77.9 87.7 106.9 66.0 111.5 106.8
Public works Persons 40 900 44 536 54 019 74 567 22 771 30 384 32 550
%* 100.0 108.9 132.1 182.3 55.7 74.3 79.6
%** – 108.9 121.3 138.0 30.5 133.4 107.1
Socially useful works Persons 73 400 63 940 65 768 67 631 49 655 46 885 46 479
%* 100.0 87.1 89.6 92.1 67.6 63.9 63.3
%** – 87.1 102.9 102.8 73.4 94.4 99.1
Internships Persons 173 017 169 860 256 669 299 342 110 516 176 698 194 157
%* 100.0 98.2 148.3 173.0 63.9 102.1 112.2
%** – 98.2 151.1 116.6 36.9 159.9 109.9
One-off funds to take up economic activity
Persons 45 086 52 155 63 964 77 017 26 108 39 410 45 157
%* 100.0 115.7 141.9 170.8 57.9 87.4 100.2
%** – 115.7 122.6 120.4 33.9 150.9 114.6
Reimbursement of costs of equipping or retrofitting workplace
Persons 37 423 28 017 28 360 44 603 10 657 22 458 23 579
%* 100.0 74.9 75.8 119.2 28.5 60.0 63.0
%** – 74.9 101.2 157.3 23.9 210.7 105.0
* 2007 = 100; ** year on year.
Source: Ministry of Labour and Social Policy data and own calculations.

675. Active labour market policies POLAND
was found in public works and internships. The lowest cost of participation was found in socially useful works and training. In 2010, the arrangement of active pro-grammes did not change. It is worth noting that in this group of programmes, the cost of training increased the most. In 2011, the costs of participation fell, except for intervention works and internships.
The effectiveness of the labour market policy pursued in Poland is measured by two indicators: employment effectiveness and cost-effectiveness (MPiPS, 2013). Employment effectiveness is defined as the ratio of the number of people who have obtained employment within a period of three months from completing a par-ticular activation programme to the number of people who completed their participation in the programme. The fact that an unemployed participant obtained employment is reported as the participant having signed out from the unemployed registry, or if they do not register with the labour office for up to three
months after the programme. This indicator measures the gross efficiency. The cost-effectiveness is determined by dividing the amount of expenditure for the year (on a cash basis) for a given form of activation by the number of people who find employment within three months following participation in the particular form of activation.
Table 5.8 summarizes the employment effectiveness indicators and the cost-effectiveness indicators obtained for training, intervention works, public works, socially useful works, internships, vocational training of the un-employed, and the two forms of grants to create jobs. These two latter forms are characterized by a 100 per cent success rate. This high efficiency is a consequence of the conditions imposed on the beneficiaries for non-refundable assistance. The cost effectiveness of these programmes is equal to the unit cost of partici-pation. The indicators for other programmes are much lower, but among them the employment effectiveness
Table 5.7 Unit cost of selected ALMP programmes
Activation programme 2007 2008 2009 2010 2011 2012 2013
Training PLN 1 495 1 664 2 255 2 672 2 531 2 289 2 440
%* 100.0 106.8 139.9 161.5 146.6 127.9 135.1
%** 106.8 131.0 115.5 90.8 87.2 105.6
Intervention works PLN 3 633 4 268 4 475 5 030 6 249 4 371 5 024
%* 100.0 112.7 114.2 125.1 149.0 100.5 114.5
%** 112.7 101.3 109.6 119.1 67.5 113.9
Public works PLN 4 352 5 578 6 099 6 360 5 992 5 514 6 867
%* 100.0 123.0 129.9 132.1 119.3 105.9 130.7
%** 123.0 105.6 101.6 90.3 88.7 123.4
Socially useful works PLN 452 530 559 613 583 736 852
%* 100.0 112.6 114.6 122.6 111.8 136.1 156.2
%** 112.6 101.8 106.9 91.2 121.7 114.8
Internships PLN 4 008 5 413 5 269 6 329 7 676 4 856 6 434
%* 100.0 129.6 121.9 142.7 166.0 101.2 133.0
%** 129.6 94.0 117.1 116.3 61.0 131.3
One-off funds to take up economic activity
PLN 11 904 13 402 17 102 18 037 16 082 17 408 19 492
%* 100.0 108.0 133.2 136.9 117.1 122.2 135.6
%** 108.0 123.3 102.8 85.5 104.4 111.0
Reimbursement of costs of equipping or retrofitting workplace
PLN 9 654 13 685 18 143 18 380 16 160 17 356 19 306
%* 100.0 136.0 174.3 172.1 145.0 150.2 165.6
%** 136.0 128.1 98.7 84.3 103.6 110.2
* 2007 = 100; ** year on year.
Source: Ministry of Labour and Social Policy data and own calculations.

685. Active labour market policies POLAND
of intervention works stands out. Moreover, during the period under consideration, values of this indicator for internships and public works increased steadily. Meanwhile, in the case of the socially useful works programme, the indicator changed in the opposite direction. In 2013, the employment efficiency of this programme was only 19 per cent. For training, the change in ratio was in the range 34.3–47.6 per cent. The lowest efficiency of the training programme was in 2009 and 2010, i.e. at a time when the labour market situation was the most difficult.
Generally, evaluation of active labour market policy in Poland is not easy due to lack of information, among other things. Reports on the effectiveness of activities, prepared by the Ministry of Labour and Social Policy, are focused on large aggregates, without comparing dif-ferent groups of participants. Such comparisons appear infrequently and with a significant delay. Table 5.9 con-tains a summary of the two groups of beneficiaries: the unemployed under 30 years old and the unemployed over 45/50 years old in 2012. The table clearly shows that the number of young participants in active programmes is higher than the number of participants in the oldest age group. The employment efficiency of measures tar-geted at young people is also higher on average, as well
as when broken down by individual forms of activa-tion. This difference is particularly evident in the case of training and internships.
While there were several studies conducted in Poland that dealt with net employment efficiency of ALMP programmes, they mostly concentrated on the 1990–97 period, due to data availability issues.
More recently, comprehensive studies on employment efficiency were carried out in 2009, with the use of a propensity score matching method. The results of these studies were presented by Wiśniewski and Zawadzki (2011) and they used statistical series from Syriusz – the official system of the Polish public employment services, which were combined with survey-based data. The most important conclusions from this most recent research can be summarized as follows:• Vocational training – average net efficiency in 2009
was 8.7 per cent. Positive effects of this programme are revealed between 9 and 12 months from com-pletion. Its efficiency depends upon the categories of participants. The best employment effects were found in the group of youngest (35 years old or under) and oldest (older than 55) participants as well as among those with low and very low levels of qualifications.
Table 5.8 Employment and cost effectiveness of selected ALMP programmes
Activation programme 2007 2008 2009 2010 2011 2012 2013
Training a % 44.4 39.2 34.3 36.7 43.1 42.5 47.6
b PLN 3 477 4 374 6 762 7 431 5 778 5 495 5 219
Intervention works a % 74.3 73.4 71.8 70.8 71.4 74.4 77.5
b PLN 5 118 5 737 6 415 7 549 6 079 6 627 7 190
Public works a % 46.9 46.6 48.0 46.0 53.2 57.3 60.0
b PLN 10 050 12 578 13 122 14 069 9 454 10 260 11 331
Socially useful works a % 44.0 43.4 39.8 39.8 36.1 33.0 19.0
b PLN 1 039 1 277 1 423 1 597 1 587 2 319 4 602
Internships a % 55.2 54.2 49.5 48.4 52.6 60.9 65.8
b PLN 7 615 11 309 13 085 13 977 9 368 10 366 9 623
Vocational training a % 52.6 53.4 52.0
b PLN 6 664 10 299 8 245
One-off funds to take up economic activity
a % 100.0 100.0 100.0 100.0 100.0 100.0 100.0
b PLN 11 904 13 402 17 102 18 037 16 082 17 408 19 492
Reimbursement of costs of equipping or retrofitting workplace
a % 100.0 100.0 100.0 100.0 100.0 100.0 100.0
b PLN 9 654 13 685 18 144 18 380 16 160 17 356 19 306
a: employment effectiveness indicator; b: cost effectiveness indicator.
Source: Ministry of Labour and Social Policy data and own calculations.

695. Active labour market policies POLAND
Positive vocational training effects were observed in industrial, declining industrial and agri-industrial powiats, i.e. in areas with relatively high levels of structural unemployment where new jobs are being created at the same time. After completing vocational training, participants who took up employment most commonly signed fixed-term contracts (68.9 per cent), while permanent-contract holders constituted 20 per cent and civil-law contracts were a basis for work for 11.1 per cent. In the period between January 2009 and April 2011, 37.4 per cent of the employed participants changed their jobs, which, in the opinion of the study authors, suggests elevated vulnerability of this employment.
• Training – average net efficiency in 2009 was 3.1 per cent. Positive effects of training were most commonly recorded 4–6 months after completion. These effects were found to be strongest not only in large urban areas, but also in rural powiats with both a touristic and an agricultural profile. Training generated the most positive employment effects among the youth. Similar to the case of vocational training, 69.3 per cent of the employed participants signed fixed-term contracts, while 11.7 per cent had permanent con-tracts and 19 per cent performed work based on civil-law contracts. The share of those who changed their jobs between January 2009 and April 2011 was somewhat lower (compared with vocational training) and amounted to 32.1 per cent.
• Intervention works – these programmes had a net employment efficiency rate of 15.6 per cent and proved most effective in the case of men unemployed for less than 12 months, with little previous pro-fessional experience. The best positive effects were observed in rural powiats with touristic and agricul-tural dominance, generally characterized by above average unemployment rates and small numbers of firms able to generate jobs. Employed participants of
intervention works programmes would normally sign fixed-term contracts (70.5 per cent) or permanent contracts (22.7 per cent), while relatively few signed civil-law contracts to perform work (6.8 per cent).
• Socially useful works – these programmes were found to have an overall negative net employment efficiency rate and are targeted at the unemployed with very low odds of employment, who are also social assistance beneficiaries. The souring effect lowers the programme efficiency considerably. Participants of socially useful works programmes who obtained jobs were often in subsidized employment, and around one in four jobs was performed based on a civil-law contract.
• Public works – this is another programme that does not generally generate positive net employment effects. It is addressed towards unemployed persons in the most difficult labour market situation: low- educated men and older workers able to perform physical work. According to the authors of the study, this programme has ceased to provide activation effects and became a form of passive financial sup-port. Of the few programme participants who sub-sequently took up employment, 80.4 per cent signed fixed-term contracts, 8.9 per cent signed permanent contracts and 12.5 per cent had civil-law contracts.
• Subsidies to start a business – this is a programme with unquestionably the best net employment effi-ciency effects (62.6 per cent), although this efficiency tends to decrease with time from completing the programme and good overall effects are associated with high costs. The results show that the subsidies obtained play a major role in taking the decision to start a business. Without the subsidy, only 26 per cent of the participants are reported to have even consid-ered starting a business and only 7 per cent of the participants surveyed answered that they had decided upon this step anyway.

705. Active labour market policies POLAND
Tabl
e 5
.9 E
mpl
oym
ent
and
cost
-eff
ecti
vene
ss o
f se
lect
ed A
LMP
pro
gram
mes
dir
ecte
d at
une
mpl
oyed
age
d 3
0 or
und
er a
nd 4
5/5
0 or
old
er in
201
2
Pro
gram
mes
Exp
endi
ture
(t
hous
and
PLN
)N
umb
er o
f enr
olle
d p
arti
cip
ants
Num
ber
of
par
tici
pan
ts, w
ho
com
plet
ed
Num
ber
of
par
tici
pan
ts
empl
oyed
Em
ploy
men
t eff
ecti
vene
ss(%
)
Cos
t eff
ecti
vene
ss
(PLN
)
Pro
gram
mes
to
acti
vate
pop
ulat
ion
aged
30
or u
nder
Trai
ning
15
802
5 89
95
838
2 44
941
.96
452
Pub
lic w
orks
5
390
1 16
41
136
750
66.0
7 18
7
Inte
rnsh
ips
67 3
8223
099
22 2
5513
815
62.1
4 87
7
Rei
mbu
rsem
ent o
f cos
ts o
f equ
ippi
ng
or re
trofi
ttin
g w
orkp
lace
47 5
5526
92
685
2 68
399
.917
725
Subs
idie
s to
take
up
ec
onom
ic a
ctiv
ity54
752
3 09
83
098
3 08
499
.517
753
Post
grad
uate
stu
dies
132
1717
1270
.611
025
Inte
rven
tion
wor
ks3
218
1 49
414
712
585
.02
575
Tota
l19
4 23
137
461
36 4
9924
043
65.9
8 07
9
Pro
gram
mes
to
acti
vate
pop
ulat
ion
aged
45/
50 o
r ol
der
Trai
ning
4
328
2 08
42
095
547
26.1
7 91
2
Pub
lic w
orks
15
384
3 15
43
139
1 96
762
.77
821
Inte
rnsh
ips
13 8
894
306
4 13
82
049
49.5
6 77
8
Rei
mbu
rsem
ent o
f cos
ts o
f equ
ippi
ng
or re
trofi
ttin
g w
orkp
lace
15 3
1084
083
281
898
.318
717
Subs
idie
s to
take
up
ec
onom
ic a
ctiv
ity11
115
594
594
594
100.
018
712
Post
grad
uate
stu
dies
493
33
100.
016
267
Inte
rven
tion
wor
ks24
871
113
1 09
282
975
.93
000
Tota
l 62
562
12 0
9411
847
6 80
857
.59
189
Sou
rce:
Gov
ernm
ent b
ill a
men
ding
the
law
on
empl
oym
ent p
rom
otio
n an
d la
bour
mar
ket i
nstit
utio
ns a
nd c
erta
in o
ther
act
s (2
013)
.

71titrepourheader POLAND
The effects of the world economic crisis on the Polish labour market were not as severe as in other EU
Member States. There are a few explanations for this phenomenon.
First, the crisis in Poland only led to economic slow-down, but no recession was ever witnessed, even though the impact of the crisis was distributed unevenly across sectors. The biggest impact was connected with the deterioration of export opportunities. This influenced companies selling large parts of their production abroad87 – especially transnational companies in the manufacturing industry that have their subsidiaries in Poland. The slow economic recovery on the global scale is a major reason why the manufacturing industry has not yet recovered to pre-crisis levels.
Second, the relatively high flexibility of the Polish labour market prior to the crisis (extensive use of non-standard forms of employment), made it easier to adjust employment levels and wages to the deteriorating eco-nomic situation. It should be stressed that most of the “flexibility” of the Polish labour market was introduced prior to the crisis. However, the anti-crisis package extended its scope and enabled companies that faced financial problems to use additional measures (with some financial support from the government) to adjust working time to business cycle conditions. Some of these special measures were subsequently permanently imple-mented into the legal framework (the most important of which are the possibility of extension of the settlement period to 12 months, and the use of variable working hours by companies). One of the most problematic elements of the Polish labour market flexibility is the extensive use of fixed-term and temporary employment, and especially civil-law contracts. While this supported the adjustment processes in the Polish labour market during the crisis and saved many jobs, the scale of such precarious employment in Poland has had visible adverse social and economic side effects. The first actions
87. The biggest employment reductions at the beginning of the crisis were reported in such companies.
towards limiting the use of these types of employment were taken by the Polish government within the anti-crisis package, which limited the maximum cumulative length of consecutive fixed-term employment contracts to 24 months. Another step, triggered by the political and social campaign carried out by the trade unions, led to undertaking actions aimed at reducing the use of civil-law contracts. These proposals limit the scope of flexibility, but at the same time provide more security for Polish workers.
Third, institutional changes that had taken place before the crisis (decreasing density of trade unions, decentralized wage-bargaining scheme), as well as those introduced during the crisis (according to the Act on a negotiation-based system for setting average wage increases in enterprises, in force from 1 January 2010, there is no obligation to undertake wage bar-gaining every year, and the bargaining process only takes into consideration the financial condition of the enterprise), softened wage rigidity. Thus, wages provided an absorption channel for the crisis as wage pressure eased and the wage growth rate fell below the labour productivity growth rate. Additionally, wage flexibility was a further result of using non-standard forms of employment – mainly civil-law contracts. The minimum wage legislation is not applicable to civil-law contracts, which supported the employability of low-skilled or young people even during the crisis.
Fourth, the relatively good situation in the Polish labour market during the economic slowdown should be attrib-uted to the HR strategies implemented by companies. The strategies were significantly different to those that had been used during the economic slowdown at the beginning of the twenty-first century. At that time, the main strategy was to reduce the number of employees. In contrast, the last crisis was characterized by labour hoarding in many companies. This was a result of pre-vious problems with hiring adequate personnel, which companies were facing even until 2008. Although the economic recovery has been slower and weaker than expected, labour hoarding was still a popular strategy in 2012 and 2013.
Conclusion

72titrepourheader POLAND
Taking into account the size of the public versus the private sector in Poland, it seems that employment downsizing and freezing the wage fund in the public sector within the austerity policy actions did not have a significant overall impact on the situation in the Polish labour market.
On the labour market policy side, while there have been a number of reforms introduced, they mostly coincided with the crisis rather than being a reaction to it. It should be acknowledged, however, that the ALMP system has been rationalized. In 2013 it con-centrated mainly on more efficient programmes, and general net employment efficiency was considerably higher compared with 2008. The impact on the labour market of the ongoing reform, which shifts resources from protecting “vulnerable groups”, which had been defined too broadly, towards individual profiling of the unemployed and binding labour market with social policy, is not yet known.
Some of the measures implemented into the legal frame-work in order to counteract the effects of the crisis should strengthen the potential of the Polish labour market in the medium and long run. These measures include:• the possibility of extension of the settlement period
to 12 months; • the use of variable working hours by companies;• changes in wage bargaining, weakening wage pressure
through the indexation scheme.
All of these measures were aimed at making the labour market more flexible. However, government and social partners will now concentrate on providing more se-curity to the labour market. This issue is mainly related to the problem of excessive use of temporary employment (especially civil-law contracts) by companies. Some pro-posals on how to solve this problem have been offered (the Ministry of Labour and Social Policy suggested that, regardless of the number of contracts of mandate, they would be subject to social insurance contribu-tions up to the equivalent of the minimum wage, thus civil-law contracts would not be so attractive, and will be changed into employment contracts), but they should be analysed carefully from the point of view of their potential employment effects. The idea of a single con-tract seems promising, but the discussion about single contracts has just started, so it will take time to prepare more detailed analysis and proposals. The financial pro-tection of the unemployed also seems insufficient: the replacement rates are low and there are no signs of con-vergence with respect to the minimum or average wage.
An ongoing reform that has significant potential to raise employment is the deregulation of professions. According to various sources, facilitating access to 250 targeted professions (more than half of which have already been deregulated) is estimated to create between 50,000 and 100,000 new jobs in the medium run.

73References POLAND
References
2009 Report on the implementation of the National Reform Programme for the years 2008–2011 for the implementation of the Lisbon Strategy (2009), Ministry of Economy, Warsaw.
Act on employment promotion and labour market institutions (2004), Journal of Laws 2004 No. 99, item 1001.
Act on employment promotion and labour market institutions (2009), Journal of Laws 2009 No. 6 item 33.
Act on employment promotion and labour market institutions (2010), Journal of Laws 2010 No. 257, item 1725.
Act on employment promotion and labour market institutions (2014), Journal of Laws 2014 No. 598.
Arak, P.; Lewandowski, P.; Żakowiecki P. (2014), Dual Labour Market in Poland – Proposals for Overcoming the Deadlock, IBS Policy Paper 01/2014.
Arendt, L.; Kukulak-Dolata, I.; Poliwczak, I. (2009), Perspectives for implementing the flexicurity model at the enterprise level, in: Kryńska, E. (ed.), Flexicurity in Poland. Diagnosis and recommendations. Final report, Ministry of Labour and Social Policy, Labour Market Department, Warsaw, pp. 133–194.
Arendt, Ł.; Hryniewicka, A.; Kukulak-Dolata, I.; Rokicki, B. (2012), Bezrobocie - między diagnozą a działaniem, IRSS, Warsaw.
Bednarski, M.; Frieske, K. W. (eds) (2012), Zatrudnienie na czas określony w polskiej gospodarce, IPiSS, Warszawa.
Boeri, T.; Garibaldi, P.; Moen, E. (2013), The Economics of Severance Pay, IZA Discussion Papers No. 7455.
Broniatowska, P.; Majchrowska, A.; Żółkiewski, Z. (2013), Wynagrodzenie minimalne w Polsce. Czy powinno być zróżnicowane regionalnie?, Studia BAS Nr 4(36), pp. 125–157.
Council of Ministers (2014), Wieloletni plan finansowy państwa na lata 2014 - 2017, Warszawa.
Council Recommendation on Poland’s 2013 national reform programme and delivering a Council opinion on Poland’s convergence programme for 2012–2016, COM(2013) 371 final.
Czapiński, J.; Panek, T. (2014), Diagnoza Społeczna 2013, www.diagnoza.com.
Czarzasty, J. (2014), Poland: Changes to wage-setting mechanisms in the context of the crisis and the EU’s new economic governance regime, http://www.eurofound.europa.eu/eiro/studies/tn1402049s/pl1402049q.htm, accessed on 22.07.2014.
Draft bill amending the law on mitigating the effects of the economic crisis for employees and entrepreneurs (2010), Form No. 3240, 20 May 2010, Website of the Sejm.
ETUI (2010), Policy Brief European Economic and Employment Policy, issue 1/2010.

74References POLAND
Eurofound (2010), Poland: Employment subsidies for reduced working time and training subsidies, Dublin: Eurofound, http://www.google.pl/url?sa=t&rct=j&q=&esrc= s&source = web&cd=1&cad=rja&uact=8&ved=0CB8QFjAA&url= http%3A%2F%2Fwww.eurofound.europa.eu%2Fpubdocs%2F2010%2F635%2Fen% 2F2%2FEF10635EN.pdf&ei = 03DKU739D4uL4gSck4D4Ag&usg=AFQjCNHun QQgyoVR3fxS5a9nCqIxCaWBQw&bvm = bv.71198958,d.bGE, accessed on 19.07.2014.
European Commission (2012), Employment and Social Developments in Europe 2011, Luxembourg: Publications Office of the European Union.
European Commission (2013), Industrial Relations in Europe 2012, Luxembourg: Publications Office of the European Union.
Explanatory memorandum to the government bill amending the Act on employment promotion and labour market institutions and amending certain other acts of 22 October 2008, Form No. 1196. Website of the Sejm RP [http://orka.sejm.gov.pl/Druki6ka.nsf]
Flexicurity w Polsce. Diagnoza i rekomendacje (2009), E. Kryńska (Ed.), MPiPS, Warsaw.
FZZ (2013), Komentarz Forum Związków Zawodowych do odpowiedzi Ministra Pracy i Polityki Społecznej na postulaty związkowe złożone w trakcie wrześniowych pikiet, http://www.zzprctarnow.pl/download/Komentarz_Forum_Zwiazkow_Zawodowych.pdf, accessed on 15.07.2014.
Government bill on mitigating the effects of the economic crisis for employees and entrepreneurs (2009), Form No. 2044, 5 June 2009, Website of the Sejm.
Government bill amending certain acts related to the implementation of the budget law (2009), Form No. 29, 24 November 2011, Website of the Sejm.
Government bill amending the law on employment promotion and labour market institutions and certain other acts (2013), Form No. 1949, 18 November 2013, Website of the Sejm.
Hogarth, T.; Owen, D.; Gambin, L.; Hasluck, C.; Lyonete, C.; Casey, B. (2009), The equality impacts of the current recession, Equality and Human Rights Commission Research report No. 47.
Hryniewicka, A.; Herbst, J. (2010), Pomoc społeczna w liczbach 2008, IRSS, Warsaw.
Korniluk, D. (2013), Optymalizacja wartości parametrów reguły wydatkowej za pomocą algorytmu genetycznego, Bank i Kredyt 44(1), pp. 67–98.
Kryńska, E. (2007), Elastyczność zatrudnienia na polskim rynku pracy, Polityka Społeczna No. 11/12, pp. 1–8.
Kryńska, E. (ed.) (2009), Flexicurity w Polsce. Diagnoza i rekomendacje, MPiPS, Warsaw.
Kryńska, E.; Kwiatkowski, E. (2013), Podstawy wiedzy o rynku pracy, Wydawnictwo Uniwersytetu Łódzkiego, Łódź.
Kwiatkowski, E.; Wlodarczyk, P. (2012), Wpływ prawnej ochrony zatrudnienia na rynek pracy w warunkach negatywnego szoku ekonomicznego, Gospodarka Narodowa No. 11–12, pp. 1–23.
KPMG (2008), Migracja pracowników – szansa czy zagrożenie? Badanie – edycja 2008 rok. KPMG&PKPP Lewiatan, 2008, http://www.mighealth.net/pl/images/c/c8/Migracja_pracownikow.pdf, accessed 18.07.2014.
Lewandowski, P.; Magda, I. (eds.) (2013), Zatrudnienie w Polsce 2012. Rynek pracy w okresie wyjścia z kryzysu, Centrum Rozwoju Zasobów Ludzkich, Warszawa.
Majchrowska, A.; Żółkiewski, Z. (2012), The impact of minimum wage on employment in Poland, Investigaciones Regionales 24, pp. 211–239.

75References POLAND
Maksim, M. (2011). Efektywność aktywnych programów rynku pracy – wyniki badań ilościowych In: Efektywność polityki rynku pracy w Polsce, Wiśniewski, Z.; Zawadzki, K. (eds), WUP, Uniwersytet Mikołaja Kopernika, Toruń.
Męcina. J. (2013), Niewykorzystane zasoby. Nowa polityka rynku pracy, Instytut Polityki Społecznej Uniwersytetu Warszawskiego, Warszawa.
MPiPS (2008–14), The efficiency of the basic forms of vocational activation implemented under the programmes for the employment promotion, mitigation of the effects of unemployment and vocational activation, Ministry of Labour and Social Policy, Warsaw, Website of the Ministry of Labour and Social Policy.
MPiPS (2013), Stan realizacji pakietu antykryzysowego, http://www.mpips.gov.pl/download/gfx/mpips/pl/defaultopisy/4425/1/1/STAN%20REALIZACJI%20PAKIETU%20ANTYKRYZYSOWEGO_09-07-2013.pdf, accessed on 15.07.2014.
National Reform Programme for the years 2008 - 2011 for the implementation of the Lisbon Strategy (2008), Ministry of Economy, Warsaw.
NBP (2011), Kwartalny raport o rynku pracy 1 kw. 2011 r., http://www.nbp.pl/home.aspx?f = /publikacje/rynek_pracy/rynek_pracy.html
NBP (2011), Kwartalny raport o rynku pracy I1 kw. 2011 r., http://www.nbp.pl/home.aspx?f = /publikacje/rynek_pracy/rynek_pracy.html
NBP (2011a), Badanie ankietowe rynku pracy. Raport 2011, Warsaw.
NBP (2012), Kwartalny raport o rynku pracy 3 kw. 2012 r., http://www.nbp.pl/home.aspx?f = /publikacje/rynek_pracy/rynek_pracy.html
NBP (2012a), Badanie ankietowe rynku pracy. Raport 2012, Warsaw.
NBP (2013), Raport 2013. Badanie ankietowe rynku pracy, Warsaw.OECD (2010), Economic Survey of Poland 2010, Paris.
NLI (2013), Sprawozdanie z działalności Państwowej Inspekcji Pracy w 2012 roku, Warszawa.
NLI (2014), Sprawozdanie z działalności Państwowej Inspekcji Pracy w 2013 roku, Warszawa.
Parliament (2011/2012), Druk nr 119; Do druku 119, documents related to Democratic Left Alliance party proposal with regard to changes in the Act of 10 October 2002 on the minimum wage, http://orka.sejm.gov.pl/Druki7ka.nsf/0/37D7CDEDBC4C9431C1257982004E565E/%24File/119.pdf, http://orka.sejm.gov.pl/Druki7ka.nsf/0/D6B7309851F9EC39C125799F004E31AC/%24File/119-002.pdf, accessed on 21.07.2014.
Opinion of the Government bill on mitigating the effects of the economic crisis for employees and entrepreneurs (2009), 1 July 2009 Opinions of the Parliamentary Research Bureau, Sejm Form No. 2044) Website of the Sejm.
Pomoc społeczna w liczbach 2010 (2012), J. Staręga-Piasek (Ed.), IRSS, Warsaw.
Report on implementation of the state budget for the period from 1 January to 31 December 2007 (2008), Form No. 566, 29 May 2008, Website of the Sejm.
Report on the implementation of the state budget for the period from 1 January to 31 December 2008 (2009), presented by the President of the Council of Ministers Form No. 2031, 27 May 2009, Website of the Sejm.
Report on implementation of the state budget for the period from 1 January to 31 December 2009 (2010), Form No. 3090, 28 May 2010, Website of the Sejm.
Report on implementation of the state budget for the period from 1 January to 31 December 2010 (2011), Form No. 4270, 30 May 2011, Website of the Sejm.

76References POLAND
Report on implementation of the state budget for the period from 1 January to 31 December 2011 (2012), Form No. 447, 31 May 2012, Website of the Sejm.
Report on implementation of the state budget for the period from 1 January to 31 December 2012 (2013), Form No. 1414, 31 May 2013, Website of the Sejm.
Report on implementation of the state budget for the period from 1 January to 31 December 2013 (2014), Form No. 2445, 30 May 2014, Website of the Sejm.
Riso, S. (2010), Very atypical work. Explanatory analysis of fourth European Working Conditions Survey – Background Paper, Dublin: Eurofound, http://www.eurofound.europa.eu/pubdocs/2010/10/en/2/EF1010EN.pdf, accessed on 19.07.2014.
Rogut, A.; Żółkiewski, Z. (2011), Minimum wage in Poland: Economy-wide or Regionally Differentiated?, Acta Universitatis Lodziensis, Folia Oeconomica 248, pp. 269–290.
Strzelecki, P.; Wyszyński, R.; Saczuk, K. (2009), Zjawisko chomikowania pracy w polskich przedsiębiorstwach po okresie transformacji, Bank i Kredyt 40 (6), pp. 77–104.
Wojciechowski, W. (2011), Jak ograniczyć w Polsce liczbę umów na czas określony i wzmocnić tempo rozwoju gospodarki?, Analiza FOR 7/2011.
World Bank (2013), Poland: Reforming Government Pay Setting Practices, Report No. ACS4446.
Wiśniewski, Z.; Zawadzki, K. (eds). (2011), Efektywność polityki rynku pracy w, WUP, Uniwersytet Mikołaja Kopernika, Toruń.
Visser, J. (2008), ‘Europe’s industrial relations in a global perspective’, in Industrial Relations in Europe Report 2008, pp. 19-44, European Commission, Directorate-General for Employment, Social Affairs and Equal Opportunities, Brussels.
Zych, A. (2008), Rola państwa w kształtowaniu wzrostu przeciętnych wynagrodzeń, Polityka Społeczna No. 3/2008, pp. 6–9.