pda rne infinity alliance presentation final 2013
TRANSCRIPT


20132008 20185 Yrs has past 5 Yrs from now
Problem - MONEY Problem - MONEY
WHY? What now?
CHANGE!
Problem - MONEY
“The definition of insanity is doing the same thing over and over and over and over, and expecting a different result.” -Albert Einstein
"There are two primary choices in life: to accept conditions as they exist, or accept the responsibility for changing them.“ -Denis Waitley
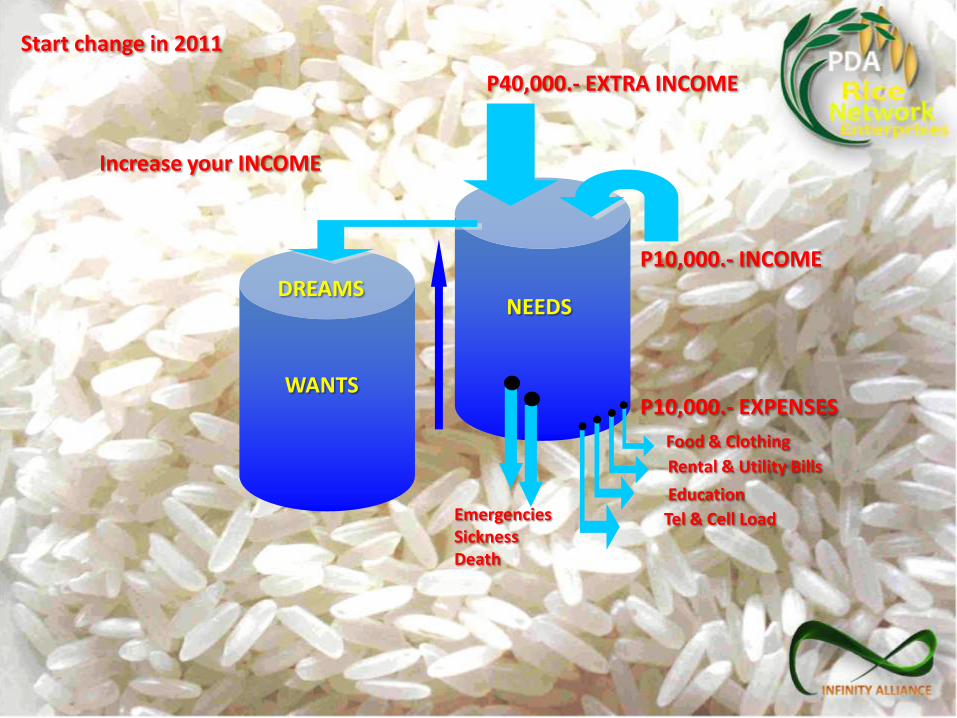
P10,000.- INCOME
Food & Clothing
Rental & Utility Bills
EducationEmergenciesSicknessDeath
NEEDS
WANTSP10,000.- EXPENSES
Tel & Cell Load
Start change in 2011
P40,000.- EXTRA INCOME
Increase your INCOME
DREAMS

Let us carefully consider:
ELEMENTARY = 6 YEARS
HIGH SCHOOL = 4 YEARS
COLLEGE = 4 YEARS
BOARD REVIEW = 1 YEAR
PRE-SCHOOL = 3 YEARS
TOTAL = 18 YEARS Study To Earn P12,000.-
Taxes & Contributions = P 3,000.-
Transportation = P 2,000.-
Food & Lodging = P 4,500.-
Cell Phone Load = P 1,500.-
Total =P 11,000.-
LESS:
NET = P 1,000.-
To Teach You How


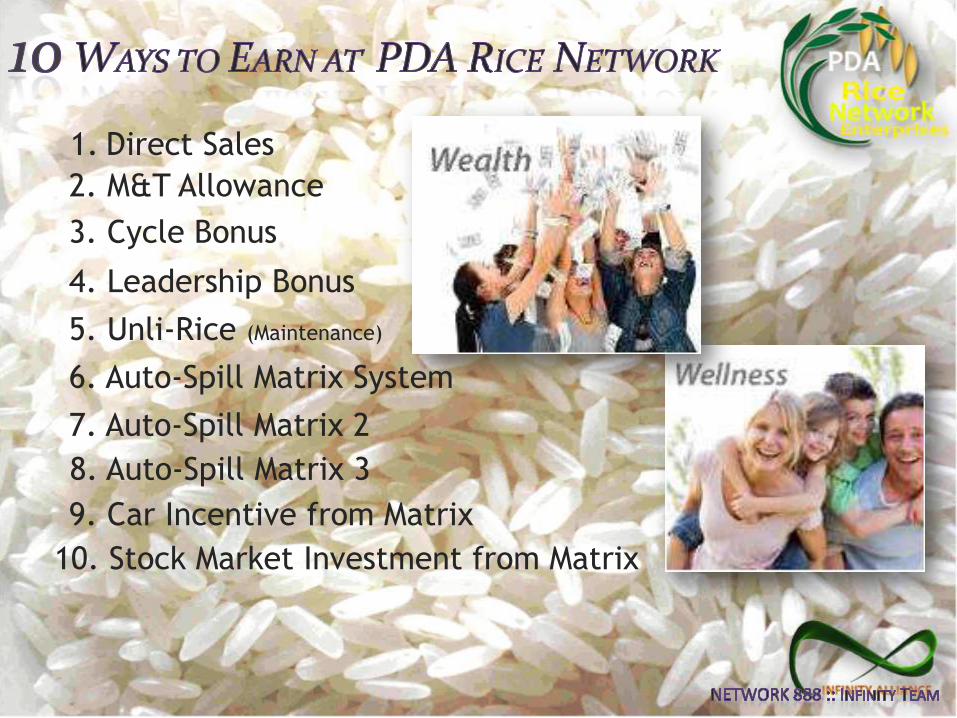
1. Direct Sales
2. M&T Allowance
3. Cycle Bonus
4. Leadership Bonus
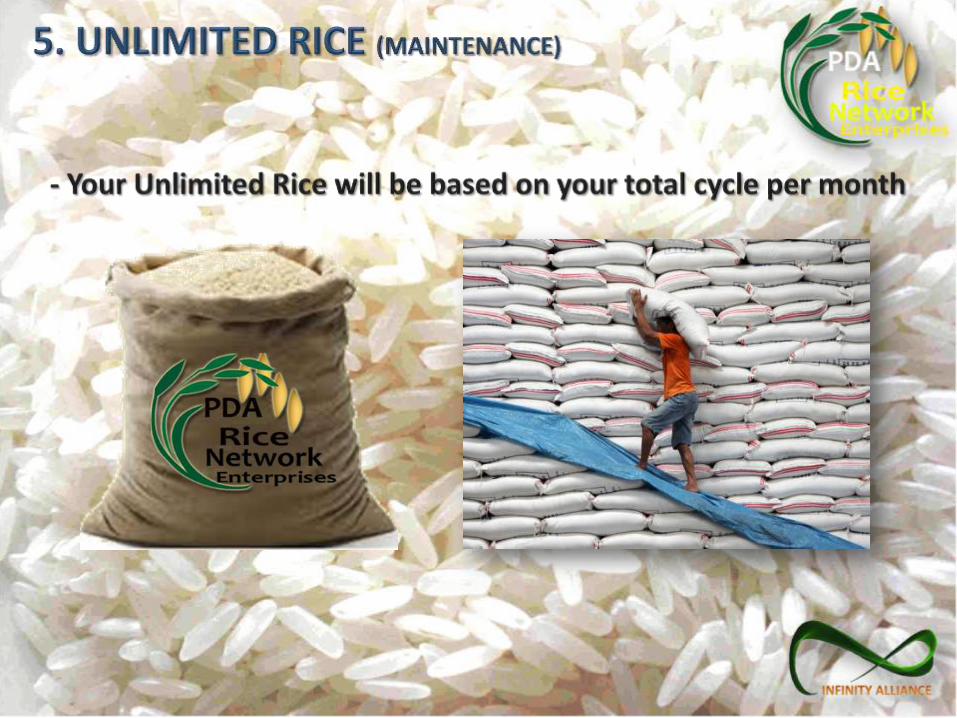
5. Unli-Rice (Maintenance)
6. Auto-Spill Matrix System
7. Auto-Spill Matrix 2
8. Auto-Spill Matrix 3
9. Car Incentive from Matrix
10. Stock Market Investment from Matrix

YOU
up to 50% Discount on all nutritional products

YOU
+ 2 Spill over
YOU2
1DirectRequirements :
MAINTENANCE
=P100.00/ Cycle x 10 Cycle per day = 1,000/dayPOTENTIAL INCOME

You1
A B
You3 C D
You4 E F
You5 G H
10%
10%
10%
10%
You6
You7 K L
I J
10%
1500
1500
1500
1500
1500
Invite 2 People

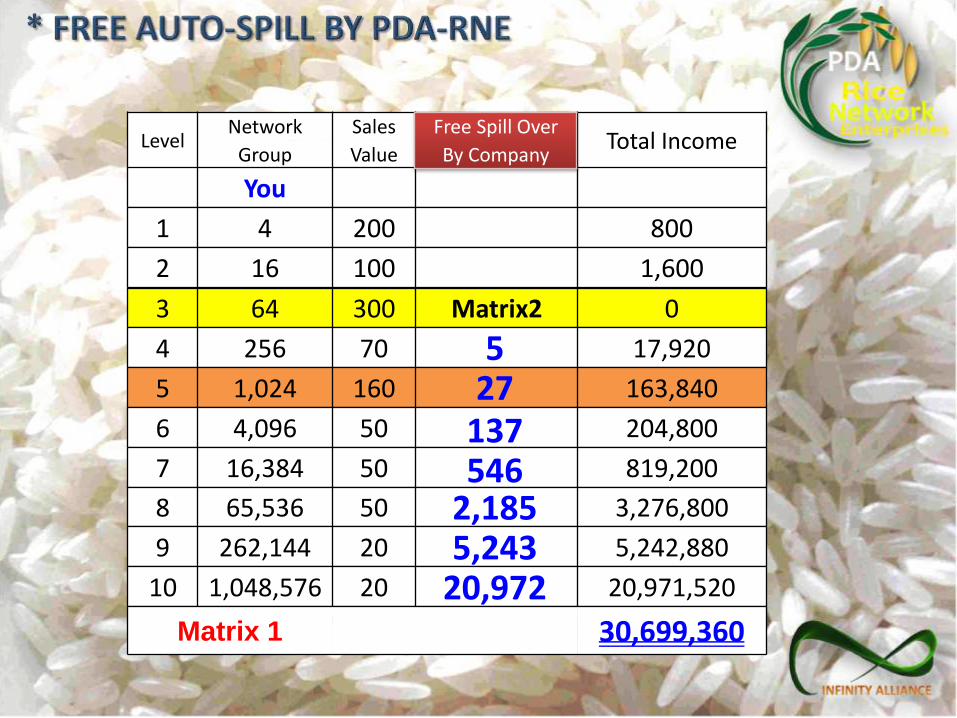
LevelNetwork Sales
Total IncomeGroup Value
You
1 4 200 800
2 16 100 1,600
3 64 300 Matrix2 0
4 256 70 17,920
5 1,024 160 163,840
6 4,096 50 204,800
7 16,384 50 819,200
8 65,536 50 3,276,800
9 262,144 20 5,242,880
10 1,048,576 20 20,971,520
Matrix 1Php1,500 will be deducted from 25% MAINTENANCE 30,699,360
LevelNetwork Sales
Total IncomeGroup Value
You
1 4 200 800
2 16 100 1,600
3 64 300 Matrix2 0
4 256 70 17,920
5 1,024 160 163,840
6 4,096 50 204,800
7 16,384 50 819,200
8 65,536 50 3,276,800
9 262,144 20 5,242,880
10 1,048,576 20 20,971,520
Matrix 1 30,699,360
527
137546
2,1855,243
20,972
Free Spill Over
By Company
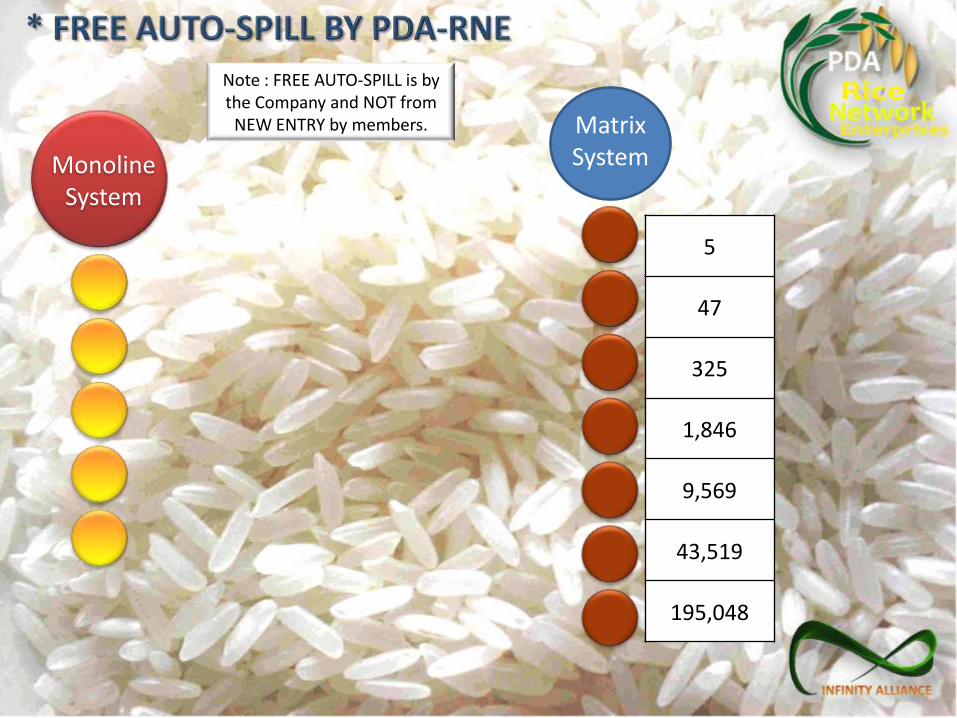
Note : FREE AUTO-SPILL is by the Company and NOT from
NEW ENTRY by members.
5
47
325
1,846
9,569
43,519
195,048
MonolineSystem
MatrixSystem
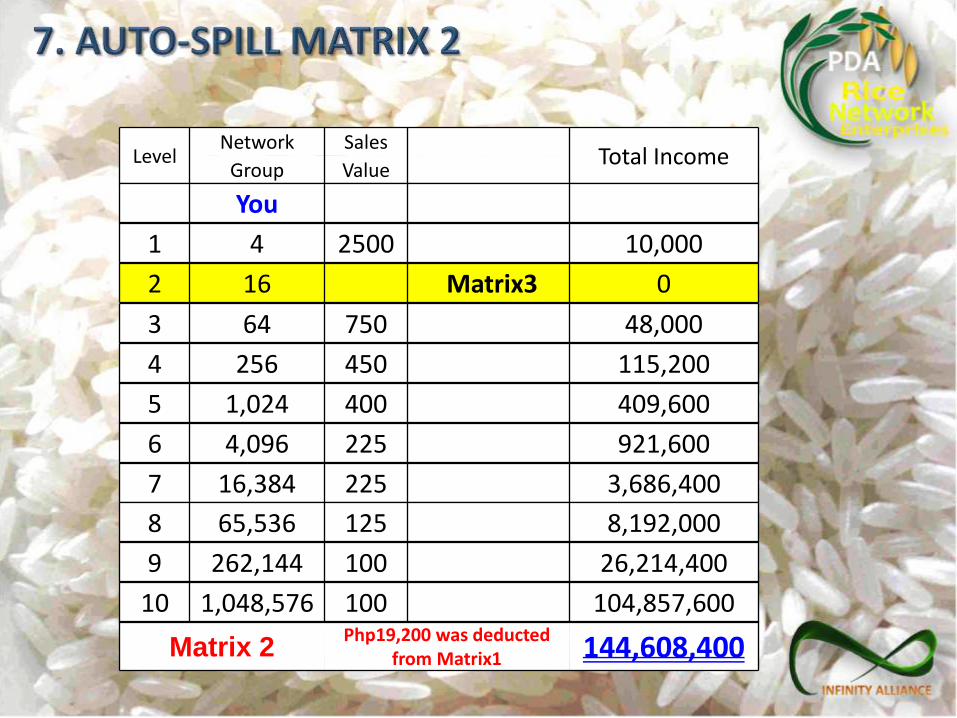
LevelNetwork Sales
Total IncomeGroup Value
You
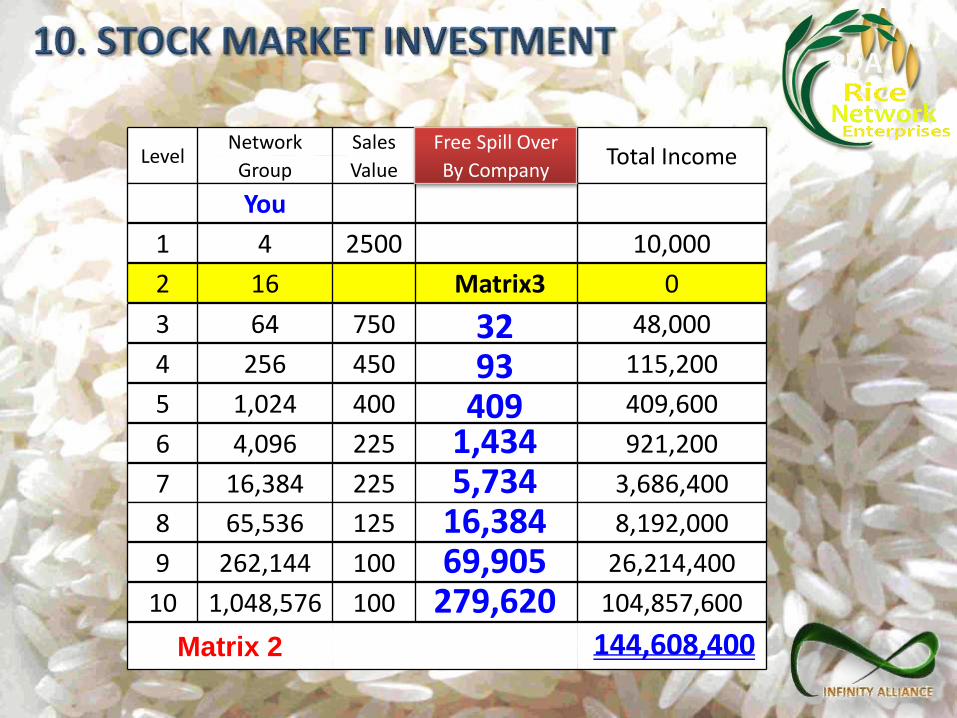
1 4 2500 10,000
2 16 Matrix3 0
3 64 750 48,000
4 256 450 115,200
5 1,024 400 409,600
6 4,096 225 921,600
7 16,384 225 3,686,400
8 65,536 125 8,192,000
9 262,144 100 26,214,400
10 1,048,576 100 104,857,600
Matrix 2Php19,200 was deducted
from Matrix1 144,608,400

LevelNetwork Sales
Total IncomeGroup Value
You
1 4 2500 10,000
2 16 Matrix3 0
3 64 750 48,000
4 256 450 115,200
5 1,024 400 409,600
6 4,096 225 921,200
7 16,384 225 3,686,400
8 65,536 125 8,192,000
9 262,144 100 26,214,400
10 1,048,576 100 104,857,600
Matrix 2Php19,200 was deducted
from Matrix1 144,608,400
3293
4091,4345,734
16,38469,905
279,620
Free Spill Over
By Company

LevelNetwork Sales
Total IncomeGroup Value
You
1 4 2,500 10,000
2 16 2,000 32,000
3 64 1,350 86,400
4 256 1,350 345,600
5 1,024 1,200 1,228,800
6 4,096 800 3,276,800
7 16,384 600 9,830,400
8 65,536 600 39,321,600
9 262,144 400 104,857,600
10 1,048,576 400 419,430,400
Matrix 3Php48,000 was deducted
from Matrix2 578,419,600
62170
2811,2283,276
15,29161,166
244,667978,670
Free Spill Over
By Company
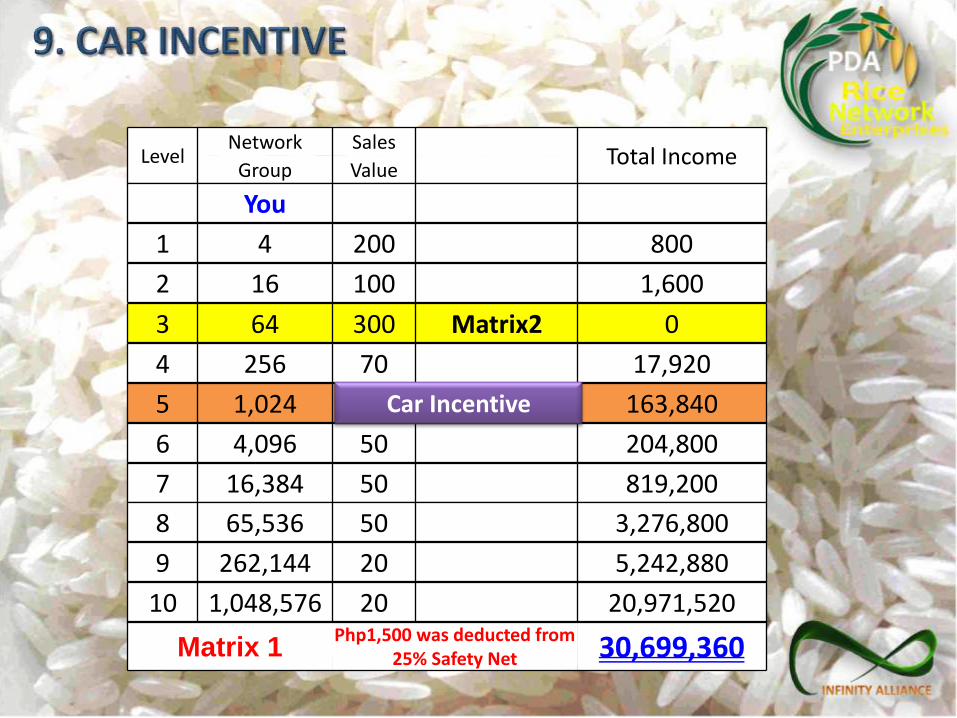
LevelNetwork Sales
Total IncomeGroup Value
You
1 4 200 800
2 16 100 1,600
3 64 300 Matrix2 0
4 256 70 17,920
5 1,024 163,840
6 4,096 50 204,800
7 16,384 50 819,200
8 65,536 50 3,276,800
9 262,144 20 5,242,880
10 1,048,576 20 20,971,520
Matrix 1Php1,500 was deducted from
25% Safety Net 30,699,360
Car Incentive
LevelNetwork Sales
Total IncomeGroup Value
You
1 4 2500 10,000
2 16 Matrix3 0
3 64 750 48,000
4 256 450 115,200
5 1,024 400 409,600
6 4,096 225 921,200
7 16,384 225 3,686,400
8 65,536 125 8,192,000
9 262,144 100 26,214,400
10 1,048,576 100 104,857,600
Matrix 2
3293
4091,4345,734
16,38469,905
279,620
Free Spill Over
By Company
144,608,400

Your decision and action today spells your success tomorrow

Realize your dreamsYour decision and action today spells your success tomorrow
